c copyright 2014 american society of civil engineers ...eprints.qut.edu.au/78436/1/jupd_pdf.pdf59...
TRANSCRIPT

This is the author’s version of a work that was submitted/accepted for pub-lication in the following source:
Thompson, Neil & Yang, Jay(2015)Developing affordable and sustainable housing through energy, transport,and building utility integration.Journal of Urban Planning and Development, 141(4), 04014037-1-04014037-11.
This file was downloaded from: https://eprints.qut.edu.au/78436/
c© Copyright 2014 American Society of Civil Engineers
Notice: Changes introduced as a result of publishing processes such ascopy-editing and formatting may not be reflected in this document. For adefinitive version of this work, please refer to the published source:
https://doi.org/10.1061/(ASCE)UP.1943-5444.0000244

Developing affordable and sustainable housing through energy, 1 transport and building utility integration 2
____________________________________________________________ 3
ABSTRACT 4
Housing affordability and sustainable development are not polarised ideologies as both are necessary 5 with increasing urbanisation. We must bridge the gap between current median house pricing and target 6 affordable house pricing whilst pursuing sustainability. This paper examines the potential of initial 7 construction cost and ongoing utilities and transport cost reduction through the integration of sustainable 8 housing design and transit oriented development principles in a Commuter Energy and Building Utilities 9 System (CEBUS). It also introduces current research on the development of a Dynamic Simulation Model 10 for CEBUS applications in the Australian property development and construction industry. 11
Introduction 12
Housing affordability is a worldwide concern. For example, recent research in the United Kingdom has 13 shown increasing housing prices in response to government intervention in financial markets designed to 14 fuel ongoing growth in the economy (Mulliner & Maliene, 2013). Research in the US has also 15 demonstrated a link between declining public health and increasing problems with housing affordability 16 (Pollack et al, 2010) whilst housing costs in Brazil have continued to increase despite over 20% of inner 17 city land area in Sao Paulo remaining vacant (Sperandelli et al, 2013). Currently, high prices in housing 18 markets around the world are set against a backdrop of continuing efforts in developing sustainable 19 housing through innovative designs, materials and systems. “Eco” homes aim to balance the issues of 20 climate change, resource use and quality of life (Prickett & Bicknell, 2009). Adaptive re-use of existing 21 buildings is being promoted as a means of reducing the use of new materials in sustainable housing 22 developments (Yung et al, 2013). However, few of these sustainable homes are available at or below 23 target affordability price points (HIA, 2012). 24
There has been extensive advocating for sustainable housing guidelines and planning schemes by 25 governments, professional associations and academia. Some have shown potential, such as transit 26 oriented development (TOD) whereby rail stations are located within pedestrian walking distance from 27 new housing developments (Zhao & Deng, 2013) together with greater use of higher density strata and 28 community title (S&CT) developments, which have reduced per capita energy consumption and carbon 29 emissions (Norman et al, 2006). However to date, the building industry has failed to deliver sufficient 30 stock of sustainable yet affordable housing as evidenced by the emergence of non-government housing 31 organisations such as “Habitat for Humanity”, who are actively working to provide clean, affordable and 32 sustainable housing for the estimated 100 million homeless people around the world (Habitat, 2010). At 33 the same time, utilisation of public transport has actually declined in many countries, including Canada, 34 the USA and Australia, to under 10% of the population. This has resulted in sharp increases in traffic 35 congestion, carbon emissions and household transport costs when compared with 1990 levels (Gipton, 36 2009). Increased investment in tollways and tunnels has actually increased car usage as a result of 37 improved average trip speeds thus further contributing to the decline in public transport patronage around 38 the world (Chen, 2013). 39
The issue of affordability is seen as a major barrier to increased uptake of sustainable housing 40 construction. Many assume sustainable housing is more expensive to execute when compared to 41 standard practices and that more sustainable options are therefore not financially viable (Pitt et al, 2009). 42 At the same time, the perception that sustainable transportation methods act to restrict personal mobility 43

is another major barrier to be overcome before we see an increased uptake of genuine sustainable 44 housing construction that incorporates sustainable transport methods (Delucchi & Kurani, 2013). 45
Accordingly, the property industry is seeking new development guides and frameworks which can 46 integrate affordability considerations with sustainability measures. They also need tools that can help turn 47 the conflicting demands of affordability, reduced environmental impact and improved mobility into 48 saleable housing stock for the mainstream market. This paper presents the interim results of a research 49 project aimed at identifying potential savings in up-front construction cost and ongoing utilities and 50 transport costs available through the integrated application of best practice in sustainable construction 51 and transit oriented development strategies. It identifies the knowledge gaps in current research on 52 affordable and sustainable housing development methods. A case study methodology is used to explore 53 and develop the necessary ingredients of a pilot Commuter Energy and Building Utilities System 54 (CEBUS), which will assist in providing a balance between housing affordability and sustainability. A 55 Dynamic Simulation Model and a conceptual framework are brought forward using data from survey of 56 strata and community title development residents so as to guide in-depth interviews of industry 57 stakeholders as the next step in the research program. 58
Study of Related Literature 59
Rapid urbanisation in many parts of the world has pushed housing demand to new heights while the 60 ongoing Global Financial Crisis further jeopardises housing affordability. Table 1 shows the government 61 endorsed housing affordability threshold against household gross income (ULDA, 2009). In the December 62 quarter 2011, the median purchase price for houses in Brisbane, Australia reached A$499,000 (REIQ, 63 2012) against the average household gross income of A$61,730 (Payscale, 2012). This equates to a 64 multiple of gross income of 8 times compared with the 5 times maximum in Table 1. 65
Table1: ULDA Household Gross Income and Affordable Housing Thresholds 66
As the first research step, a desktop review on housing development, market pricing issues and 67 sustainability based design and construction was carried out. The focus was on identifying those 68 elements that can potentially provide reductions in initial construction cost and life cycle operating costs 69 without jeopardising environmental and social outcomes. 70
Sustainable housing design uses a wide range of passive and active design principles and practices to 71 improve environmental and social aspects. For example, significant life cycle cost benefits can be 72 achieved through strong passive building design (Chaturvedi, 2008). Research into the impact of best 73 practice passive design using cross-ventilation has shown a reduction in energy usage of 50% when 74 compared with standard per capita energy usage (Miller, 2007). Development of district scale 75 “microclimates” has also contributed to improved urban comfort without the need for active cooling 76 systems (Triantis et al, 2011). “Green urbanism” is another sustainable design concept that has been 77 developed to combat rapid urban growth through the move towards closed-loop, rather than linear, 78 utilities infrastructure metabolisms for housing estates (Codoban & Kennedy, 2008). Examples such as 79 integrated rainwater harvesting and stormwater management systems have provided capital cost savings 80 of up to 50% and ongoing potable water operating cost reductions of up to 75% (Reidy, 2008). In Europe, 81 study of closed loop design philosophies was undertaken at developments such as “EVA Lanxmeer” at 82 Culemborg in The Netherlands. The interconnection of different city cycles, such as sanitation, energy 83 and food production, has demonstrated how the built environment can act as a “parasite” to harvest 84 effluent to create low cost energy for the inhabitants and fertilizer for growing crops. (Timmeren & Sidler, 85 2007). Decision support systems have also been developed to assist with the design and costing of 86 municipal “green” infrastructure using closed-loop design principles for urban agriculture projects on 87 vacant public land so as to reduce up-front and life cycle costs of food production (Kirnbauer & Baetz, 88

2014). Accordingly, passive and closed loop design was nominated as the first key element of a proposed 89 new sustainable development model that offers both construction and life cycle operating cost reductions 90 with improved environmental outcomes. 91
Additional first capital and life cycle cost benefits are possible through the use of virtual design 92 technologies. These allow housing designers to develop and test building solutions with confidence in 93 building constructability and long term operational performance (Bailey & Brodkin, 2008). Information and 94 Communication Technology (ICT) has improved construction industry productivity, bridged gaps in 95 communication between stakeholders and encouraged the implementation of new processes resulting in 96 reductions of up to 25% in design time (Isaa et al, 2007). Furthermore, use of ICT has enabled planners 97 to assess the social and environmental impacts of various sustainable design options at the regional level 98 in order to help develop protected areas between cities (Wang et al, 2013). This Building Information 99 Modelling (BIM) process allows project teams to quickly and accurately assess green building credentials 100 for various material, equipment and systems selections (Barnes, 2009). Additional initial construction cost 101 reductions are offered through linking BIM techniques to housing prefabrication. This involves 102 constructing housing structures and key sub-components in a controlled factory environment before 103 transferring them to their final destination for assembly. The benefits of off-site manufacturing (OSM) 104 include a reduction in embodied energy and material waste, together with reduced construction costs of 105 up to 12%, through improved constructability and reduced costs for major sub-components such as 106 heating, ventilation and air-conditioning (HVAC) systems (Meiling et al, 2012). The combination of BIM 107 and OSM was therefore nominated as the second key element of a proposed new sustainable 108 development model that offers both construction and life cycle operating cost reductions with improved 109 environmental outcomes and green building ratings. 110
Incorporating sustainable design principles into new homes and housing estates can also attract new 111 economic models to help reduce first capital and ongoing debt servicing costs. Density bonuses are 112 changes to a higher unit yield, whilst tax breaks/credits and/or direct financial grants can be provided to 113 developers in return for achievement of a minimum specification sustainability rating. Research into 114 factors that have led to an increase in sustainable housing development in the US has shown that these 115 economic incentives are the main determinants for government regulators to consider in trying to 116 encourage more affordable and sustainable housing development (Sauer, 2009). Increased use of 117 distributed utility systems in accordance with “green urbanism” principles, such as combined rainwater 118 harvesting and stormwater management systems, has also provided opportunities for deployment of the 119 Design, Build, Operate and Maintain (DBOM) method of project delivery and financing. A single contract 120 is awarded for the design, construction, operation and maintenance of discrete items of utility plant in 121 return for a defined user-pays fee over a fixed period (Dahl et al, 2005). Strata and community title 122 developments have also demonstrated the ability of the body corporate to establish a “user pays” system 123 based on DBOM contracts to recover the cost of capital equipment over its economic service life, rather 124 than having the entire cost of the equipment paid for up-front by the developer / first home owner. This 125 mechanism has been used by developers to remove capital equipment purchase costs from the home’s 126 selling price for items such as hot water systems, air-conditioning, water treatment systems, electrical 127 switchboards and utility meters (Warnken, 2009). It has also been utilised by municipalities to help 128 remove the capital cost burden of major public transport infrastructure from tax payers and transfer the 129 costs to the end-users of the transport system (Warren & Kunczynski, 2000). The resultant reduction of 130 up-front land and utilities and transport infrastructure cost per house provided by these financial 131 incentives and DBOM contracts can be combined with the preceding sustainable design principles to 132 provide further reduction in initial construction cost for new housing developments, hence they were 133 nominated as the third key element of a proposed new sustainable development model that offers both 134 construction and life cycle operating cost reductions with improved environmental outcomes. 135

Research into the benefits of locating new housing estates close to public transport nodes using the 136 transit oriented development strategy has shown potential for reduced costs in personal transport of up to 137 75% (Rat, 2002). Studies conducted in major international cities including New York, London, Paris, 138 Munich and Tokyo have demonstrated that public transport utilisation is positively correlated with 139 increases in urban density. This study supports current international best practice of using higher density 140 residential strata and community title schemes for the development / redevelopment of cities as a means 141 of increasing public transport patronage (Wang, 2006). By locating new developments near public 142 transport nodes, developers are typically offered a reduction in car parking requirements per occupant 143 which in turn provides for improved yield and a resultant reduction in the land cost per house (City of 144 Fremantle, 2011). Study of low-income housing programs has also shown that proximity to mass public 145 transport schemes is a key determinant of the likely success of such programs (Duarte & Ultramari, 146 2012). Accordingly, the Transit Oriented Development strategy was nominated as the fourth key element 147 of a proposed new sustainable development model that offers both construction and life cycle operating 148 cost reductions with improved environmental outcomes. 149
One of the key life cycle cost benefits observed in strata and community title developments is the ability of 150 the body corporate to purchase and on-supply services to both the common areas of the community and 151 individual residents. These services have ranged from provision of utilities such as electricity, gas, water 152 and broadband communications through to maintenance of the grounds or provision of a community 153 recreation centre. By aggregating demand for these services across the entire community, savings of at 154 least 20% have been achieved when compared with direct provision of the same services to individual 155 residents and owners in common (Tucker, 2004). Use of advanced modelling tools designed to deal with 156 the uncertainty of community scale utilities systems has also enabled a reduction in up-front capital costs 157 for utilities infrastructure which has translated to lower capital cost per house (Lin et al, 2010). This 158 demand aggregation model has also provided transport services via community owned boats in coastal 159 developments and community owned shuttle vehicles at strata resorts, industrial parks and retirement 160 villages. The resident manager or volunteer driver assists residents, guests and staff with airport transfers 161 and connection with public transport nodes. This concept of community vehicle pooling and/or sharing 162 has successfully demonstrated a reduction in private vehicle ownership costs for residents at The 163 Waterfront strata and community title development in Sydney, Australia (The Waterfront, 2010). The 164 resultant reduction in personal utilities and transport costs offered through utilities and transport demand 165 aggregation can be combined with preceding sustainable design principles such as DBOM contracts for 166 utilities and transport infrastructure to provide further reduction in initial construction cost for new housing 167 developments, hence it was nominated as the fifth key element of a proposed new sustainable 168 development model that offers both construction and life cycle operating cost reductions with improved 169 social outcomes. 170
The integration of technologies such as building power systems and sustainable transport equipment 171 using hydrogen fuel cells has also reduced household utilities and personal transport costs. The Honda 172 Clarity vehicle is powered by hydrogen gas which is converted into electricity to drive electric motors with 173 zero emissions. A “Home Energy Station” uses sunlight to produce hydrogen for the Clarity vehicle from 174 rain water with surplus hydrogen being used in a stationary fuel cell to produce electricity and hot water 175 for the home (AHMCI, 2009). Another example of such technology integration is The Hammarby Sjostad 176 development in Sweden which consists of 11,000 apartments and 35,000 work places with 25,000 177 inhabitants, where the wastewater system collects biosolids to produce biogas for home heating, cooking 178 and powering local compressed biogas shuttle buses and car pool vehicles. Approximately one third of 179 the town’s residents are members of the car pool which is booked via the internet and supplemented by 180 public transport options such as tram, bus and water taxi. Hammarby is used as the model example of the 181 Swedish “SymbioCity” concept which promotes holistic and sustainable urban development through 182 finding synergies in urban functions and unlocking their efficiency and profitability (Kenter, 2007). The 183

final example of the Fairfield Multi-Modal Transportation (MMT) Centre in the USA has solar photovoltaic 184 (PV) panels on the façade to assist with building energy use whilst providing charging facilities for private 185 and community owned electric vehicles and acting as a node for public bus services. The MMT concept is 186 based on commuters taking their battery electric vehicle (BEV) from home to the centre where they can 187 then take the public bus service to work whilst their vehicles are recharged from the solar PV system 188 during the day (McDonald, 2009). Recent recognition of the fact that total building energy efficiency 189 should be measured across both stationary and motive power metrics supports the use of such integrated 190 technologies (Weigel, 2014). These integrated technologies can be combined with the preceding 191 sustainable design principles such as transit oriented development strategies to provide further reduction 192 in initial construction cost for new housing developments, hence they were nominated as the sixth and 193 final key element of a proposed new sustainable development model that offers both construction and life 194 cycle operating cost reductions with improved social and environmental outcomes. 195
196
Criteria and Challenges of Developing Integrated Commuter Energy and Building Utilities Systems 197 198
The Integrated Project Delivery (IPD) method provides the opportunity to design, build and operate new 199 housing facilities as cost-effectively as possible through formation of collaborative and productive teams 200 from all sections of the design and construction supply chain (AIA, 2007). This integrated development 201 approach also allows for community attitudes and environmental conditions to be considered as part of 202 the overall design optimisation process (Mani et al, 2005). At the same time, “lean” construction methods 203 using value stream mapping (VSM) techniques have been used to support the IPD method by reducing 204 design waste and delivering first capital cost savings of up to 18% (Goldstein, 2003). These combined 205 methods were therefore suggested as the central control mechanism for combining each of the preceding 206 individual best practice sustainable design elements in order to provide a new integrated sustainable 207 development model as shown in the concept diagram in Figure 1. This model may reduce initial 208 construction cost and ongoing utilities and personal transport operating costs and potentially bridge the 209 gap between current median house pricing and affordable housing price targets as detailed in Table 1. 210
211 212
213
214
215
216
217
218
219
220
221
222
223
Integrated
technologies
Passive and closed loop
design Building information
modelling and off-site
manufacture
Utilities and transport demand
aggregation
Transit oriented development
strategy
Financial incentives and
DBOM contracts
Integrated Project Delivery and Value Stream
Mapping

224
225
Figure 1. A new integrated sustainable development model 226
This proposed integrated development model was then applied to the local median house price example 227 of A$ 499,000 using a typical “green” finance rate, together with typical annual personal utilities and 228 transport expenditure, in order to quantify the potential savings results. A typical twenty (20) year “green” 229 loan interest rate of 5.5% (Bendigo Bank, 2013) was applied to the average South East Queensland 230 household utilities spend of A$1900 pa (Miller, 2007) and average personal transport spend of A$4500 pa 231 (Travel Smart, 2010) to derive the net present value (NPV) of the potential savings offered by the 232 proposed integrated sustainable development model, which are detailed in Table 2: 233
Table 2: Total effective first capital cost saving from the proposed integrated development model 234 235
This means that integration of current best practice sustainable design elements as detailed in the 236 preceding literature review can potentially assist with the provision of affordable housing for household 237 gross incomes in the upper band as shown in Table 1 through a theoretical 35% reduction of the 238 $499,000 median house price to a $321,908 effective first capital cost. Further research is, however, 239 required in order to identify new integrated design methods to help deliver affordable and sustainable 240 housing at the $203,00 to $251,000 price points from Table 1 as required for the lower and medium 241 income bands respectively. Accordingly, a visual representation of previous local and international 242 research into affordable and sustainable housing development was then prepared as shown in Figure 2 243 which highlighted current knowledge gaps as potential focus areas for the next stage of the research 244 program. 245

246
247
Figure 2. Indicators of previous research in affordable and sustainable housing 248
This chart highlighted that there has been no study in the Australian context of integrated technologies 249 such as integrated building utility and transport energy systems (Commuter Energy and Building Utilities 250 System or CEBUS) as a possible means of contributing to the development of affordable and sustainable 251 housing. This was therefore proposed as the focus area for the next stage of the research program based 252 on the following questions: 253
• Can integrated building utility and transport energy systems (CEBUS) contribute to affordable 254 sustainable housing development in South East Queensland and; 255
• How can this contribution be tested and verified? 256 257 A further critical document study of key design elements related to the proposed CEBUS method was 258 then undertaken covering the following topics: 259 260
- building integrated renewable energy generation systems; 261 - renewable energy based transport systems; 262
0
2
4
6
8
10
12
14
16
18
Total previous research
Local previous research

- software for renewable energy system design and transport survey; 263 - best practice in community vehicle sharing and/or pooling schemes and; 264 - potential regulatory barriers to uptake of the proposed CEBUS method. 265
266 Building integrated renewable energy generation systems 267
Active building integrated renewable energy generation systems such as solar PV arrays, solar hydrogen 268 fuel cells and biogas generators offer both life cycle cost and environmental benefits: 269
- Solar PV arrays generate electricity through exposure to sunlight with very little aversive 270 environmental effects such as pollution or waste. Current increases in solar PV cell efficiency of 271 over 40%, together with reduced manufacturing costs, thin film PV polymers for glazing or roofing 272 integration and rapidly increasing grid electricity costs, have resulted in increasing application of 273 this technology in the housing industry (Bullis,2008); 274
- Solar hydrogen fuel cells use solar PV to electrolyse water into hydrogen, which can then be 275 stored and used when required, unlike solar PV which is available during sun hours only. The 276 stored hydrogen is then fed into a stationary fuel cell which creates electricity and hot water as a 277 by-product (Manley & Rose, 2009); 278
- Use of household effluent, green waste and food scraps to produce biogas is emerging as 279 another possible solution for the provision of building integrated renewable energy generation 280 systems. A compact biodigester unit generates biogas which is then used directly for cooking and 281 to supply small scale reciprocating engine generators which produce electricity for light and 282 power, together with hot water and cool air via absorption chillers (Lampe et al, 2009). 283
In each of these examples, the comparative cost with coal based grid electricity is drastically improved if a 284 cost is assigned to carbon emissions either via a direct tax or an emissions trading scheme. The 285 equivalent cents/kWh cost of electricity generated from solar PV, fuel cell or biodigester systems may 286 approach grid parity under these circumstances. (McKinsey & Company, 2008). 287
A summary of the typical maximum payback period, when compared with coal based grid electricity and 288 the relative greenhouse gas (GHG) intensity for each of these preceding building integrated renewable 289 energy generation systems, is shown in Table 3 (Newton & Tucker, 2009): 290
291
Table 3 Maximum payback period and relative GHG intensity for building integrated renewable energy 292 systems 293 294
Table 3 highlights the fact that from both an economic and environmental viewpoint, the biodigester 295 based CEBUS would appear to be the best option when compared with the solar PV and solar hydrogen 296 fuel cell types. 297
Renewable energy based transport systems 298
Renewable energy based transport systems such as the battery electric vehicle (BEV), the fuel cell 299 vehicle (FCV) and the compressed biogas vehicle (CBV) have also been highlighted as a possible way to 300 help reduce personal transport costs and carbon emissions: 301
- The battery electric vehicle sources all of its energy from on-board electricity and is charged from 302 the mains grid using renewable power where possible. The battery electric vehicle requires a 303

significant trade-off between cost and range, with a typical 160 km range being the ideal from 304 both a weight and cost perspective (Nissan, 2009). 305
- The fuel cell vehicle uses a proton exchange membrane (PEM) fuel-cell system to power an 306 electric motor in a series hybrid configuration. The battery characteristics are based on the same 307 high power lithium-ion battery used for conventional hybrid vehicles. On board hydrogen storage 308 is achieved via solid, chemical or gaseous means and can be sourced from solar PV electrolysed 309 rain water (Toyota, 2009). 310
- The compressed biogas vehicle uses a modified internal combustion engine (ICE) that operates 311 on biogas produced by household effluent, green waste and food scraps feeding a compact 312 biodigester unit assuming a typical daily black water production rate of 50 litres per capita and a 313 typical dwelling population density of 2.5 persons per unit (Rajendran, 2012). 314
A summary of the first capital cost and greenhouse gas intensity relative to internal combustion engine 315 vehicles for each of the preceding renewable energy based personal transport options is shown in Table 316 4 (Bandivadekar et al, 2008): 317
Table 4 Relative cost and GHG intensity for personal renewable transport systems relative to 318 conventional ICE’s 319 320
Table 4 highlights the fact that from both an economic and environmental viewpoint, the compressed 321 biogas vehicle based CEBUS appears to be the best option when compared with the battery electric 322 vehicle and fuel cell vehicle types noting that the greenhouse gas intensity of these types is determined 323 by the source of electricity used to charge the vehicle in the case of the battery electric vehicle or 324 electrolyse water to create hydrogen in the case of the fuel cell vehicle. If coal based grid electricity is 325 used in either of these scenarios then the compressed biogas vehicle based CEBUS remains the best 326 option. If lower greenhouse gas intensity renewable energy is used for either of these scenarios then this 327 relativity will change. 328
Software for renewable energy system design and transport survey 329
A detailed review of energy simulation software, available both commercially and via previous academic 330 research projects, was then conducted for solar PV, biogas and hydrogen based renewable power 331 generation systems, together with transport engineering software for survey of rail and bus commuter 332 vehicle usage and costs as shown in Table 5 so as to help to identify the “building blocks” available for 333 development of a Dynamic Simulation Model for testing the potential savings available from the proposed 334 CEBUS method : 335
Table 5 Renewable energy simulation and transport survey software availability 336 337 338
Table 5 highlights the fact that there is a wide range of readily available software for developing the 339 CEBUS Dynamic Simulation Model together with a range of transport survey software that can be utilised 340 for capturing and analysing commuter trip data during the proposed strata and community title 341 development CEBUS test phase of the research. 342
Best practice in community vehicle pooling and share schemes 343
Urban congestion has been cited as one of the major social and economic issues in cities around the 344 world as a result of continued urbanisation. An integrated approach to solving congestion has been 345

recommended, based on complementary actions between government, business, public transport 346 commuters and road users (Schrank et al, 2010). 347
Carpooling represents one of many possible alternatives to single occupancy vehicle use for travel to 348 work, school or public transport nodes. Recent study of carpool formation in Canada has suggested the 349 following best practice elements (Buliung et al, 2009): 350
• A web based application is required to facilitate connection between potential car poolers 351 • The regional transport planning authority needs to coordinate the carpool scheme 352 • Interface of carpool participants with the local public transport system needs to be maximised 353 • Carpool time matches need to be optimised by postcode for ease of use 354 • Flexibility needs to be built-in for variable commuting patterns at the home-end of work travel 355
356 By following these best practice elements the carpooling uptake has reached 10% with reported benefits 357 including an increased sense of community amongst participants. Other studies have shown that 358 carpooling is particularly attractive for lower income bands and female employees who are concerned 359 about poor security on public transport options (Zhou, 2013). 360 361 Another possible alternative to single occupancy vehicle use for travel to work or school is car sharing, 362 which is an alternate system of car ownership, access and use as follows (ThinkingTransport, 2010): 363
• Private companies offer paid membership which allows people to take and use a number of 364 vehicles when and as needed 365
• These self-service cars are available twenty four hours a day and are typically distributed over a 366 wide urban area 367
• Employer hosted schemes using on-site vehicles have been found to work better than municipal 368 schemes which typically use on-street vehicles (Collura, 1994) 369
370 Accordingly, the use of these best practice carpooling and/or car sharing strategies, in conjunction with 371 the preceding renewable energy based building power and transport systems as part of the proposed 372 CEBUS method, may help to further reduce personal transport costs, thus improving the affordability of 373 new housing developments, whilst at the same time reducing greenhouse gas emissions and improving 374 social outcomes via reduced traffic congestion. 375
376
Potential regulatory barriers to CEBUS uptake 377
Strata and community title developments appear to represent strong potential for deployment of CEBUS 378 because there is an extant legislative framework that supports the governance and management of such 379 systems in all Australian states and territories. The uptake of CEBUS within these communities may 380 however be impeded by various government regulations. Accordingly, a review of the regulatory 381 framework surrounding the proposed operation of CEBUS was undertaken as shown in Table 6 in order 382 to help guide the required compliance for the proposed strata and community title development test site: 383
Table 6 Regulatory framework related to CEBUS operation 384 385
Table 6 highlights the fact that a clear set of Federal and State regulations exist for each CEBUS type to 386 comply with hence there appears to be no initial regulatory barriers to the proposed deployment of a 387 CEBUS test at a local strata and community title development. 388

Research Method and Development 389
Following completion of the initial desktop research and document study, further investigation was then 390 undertaken to develop a suitable research methodology so as to ensure coherence and complementarity 391 between: 392
- the affordable and sustainable housing problem facing the construction industry; 393 - the hypothesis regarding potential contribution of the CEBUS model; and 394 - the findings of previous research that support and inform this model (Fellows & Liu, 2008). 395
396 The first consideration in the research methodology development process was the context in which the 397 proposed research will take place. The fact that the researcher’s interests, expertise and experience have 398 contributed to the identification of the research problem and formulation of a hypothesis will impact on the 399 proposed work and its results as will the very fact that research is being carried out (Popper, 1989). 400
Next, due consideration was given to environmental variables which may influence the research results 401 through impact on recorded data together with subject variables – dependent, independent and 402 intervening - associated with the topic of study. This helped to guide design of the research 403 methodologies so as to isolate the dependent variables from the environmental or contextual variables as 404 shown (Baron & Kenny, 1986). 405
Having considered the context in which the proposed research is to take place together with the 406 environmental variables, the issue of objectivity, being, “the degree to which different observers or judges 407 are able to record the data in the same manner” was considered next. This ensured that the data is not 408 substantially influenced by the subjectivity of the observer (Drenth, 1998). 409
A review of historical antecedents to the development of knowledge also guided the research 410 methodology development process, calling on Aristotle’s inductive-deductive method in which scientific 411 explanation is defined as a transition from knowledge of a fact to knowledge of the reasons for the fact 412 (Losee, 1993). 413
A final consideration in the research methodology development process was recognition of the current 414 construction industry paradigm that sustainable housing development cannot be achieved in parallel with 415 affordable housing development. It was therefore recognized that the proposed research methodology 416 must ensure independence from this prevailing theoretical framework, so as to allow for original 417 contribution to knowledge and a potential paradigm shift (Kuhn, 1996). 418
Next, specific research methods were considered, commencing with a review of successful empirical 419 research methods used in construction industry research, which highlighted case studies, simulation, 420 stochastic modeling, participant observation and experiments as the methods of choice for this research 421 project (Remenyi et al, 1998). 422
Previous local research conducted in the strata and community title industry on managing major repairs 423 and utilisation of decentralised water management systems, also recommended that a mix of on-line 424 surveys and in-depth stakeholder interviews be employed in this research project (Easthope et al, 2009). 425
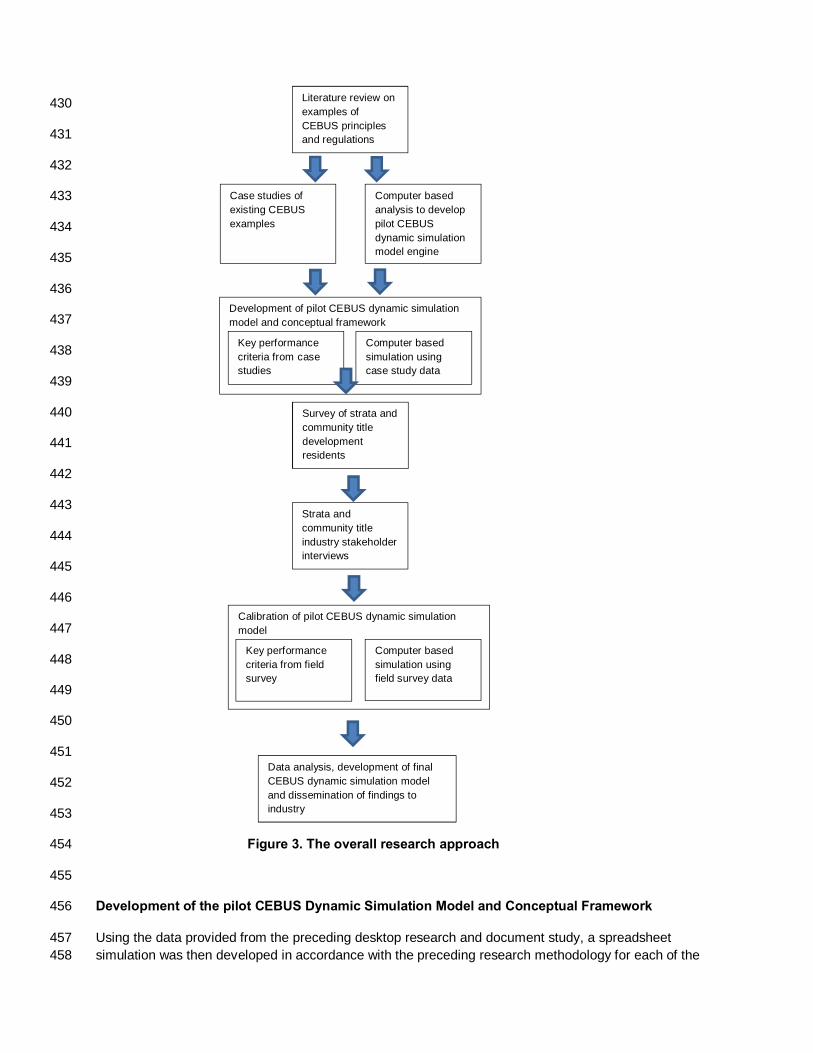
Based on the study of research methodologies and research planning, the overall research approach was 426 developed as shown in Figure 3. 427
428
429
430
431
432
433
434
435
436
437
438
439
440
441
442
443
444
445
446
447
448
449
450
451
452
453
Figure 3. The overall research approach 454
455
Development of the pilot CEBUS Dynamic Simulation Model and Conceptual Framework 456
Using the data provided from the preceding desktop research and document study, a spreadsheet 457 simulation was then developed in accordance with the preceding research methodology for each of the 458
Literature review on examples of CEBUS principles and regulations
Case studies of existing CEBUS examples
Computer based analysis to develop pilot CEBUS dynamic simulation model engine
Development of pilot CEBUS dynamic simulation model and conceptual framework
Strata and community title industry stakeholder interviews
Survey of strata and community title development residents
Calibration of pilot CEBUS dynamic simulation model
Data analysis, development of final CEBUS dynamic simulation model and dissemination of findings to industry
Key performance criteria from case studies
Computer based simulation using case study data
Key performance criteria from field survey
Computer based simulation using field survey data

renewable fuel and vehicle types as shown in the solar PV / battery electric vehicle example in Table 7 459 which provides the “engine” for the pilot CEBUS Dynamic Simulation Model: 460
Table 7. Dynamic Simulation Model for the Solar PV / battery electric vehicle CEBUS type 461
462
Mean data for the key data input variables was then collected from the on-line survey of residents from a 463 representative sample of the 690 known strata and community title developments in the Brisbane urban 464 and peri-urban areas which have been identified as being in “mortgage stress” and “oil dependent” 465 (Dodson & Sipe, 2008) together with having congested car parking at local public transport nodes 466 (Translink, 2010). This data was then combined with data from relevant local meteorology, vehicle 467 manufacturer and banking web sites for entry into the pilot CEBUS Dynamic Simulation Model to 468 generate utilities and personal transport cost comparison graphs for review in the subsequent data 469 analysis section. It should be noted that this initial model was calibrated for strata and community title 470 developments in the South East Queensland region only and is therefore limited for use in comparing 471 CEBUS design options for this particular housing type in this specific region for the purpose of this study. 472
Based on review of the pilot CEBUS Dynamic Simulation Model key data input variables and the resultant 473 key performance criteria outputs in Figure 4, the initial CEBUS Conceptual Framework was then 474 developed using the following three key design criteria: 475
- Strata and community title development type ie low, medium or high density with low density 476 defined as single storey with up to 15 dwellings per hectare, medium density defined as up to 477 three storey walk-up, without a lift, with up to 80 dwellings per hectare and high density as 478 greater than three storey, with a lift and greater than 80 dwellings per hectare (Newton & 479 Tucker, 2009). This has a direct influence on the common area power and hot water usage 480 together with the number of residents who are likely to participate in the proposed public 481 transport node carpool scheme; 482
- Utilities type ie solar PV, biogas or hydrogen. This is determined by the availability of roof area, 483 quality of effluent, local rainfall and sun hours which need to be balanced against forecast 484 demand for the public transport node carpool scheme seats and common area power and hot 485 water usage, so as to minimise the cost for common area hot water in $/litre and common area 486 electricity in $/kWh; 487
- Vehicle type ie battery electric vehicle, compressed biogas vehicle or fuel cell vehicle together 488 with the number of seats, which will be determined by the utilities type and also forecast 489 demand for the public transport node carpool scheme, in order to provide the lowest possible 490 $/km cost for commuters using the scheme. 491
Simple line diagrams were also produced for each of the renewable fuel and vehicle types, as shown in 492 the biogas / compressed biogas vehicle example in Figure 4, in order to illustrate the fundamental 493 operating principles of each CEBUS type: 494
495
496
497
498
WC

499
500
501
502
503
504
Figure 4. Line diagram for biogas / compressed biogas vehicle CEBUS type 505
506
Survey of Strata and Community Title Development Residents 507
The next step in the research program involved an on-line survey of strata and community title 508 development residents in order to quantify their current utilities and transport costs and usage whilst 509 seeking their opinions on the likely uptake of and potential operational problems associated with 510 deployment of a CEBUS strategy within their strata community. The survey responses are summarised in 511 Table 8: 512
Table 8 Responses from survey of strata and community title development residents 513 514
Data Analysis and Preliminary Findings 515
The mean data from the strata and community title residents survey was then used to populate the 516 Dynamic Simulation Model for each CEBUS type in order to generate the potential utilities and personal 517 transport cost savings / increases graphs as shown in Figures 5 to 7: 518
519
Figure 5. Cost of eletricity 520
The data in Figure 5 shows that the mean cost for electricity in the sample from the population of strata 521 and community title developments is $0.20/kWh whilst both the solar PV / battery electric vehicle and 522 solar PV hydrogen / fuel cell vehicle CEBUS types offer a lower electricity cost of $0.10/kWh. 523
0%20%40%60%80%
<0.15 0.15 to 0.25 > 0.25
% o
f ree
spon
dent
s
Cost of apartment electricity
Cost of electricity to apartments
Solar PV / BEV& solar PV hydrogen / FCV @ $0.10/kWh
Biodigestersystem
Hot water system
Biogas compressor station
Compressed biogas pool car ($/km)
524
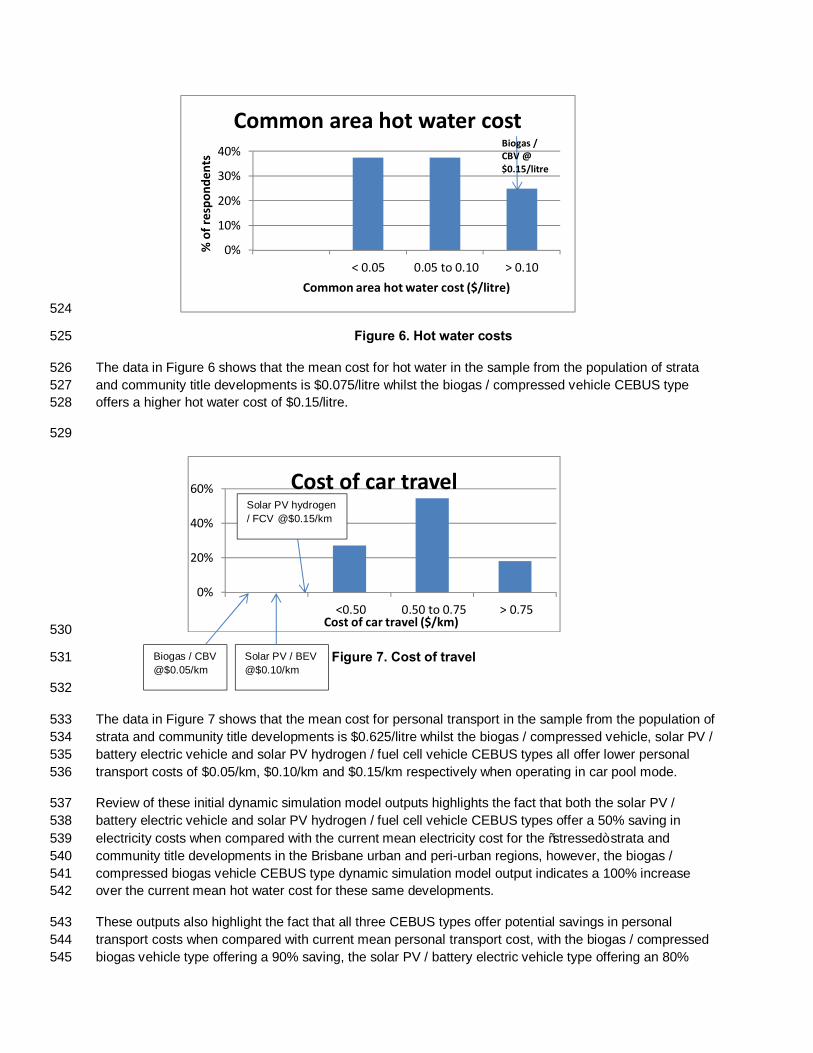
Figure 6. Hot water costs 525
The data in Figure 6 shows that the mean cost for hot water in the sample from the population of strata 526 and community title developments is $0.075/litre whilst the biogas / compressed vehicle CEBUS type 527 offers a higher hot water cost of $0.15/litre. 528
529
530
Figure 7. Cost of travel 531
532
The data in Figure 7 shows that the mean cost for personal transport in the sample from the population of 533 strata and community title developments is $0.625/litre whilst the biogas / compressed vehicle, solar PV / 534 battery electric vehicle and solar PV hydrogen / fuel cell vehicle CEBUS types all offer lower personal 535 transport costs of $0.05/km, $0.10/km and $0.15/km respectively when operating in car pool mode. 536
Review of these initial dynamic simulation model outputs highlights the fact that both the solar PV / 537 battery electric vehicle and solar PV hydrogen / fuel cell vehicle CEBUS types offer a 50% saving in 538 electricity costs when compared with the current mean electricity cost for the “stressed” strata and 539 community title developments in the Brisbane urban and peri-urban regions, however, the biogas / 540 compressed biogas vehicle CEBUS type dynamic simulation model output indicates a 100% increase 541 over the current mean hot water cost for these same developments. 542
These outputs also highlight the fact that all three CEBUS types offer potential savings in personal 543 transport costs when compared with current mean personal transport cost, with the biogas / compressed 544 biogas vehicle type offering a 90% saving, the solar PV / battery electric vehicle type offering an 80% 545
0%
10%
20%
30%
40%
< 0.05 0.05 to 0.10 > 0.10
% o
f res
pond
ents
Common area hot water cost ($/litre)
Common area hot water costBiogas / CBV @ $0.15/litre
0%
20%
40%
60%
<0.50 0.50 to 0.75 > 0.75Cost of car travel ($/km)
Cost of car travel
Biogas / CBV @$0.05/km
Solar PV / BEV @$0.10/km
Solar PV hydrogen / FCV @$0.15/km
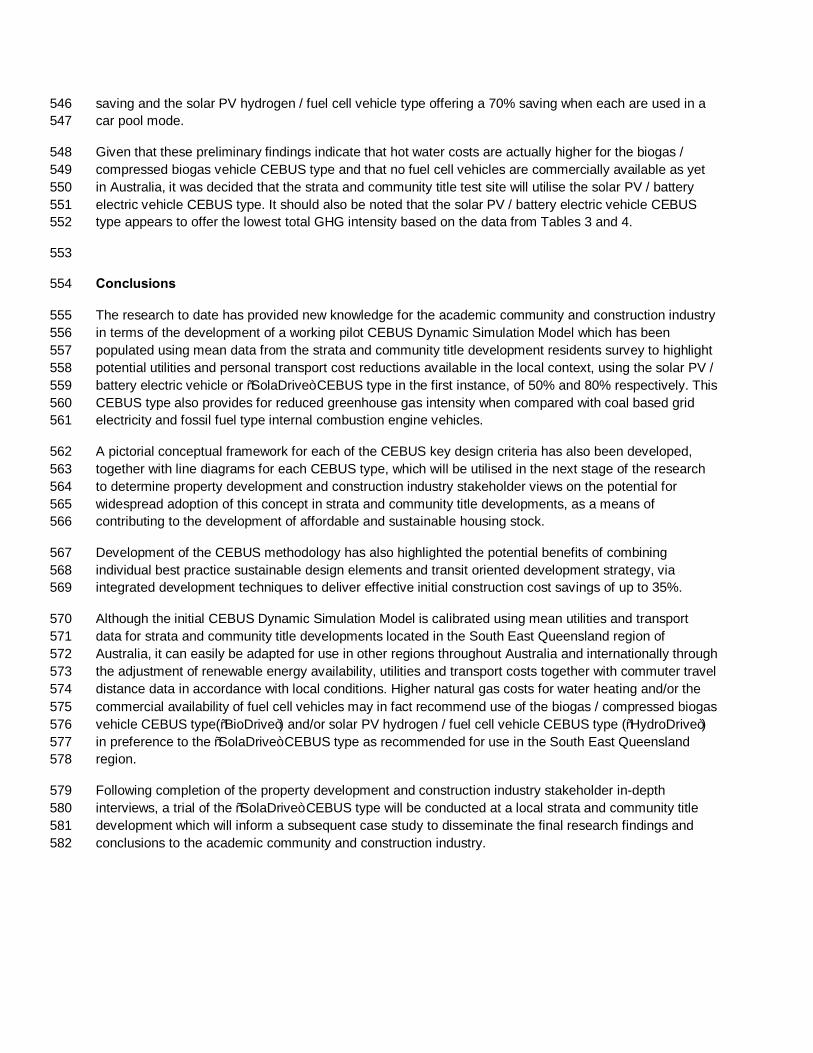
saving and the solar PV hydrogen / fuel cell vehicle type offering a 70% saving when each are used in a 546 car pool mode. 547
Given that these preliminary findings indicate that hot water costs are actually higher for the biogas / 548 compressed biogas vehicle CEBUS type and that no fuel cell vehicles are commercially available as yet 549 in Australia, it was decided that the strata and community title test site will utilise the solar PV / battery 550 electric vehicle CEBUS type. It should also be noted that the solar PV / battery electric vehicle CEBUS 551 type appears to offer the lowest total GHG intensity based on the data from Tables 3 and 4. 552
553
Conclusions 554
The research to date has provided new knowledge for the academic community and construction industry 555 in terms of the development of a working pilot CEBUS Dynamic Simulation Model which has been 556 populated using mean data from the strata and community title development residents survey to highlight 557 potential utilities and personal transport cost reductions available in the local context, using the solar PV / 558 battery electric vehicle or “SolaDrive” CEBUS type in the first instance, of 50% and 80% respectively. This 559 CEBUS type also provides for reduced greenhouse gas intensity when compared with coal based grid 560 electricity and fossil fuel type internal combustion engine vehicles. 561
A pictorial conceptual framework for each of the CEBUS key design criteria has also been developed, 562 together with line diagrams for each CEBUS type, which will be utilised in the next stage of the research 563 to determine property development and construction industry stakeholder views on the potential for 564 widespread adoption of this concept in strata and community title developments, as a means of 565 contributing to the development of affordable and sustainable housing stock. 566
Development of the CEBUS methodology has also highlighted the potential benefits of combining 567 individual best practice sustainable design elements and transit oriented development strategy, via 568 integrated development techniques to deliver effective initial construction cost savings of up to 35%. 569
Although the initial CEBUS Dynamic Simulation Model is calibrated using mean utilities and transport 570 data for strata and community title developments located in the South East Queensland region of 571 Australia, it can easily be adapted for use in other regions throughout Australia and internationally through 572 the adjustment of renewable energy availability, utilities and transport costs together with commuter travel 573 distance data in accordance with local conditions. Higher natural gas costs for water heating and/or the 574 commercial availability of fuel cell vehicles may in fact recommend use of the biogas / compressed biogas 575 vehicle CEBUS type(“BioDrive”) and/or solar PV hydrogen / fuel cell vehicle CEBUS type (“HydroDrive”) 576 in preference to the “SolaDrive” CEBUS type as recommended for use in the South East Queensland 577 region. 578
Following completion of the property development and construction industry stakeholder in-depth 579 interviews, a trial of the “SolaDrive” CEBUS type will be conducted at a local strata and community title 580 development which will inform a subsequent case study to disseminate the final research findings and 581 conclusions to the academic community and construction industry. 582

References 583
ADR 81/02 (2011) “Fuel Consumption Label for EV’s” retrieved 13 June 2011, from 584
http://comlaw.gov.au 585
AHMCI. (2009). "Home Energy Station." Retrieved 27 December 2009, 2009, from 586
http://automobiles.honda.com/fcx-clarity/home-energy-station.aspx. 587
AIA. (2009). "Integrated Project Delivery." Retrieved 27 December 2009, 2009, from 588 http://www.aia.org/contractdocs/aias077630 589
Akyuz, A., Coskun, C., Oktay, Z., Dincer, I. (2010) “Hydrogen production probability distributions for a PV-590
electrolyser system” International Journal of Hydrogen Energy, Accepted 26 November 2010. 591
AS1375 (2011) “Industrial Fuel Fired Appliances Code” retrieved 13 June 2011, from 592
http://standards.org.au 593
AS1547 (2000) “On-site domestic-wastewater management” retrieved 15 June 2011, from 594
http://standards.org.au 595
AS2739 (2011) “Natural Gas Fuel Systems for Vehicle Engines” retrieved 13 June 2011, from 596
http://rta.nsw.gov.au 597
AS4777 (2011) “Grid-connected inverters” retrieved 13 June 2011, from http://standards.org.au 598
AS5033 (2011) “Installation of photovoltaic arrays” retrieved 13 June 2011, from http://standards.org.au 599
Bailey, P., Brodkin, D. (2008). "The Virtual Building." The Arup Journal 42(2): 10. 600
Bandivadekar, A., Bodek, K., Cheah, L., Evans, C., Groode, T., Heywood, J., Kasseris, E., Kromer, M., 601
Weiss, M. (2008). On the Road in 2035: Reducing Transportation's Petroleum Consumption and GHG 602
Emissions, Massachusetts Institute of Technology. 603
Barnes, S. (2009). "BIM-enabled Integrated Optimisation Tool for LEED Decisions." Computing in Civil 604
Engineering 2009. 605
Baron, R.M., Kenny, D.A. (1986) “The moderator-mediator variable distinction in social psychological 606
research: conceptual, strategic and statistical considerations”, Journal of Personality and Social 607 Psychology 51(6): 1173. 608
Bendigo Bank. (2013). “Generation Green Loan.” Retrieved 16 November 2013, 2013, from 609
http://www.bendigobank.com.au/generationgreen/green_loans/generation_green_personal_loan.asp 610
Buliung, R., Soltys, K., Habel, C., Lanyon, R. (2009). "The Driving Factors Behind Successful Carpool 611 Formation and Use." Transporation Research Board Annual Meeting 2009 Paper. 612

Bullis, K. (2008). "Solar-Power Breakthrough." MIT Technology Review(July 2008): 1. 613
Chaturvedi, S. (2008). "Energy Efficiency And Sustainablility In Buildings." AEI 2008: Building Integration 614 Solutions. 615
Chen, D. and Wen, Y. (2013). “Effects of Freeway Mileage-Based Toll Scheme on the Short-Range 616
Driver’s Route Choice Behavior.” Journal of Urban Planning and Development , Ahead of Print 617
City of Fremantle. (2011). “Low Carbon City Plan.” Retrieved 24 November 2013, from 618
www.fremantle.wa.gov.au/files/...d2e9.../Low_Carbon_City_Plan_2 619
Codoban, N., Kennedy, C.A. (2008). "Metabolism of Neighbourhoods." Journal Of Urban Planning and 620
Development March 2008. 621
Collura, J. (1994). ”Evaluating Ride‐Sharing Programs: Massachusetts' Experience.” J. Urban Plann. 622
Dev., 120(1), 28–47. 623
Dahl, P., Horman,M., Pohlman, T., Pulaski, M. (2005). "Evaluating Design-Build-Operate- Maintain 624
Delivery As A Tool For Sustainability." Construction Research Congress 2005. 625
Delucchi, M. and Kurani, K. (2013). “How to Have Sustainable Transportation without Making People 626
Drive Less or Give Up Suburban Living.” Journal of Urban Planning and Development , Ahead of Print 627
DME. (2011). “Petroleum and Gas (Production and Safety Act) 2004” Retrieved 14 April 2011, from 628
http://www.dme.qld.gov.au 629
Dodson, J., Sipe, N. (2008). “Unsettling Suburbia: The New Landscape of Oil and Mortgage Vulnerability 630
in Australian Cities” Urban Research Program Research Paper 8, Griffith University 631
Drenth, P.J.D. (1998) Research in work and organizational psychology: principles and methods. 632 Handbook of Work and Organizational Psychology Vol.1, 2nd edn 633
Duarte, F. and Ultramari, C. (2012). ”Making Public Transport and Housing Match: Accomplishments and 634 Failures of Curitba’s BRT.” J. Urban Plann. Dev., 138(2), 183–194. 635
Easthope, H., Randolp, B., Judd, S. (2009). Managing Major Repairs in Residential Strata Developments 636 in New South Wales, The University of New South Wales 637
Fellows, R., Liu, A. (2008). Research Methods For Construction, Blackwell Publishing Limited. 638
Gipton, S. (2009). “Sustainable transport - are we there yet?” Greenfleet News. Melbourne, Greenfleet: 1. 639
Goldstein, J., Rosenblum, J. (2003). The costs and benefits of green affordable housing: Opportunities for 640
Action". Green CDCs Initiative. Massachusetts, Tellus Institute. 641
Habitat. (2010). "About Habitat For Humanity" Retrieved 10 October 2010, from 642
http://www.habitat.org/how/default.aspx 643
HIA. (2012). “HIA-CBA Affordability Report” Retrieved 6 June 2012, from 644
http://www.economics.hia.com.au 645
ISO 14687 (2011). "Hydrogen Fuel – Product Specification." Retrieved 13 June 2011, from 646
http://www.iso.org 647
Issa, M. H., Rankin, J.H., Christian, A.J. (2007). "Sustainability, Whole Life Costs, and Information and 648
Communication Technologies: A Review of Published Works." Computing in Engineering 2007: 478-485. 649
Kenter, P. (2007). "Canadian Biosolids Partnership seeks end solutions." Daily Commercial News and 650 Construction Record(August 24 2007): 1. 651
Kirnbauer, M. and Baetz, B. (2014). “Prototype Decision-Support System for Designing and Costing 652
Municipal Green Infrastructure.” Journal of Urban Planning and Development , Ahead of Print 653
Klise, G.T. & Stein, J.S. (2009) “Models Used to Assess the Performance of Photovoltaic Systems.” 654
Prepared by Sandia National Laboratories, Albuquerque, New Mexico, USA/ 655
Kuhn, T.S. (1996) The Structure of Scientific Revolutions, 3rd edn, Chicago, The University of Chicago 656
Press 657
Lampe, L. K., Adams, L.M., Jensen, D.G. (2009). "Water Supply and Energy Generation." World 658 Environmental and Water Resources Congress 2009. 659
Levinson, D. (2004) “Metropolitan Travel Survey Archive” Bureau of Transportation Statistics 31 August 660
2004. 661
Lin, Q., Huang, G., Huang, Y., and Zhang, X. (2010). ”Inexact Community-Scale Energy Systems 662
Planning Model.” J. Urban Plann. Dev., 136(3), 195–207. 663
Losee, J. (1993) A Historical Introduction to the Philosophy of Science, 3rd edn, Oxford, Opus. 664
Mani, M., Varghese, K., and Ganesh, L. (2005). ”Integrated Model Framework to Simulate Sustainability 665 of Human Settlements.” J. Urban Plann. Dev., 131(3), 147–158. 666
Manley, K., Rose, T. (2009). Innovative Practices in the Australian Built Environment Sector: An 667
Information Resource for Industry, Cooperative Research Centre for Construction Innovation. 668
McDonald, S. S. (2009). "Sustainability, PRT and Parking." Automated People Movers 2009. 669
McKinsey & Company (2008) An Australian Cost Curve for Greenhouse Gas Reduction, Sydney, 670
McKinsey Pacfic Rim Inc 671

Meiling, J., Backlund, F., Johnsson, H. (2012) "Managing for continuous improvement in off-site 672
construction: Evaluation of lean management principles", Engineering, Construction and Architectural 673
Management, Vol. 19 Iss: 2, pp.141 - 158 674
Miller, W. (2007). Kelvin Grove Urban Village Post-occupancy Energy Use Survey. Brisbane, Queensland 675 Sustainable Energy Industry Development Group (QSEIDG) C/- BEE: 54. 676
Mulliner, E. & Maliene, V. (2013). “Austerity and reform to affordable housing policy”, Journal of Housing 677
and the Built Environment, June 2013, Volume 28, Issue 2, pp. 397-407 678
Newton, P. W., Tucker, S.N. (2009). Hybrid Buildings: Pathways for greenhouse gas mitigation in the 679
housing sector. B. C. o. Victoria. Melbourne, Swinburne Institute for Social Research. 680
Nissan Global. (2009). "Nissan Leaf." Retrieved 27 December 2009, 2009, from http://www.nissan-681
global.com/EN/NISSAN/LEAF/ http://www.nissan-global.com/EN/NISSAN/LEAF/ 682
Norman, J., MacLean, H., and Kennedy, C. (2006). “Comparing High and Low Residential Density: Life-683
Cycle Analysis of Energy Use and Greenhouse Gas Emissions” J. Urban Plann. Dev., 132(1), 10–21 684
Payscale. (2012). “Median salary by city – Brisbane, Queensland” Retrieved 12 June 2012, from 685 http://www.payscale.com/research/AU/State=Queensland/Salary#by_City 686
Pitt, M. , Tucker, M. , Riley, M. , Longden, J. (2009) "Towards sustainable construction: promotion and 687
best practices", Construction Innovation: Information, Process, Management, Vol. 9 Iss: 2, pp.201 – 224 688
Popper, K.R. (1989) Conjectures and Refutations: The Growth of Scientific Knowledge, London, 689
Routledge 690
Pollack, C., Griffin, B., Lynch, J. (2010) "Housing affordability and health among homeowners and 691
renters", American Journal of Preventative Medicine, Vol. 39 Iss: 6, pp.515 – 521 692
Prickett, L., Bicknell, J. (2010) “LID, LEED and Alternative Rating Systems — Integrating Low Impact 693
Development Techniques with Green Building Design” 2010 International Low Impact Development 694
Conference 695
Queensland Water Supply Act (2008). "Water Supply Safety and Reliability Act” Retrieved 13 June 696 2011, from http://www.legislation.qld.gov.au 697
Rajendran, K.; Aslanzadeh, S.; Taherzadeh, M.J. Household Biogas Digesters—A Review. Energies 698 2012, 5, 2911-2942. 699
Rat, H. (2002). "Better Mobility For People Worldwide." Urban Public Transport 2002. 700

Reidy, P. C. (2008). "Integrating Rainwater Harvesting and Stormwater Management Infrastructure: 701
Double Benefit - Single Cost." 2008 International Low Impact Development Conference. 702
REIQ. (2012). “Qld Property Market Stabilises” Retrieved 12 June 2012, from 703
http://institute.reiq.com/REIQ/Media/2012Releases/Qld_property_market_stabilises.aspx 704
Remenyi, D., Williams, B., Money, A. & Swartz, E. (1998). Doing Research in Business and Management. 705
An introduction to Process and Method. London, Sage. 706
SAE J1772 (2011). "Charger Interface” retrieved 13 June 2011, from http://sae.org 707
Samer, M. (2010). “A Software Program for Planning and Designing Biogas Plants” American Society of 708 Agricultural and Biological Engineers. 53(4): 1277-1285. 709
Sauer, M. (2009). "Incentives For Green Residential Construction." Construction Research Congress 710
2009. 711
Shrank, D., Lomax, T., Turner, S. (2010). "2010 Urban Mobility Report." Texas Transportation Institute 712 December 2010. 713
Sperandelli, D., Dupas, F., and Dias Pons, N. (2013). “Dynamics of Urban Sprawl, Vacant Land, and 714
Green Spaces on the Metropolitan Fringe of São Paulo, Brazil.” Journal of Urban Planning and 715
Development , December 2013, Vol. 139, No. 4 : pp. 274-279 716
The Waterfront. (2010). "The Waterfront At Homebush Bay" Retrieved 10 October 2010, 2010 from 717
http://www.accesshomes.com.au/homebush-bay 718
Thinking Transport (2010) “Car Efficiency” Retrieved 14 May 2010 from 719
http://www.thinktransport.org.au/content/car-efficiency 720
Timmeran, A. & Sidler, D. (2007) “The Sustainable Implant”, Construction Innovation: Information, 721
Process, Management, Vol. 7 Iss:1, pp 22-37 722
Toyota Global. (2009). "Fuel Cell Vehicle." Retrieved 27 December 2009, 2009, from http://www.toyota-723
global.com/innovation/environmental_technology/fuelcell_vehicle 724
Translink (2010) 2009-10 Annual Report Retrieved 16 November 2010, 2010, from 725
http://www.translink.com.au/resources/about-translink/reporting-and-publications/2009-10-annual-726
report.pdf 727
Travel Smart (2010) “A Better Way To Go” Retrieved 16 November 2010, 2010, from 728
http://www.travelsmart.gov.au 729

Triantis, E., Tzouvadakis, J., Bougiatioti, F., Diamantidou, D., and Chryssicopoulos, G. (2011). “Urban 730
Microclimate Investigation of Major Squares in Athens.” Journal of Urban Planning and Development , 731
Ahead of Print 732
Tucker, L. (2004). Banking on Community Spirit. 733
ULDA. (2009). "Affordable Housing Strategy." from 734
http://www.ulda.qld.gov.au/_dbase_upl/ULDAAffHousingStratFINAL.pdf. 735
Wang, Y., Deng, X., Marcucci, D., and Le, Y. (2013). ”Sustainable Development Planning of Protected 736 Areas near Cities: Case Study in China.” J. Urban Plann. Dev., 139(2), 133–143. 737
Wang, Z. W. (2006). "Urban Development with Sustainable Public Transit Services." AATT 2006. 738
Warnken, J. (2009). Exploring the regulatory framework and governance of decentralised water 739
management systems: a strata and community title perspective. N. W. Commission. 740
Warren, R. and Kunczynski, Y. (2000). ”Planning Criteria for Automated People Movers: Defining the 741
Issues.” J. Urban Plann. Dev., 126(4), 166–188. 742
Weigel, B. (2014). "Estimation of Potential Transportation and Building Energy Performance of 743
Commercial Office Site Alternatives." J. Urban Plann. Dev. , 10.1061/(ASCE)UP.1943-5444.0000201 , 744
04014016. 745
Yung, E., Chan, E., and Xu, Y. (2013) “Community-Initiated Adaptive Reuse of Historic Buildings and 746 Sustainable Development in the Inner City of Shanghai.” Journal of Urban Planning and Development , 747
Ahead of Print 748
Zhao, J. and Deng, W. (2013) “Relationship of Walk Access Distance to Rapid Rail Transit Stations with 749
Personal Characteristics and Station Context.“ Journal of Urban Planning and Development , December 750
2013, Vol. 139, No. 4 : pp. 311-321 751
Zhou, J. (2013). ”Study of Employee Carsharing on the University Campus.” J. Urban Plann. Dev., 139(4), 752
301–310. 753