c• earth penetrator design study … document contains page/s i..s-reproduced from best available...
TRANSCRIPT
This Document Contains Page/s -I..s
Reproduced FromBest Available Copy /
C. DNA 4210F
c• EARTH PENETRATOR DESIGN STUDY"• PROGRAM SUBSCALE BALLISTIC
SPENETRATION TESTS
Avco Corporation
Avco Systems Division201 Lowell Street
Wilmington, Massachusetts 01887
January 1977
Final Report for Period 6 May 1976-30 November 1976
CONTRACT No. DNA 001-76-C-0057
APPROVED FOR PUBLIC RELEASE;DISTRIBUTION UNLIMITED.
THIS WORK SPONSORED BY THE DEFENSE NUCLEAR AGENCY
UNDER RDT&E RMSS CODES B342076462 L41AAXYX96604 AND
8342076464 N99QAXAC31801 H2590D.
DDC
Prepared for IU. AUG 29 19T'
r Director
/I.J DEFENSE NUCLEAR AGENCY
'• L-. Washington, D. C. 20305
L ...... :• --- - -, • e.....-- •.::--• • ,-••-,;•:•,•; ,;: 7,,.,.,C .....- -.... ...... ,.........

Destroy this report when it is no longerneeded. Do not return to sender.
iA;J

SECURITY C ASSIFIUTION OF THIS P40E (When Dlat. Entered)
P.A INSTdeCTtrNS
II. GOVTOLtN ACFFICEO NAME AND ADDREENTS CAAO NUMBER'f94..
14. MONTORINGAE NCY A MOR E SIGAO TDR S dROGRA SUnlBrS.Con AllEn OfFc) inalU I Y ~ U ~ t
BALdTC ENT~IO Z4T. MaCASSIICtIN/ovWHG76I
IS DDT.BTO CTATTMENT of thAN NUeport)
Ap.provedfor publc reease disribuion nlinited
IS. SUPLE ENAR NOTESES1. RG AMEEEN . 7 S
SubscalerPeneratiLon TeSsts m D giveso EaRth PenetratorBaliti Poene traetinTts SnlStpeTirEthPerao
Pienetorato TrajM ectr0aa7oia7athPn o
ABfesTRC (CN tiuc eaorr s A iden -If rNcaeyedIetiyb lc ubr
angle MOfIORN AttaCk NAnd obiut uingthree different models Cogrlli, single5.SEUAT
bAllpwroedo pused c tmesrelethe; peaksdcelertion forimieacd et.Giswr
uhse tor mponitoredb the Deeeenste trajetry Agndy chnger of velcit thougdessand746 media.64an 32066 N9AC381H29D
PeEeURITio Trajctor PAtE Conien betah Pentetrator
ABSTRACT'7 (cniu .rvresd tncsayan dniyb lc ubr
I 1-
17NrThA~RIWTRflSiCURITY CLASSIFICATION OF THIS PAOK(W/tn Data Entered)
20. ABSTRACT (Continued)
&Test results including velocity, angle of attack, obliquity, crater size,copper ball deformation, trajectory and change of velocity in sand media arereported. Variations in performance as a function of tip configurations arediscussed. The results provide an extensive and significant addition to theunderstanding of the interaction between earth penetrators and representativetarget media.
F,,
UNCLASSIFIEDSECURITY CLASSIFICATION OF THIS PAGE(Whan Date Fntorod)
PREFACE
A series of 24 subscale penetration tests were performed to inves-
tigate the variation of performance as a function of tip configuration.
Ogive, single stepped tier and conical tipped subscale projectiles were
fired through a concrete target into a sand media at various angles of
attack and obliquity. The results of these successful tests may be
used to refine predictive techniques concerning the performance of earth
penetrators in typical target media.
The Program was conducted under Contract DNAO01-C-76-0057-POO001
for the Defense Nuclear Agency. This work was administered under the
direction of Lt. R. Nibe.
AO CESIgIN fitIl
TIS~l Whiti 8•c•tu
SWAN WI
Si ,0110M IyAIIARFk COflES
A~pL, afI SPECIAL
II
a1

-'t .,. a"•.E". A W:• fl "-' • m • ". ______________________ - .: -, *-.,• , f, ,• . '• '.,-,•r L -
CONTENTS
1.0 INTRODUCTION ................................................ 7
2.0 TEST HARDWARE ............................................... 8
3.0 INSTRUMENTATION ............................................. 18
4.0 TEST PROCEDURE .............................................. 20
5.0 TEST RESULTS AND DISCUSSION .................................. 24
2
ILLUSTRATIONS
Figure 1 Subscale Projectile Design - Ogive ............ 9
2 Subscale Projectile Design - SST .................... 10
3 Subscale Projectile Design - Conical .................. 11
4 Projectiles and Accelerometer ..................... 12
5 Passive Accelerometer Parts ....................... 13
6 Projectile Sabots and Support Discs .................. 16
7 SST Projectile in Sabot ............................... 17
8 S/S Penetration Test Setup ............................ 21
9 Subscale Ogive Penetration Test 1, y 0, 50 22
10 Subscnle Ogive Penetration Test 2A,y 00, a - 00 ... 26
11 Test 2A Target Data - Ogive Projectile ................ 27
12 Subscale SST Penetration Test 3, y ,o 0, a - 0. ........ 28
13 Test 3 Target Data - SST Projectile ................... 29
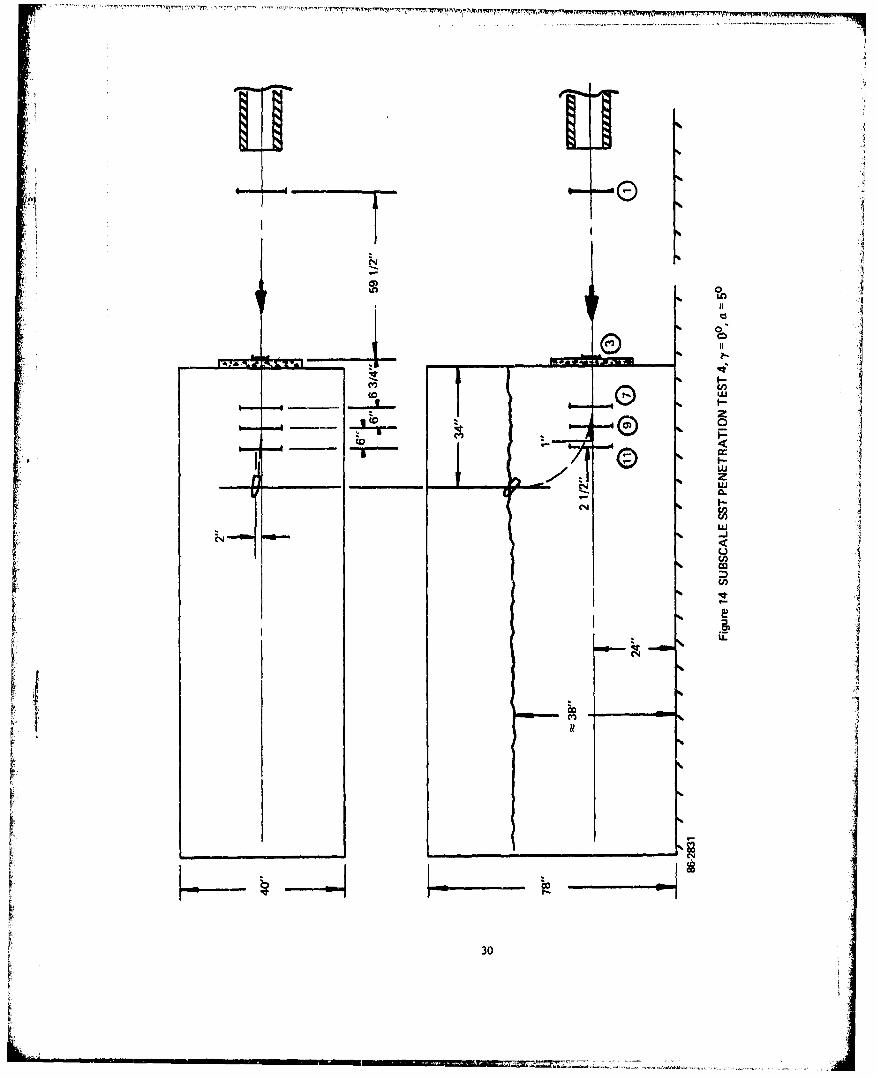
14 Subscale SST Penetration Tedt 4, = 0O,a = 50 .......... 30
15 Test 4 Target Data - SST Projectile ................... 31
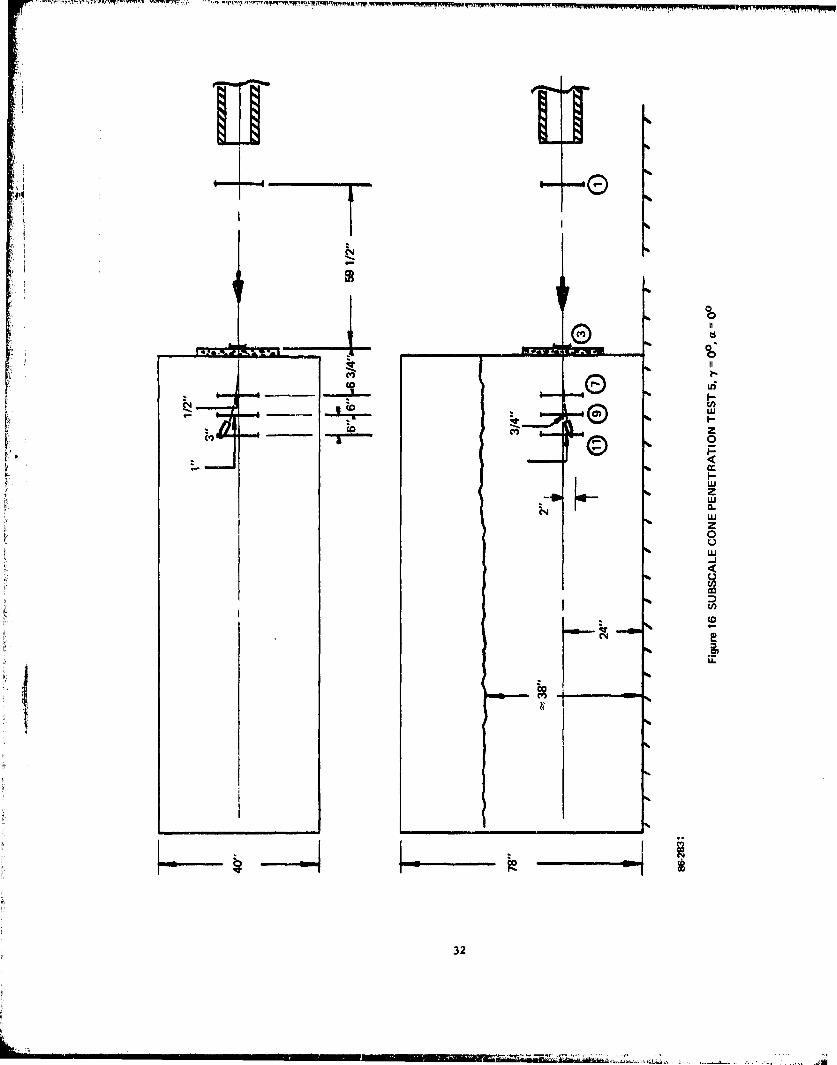
16 Subscale Cone Penetration Test 5, y = 00 00 32
17 Test 5 Target Data - Cone Projectile .................. 33
18 Subscale Cone Penetration Test 6, y = 00, a = 50 ..... 34
19 Test 6 Target Data - Cone Projectile .................. 35
20 Subscale Ogive Penetration Test ?, y 450, 5 .50 36
21 Test 7 Target Data - Ogive Projectile ................. 37
22 Subscale Ogive Penetration Test 8, y = 450, a = 00 .... 38
23 Test 8 Target Data - Ogive Projectile .................. 39
3
ILLUSTRATIONS (Cont'd)
Figure 24 Subscale SST Penetration Test 9, y, 450, a 50 ...... 40
25 Test 9 Target Data - SST Projectile ................... 41
26 Subscale SST Penetration Test 10, y 450, a - 00 ... 42
27 Test 10 Target Data - SST Projectile .................. 43
28 Subscale Cone Penetration Test 11, y - 450, a 50 .... 44
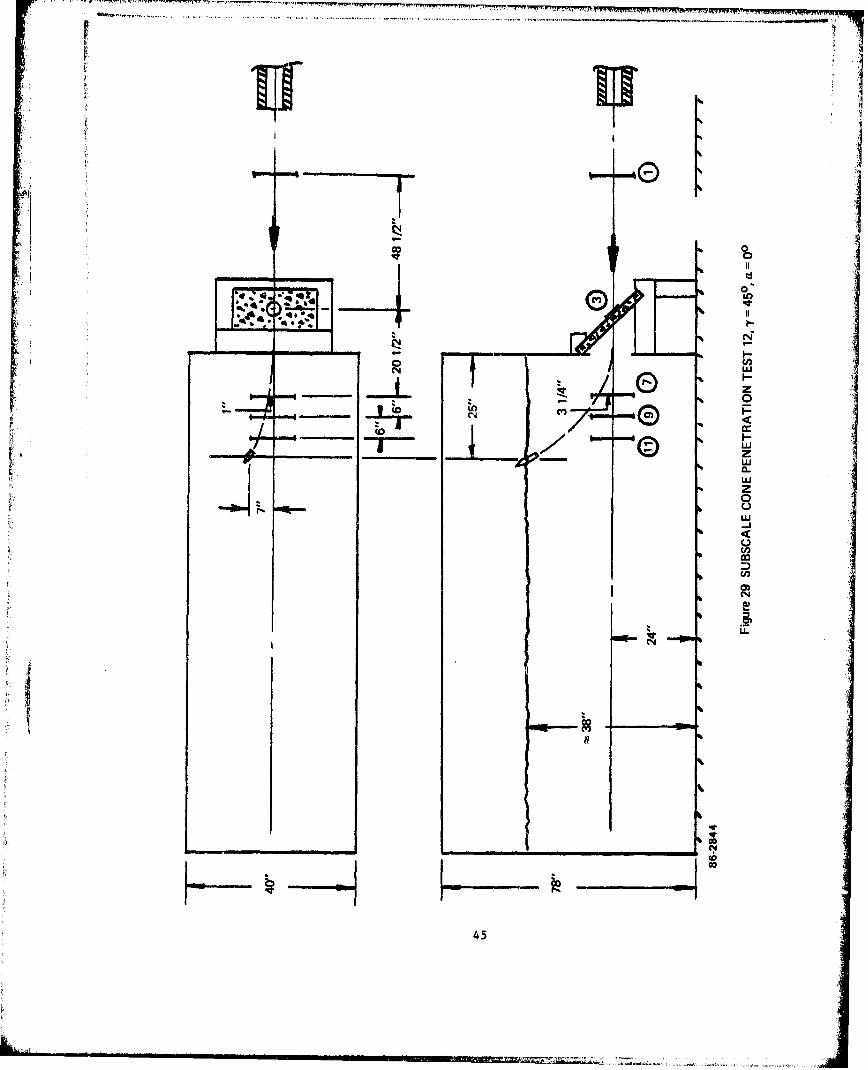
29 Subscale Cone Penetration Test 12, y = 450, a - 00 .... 45
30 Test 12 Target Data - Cone Projectile .................. 46
31 Subscale Ogive Penetration Test 13, y = 22-1/20,a = 50 47
32 Test 13 Target Data ................................... 48
33 Subscale Cone Penetration Test 14, ),= 22-1/2 0 ,a - 50 ... 49
34 Test 14 Target Data - Cone Projectile ................. 50
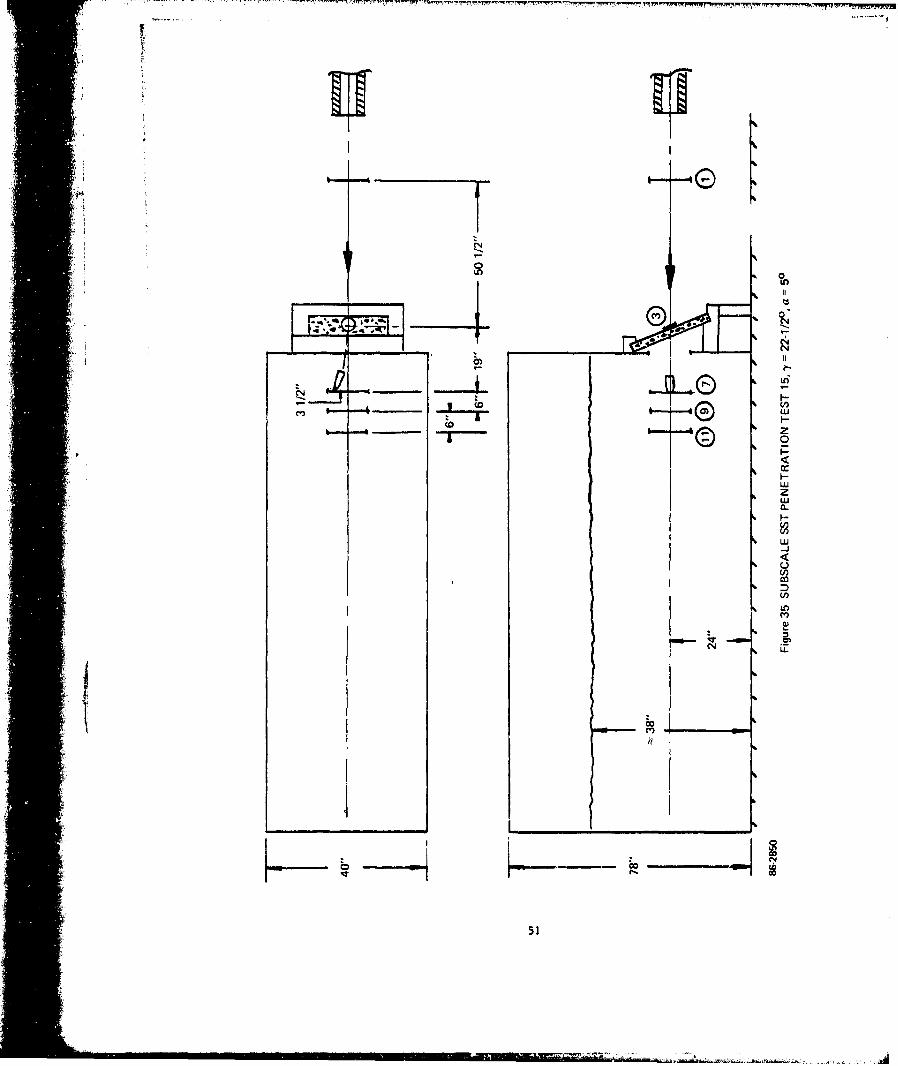
35 Subscale SST Penetration Test 15,),= 22-1/2°,a = 50... 51
36 Test 15 Target Data - SST Projectile .................. 52
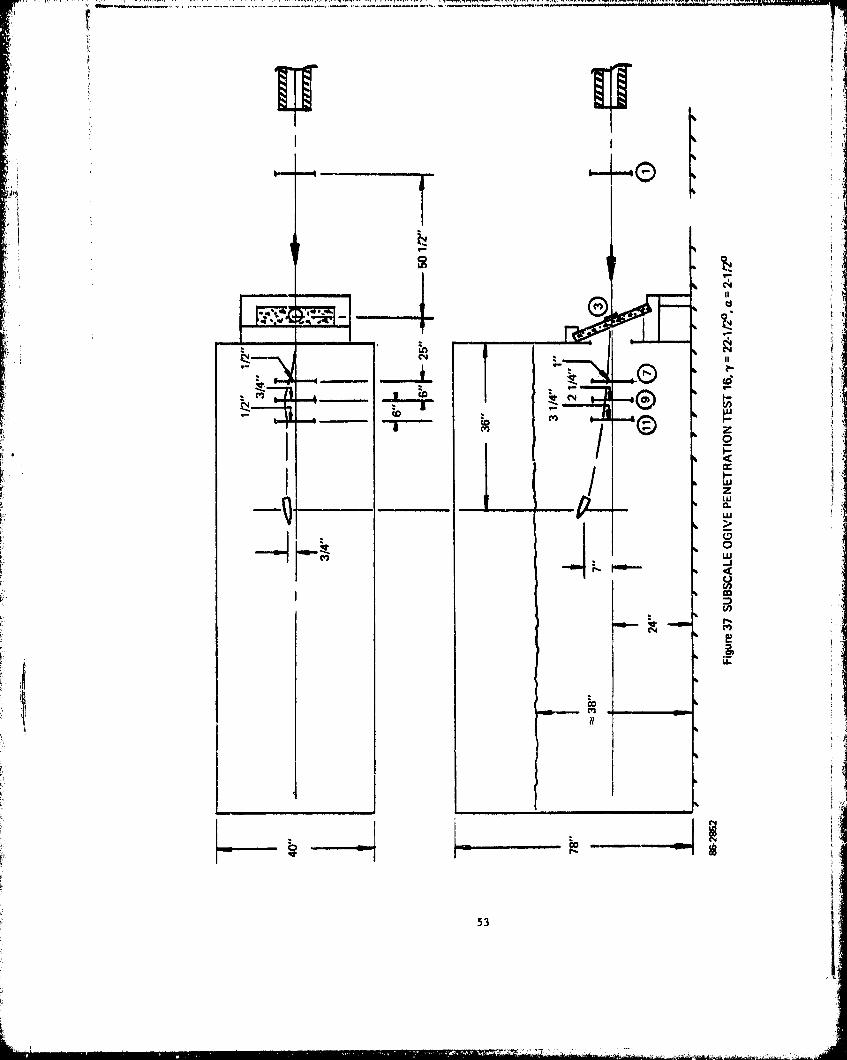
37 Subscale Ogive Penetration Test 16,)y= 22-1/20,a = 2-1/20 ............................................. 53
38 Test 16 Target Data - Ogive Projectile ................ 54
39 Subscale SST Penetration Test 17, y - 22-1/20,a = 2-1/2o ............................................. 55
40 Test 17 Target Data - SST Projectile .................. 56
41 Subscale Cone Penetration Test 18, y = 22-1/20,a 2-1/2 ............................................. 57
42 Test 18 Target Data - Cone Penetration ................ 58
43 Subscale Ogive Penetration Test 19,), 2 2 -1 / 2o, a= 0 .. 59
44 Test 19 Target Data - Ogive Projectile ................ 60
4
ILLUSTRATIONS (Co-icl'd)
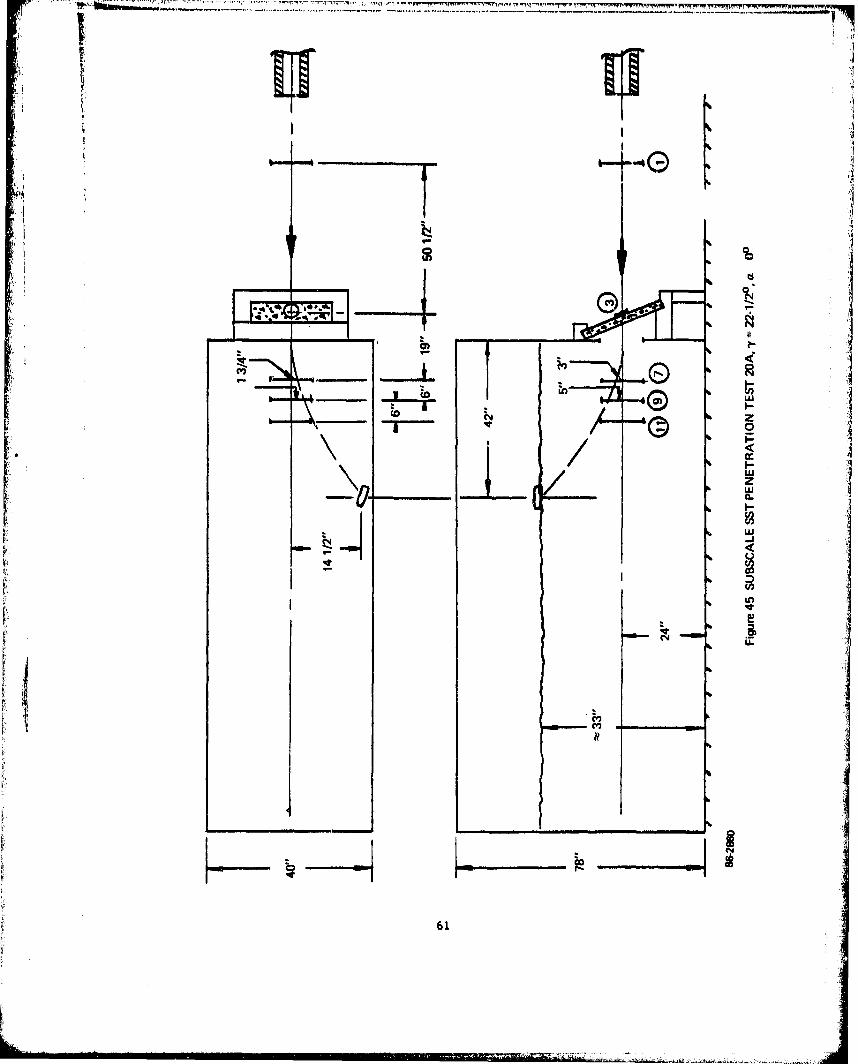
Figure 45 Subscale SST Penetration Test 20A, y = 22-1/2, a- 00. 61
46 Test 20A Target Data - SST Projectile ................. 62
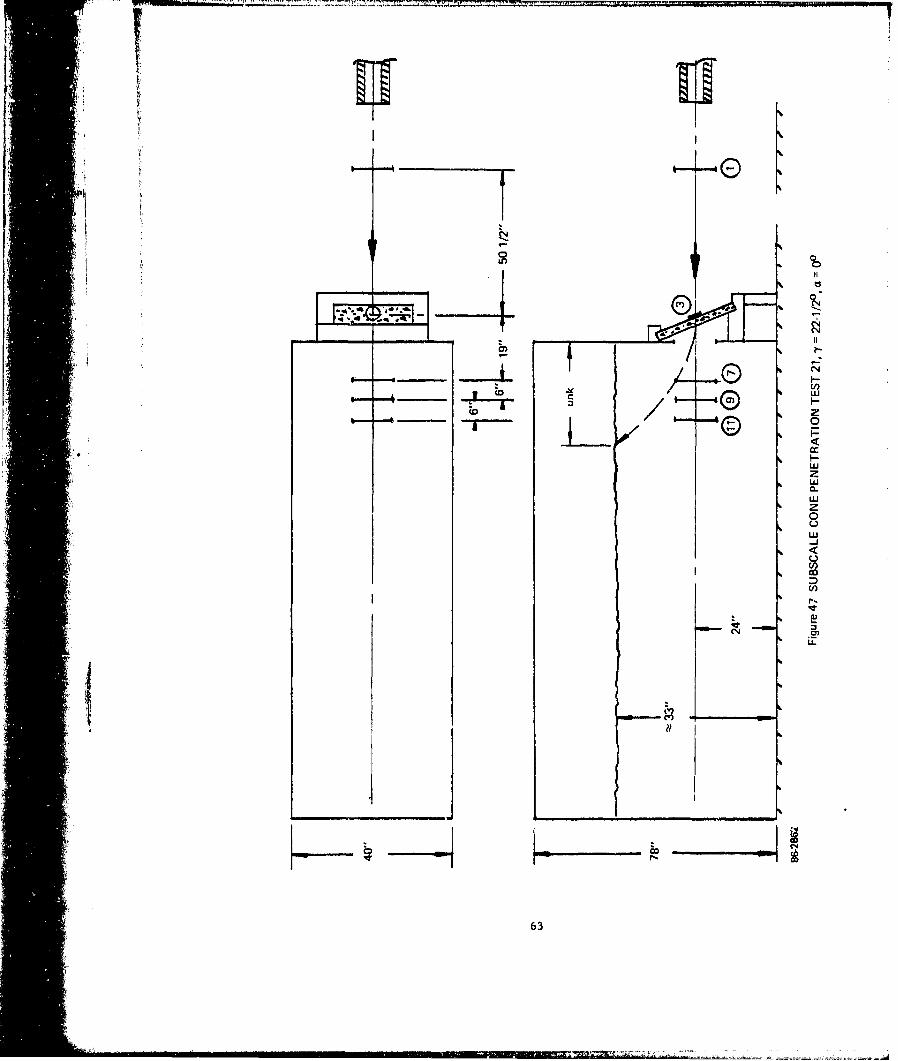
47 Subscale Cone Penetration Test 21, y- 22-1/20, a• 00... 63
48 Test 21 Target Data - Cone Projectile ................... 64
49 Subscale OgIve Penetration Test 22, y 450,
• = 2-1/20 ................................................ 65
"50 Test 22 Target Data - Ogive Projectile ................ 66
51 Subscale SST Penetration Test 23, y= 450,a = 2-1/20 ............................................ 67
52 Subscale Cone Penetration Test 24, y - 450,
2-1/2 = -1 "2.. ............................................ 68
53 Concrete Target, Front Face ............................. 70
54 Concrete Target, Back Face ............................ 71
TABLES
Table 1 Comparison of Test Model Weights and c.g.'s withDesired Values ........................................ 14
2 Summary of EP Model Penetration Test Data ............. 25
3 Data Summary EP Model Test Results.....................72
5
iT
'iW
1.0 I9TRODUCTION
A major factor in earth penetrator (EP) performance is the tip
configuration. A program was initiated to determine the relative pene-
tration performance of three different tip configurations. Full scale
earth penetrators were designed with ogive, single stepped tier (SST)
and conical. tips. The total weight, c.g. location, and tip geometry
was defined for each configuration. One twelfth scale models were
designed to duplicate each of the important design parameters as closely
as possible. These subscale model designs included provisions for a
copper ball passive accelerometer.
Subscale EP models were fabricated and tested. A total of 24 tests
were performed at various combinations of angle of attack and obliquity
for each of the three model configurations. Tests were conducted at
1000 ft/s impact velocity through concrete into a sand media. EP model
performance was monitored and compared.
The primary purpose of these tests was to determine relative "g"
loads and trajectory performance for three realistic design configura-
tions under typical operational conditions. It was further intended
that the test results should provide a data base which could be used
to predict future EP performance with regard to "g" loading and
trajectory performance. This type of information is needed to ensure
that EP designs can be evolved which can be realistically expected to
achieve program objectives.
This report documents the subscale EP model test hardware, instru-
mentation, procedures, results and data trends. Detailed analysis of
the data to develop and refine predictive computer trajectory codes is
beyond the scope of this activity. However, it is recommended that
detailed analysis of the test data be undertaken as a part of a future
program to maximize data utility and to increase understanding of earth
penetrator phenomenology.
7
* 'I|.w|-
2.0 TEST HARDWARE
Tests were conducted with subscale EP models fabricated to the
three configurations shown in Figures I through 3. These represent 1/12
scale models of full scale penetrator design. Full scale designs were
developed for each of the three candidate configurations; ogive, SST
and conical tip designs. Each design realistically considered EP
geometry, internal components, mass and c.g. The models were developed
by scaling the total mass of the full scale design and the relative e.g.
location into the models in a representative fashion. The design in-
cluded the passive copper ball accelerometers. The three EP models are
shown in Figure 4 together with the passive accelerometer assembly. An
exploded detail of the passive accelerometer assembly is shown in
Figure 5. The test model weights and c.g.'s are compared with the
theoretical 1/12 scale model values in Table 1. As may be seen the
models were very close to the desired values in all cases.
The test models were machined from maraging steel and heat treated
to a hardness of approximately 50 on the Rockwell C scale. This is
equivaient to an ultimate strength in excess of 255,000 lb/in2 .
The copper ball passive accelerometer design was based on work
p rformed as reported in References I and 2. These reports were
prepared by Mr. Val DeVost of the Naval Ordnance Laboratory, White Oak,
Maryland. Mr. DeVost was of great assistance during this program,
providing insight into the design and fabrication of these devices.
He further identified a source and quality assurance procedure for the
copper balls. NOL copper ball passive accelerometers (MOD 10-200,000 g)
were used in all tests. The passive accelerometer assemblies including
the copper balls were obtained from Halpro, Inc., Rockville, Maryland.
These assemblies were made in accordance with Halpro Drawing No. 2425615.
Copper balls were 0.1553 inch in diameter and were quality controlled to
a tolerance of plus 0.0002 inch minus zero inches.
8

*~~~~- - 40.~~'*~-'
00
zz
-F
8 cl 0
-LJ
Loo
La-
w
Co4
K __
.-- .I-
26n
u..ISI
LLl
'- -
20V
LA
,a.fw
cn nLt
0 U.C.,
100
I2
R
-A
LL 0
S(n
cn LL o
CV-)
*w
I-
w
12

w
0
-LJLI C-,
CL- zILLw
13

TABLE 1. COMPARISON OF TEST MODEL WEIGHTS AND C.G.'S WITH DESIRED VALUES
Ogive SST Cone
Weight C.G. Weight C.G. Weight C.G.Jgms) % from tip (gins) % from tip (gms) % from tip
Actual test 243 55 274 45.6 377 57.9models
Theorectrical 247 57.28 276 45 358 57.951/12 scale models
Ratio actual 98.4 96.0 99.3 101.3 105.3 99.9to theorectical %
14
7MK,- T M.' 'M ,
All tests were performed using a 2.9 inch diameter smooth bore
launcher to accelerate the EP scale model to a nominal 1000 ft/s
velocity. It was necessary to use sabots to support the projectiles to
accommodate the difference between the EP diameters and the launcher
diameter and to provide for angle of attack orientation where necessary.
A sabot drawing is shown in Figure 6. The sabot and disc were fabri-
cated from a 3-inch diameter polyethelene rod. The disc and base
support configuration were varied to accommodate the desired angles of
attack (i.e., 0, 2-1/2 or 5 degrees).
Figure 7 shows a typical sabot with an SST model installed. The
saw cuts, 90 degrees apart, are typical for all sabots and are needed
to accommodate separation of the EP model from the sabot after launch.
The target consisted of a three-foot square concrete slab backed
by a box full of sand. The concrete had a nominal thickness of one
inch which represented a 12-inch thick full scale concrete slab. The
concrete was made with a sand aggregate. The concrete had a compressive
strength of approximately 5000 lb/in2 seven days after pouring using a
high early strength cement.
I
i15

777
Band saw cut(4 ea. - 900 apart)
5,00" -
I'. ~ Support disc "
L~f: (see below)
2.899"2.895" l _________
I Diameter varied -L.. .65"diaw/prajectile
2.65 di 21/2 0
.0.
~ Angle variedw/projectile
00 -211120-50
221/20-°60-. -_.821'2°---
0.20" 0.20"00 Angle disc 2 1/20 - 50 Angle disc
Figure 6 PROJECTILE SABOTS AND SUPPORT DISCS
16
Support disc
Figur projPRJETLEINStO
4 cuts900 u Sabo
3.0 INSTRUMENTATION
The instrumentation used on all 24 tests consisted of high speed
cameras to observe the projectile flight up to and including hitting the
concrete slab and "make circuit" velocity grids to monitor velocity
through the sand media. The passive accelerometers described under test
hardware were used on each test to measure peak deceleration "gts".
One mil of copper ball deformation equals approximately 22,600 g's up
to 200,000 g's according to the Reference 1 data.
Two high speed Fastax cameras were located 90 degrees apart to
observe the free flight of the EP model from a side view and from a top
view. The cameras were operated at approximately 6000 frames per second
and were used to measure EP model angle of attack and velocity. All
sabots were oriented so that the angle of attack could be observed by
the side view camera with EP nosetip up/tail down orientation. However,
due to slight sabot roll during launch it was possible to observe some
angle of attack orientation in the top camera.
The actual test angle of attack was of course the resultant of the
angles observed in the top and side cameras. It was possible to measure
angles to within ±0.5 degree using the Fastax camera filming technique.
Velocity at impact into the concrete was also determined by analyzing
the Fastax film data. The velocity data is accurate to within 5 percent
or approximately plus or minus 50 ft/s.
EP model trajectory and velocity after concrete target penetration
was determined with make-circuit velocity grids on the face of the con-
crete target and in the sand media behind the target. Three make-cir-
cuit grids were located in the sand media for each test. Each
make-circuit in the sand consisted of two layers of aluminum screen
(1 x 1 ft square) insulated with posterboard material. The concrete
target face make-circuit (TO) consisted of two layers of aluminum foil
insulated with a layer of 5 mil mylar. EP model trajectory was
18
I

determined from the location of the holes in the grids and velocity was
"determined from the time interval and distance between grids. All grid
circuit closing times were recorded on magnetic tape and playback was
onto an oscilloscope.
; ii i H
•Omili~mi
4.0 TEST PROCEDURE
The test setup used for each of the 24 tests is shown in Figure 8.
Each test was performed in the same manner as described below.
Make-circuits were positioned in the sand box as shown in Figure 9.
Sand was put into the box to the depth shown in Figure 9. A concrete
target was located in front of the sand box positioned to the obliquity
desired for the particular test. A make-circuit was placed on the front
surface of the concrete target to act as a TO circuit. All make-circuits
were connected to a magnetic t.ape recorder. Sabot peeler and deflection
plates were located at the front of the EP model launcher (gun barrel).
The hole in the peeler plate was smaller than the sabot, but, larger
than the EP model. The peeler plate would retard the sabot while per.-
mitting the EP model to pass through. However, the sabot was still in
line with the model such that it would impact the concrete target im-
mediately after the EP model, making it impossible to evaluate model
cratering effects. Therefore, a deflector plate was used to kick the
peeled sabot to one side causing it to impact a steel plate located to
the right of the concrete target.
The passive accelerometer was assembled after selecting and meas-
uring a copper ball. The passive accelerometer was assembled into the
EP model and the aft model cover screwed in place. The EP model was
then placed in a sabot selected to produce the desired angle of attack.
The sabot EP assembly was located so the aft end of the sabot was flush
with the aft end of the gun barrel. The EP model tip was oriented up-
ward such that the angle would be seen in the side view camera for all
angle of attack tests. A powder charge of 10 grams FFG black powder and
90 grams 4895 powder, as determined by calibration tests, was placed in
the breech along with a S-94 electric squib. The breech was assembled
to the gun barrel.
The two fastax cameras were loaded with film and the firing
circuit connected.
20
I-
zCjCL
V-
CL,
00
0 m,
0 m)
21
00
UU
>
0u0a
* '.CD
22

The cameras were started prior to firing the EP model so that thL
desired film speea of 6000 frames per second could be achieved. The
tape recordere were started and the S-94 squib initiated causing the EP
model to be launched. The gun to concrete target distance varied from
prior test to test because of different target obliquities, but was
nominally 52 inches.
At the conclusion of testing the EP model was recovered from the
sand box with the final location noted. The location of holes in the
velocity grids were used to provide trajectory data through the sand
media. The tape recorder velocity grid data was played back through
oscilloscopes to provide a measure of elapsed time from penetration of
one grid to the next. Knowing the distance between grids permitted
the calculation of EP model velocity through the sand media.
The Fastax film data was recovered, developed and analyzed to
provide EP model velocity and angle of attack data. The concrete target
crater was measured in detail for each test.
*I
23
1111111

5.0 TEST RESULTS AND DISCUSSION
The test results are summarized in Table 2. Details of the EP
model trajectory in the sand media and the target crater characteristics
are presented for each test in Figures 9 through 52.
Table 2 shows the order in which the tests were performed, the EP
model used for each test, the angle at which the concrete target media
was set for each test, and the desired angle of attack. The measured
angles of attack as observed from analysis of the side and top locatedFastax camera films are listed. The resultant angle of attack was cal-
culated from the side and top values. The resultant angle of attack is
the angle of attack of the EP model when it hit the concrete target.
The EP models were located nose up in the launcher so that angle of attack
could be observed in the side camera. It is obvious from the data that
the sabots rotated somewhat during transit of the launcher. The actual
(resultant) angle of attack compares quite well with the desired angle
of attack for all but Tests 19 and 21. The average difference between
the desired and actual angle of attack was approximately one degree for
the 22 tests, excluding Tests 19 and 21. The maximum deviation range for
the 22 tests was -2.5 degrees and +3.0 degrees. If Tests 19 and 21 are
included the average deviation per test increases to 1.4 degrees and the
maximum difference increases to 6 degrees. The results of Tests 19
through 21 seem to be more representative of five degree angle of attack
data than zero degree data and is not completely understood. It seems
evident that sabot machining and assembly is very critical to achieving
the desiged angle of attack and must be carefully controlled for each test.
The impact velocity data shown in Table 2 was obtained from analy-
sis of the film data. The average velocity for the 24 tests was 977
ft/s with maximum deviations of +160 ft/s and -122 ft/s. The average
velocity is quite close to the desired velocity of 1000 ft/s. The
average velocities achieved for the ogive, SST and cone tip models
24
. . . . . . 4. 4. '- . 4. .~ . .. 4. 4. 4. 4. 4.400 4.. 0. 1. 4 . 0 ' 0 - N 0' !e- "4 to hp4 !P 4 b ! 41 f
'0-i
0 0 4n 4A In 0 0 04n ' 04 M CA N 0% '
4 000'm0 00 4048000m
0.0
N -H M 0M -1
'C
04N
00 -: o' N o4N N N ND N N N N 0
O.
'C
I-I
pU cc N1 0 0 0 N N N Nl
0 u
I! u0 ~ ~~~~ .41N' 0 0 0 .. N N O 74 N 00 7 4
Ito40 00>70 ba-0
4J* N N .0 % N % - N N N N24 4

to 0
CD I
00
CL
C',
- c wco
Target no. 2A1" thick
Front
* 3"F 3
'• 1.5" x 1.6"'
2" 0.2" -0.75"
Back
3.2"
-y 00a 00
-2.9"
86-2826
Figure 11 TEST 2A TARGET DATA -OGIVE PROJECTILE
27
00
4, - 0Wý AMM
z
I-.
- I L3
* z4
LUb
28.
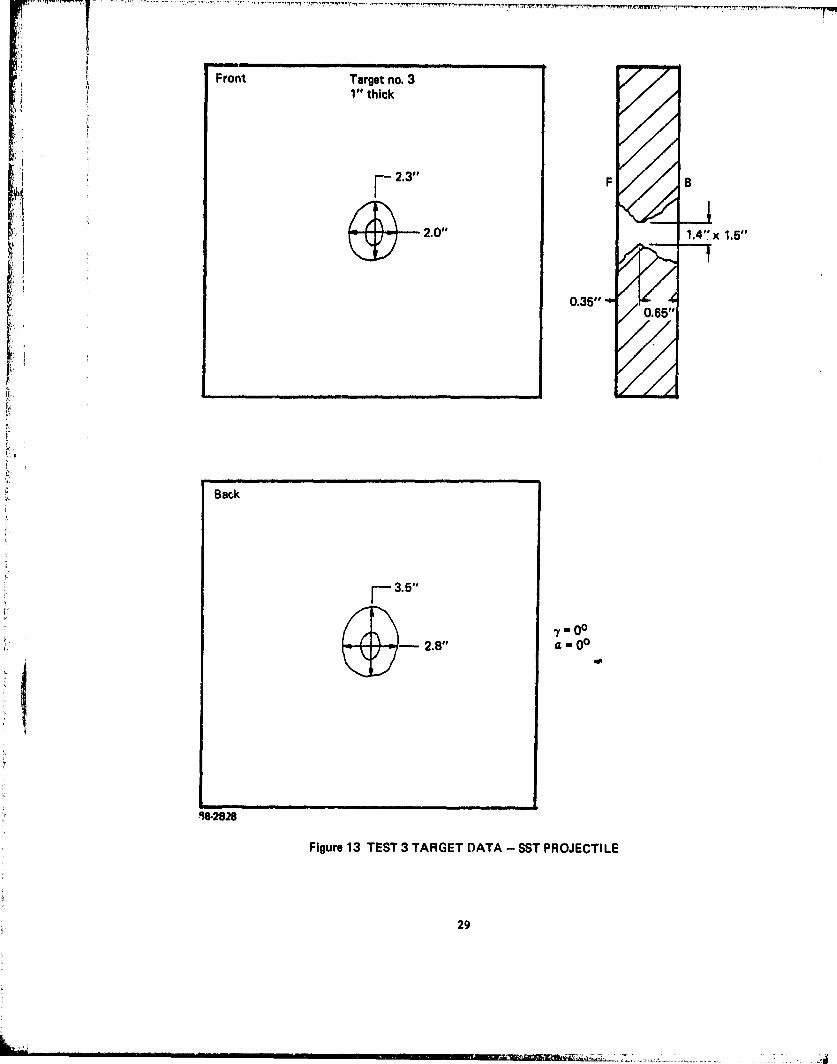
Front Target no.31" thick
2.3"#F#
S-2.0"0 1.4" x 1.6"
0.35"0.65"
Back
'--3.5"
'y 0
-•.• 2.8" •z Q0
86-2828
Figure 13 TEST 3 TARGET DATA - SST PROJECTILE
29
I If
LU
0
IL
CID
30~
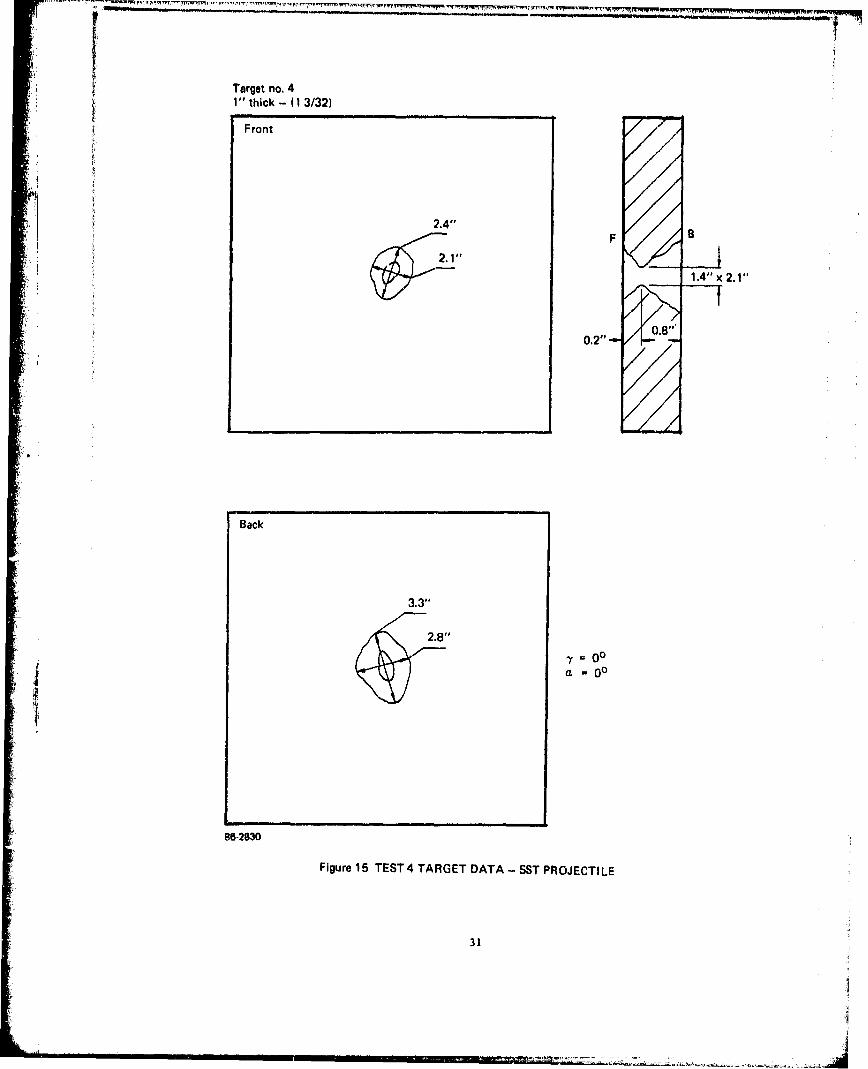
Target no. 4* i1" thick - (1 3/32)
Front
2.4"
F B
1.4" x 2.1"
0.8'"0.2"
Back
3.3"
2.8"
y 00a =00
86-2830
Figure 15 TEST 4 TARGET DATA - SST PROJECTILE
31
z* z
IL
F 0 0L-
L. .
32w
Target no, 5. J 1" thick
Front
hi
2.2"1,4" x 1.4"
02 0.75"0.25"-, • _ .
Back
2.7" 0' =Saff 00
0~2.3-
86-2832
Figure 17 TEST 5 TARGET DATA - CONE PROJECTILE
33
1<A

-~~A M. -M I T n '" '
ifiC 0~
LIr
m cc
ztC
LU
DoD
CN,
Co
'34
Target no. 61" thick
Front
FB2.6#p
1.2 x 2.1"
0.2".8.
Back
a =50i 3
Figure 19 TEST6 TARGET DATA - CONE PROJECTILE
35
CV)
auj
LUJ
(%J 1-
/ zo
___ (0 36
Target no. 71" thick
Front
2"2"3
•i2F x| 3.,
0.25" 0.75"
Back
4"
a 50
Xf
85-2836
Figure 21 TEST 7 TARGET DATA - OGIVE PROJECTILE
37
00
w
0~
PAO-
600
38
Target no. 81" thickFront F 8
0.25" /0.6/I0.757"
le'l I4.0"f
S2.3" 1.6 x 3.2"
0" ,,/ ,
Back
- 5.8"
4503.0" a =00
86-2838
Figure 23 TEST 8 TARGET DATA - OGIVE PROJECTILE
39

I.-.
(N IN
ioz
4 00
Target no, 91" thick
Front
0.4"" 0.8""
3"#
1.6" 1.5 x 2.3"
0.2"
Back
3.3"
=450
2.6a =
86-2840
Figure 25 TEST 9 TARGET DATA - SST PROJECTILE
41
=MID"
* ' w".~*,-.
I00
- __ ____ S 1.(N0 - I
cv, - cv,
CNC
% &
%
coz
42w
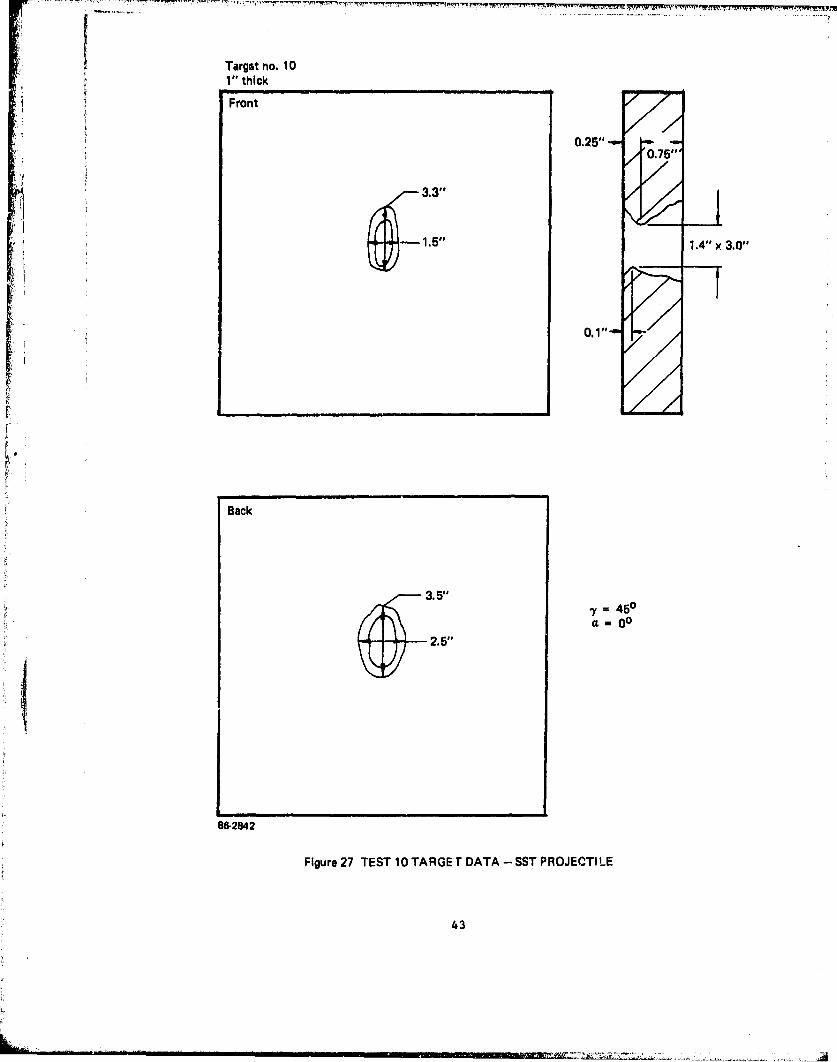
Target no. 101" thick
Front
0.25"/0.75"'
1.5" 1.4" x 3.0"
0.1,o"
Back
3.5"#S=450
a= 00
2.5,omO
86-2842
Figure 27 TEST 10 TARGEr DATA - SST PROJECTILE
43

~~oi
II
LU
g~co
- ~ Lu
LL
* ____ ___ 44
F Ie
CN.
V __ zL wU
LU.z
-J
CD)
CD
co
45
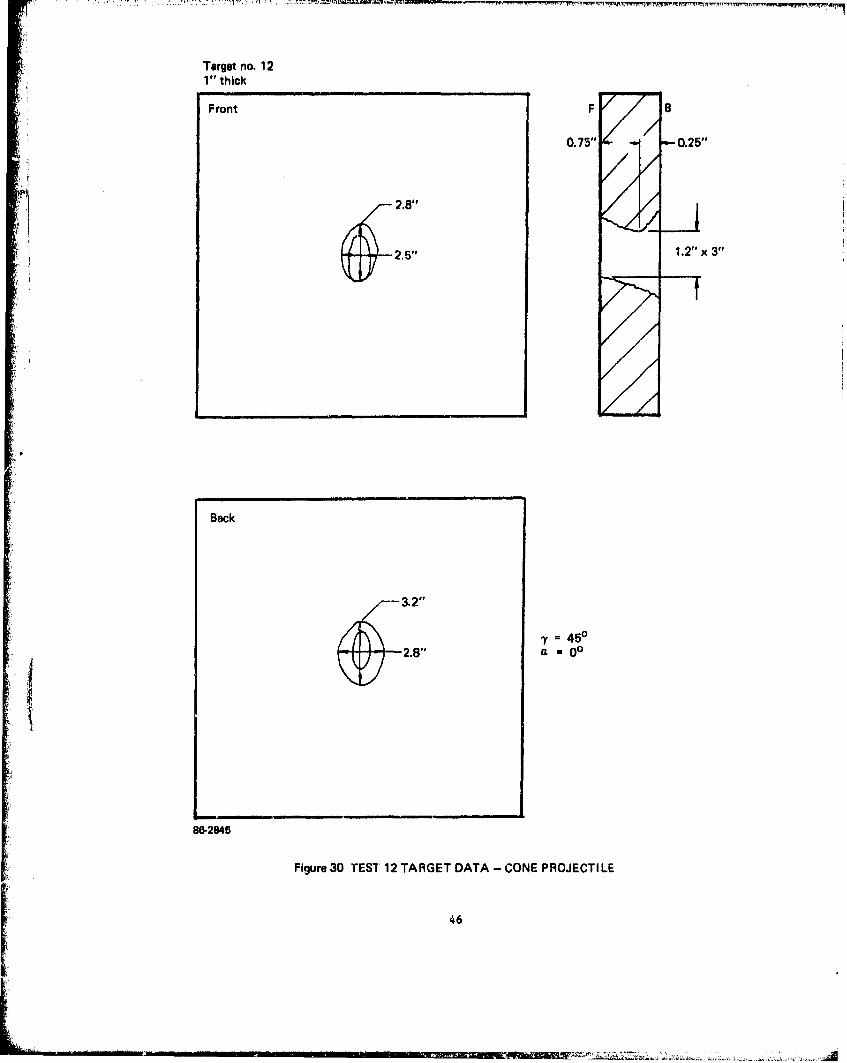
Target no. 121" thick
Front F B
0.75" - 0.25"
2.8/"
2.5" 1.2" x 3"
Back
~' -3.2"
=450
2.8" a =00
88-2845
Figure 30 TESI 12 TARGET DATA - CONE PROJECTILE
46

CID
I~- cc~1*I
10
Ul)
Go)
47N

Target no. 131" thick
FrontFB
0.6" 0N4,
2.8"
0" 1.6" x 2.3"
a 50
86-2847
Figure 32 TEST 13 TARGET DATA
48
S/ • ,- - 212

IN4
* - w
LWI-i
wnznm
wf
lb,
cv 4
49
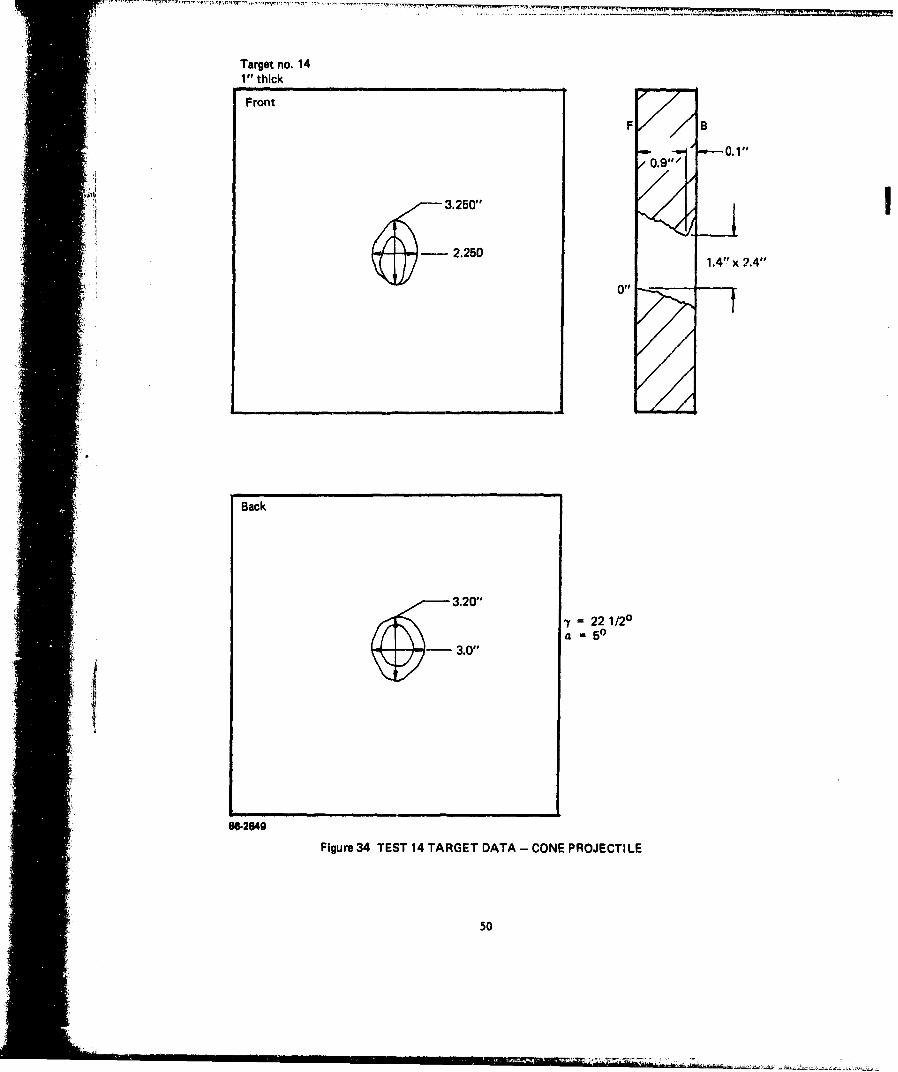
Target no. 141" thick
Front
F B
-a-l . --0-.0 -0.1"0.9-'
3.250"
* 1.4" x 2.4"
0"
Back
3.20"t 22 1/20a f)4 13.0"
8&2849
Figure 34 TEST 14 TARGET DATA - CONE PROJECTILE
50
N
N - 4-(5-q W
(0 I-
z
C-)V)
C-)
N -
51

Target no. 15
1" thick
Front
F Bi ~~0.25"..
0,26, 75-,0.75"'
- 3.250"
2.6" 1.9" x 2.4"
0.3"-
Back
4.0"
= 22 1/20
3.4" a .5
8-2851
Figure 36 TEST 15 TARGET DATA - SST PROJECTILE
52
* I 00
- (0
Ik 0-~ H
I 4
531
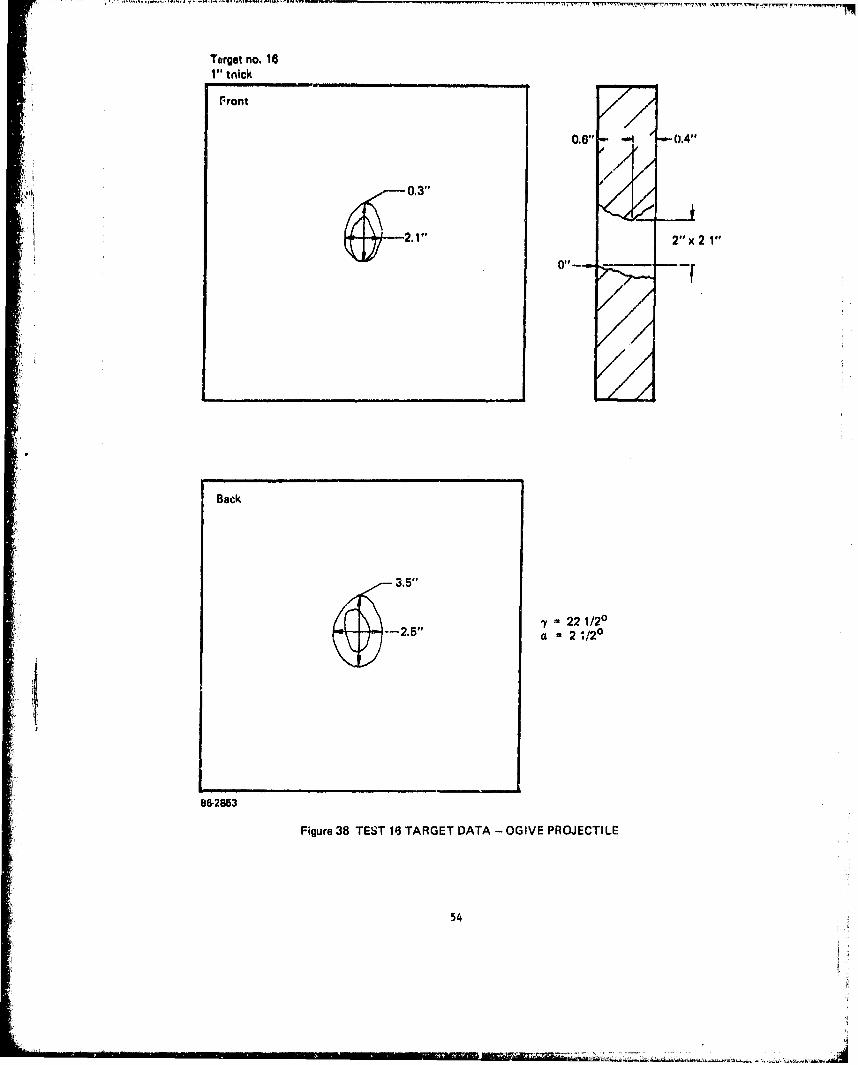
Target no. 161" tnlck
rront
//0,6#p • , 0.4"
0,3"1
2" x 2 1"
//./
Back
3.5"
= 22 1/20-2.5" a 21/20
86-2853
Figure 38 TEST 16 TARGET DATA - OGIVE PROJECTILE
54

~ - -n
00
A..,j
- .- ;.~i 1:0'ID 0 IV)-- 4-
- Vw
LL
'1 ' lb
55 -

Targt no, 171" thick
Front
0.2/
0.8
~ii
2.0• 1.3" x 2"
•+ ~~0.10"-- - -
Back
"-ii3.0" -y 22 Ir °
a -2 1/20
86-2855Figure 40 TEST 17 TARGET DATA - SST PROJECTILE
56

kbIL~IIN
FLIc
Co I-
- o7

Target no, 181" thick
Front.
S0.600" - 40"
*1 2.91Fp
•iiii2. 7"1.2" x 2.1"
Back
3.2"
y 22 1/20a = 2 1/20
3.0"
86,2842
Figure 42 TEST 18 TARGET DATA - CONE PENETRATION
58

* *- 0
C.,4
_ _ II4~DI j 0LU
I --co 'a
Zw60I I a-
U)I
59
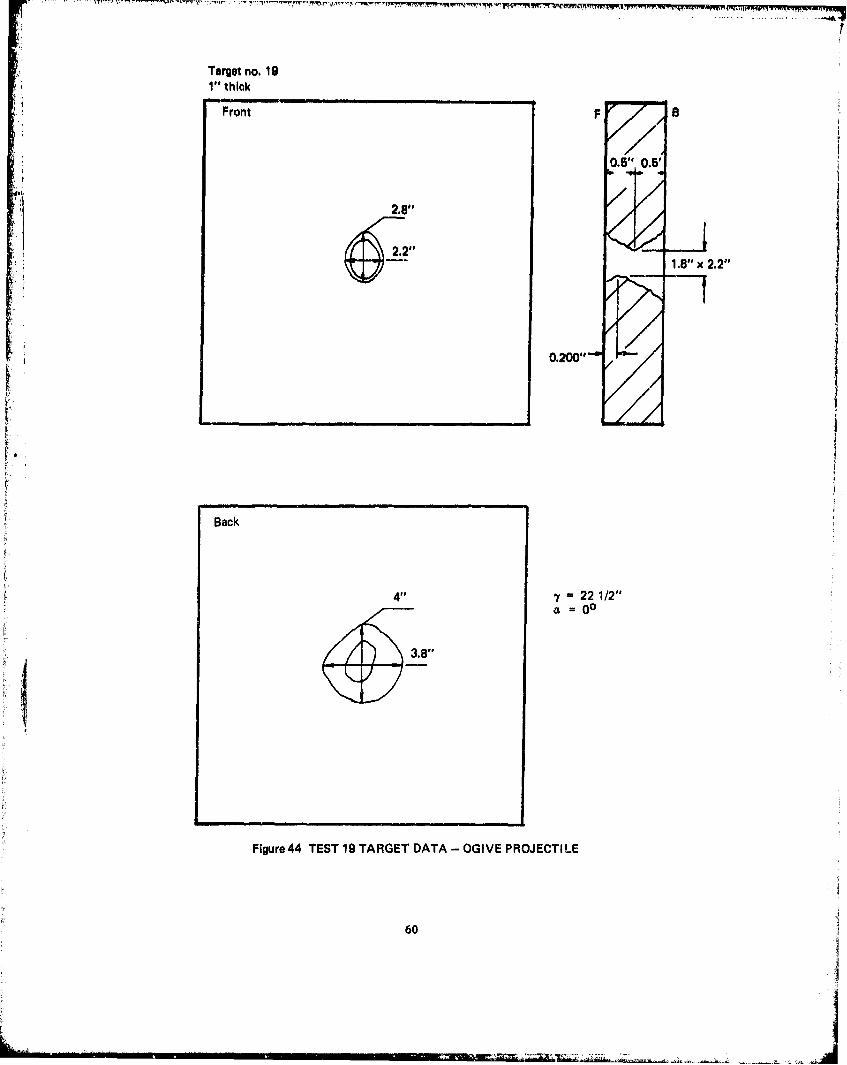
Target no. 19I" thick
Front F r
0.5" 0.5'
2.8"
1.8" x 2.2"
0.200"
Back
4" '= 22 1/2"
~1 8a =00
3.._81"
Figure 44 TEST 19 TARGET DATA - OGIVE PROJECTILE
60
.4. ,
00
_jE
61
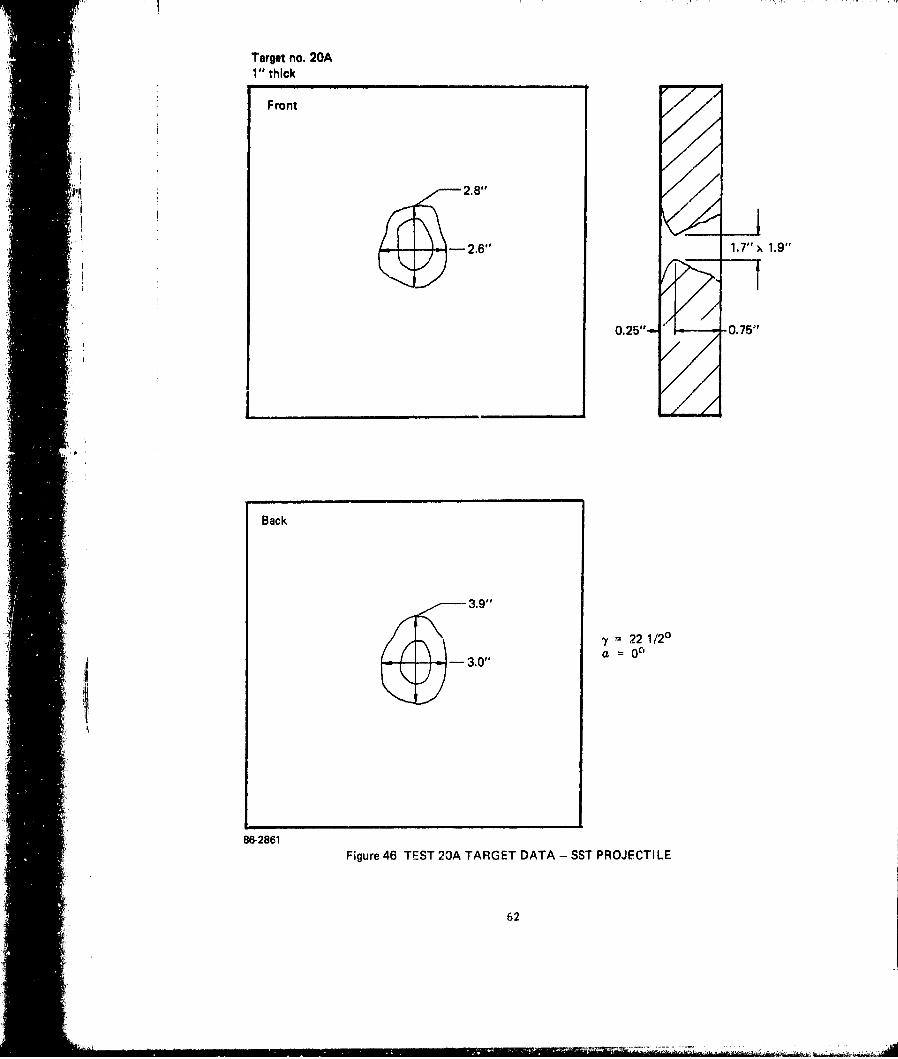
Target no. 20AI" thick
Front
2.8"
- 2.6" 1.7" , 1.9"
0.25"- -0.75"
__ _ _ _ _ _ _ _ _ _ _//
Back
3.9" y 22 1/20
-3.0"a=
86-2861Figure 46 TEST 20A TARGET DATA - SST PROJECTILE
62
Ill
0.0Q c%
<I
-Aw Iz~Z) (N-4L
z
Gow
63~
maml=" ý11w
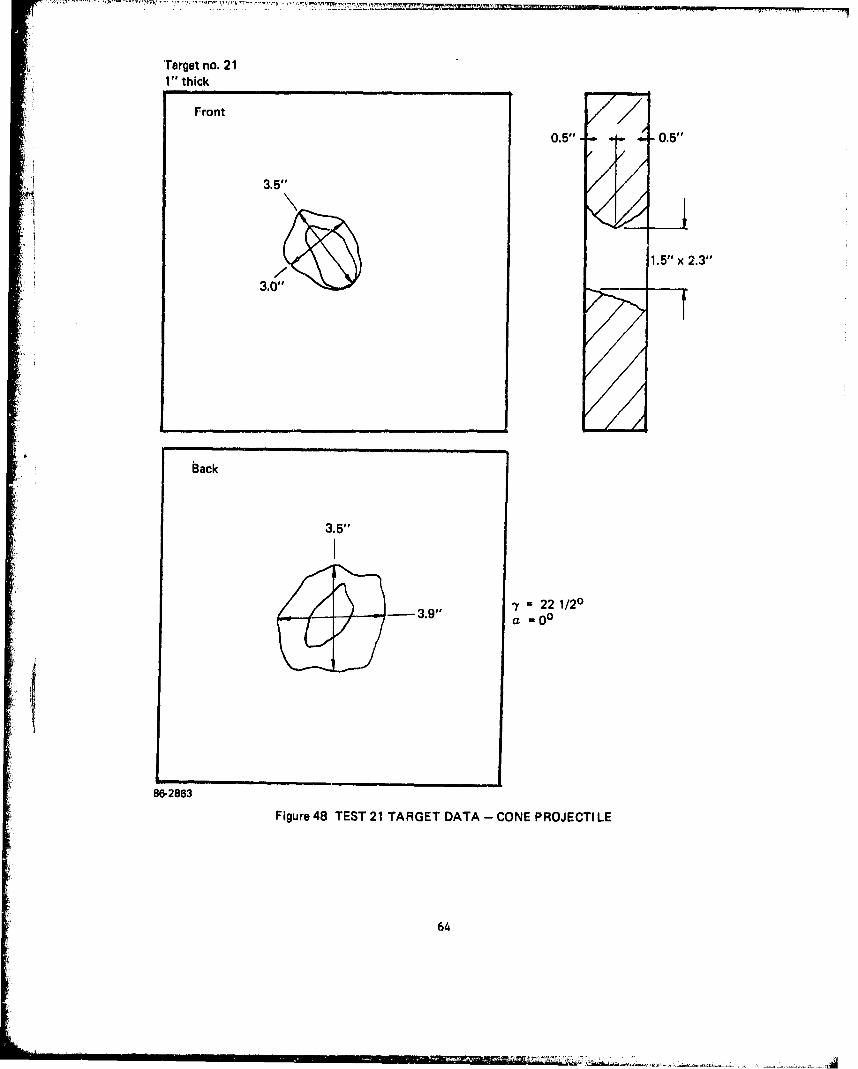
Target no. 211" thick
Front
0.5" - -0.5"
3.5"
1.5" x 2.3"
3.0"
back
3.5"
3.9" = 22 1/20a =00
t
86-2863
Figure 48 TEST 21 TARGET DATA - CONE PROJECTILE
64

CDC
C.CL
Ron --- Q IIN)
- - v
%
--1-- 0 5

Target no. 221" thick
Front
2.5"
1.5" x 2.5"
q Back
*/ /4,0"
S.}, = 450
-- 3.0" a 2 1/2"
86-2865
Figure 50 TEST 22 TARGET DATA - OGIVE PROJECTILE
66

C42
to
C~CL
-ue 0-W~1C14
cow
67z
44maa
4.4 I
Hw
to w
TzLI)
COIb
LoImall -n
2I
68
were 975, 974 and 981 ft/s, respectively. Thus, slight differences in
launch weight due to the different configurations had little influence
on launch velocity. The primary factor influencing launch velocity
was probably the tolerances between the sabot and launcher barrel.
The copper ball deformation is listed for each test. These values
are more indicative of relative performance than actual g measurement
since many of the measurements are outside the linear range of the copper
ball. Trajectory estimates through the sand media were made for each
EP model. Concrete crater measurements wore made on each concrete tar-
get except for four targets which broke up during removal from the test
setup. These data are presented in Figures 9 through 52. Typical craters
are shown in Figures 53 and 54. Because of the difficulty in comparing
the many test variables and referring to a large number of figures, an
attempt has been made to summarize the test results in tabular form.
This summary is presented in Table 3.
The data in Table 3 is grouped by EP tip configuration, obliquity
and angle of attack for ease of review. Test number, measured angle of
attack and, copper ball deformation are taken from Table 2. Velocity
loss is calculated by taking representative velocity values from
Table 2 and dividing the change in velocity in the sand media by the
distance over which the change of velocity occurred. This is done for
changes in velocity over distances of 6.5 and 18.5 inches for the zero
obliquity tests and for approximately 20 inches for the 22.5 degree and
45 degree obliquity cases. The stability factor shown in Table 3 is anattempt to quantify and simplify the trajectory data. Basically, the
value is obtained by dividing the distance traveled in the sand media
by the total deviation from the normal path. For Test 1, the EP traveled
38 inches in the sand and deviated a total of 23.5 inches before leaving
the sand. The result of dividing 38 by 23.5 is 1.6, the stability factor.
The higher the stability factor the more stable the trajectory. The
fact that the Test 1 EP left the sand means that the stability factor
was probably less than the 1.6 value shown. That is, had there been
69

-I~
700
(NN
(N 01
Lii
9jC.,
71
--- L-
C 0 N N N
C/3~ 04W3 10 Ng'
loI I 0IsaN
4 dU p S-9 IVI
(980229p)
o 4vj 20 Pl0ol .4 0
jamuio4IU
OF 01 SN IV 0 0 0
00jm ap0 0
I'il Jo S.U 0" I
wp;q w u .0
(800zt4p)
1W.. . I..a~
72

more sand in the box the projectile probably would have deviated more.
Finally, the maximum crater dimensions are presented for the entrance
hole, the throat and the exit hole for each test for which this data
was obtained.,
A perusal of Table 3 provides insights into the significance of
the test data. The copper ball deformation is equatable to peak
deceleration "g's". For the ogive shape tip these forces are relatively
independent of obliquity or angle of attack except for the zero-zero
case. Conversely, the SST loads are highest for the zero-zero case andappear to be somewhat alleviated by obliquity and angle of attack. In
all instances the SST loads are higher than the ogive loads for the
same test conditions. The conical tip loads tend to increase somewhat
with obliquity, to be independent of angle of attack, to be less than
the SST values for all tests and comparable to the ogive values for
most tests.
The velocity loss factor seems to be independent of depth for
the data available. As might be expected, the higher loaded SST con-
figuration loses velocity fastest. Obliquity seems to reduce velocity
loss for all three configurations. The SST trajectory is the most
stable and the cone the least stable. The conical tip EP model deviated
so much from the normal path on Tests 18, 21 and 24 that the first
velocity grid in the sand media was missed and no in-depth velocity
data obtained. The conical stability factors are lower than the SST
values in all cases and comparable to the ogive values. It should be
noted, however, that no ogive EP model deviated so much as to miss the
in-depth velocity grids completely.
The crater data showed the following trends. The entrance hole
was generally smaller than the exit hole with the throat diameter
generally smaller than both. The crater size tended to increase with
obliquity. The ogive crater sizes were generally equal to or larger
than the SST or cone EP model produced craters.
73
S... . .•. - ..• • • .. r . . . . • v ., • ~ ~ • .• .... ..... .. ... .. . . . ... .. •
In summary, it can be stated that the SST EP models experienced
the highest peak deceleration loads and the highest velocity loss rates
through the sand media while exhibiting the most stable trajectory
performance. The cone tip EP models exhibited the least stable trajec-
tory performance. Both the ogive and coae peak deceleration "g" loads
were comparable and substantially lower than the SST loads.
It is recommended that the test results be used to refine currently
available EP trajectory predictive techniques both as a method of
further explaining the observed EP model performance and increasing the
ability of predicting the performance of future EP designs.
7
: 74
REFERENCES
1. DeVost, V. F., NOL Copper-Ball Accelerometers, NOLTR-63-279, dated
31 October 1965.
2. DeVost, V. F., "Shock Spectra Measurements Using Multiple Mechanical
Gages," NOLTR 67-151, dated 20 September 1967.
75
I
DISTRIBUTION LIST
DEPARTMENT OF DEFENSE DEPARTMENT OF THE ARMY (Continued)
Director Deputy Chief of Staff for Ops. & PlansDefense Advanced Rsch. Proj. Ageicy ATTN: Dir. of Chem. & Nuc. Ops.
ATTN: Technical Library ATTN: Technical LibraryATTN: NMRO
ChiefDirector Engineer Strategic Studies GroupDefense Civil Preparedness Agency ATTN: DAEN-FESAssistant Director for Researc[ý
ATTN: Admin. Officer CommanderFranhford Arsenal
Defense Documentation Center ATTN: L. BaldiniCameron Station12cy ATTN: TC Project Manager
Gator Mine ProgramDirector ATTN: E. J. LinddseyDefense Intelligence Agency
ATTN: Charles A. Fowler CommanderATTN: DI-7E Harry Diamond LaboratoriesATTN: DB-4C, Edward O'Farrell ATTN: DRXDO-RBH, James H. GwaltneyATTN: DT-2, Wpns. & eys. Div. ATTN: DRXDO-NPATTN: Technical Library Commander
Director Picatinny ArsenalDefense Nuclear Agency ATTN: Paul Harris
ATTN: DDST ATTN: SMUPA-AD-D-MATTN: TISI, Archives ATTN: Technical LibraryATTN: SPAS ATTN: P. Angelloti
3cy ATTN: TITL, Tech. Library ATTN: SMUPA-AD-D-A5cy ATTN: SPSS ATTN: Ray Moesner
ATTN: DR-DAR-L-C-FADir. of Defense Rsch. & Engjineering ATTN: Jerry Pental
ATTN: S&SS(OS) ATTN: Marty MargolinATTN: SMUPA-AD-D-A-7
Commander ATTN: Ernie ZimpoField CommandDefense Nuclear Agency Commander
ATTN: FCPR Redstone Scientific Information Ctr.U.S. Army Missile Command
Director ATTN: Chief, DocumentsInterscrvice Nuclear Weapons School
ATTN: Document Cortrol CommanderU.S. Army Armament Command
Director ATTN: Tech. Lib.Joint Strat. Tgt. Planning Staff, JCS
ATTN: STINFO Library DirectorU.S. Army Ballistic Research Labs.
Chief ATTN: G. RoeckerLivermore Division, Fld. Command, DNA ATTN: G. GrabarekLawrence Livermore Laboratory ATTN: DRXBR-X
ATIN: FCPRL ATTN: J. W. ApgarATTN: DRXBR-TB
DEPARTMENT OF THE ARMY ATTN: A. RlcchiazziATTN: DRDAR-BLE, J. H. Keefer
Dep. Chief of Staff for Rs:h. Dev. & Acq. 2cy ATTN: Tech. Lib., Edward BaicyATTN: DAMA(CS), MAJ A. GleimATTN: DAMA-CSM-N, LTC G. Ogden Commander and DirectorATTN: Technical Library U.S. Army Cold Region Res. Engr. Lab.
ATTN: G. SwinzowChief of Engireers2cy ATTN: DAEN-RDM Cornmander2cy ATTN: DAEN-MCE-D U.S. Army Engineer Center
ATTN: ATSEN-SY-L
r r rM. -
DEPARTMENT OF THE ARMY (Continued) DEPARTMENT OF THE ARMY (Continued)
Commander Commandant
U.S. Amy Comb. Arms Combat Dev. Acty. U.S. Army War CollegeATTN: LTC Pullen ATTN: Library
rr ATTN: LTC G. Steger U.S. Army Mat. Cmd. Proj. Mngr. for Nuc. Munitions_•i' ATTN: DRCPM-NUCDivision EngineerU.S. Army Engineer Div., Huntsville DEPARTMENT OF THE NAVY
ATTN: HNDED-SR
Division Engineer Chief of Naval OperationsATTN: Op 982, LCDR SmithU.S. Amy Engineer Div., Missouri Rvr.ATTN: Tech. Library ATTN: Op 982, CAPT Toole
•. •ATTN: Op 982, LTC Dubac
Commandant ATTN: Code 604C3, Robert Piacesi
U.S. Amy Engineer School Chief of Naval ResearchATTN: ATSE-TEA-AD ATTN: Technical LibraryATTN: ATSE-CTD-CS
Director Officer-In-ChargeU.S. Amy Engr. Waterways Exper. Sta. Civil Engineering Laboratory
SATTN: P. Hadala Naval Construction Battalion CenterATTN: P. K. Butler ATTN: R. J. O'Dello
ATTN: Guy Jackson ATTN: Technical Library
ATTN: John N. Strange Commandant of the Marine Corps.ATTN: Behzad Rohani ATTN: POMATTN: Leo IngramATTN: Technical Library Commanding GeneralATTN: William Flathau Development Center
Commander Fire Support Branch
U.S. Army Mat. & Mechanics Rsch. Ctr. MCDECATTN: Technical Library ATTN: LT Gapensk•: ATTN: CAPT Hartneady
Commander CommanderU.S.Army Materiel Dev. & Readiness Cmd. Naval Air Systems Command
ATTN: Technical Library Headquarters
Director ATTN: F. Marquardt
U.S. Amy Materiel Sys. Analysis Acty. Commanding OfficerATTN: Joseph Sperazza Naval Explosive Ord. Disposal Fac.
Commander ATTN: Code 504, Jim Petrousky
U.S. Army Missile Command CommanderATTN:oW.aJdnnATTN: W. Jann Naval Facilities Engineering CommandATTN: F. Fleming HeadquartersATTN: J. Hogan ATTN: Technical Library
Commander Superintendent, (Code 1424)SU.S. Army Mobility Equip. R&D Ctr. Naval Postgraduate SchoolATTN: STSFB-XS ATTN: Code 2124, Tech. Rpts. Librarian
t • ATTN: STSFB-MWSATrN: Technical Library Director• Comymander Naval Research Laboratory
mU.S Army Nuclear Agency ATTN: Code 2600, Tech. Lib.US ArmyNuclearAgencATTN: MONA-SA CommanderATTN: MONA-WE Naval Sea Systems Command
Commander ATTN: SEA-9931G
U.S. Army Training and Doctrine Comd. ATTN: ORD-033
ATTN: LTC Auveduti, COL EngerATTN: LTC J. Foss
S..78
I,
DEPARTMENT OF THE NAVY (Continued) DEPARTMENT OF THE AIR FORCE (Continued)
Commander AT:RPi U Ii; CmmaderHeadquarters. USAFIRDNaval Surface Weapons Center ATTN: RDPM
ATTN: M. Kleinerman ATTN: RDQSMATTN: Code WX21, Tech. Lib. ATTN: RDPS"ATTN: Code WA501, Navy Nuc. Prgms. Off. ATTN: RDQRM
Commander Oklahoma State UniversityNaval Surface Weapons Center Fld. Off. for Wpns. EffectivenessDahlgren Laboratory ATTN: Edward Jackett
ATTN: Technical Library"Commander
Commander Rome Air Development Center. AFSCNaval Weapons Center ATTN: EMTLD, Doc. Library
ATTN: Carl AustinATTN: Code 533, Tech. Lib. SAMSO/RS
ATTN: RSSCommanding OfficerNaval Weapons Evaluation Facility ENERGY RESEARCH & DEVELOPMENT ADMINISTRATION
ATTN: Technical LibraryDivision of Military Application
Director ATTN: Doc. Control for Test OfficeStrategic Systems Project Office
ATTN: NSP-43, Tech. Lib. University of CaliforniaLawrence Livermore Laboratory
DEPARTMENT OF THE AIR FORCE ATTN: Jerry GoudreauATTN: Mark Wilkins, L-504AF Armament Laboratory, AFSC ATTN: Tech. Info. Dept., L-3
ATTN: Masey Valentine ATTN: M. Fernandez3cy ATTN: John Collins, AFATL/DLYV
Los Alamos Scientific LaboratoryAF Institute of Technology, AU ATTN: Doc. Control for Reports Lib.
ATTN: Library, AFIT Bldg. 640, Area B ATTN: Doc. Control for Tom Dowler
AF Weapons Laboratory, AFSC Sandia LaboratoriesATTN: SUL Livermore Laboratory
Headquarters ATTN: Doc. Control for Tech. Library
Air Force Systems Command Sandia LaboratoriesATTN: Technical Library ATTN: Doc. Con. for John Colp
ATTN: Doc. Con. for W. AltsmeirerCommander ATTN: Doc. Con. for John KeizurArmament Development & Test Center ATTN: [oc. Con. for 3141, Sandia Rpt. Coll.
ATTN: Tech. Library ATTN: Doc. Con. for Walter HerrmannATTN: Doc. Con. for William Caudle
Assistant Secretary of the Air Force ATTN: Doc. Con. for William PattersonResearch and DevelopmentHeadquarters, U.S. Air Force U.S. Energy Rsch. & Dev. Admin.
ATTN: Col R. E. Steere Albuquerque Operations OfficeATTN: Doc. Con. for Tech. Library
Deputy Chief of StaffResearch and Development U.S. Energy Rsch. & Dev. Admin.Headquarters, U.S. Air Force Division of Headquarters Services
ATTN: Col J. L. Gilbert ATTN: Doc. Con. for Class. Tech. Lib.
Commander U.S. Energy Rsch. & Dev. Admin.Foreign Technology Division, AFSC Nevada Operations Office
ATTN: NICD, Library ATTN: Doc. Con. for Tech. Lib.
Headquarters, USAr/INATTN: INATA
79
OTHER GOVERNMENT AGENCIES DEPARTMENT OF DEFENSE CONTRACTORS (Continued)
NASA Honeywell, IncorporatedAmes Research Center Defense Systems Division
ATTN: Robert W. Jackson ATTN: T. N. Helvig
Office of Nuclear Reactor Regulation Institute for Defense AnalysesNuclear Regulatory Commission ATTN: IDA, Librarian, Ruth S. Smith
ATTN: Robert HeinemanATTN: Lawrence Shao Kaman Avi~yne
Division of Kaman Sciences Corp.DEPARTMENT OF DEFENSE CONTRACTORS ATTN: Technical Library
Aerospace Corporation Kaman Sciences CorporationATTN: Tech. Info. Services ATTN: Library
Agbabian Associates Lockheed Missiles & Space Co., Inc.ATTN: M. Agbabian ATTN: M. Culp
ATTN: Technical Librar-yApplied Theory, Inc.2cy ATTN: John G. Trulio Lockheed Missiles and Space Co., Inc.
ATTN: Tech. Info. Ctr.,D/Coll.Avco Research & Systems Group
ATTN: Research Lib,, A830, Rm. 7201 Martin Marietta AerospaceATTN: David Henderson Orlando DivisionATTN: William Broding ATTN: W. HurtATTN: P. S. Soderstrom ATTN: L. Kinnaird
ATTN: J. RickeyBattelle Memorial Institute
ATTN: Technical Library Merritt Cases, IncorporatedATTN: Technical Library
The BDM Corporation ATTN: J. L. MerrittSATTN: Technical Library University of New Mexico
The Boeing Company Dept. of Campus Security and PoliceATTN. Aerospace Library ATTN: G. E. Triandafalidis
California Research & Technology, Inc. Nathan M. NewmarkATTN: Technical Library Consulting Engineering ServicesATTN: Ken Kreyenhagen ATTN: Nathan M. Newmark
Civil/Nuclear Systems Corp. Pacifica TechnologyATrN: Robert Crawford ATTN: R. BJork
ATTN: G. KentEG&G. Inc.Albuquerque Division Physics International Company
ATTN: Technical Library ATTN: Doc. Con. for Dennis OrphalATTN: Doc. Con. for Tech. Lib.
Engineering Societies Library ATTN: Doc. Con. for Larry A. Behrmannt ATTN: Ann Mott ATTN: Doc. Con. for- Charles Godfrey
General Dynamics Corp. R & D AssociatesPomona Division ATTN: J. G. Lewis
ATTN: Keith Anderson ATTN: Cyrus P. KnowlesATTN: Arlen Fields
General Electric Company ATTN: William B. Wright, Jr.TEMPO-Center for Advanced Studies ATTN: Paul Rausch
ATTN: DASIAC ATTN: Harold L. BrodeATTN: Henry Cooper
Georgia Institute of Technology ATTN: Technical LibraryGeorgia Tech. Research Institute
ATTN: L. W. Rehfield The Rand CorporationATTN: S. V. Hanagud ATTN: Technical Library
80
DEPARTMENT OF DEFENSE CONTRACTORS (Continued) DEPARTMENT OF DEFENSE CONTRACTORS (Continued)
Science Applications, Inc. Terra Tek, Inc.ATTN: Technical Library ATTN: Technical Library
Stanford Research Institute TRW Defense & Space Sys. Grouptit ATTN: George R. Abrahamson San Bernardino Operations
ATTN: J. D. Colton ATTN: E. Y. Wong, 527/712
Systems, Science and Software, Inc. Weidlinge r Assoc. Consulting EngineersATTN: Robert Sedgewick ATTN: J. M. McCormickATTN: Technical Library ATTN: Melvin L. Baron
TRW Defense & Space Sys. Group Weidlinger Assoc. Consulting EngineersATTN: Peter K. Dai, R1/2170 ATTN: J. IsenbergATTN: Tech. Info. Center/S-1930
81