c. l. g. bell and p. b. r. hazell - world bank bank reprint series: number 154 c. l. g. bell and p....
TRANSCRIPT
World Bank Reprint Series: Number 154
C. L. G. Bell and P. B. R. Hazell
Measuring the Indirect Etfectsof an AgriculturalInvestment Projecton Its Surrounding Region
Reprinted with permission from Amtiericanr Jolorinal of Agricultural Econotmics, vol. 62, no. 1(February 1980), pp. 75-86.
Pub
lic D
iscl
osur
e A
utho
rized
Pub
lic D
iscl
osur
e A
utho
rized
Pub
lic D
iscl
osur
e A
utho
rized
Pub
lic D
iscl
osur
e A
utho
rized

Measuring the Indirect Effects of anAgricultural Investment Project on ItsSurrounding RegionC. L. G. Bell and P. B., R. Hazell
Agricultural investment projects may generate important downstream benefits for theregions in which they are located. Using a semi-input-output model of the regionaleconomy, an attempt is made to quantify the downstream benefits generated by anirrigation project in Malaysia. In aggregate the project's downstream effects on regionalincome were of an order similar to its direct effects, but the main beneficiaries of thedownstream benefits were the nonfarm households. Each dollar of downstream incomeprobably was supported by just over a dollar of additional investment in the localeconomy.
Kev wt ords: gro%% th lilkages, input-output analysis, Malaysia, project appraisal,regional development.
Investment pr,,jects may generate substantial It is also of interest to ascertain how theindirect effects, or pecuniary external econo- indirect (or "downstream") effects of a proj-mies, as Scitovsky would call them. These ect affect the distribution of incomes. For ex-effects stem partly from production linkages. ample, while an agricultural project may gen-First, the project will generate demands for erate a strong rise in the incomes of all farminvestment and intermediate goods. Second, households, the resulting downstream benefitsthe rise in output due to the project may may be reaped by richer nonfarm households.cheapen supplies to other sectors, and so in- There is also a regional dimension to this is-crease the profitability of new investment in sue. Suppose an agricultural project producesthose sectors, a case which has been analyzed powerful downstream effects upon its sur-extensively by Chenery. But consumption rounding region, which was previously poor.linkages also come into play if the extra in- Then, as Mellor has emphasized, income dis-come flowing from the project boosts the level parities among agricultural regions will be in-of final demand in the economy. Hirschman, creased all the more, even though the incomein arguing for the relative neglect of agricul- gap between industrial regions and that receiv-ture in development strategies. discounted the ing the project will narrow.value of these linkages for agricultural invest- Another consideration is that knowledgements. Recently, howvever, both Mellor and about the structural sources of downstreamJohnston and Kilby have renewved debate on effects could be useful in improving the designthe importance of these linkages for economic of integrated regional development stirategies.growth in developing couintries, with Mellor In particular, if the structture and relativelaying particular stress cn the importance of strength of linkages are known, then publicfinal linkages arising fro.n increases in agricul- pclicy can attempt to see that such linkagestural incomes. function without firiction.- _ -In this paper we propose and apply an ap-Clive Bell and Peter Hazell are economists with the Develepment proach to measuring the magnitude and inci-Research Center of the World Bank. dence of regional downstream effects, based
The authors are indebted to Bela Balassa, Shanta Devarajan, on a social accounts matrix (Pyatt et al.) and aGraham Pyatt, Anandarup Ray, T. N. Srinivasan, and two anon-ymous referees for helpful comments on 'arlier drafts, while variant of Tinbergen's semi-input-outputexempting them from all surviving errors. SpcC'i bhanks are also method. We begin by sketching the main fea-due Roger Slade for helpful discussions about many of our data tures of the Muda River project and surround-assumptions. The views expressed here are those of the authorsand do not necessarily reflect those of the World Bank. ing region in northwestern M-lalaysia, the sub-
Copyright 1980 American Agricultural Economics Association
76 Fclruarv 198() Anter. J. Agri. Econ.
ject of our empirical application. Next, we We have disting,uished betwe :n five house-discuss the considerations influencing our hold classes to reflect the income distributionchoice of methodology and then present the aspects of regional activities, Our definitionssemi-input-output model on which the quan- rest on socioeconomic criteria: in particular,titative analysis is based. Subsequently, we endowments of labor and land access to irri-use this model to estimate the direct and indi- gation, and sector of employment. The threerect effects of the project at maturity (in 1974) agricultural household classes within the proj-on output and incomes in the regional econ- ect area are: (a) "landless" households,omy. In so doing, we also estimate both the which derive most of their income from em-pace and pattern of the region's growth over ployment on other paddy farmns: (b) "laborthe period 1967-74 and those which would abundant" farm households, which possess ahave occurred in the hypothetical event that high ratio of family labor to area operated; andthe project had not been undertaken, Finally, (c) "land abundant" households, which hirewe provide some sketchy estimates of all the in substantial amounts of nonfamily labor.balancing investmnents needed to support the Clearly, the household's endo nments of landdownstream incomes generated by the proj- and labor aie connected intimately with itsect. labor market transactions, which underlie the
definitions adopted here.Farm households oLtside the project area
The Project and Its Region are engaged heavily in "other agriculture" aswell as the production of rubber and-Or unirri-
The project invol%ed a total investment over gated main season paddy. They also supplythe period 1967-73 of about $270 million in the labor to households in the project area at theform of dams, a canal system, feeder roads, times of peak activity in paddy culti-vation. Asand drainage infrastructure for the irrigation of their economic activ ities are differeint from240,000 acres of paddy land.' Before irriga- those of farm households within the projecttion, a single paddy crop was grown each year area, and there is an intrinsic interest in whatin harmony with the rainfall pattern. Double happens to households outside, but on thecropping followed irrigation. and the accom- periphery of, large development projects, theypanying initroduction of quicker maturing, fer- merit the status of a separate household cate-tilizer--responsive varieties also has increased gory.yields. The inconmes of the 51,000 farm house- Nonfarm households account for 35(; JNf theholds in the project's command area almost region's populattion, and they display widedoubled over the period 1967-74, and the re- variations in income and wealth. Ideally,gion claimed new prominence as the supplier therefore, they should be subdivided into fur-of some 40; of Malaysia's annual rice re- ther categories. Hlowever, data to place themquirements. Nevertheless, the region is still in more refined classes were lacking. A ma-relatively poor, with a per capita gross domes- jority of nonagricultural households are ethnictic prodLuct in 1972 of $600 compared to $1100 Chinese, who generally enjoy higher perfor M;alavsia as a whole. capita incomes than the predoomin-antly rural
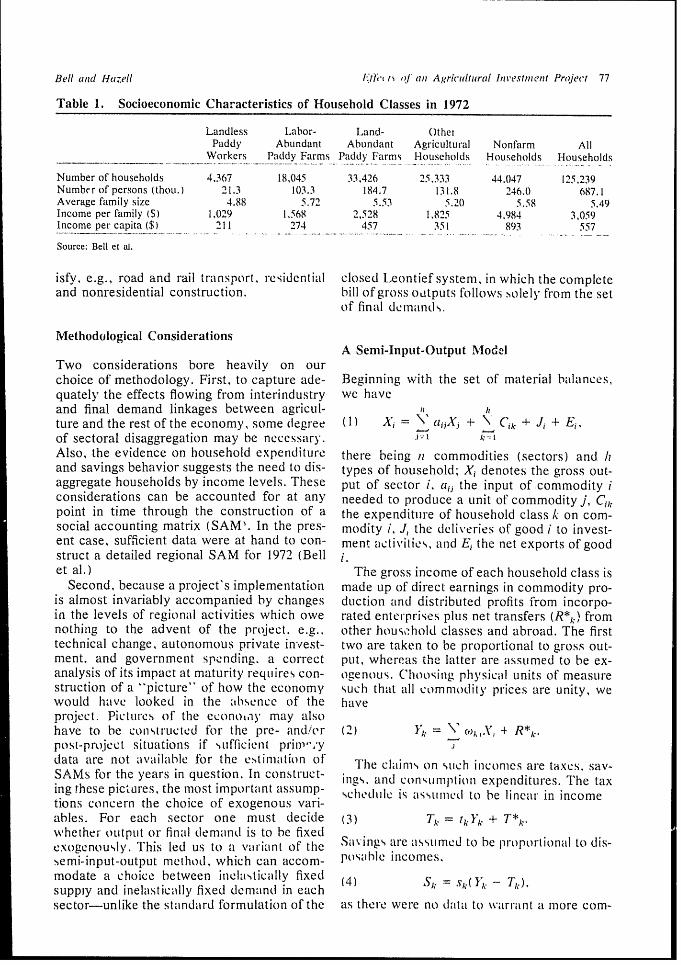
The basis foi the spatial definition of the Malays. A sumnmary pictuLre of population andregional econiomy is diiscussed in a United Na- incomes for these classes in 1972 is set out intions FAOfIBRD Report (pp. 22-24). In brief, table 1.the region encompasses the whole of the state The region's production structure was dis-of Perlis aand abouLt half of Kedah. It comprises aggregated into the thirty-five sectors listed inthe irrigation command area, a further 70,000 table 3. These definitions are generallyacres of low-lying, rain-fed paddy land, and a straightforward. Cases arose where two orfringe area made up nmostly of rubber small- more sectors produced the same commodity.holdings. The region's population was 687,100 This happened becLiause either the commodityin 1972. 16%c of whom were resident in towns was produced underl differenti institutional ar-with 5,000 people or more, and 81%- lived rangements with important differences inwithin the bouLndaries of the irrigation com- technology and,for in the distribution of sec-mand area. toral value added among households, e.g.,
small and commercial rice mills, or becau11seAll monetary values are in 1972 Malaysian dollars uLnless oth- the commodity took different forins according
erwise indicated, to its end use or tyne of demand it couild sat-
Bell (atnd Hazell 1. oe an et Agricultural Iniestmnent Project 77
Table 1. Socioeconomic Characteristics of Household Classes in 1972
Landless Labor- Land- OttlerPaddy Abundant Abundant Agriculttiral Nonfarm All
Workers Paddy Farms Paddy Farms Households Households Households
Number of households 4,367 18,045 33,426 25,333 44,047 125.239Number of persons (thou,) 21.3 103.3 184.7 131.8 246.() 687.1Average family size 4.88 5.72 5.53 5.20 5,58 5.49Income per family (SI 1,029 1,568 2,528 1,825 4.984 3,059Income per capita ($ 211 274 457 351 893 557
Souirce: Bell et al.
isfy, e.g., road and rail transport, residential closed Leontief system, in which the completeand nonresidential construction. bill of gross outputs follows solely from the set
of final demaln(ds.
Methodological ConsiderationsA Semi-Iinput-Output Model
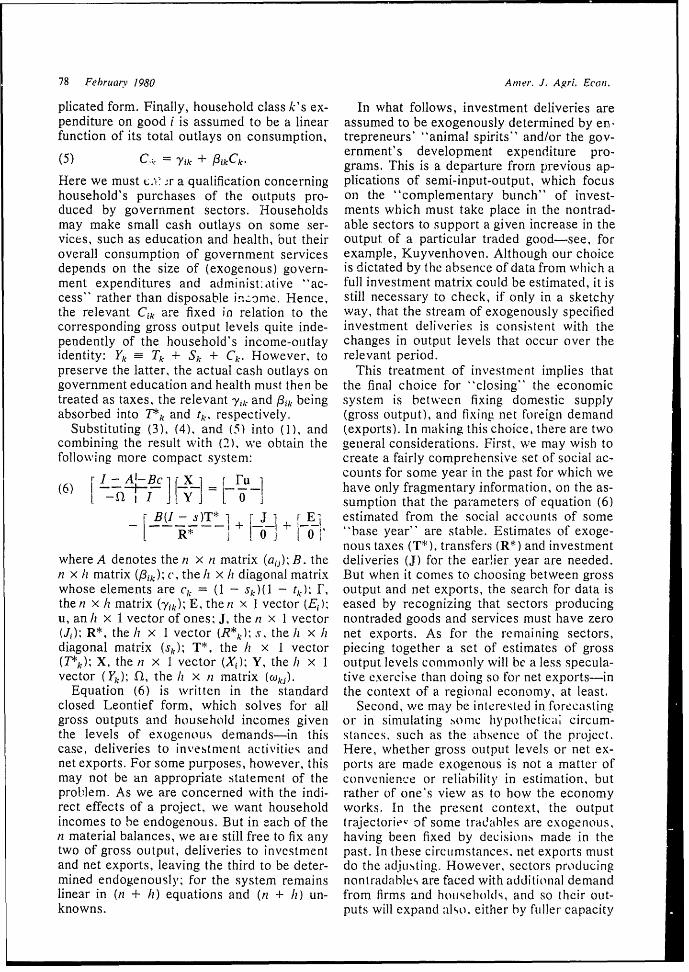
Two considerations bore heavily on ourchoice of methodology. First, to capture ade- Beginning with the set of material balances.quately the effects flowing from interindustry we haveand final demand linkages between agricul- hture and the rest of the economy, some (egree (1) , = liN j A" + N\ Cik + Ji + E.,of sectoral disaggregation may be necessary. lk Pt
Also, the evidence on household expenditure there being ni commodities (sectors) and Iiand savings behavior suggests the need to dis- types of household; Xi denotes the gross out-aggregate households by income levels. These put of sector i, a,j the input of commodity iconsiderations can be accounted for at any needed to produce a unit of commodity j, Cikpoint in time through the construction of a the expenditujre of household class k on com-social accounting matrix (SAM,. In the pres- modity i, J, the deliveries of good i to invest-ent case, sufficient data were at hand to con- ment activities, and E, the net exports of goodstruct a detailed regional SAM for 1972 (Bell i.et al.) The gross income of each household class is
Second, because a project's implementation made up of direct earnings in commodity pro-is almost invariably accompanied by changes duction and distributed profits from incorpo-in the levels of regional activities which owe rated enter prises plus net transfers (R*kl fromnothing to the advent of the prolject. e.g., other house~hold classes and abroad. The firsttechnical change, autonomous private invest- two are taken to be proportional to gross out-ment, and government spending. a correct put, whereas the latter are assumed to be ex-analysis of its impact at maturity requLires con- ogenous. Choosing physical units of measurestruction of a "picture" of how the economy such that all comnmodity prices are unity, wewould have looked in the absence of the haveprorject. Pictures of the cconolay may alsohave to be coistructed for the pre- and/er (2) Y,k \ (c)&,., + R*k.post-project situations if hufficieiit primn- 4 y Jdata are not available for the estimia.ition of The clims on such incomes are taxes. say-SAMs for the years in question. In construct- Ties. and con,dmn ption expenditures. The taxing thiese pictares, the most important assump- schedulle is asstImied to be linear in incometions conicer-n the choice of exogenous vari-ables. For each sector one must decide (3) 7=k = tYkl,I + T*k.whether OLutpuIt or final demrand is to be fixedex)ogenously. This led us to a variant of the Salvngs are assume. to be proportional to dis-semi-input-output method, which can accom- poNsble incomes.modate a choice between inel;ihticalll' fixed (4) S Sk(', -supply and inelastically fixed demaLn(d in eachsector-unlike the standard formulation of the as ther-e were no data to warrant a more com-
78 Februtary 1980 Anmer. J. Agri. EcaGi.
plicated form. Finally, household class k's ex- In what follows, investment deliveries arependiture on good i is assumed to be a linear assumed to be exogenously determined by enrfunction of its total outlays on consumption, trepreneurs' "animal spirits" and/or the gov-
5) C Yik + 13kCk ernment's development expenditure pro-(5) Y-ik +t /kC grams. This is a departure from previous ap-Here we must c.' ,r a qualification concerning plications of semi-input-output, which focushousehold's purchases of the ouitputs pro- on the "complementary bunch" of invest-duced by government sectors. Households ments which must take place in the nontrad-may make small cash outlays on some ser- able sectors to suppoit a given increase in thevices, such as education and health, but their output of a particular traded good-see, foroverall consumption of government services example, Kuyvenhoven. Although our choicedepends on the size of (exogenous) govern- is dictated by the absence of data from which ament expenditures and administ:ative -ac- full investment matrix could be estimated, it iscess" rather than disposable ic.Lrme. Hence, still necessary to check, if only in a sketchythe relevant Cik are fixed in relation to the way, that the stream of exogenously specifiedcorresponding gross output levels quite inde- investment deliveries is consistent with thependently of the household's income-outlay changes in output levels that occur over theidentity: Y1
3 Tk, + Sk + CA. However, to relevant period.preserve the latter, the actual cash outlays on This treatment of investment implies thatgovernment education and health must then be the final choice for "closing" the economictreated as taxes, the relevant Yik and 3ik being system is between fixing domestic supplyabsorbed into T*k and tk, respectively. (gross output), and fixing net foreign demand
Substituting (3), (4), and (5) into (1), and (exports). In nalking this choice, there are twocombining the result with (2). we obtain the general considerations. First, we may wish tofollowing more compact system: create a fairly comprehensive set of social ac-
r I - A-B X - F counts for some year in the past for which we(6) I-- I have only fragmentary information, on the as-[ - X J[Yj[OI sumption that the paiameters of equation (6)
- B(I - s)T* 1 J J E E estimated fiom the social accounts of someR* O1+ | o '' "base year" are stable. Estimates of exoge-
Inous taxes (T*), transfers (R*) and investmentwhere A denotes the n x it matrix (aij); B. the deliveries (J) for the earlier year are needed.n x It matrix (Pik); C, the /h x Xl diagonal matrix But when it comes to choosing between grosswhose elements are Ck = 1 - Sk)(l - tk,); r, output and net exports, the search for data isthe n x hi matrix (aYik); E, thenz x 1 vector (E1 ); eased by recognizing that sectors producingu, an h x I vector of ones; J, the n x 1 vector nontraded goods and services must have zero(JU): R*, the hI x 1 vector (R*kl,; s, the It x hI net exports. As for the remaining sectors,diagonal matrix (Sk)); T*, the hi x I vector piecing together a set of estimates of gross(7*k); X, the it x 1 vector (Xi); Y, the It x 1 output levels commonly will be a less specula-vector (Yk); Ql, the /t X n matrix (wki)- tive exercise than doing so for net exports-in
Equation (6) is wvritten in the standard the context of a regional economy, at least.closed Leontief form, which solves for all Second, we may be interested in forecastinggr'oss outputs and household incomes given or in simulating .sonme h!pothetica; circum-the levels of exogenous demands-in this stances. such as the aibsence of the project.case, deliveries to investment activities and Here, whether gross output levels or net ex-net exports. For some purposes, however, this ports are made exogenous is not a matter ofmay not be an appropriate statement of the convenience or reliability in estimation, butproblem. As we are concerned with the indi- rather of one's view as to how the economyrect effects of a project, we want household works. In the present context, the outputincomes to be endogenous. But in each of the trajectoriev of some tradahles are exogenouIs,n material balances, we aie still free to fix any having been fixed by decisions made in thetwo of gross output, deliveries to investment past. In these circnumstances. net exports mustand net exports, leaving the third to be deter- do the adjusting. However, sectors producingmined endogenously; for the system remains nontradables are faced with additionial demandlinear in (n + h1) equations and (n + hi) un- from firms and hoLuseldOWs, and so their out-knowns. puts will expanid ako. either by fuller capacity

Bell and HIazell ElY 'rs of ani Agricuiltuiral Investtietit Project 79
utilization or, if enough time is allowed, by Equation (7) is the semi-input-output modeladditions to existing capacity. But excess from which our empirical results were de-capacity or not, the key assumption is that the rived,production of nontradables takes place at con-stant costs, which implies that short-periodsupply bottlenecks, and hence the rises in The Growth of the Regional Economy: 1967-74prices which accompany them, are ignored. Inthis respect, the analysis set out is in keeping Before embarking on a discussion of how thewith the general recommendations concerning exogenous variables and their values werethe treatment of nontradables offered, e.g., chosen, two important implicit assumptions inLittle and Mirrlees. ouIr use of equation (7) should be noted. First,
The foregoing discussion can be translated the effects of changes in the structure of rela-into a simple, comparative static account of tivo prices were ignored, although in factthe development of a regional economy in the region's barter terms of trade worsenedwhich the source of growth is the expansion of slightly between 1967 and 1972, before improv-the primary sector. In each "period," the ing strongly over the next two years. But ifsupply of output from this sector is fixed, and relative prices are changing, eqLuIation (7) willthe region faces a perfectly elastic "foreign" be free of error in generating real value addeddemand curve for its products. By contrast, (measured in units of own output) if, and onlythe supply of nontradables is perfectly elastic, if, intermediate inputs form a Cobb-Douglasand foreign demand for these goods is per- aggregate in each sector. And even then, therefectly inelastic (at zero). are likely to be substitution effects in house-
Let the subscripts T, D. and N denote. re- hold expenditure patterns. It should be notedspectively, the following sets of sectors: trad- also that while the exogenous quantity flowsables, distributive and transport services, and that drive (7) are those which occurr-ed at theother nontradables. Noting that the set of en- prices which actually ruled (at one time ordogenous variables is the vector (ET, XI'; XN; another), all inputs and outputs are valued atY), equation (6) can be rearranged as base year prices, Hence, changes in the barter
I -X -> terms of trade are not allowed to alter theLL .TD-.. L AT I-B,c E levels of real inconmes through the usual effects
I - ADDI B A -B X = of Changes in prices on nominal value added;(7) t_DTPI- t -- AXTJ,-BNC X t they do so only through their effects on the
-•O - Q -Qn. I I 1 - output of tradables. The only alternative tomaking a foray into the difficult terrain of price
FrTU - JT BT(I - S) 71 endogenous systems is to take the position-DU +F B!,(I =S)T$ that these blemishes are the price to be paid in
IEvU - B,\(I - s)T* using a tractable system sLich as (7).L O - -Second, with the two following exceptions,
-I -A11 it was assumned that the struIctural parameters- 1 ±.A7I 01 0 0 [ XT of equation (7) also ,emniined stable in the face
+ A A,7. V6 ,a70 0 j of all other influences. First, there were theEL[ I EX ' changes in paddy produiction technology and
L E17. I 01 0 II L-R' the distribLution of the sector's value aiddeLdfwollowing the introdtict ion of irrigation and
where ind,trand spo are the matrices of distribu- new paddy varieties. Second. there have beentive tradd transport margins on the net expo'ts changes in the region's population and in theof tradlables and nontradables, respectmvely.- pattern of seasonal migration associated with
paddy cultivation.Wher-e the paddy1 sector is co ncerned, the
It may happen that some sectors face completely inelastic, estime the techol is anddistrbalbeit positive. "foreign" demand. In that case, they are produc- estimates of the technolog (,-,) and distribu-ing nontradables at the margin and are treated as such in the tion (51,) vectors are derived largely from aanalysis. the vector of these foreign demands being E,. It should programming model which predicts inputs,h,e- noted also that diNinhuive anid transport margins ire ctrned ongross rather than net flows, so that the f'ormilation in equation (7i output, land retnts, and wages, given certainis strictly correct only when there are no contpetilu%c imports for resouLrce endownment and the prices of trad-those sectors which export. In the empirical application pursued ables. The important changes in technology be-below, that is a defensible approximation to the observed trade1967 nd 174 ere the bstittion ofpatterns.tw c 19 7a d 17 w i- tt si,ttton f

80 FebruarY 1980 Amer. J. Agri. LEon.
mechanical for animal draught power and the figure heavily in the decision to migrate, aremore intensive use of fertilizer on new, high- unlikely to have been revised sharply in theyielding varieties. There was also a mrarkled immediate aftermath. It seems plauisible thatincrease in the proportion of value added pa; I the surge in real incomes between 1971l andas wages to migrant laborers from the non- 1974 should have done sonmethilng to stem theproject area and other regions, although the outflow of permanent migrants fi-om the re-real wage rate rose only slightly. The distriboi- gion. But in the absence of any evidence, wetion ef value added among households under- were reduLced to guiessing thill the farm andwent more radical changes, the most notewor- nonfarm populations were rising at 1Vc and 2%thy being the fall in the share of nonproject per annum, respectively, between 1972 andfarm households, which continued to cultivate 1974.a single crop, although they did benefit fromadditional wage earnings within the project Exogenoms Variables fi) 1967area. The ,hares of output paid as wages toworkers from landless and nonfarm house- Recall that an attempt to construct a detailedholds both increased somewhat, while that picture of the economy as it was in the pastpaid as rents (some of which accrued to ren- need take account only of data availabilitytiers among nonfarm households) stayed vir- when it comes to choosing between fixing ex-tually constant. These shifts are presented in port or output levels for each sector. The sec-summary form in table 2. tois comprising the agriCUIlUral complex
As for population grom th, this affects the (I-l1) all produce tradable good,. With thedemand system by altering the intercept exception of sector 10, it was pos,sible to de-terms, i.e.. the {'Yik}. though leaving the mar- rive estimates of gross outpult. Fortuinately, inginal expenditure proportions {13A un- the case of sector 10, there were relevant datachanged. 3 The only population data available ftr estimating exports in 1967. The only otherare contained in the two CensLuses of 1957 and sector producing tradables is (14), and once1970. The quinquennial grow th rates for these again data were available on its export com-two subpopulations were 4.6's and 3.7%, re- ponents. In the remaining sectors, of course,spectively. These rates are assumed -Lo hold net exports were set at zero, although it shouldfor the period 1967-72, because only after 1971 be noted that the otlptt levels of the fourdid farm incomes begin to rise strongly in i-e- gov'ernment sectors are kno)wn and given in-sponse to the arrival of irrigation: and expecta- dependently of demand.4 Deliveries to in-tions about alternative income levels, which vestment activities are made only by sectors
10, 14, 26, and 27. Again, the sources for theIn period r. the expenditure of the Ath class of hourehold on 1972 estimates provided the data for their 1967
the ith commodity is counterparts. Of the remaining exogenousC,01) -Y,k + P,(1 variables, net private transfers to households
If the population grows by gk percent and expenditure per family were set at their 1972 levels, these being verystays constant, then (ktt) grows by gk percent diso. If. however, sma,ll and there being no other basis fotr a set ofthe population is stationary and expenditure per Famil) groxs byEk percent. then
C,;t + Yk 4. ±3 07=n =kh(7 00 To bi exact. they are comnpleick independent of householdC'ombining the two, we get incomes, but sIighl% dependent on .acii iIt levels in other sectors
through weak interndustry linkages The .1101ic;i11%iio to hotise.C,ktt + t) - 9k) g)y + ,kt(l ± gk)(tl + 4k)l(kitt holds are given cogenously and the ismmlhi supplics to satisfy
4( gk)Yk + 4kCk" + 1i intenndustry demands are endogen1ou10t determined.
Table 2. Household Sihares in Gross Output from the Paddy Sector (Q1,)
Household Class 1967 1972 1974 1974a
I Landless (1.0179 (.0190 0.0207 0.01682 Labor abundant (0.1436 0.1442 01.1499 0(14513 Land abundant 0.4658 0.4675 0.4859 0.47054 Nonproject farm 0.1846 l.1188 0.1 138 0.171(05 Nonfarm 0.0475 0(.05401 (1(159(1 0.046(0
Total (1.8594 (1 0.8293 (0.8494
a In the absence of the project

Belanihae! f'/ t.¶ of' on Agricultural Inlv(stmnlcn Prooif 8 1
1967 estimates. Finally, "exogenous" taxes f'ect, then, the output of this sector- in 1974 was(T*k) on households were estimated in the demand-driven. Net pr-ivaite transfers weresame way as for the 1972 SAM. These taxes kept at their 1972 levels, and exogenous taxestake the form of licenses, fees, and duties, and on hiouscholds were estimated on the sameare levied independently of income levels, basis as before.
E.,ogvnouA. Variablesfito 1974 7The Results'
The relevant sectoral outputs, exports, and Trhese values of the CX0geno0us variables gen-investment deliveries were estimated in -similar erate the salient flows in the economy duringfashion to those for 1967 It also should be 1967 and 1974 which are set out in tables 3 andnoted, however, that (he treatment of sawmill- 4, along with their- CouLntet parts from the 1972ing for 1974 differ-ed from that for 1967 in that SAM. Gross output rose by 55"( over thenet exports were set at their 1972 level. This- seven-yerr per-iod, the largest absolute con-choice reflects the fall in the volume of tribution being made by the paddy sector,Malaysia's timber exports during the 1974 which accouinted for about 2lCi of the total inworld recession and accords well with the 1974. Regional Va1lue added grew slightlyviews expressed by local businessmen. In ef- faster than gross output, as ouitput incr,easNed at
Table 3. Regional Gross Outpuit and Valuie Added in 1967, 1972, and 1974 ($10,000in 1972 Prices)
1967 1972 1974 l974a 0) lot ii.- () 100Sector (1) t2) (3) 14) T( a 4)
19 24,819* 35,553* 42,69 1 28,652* 172.0) 149.010 Otlher agriculture 1,375 1.782 2.295 1,972 166.9 116.411 Sawmilling 736* 990 954 838 129.7 113.81 2 Agr. machinery
services 124 257 311 1 35 2501.8 230.413 Machinery repairs 472 595 662 460 140.4 143.914 Manur,ACrUring not
elsewhere classified 1.867 2.141 21,244 1,983 120.2 1 13.,215 Road trainspor-t 1.196 1,634 1,993 1.513 166.7 131.716 Rail transport 64 104 137 89 214.8 153.917 Hotels & restaurants 989 1.435 1.823 1.497 184.3 121.818 Entertainment 300 468 599 468 199.7 128.019 Services not elsewhere
cla,'.ified 77 123 170 112 220.4 151.820 Private health 273 349 418 341 153.3 122.621 D1)i.ribuitive trades 2,864 4,038 4.835 3,541 168.8 136.522 Pletty trading 245 326 408 303 166.6 134.723 Flectricitv 377 485 570 494 151.3 115.424 Water 186 246 299 249 160.2 120.125 Posts &
telecommunicafions 125 229 37/7 241 253.3 1311.526 Res,idential
cosrcin1,066 1,834 1,853 1.3 17 173.8 140.727 Other construction 6,150 3,639 2,166 1,864 35.2 116.228-31 Government' 6,764* 9,777* 12,445* 12.t010* 184.0) 10)3,632 Trad. financial services 272 451 595 353 219.0 168.633 Modern financial
services 171 2313 289 157 169.1 184.134 Urban housing 1,297 1,825 2, 24 3 1.846 176,7 121.535 Rural houtsing 2,053 2,640 3,186 2.467 155.2 129.1
Total 53,854 71,154 83,503 62.902 155.1 132.8Total Value Added 30.507 41,889 50.575 38.827 165.8 130.3
Note: * r)enotes output level fixed e.-,ogcnousl',.Souirce: The data source for 1972 is Bell et aL.In the absence of the project.These are. respecti'ely, commercial rice mills, small rice millk, food processing, fish processing. paddy production, fishing, estates
rubber, s,maliholder ruibber, rubber prLIC%s'ing.IIrrigation, education, healtih, and other services, respectively.

82 Februar. 1980 A1er. J. Ag,ri. Ec5on.
Table 4. The Level and Distribution of Per Capita Household Incomes (in 1972 prices)
Income 1967 1967a 1974 1974a
Household Clas Total Paddy Total Paddy Total Paddy Total Paddy
I Landless 131 75 130 75 242 166 140 732 Labor abundant 180 124 177 124 330 247 199 1313 Land abundant 297 224 295 224 556 448 326 2374 Nonproject farm 271 125 269 125 424 147 387 1215 Nonfarm 697 17 631 17 1,034 40 904 17
All 412 111 387 111 660 204 521 115
D1> the absence of the project.
a greater-than-average rate in large sectors Autonomous Growth and the Impactwhich have a high ratio of value added to gross of the Projectoutput, such as paddy, smallholder rubber,and government. At a more disaggregated Beginning with the a1ccoUnting. denote thelevel, gross output from the agricultural com- vector [X, YJ by Z, and let Z' stand for theplex expanded by 70's, noteworthy details vector of gross outputs and household in-being a doubling of paddy production, big comes in the absence of the project. We havejumps in srnallholder rubber output (8) and the identityrubber processing (9), and the fact that small-scale rice 'nills expanded eoutput much more (8) l
rapidly than commercial ones. Elsewhere in (Z,194 -- 967)
the economy, there were broad gains in trans- The left-hand side is the net impact of theport (15, 16), serVices and dislributive trades project in 1974. The first term on the right-(17-22), and utilities (23-25). Residential con- hand side is the change in Z between 1967 andstruction (26) boomed, but there was a steep 1974 in the hypothetical event that there haddecline in nonresidential construction (27) as been no project constrLuction work in 1967;work on the Muda irrigation project tailed off and the second term is the set of "autono-from its 1968 peak. Current outlays by gov- mous'" changes in the regional economy overernment (28-31) increased substantially. the period, i.e., the changes that would have
In aggregate, household incomes grew by occurred had there been no project. Thus, tojust over 7.5%" per annum between 1967 and examine the source., of growth in a 'causal"1974. This rapid rate also was accompanied by way, we must construct hypothetical picturessignificant shifts in income distribution. The of the economy for both years.incomes of all households in the project areagrew at about the same rate. A more rapid 1967 vhilwuit(0 Projectgrowth of incomes accruing to landless house-holds from paddy production was offset by a It may seem that we have complicated the taskproportionally larger gain in income from unnecessarily by choosing a starting year innonpaddy sources aclcuing to the two classes which project construjction was alreadyof "landed'" householdls in the project area. underway: but the defense is a simple one.Farm households outside the project boundlar) The data set on which exogenous variableswere less fortunate. beinLg heavily (dependtent would be based is very sketchy for earlieron a single crop of unirrigated paddy and wage years, and we think it better to rest ouremployment in the project area. However, the (minor) hypothetical modifications to 1967 onsharp rise in rubber output from smallholdings the relatively secure foundations of the esti-kept their incomes growing at a fair rate. The mated "actuals" than to estimate "actuals"incomes of nonfarm households grew at only for 1965 (say) on a far shakier data base. Wetwo-thirds of the rate enjoyed by farm house- arrived at our hypothetical picture of 1967 byholds in the project command area, but still making a change in one exogenous variable ofaccounted for 57%r of aggregate household in- the set generating Z1 9 67: investment deliveriescomes in 1974. by sector 27 were cut by $40 million, the dif-

Bell dtaztl fazlTl/ tEti,i f) af .4a A rijult/ural/ Investment Proaject 83
ference being the direct constrLlction demands paddy but faster than that of the relevant con-of the project in that year. sumption basket.
It is worth emphasizing the assumptions As the region supplied about 40%- ofwhich implicitly accompany this change. Mfalay5sia's rice needs in 1974, one might alsoFirst, the outputs of sector 1-9 in the agricul- ask whether the price of paddy would havetural complex are held fixed at their actual risen even more strongly if the project had notlevels in 1967, which implies that they were been Undertaken. However, the country'sunaffected by the demand for factors arising source of marginal ;upplies was imports, prin-out of project construction work. This boils cipally rrom Thailandl and China, and it doesdown, in essence, to assuming that labor was not seem likely that the domestic price, whichin perfectly elastic supply, an assumption was close to the c.i.f. price of imports in 1974,made plausible by the heavy outmigration N%ould have riisen further if there had been nofrom the region between 1957 and 1970. Sec- Muda project.ond, it is unlikely that current government out- In the agricultural comiiplex, the gross outputlays (28-31) would have changed from their levels of the two rice-millingsectors have been1967 levels. Third, in the cases of the remain- left at their 1967 le vels. As the output of paddying sectors, whose output is demand-driven, would have increased modestly in the absencethere is no problem of output capacity because of the pt-oject and there were small net importsa cut in exogenous demand will reduce output of paddy into the region in 1967, this assump-levels. Fourth, private transfers and lump sum tion seems soundl. The gross ouitput levels oftaxes have been left alone. Estimates of the sector s 3, 4, 6, 7, and 9 were set at their actualformers' 1967 "actual" values are already values in 1974, which amounts to assumingtenuous. License fees for vehicles and busi- that, on balance, activity in these sectors wasnesses might have been a little lower in the unaffected by the increased demrand forabsence of project Constr-Lction work, but it is domestic factors and goods generated by thedifficult to gauge by how much. Last, a more project. In the case of smallholder rubber,subtle point: if there had been no construction however, some allowance was made for thework on the project, expectations about the fact that seasonal work in paddy productionfuture may well have been different, perhaps competes with rubber tapping. The level of netwith important consequences for private in- exports from sector 10 would have beenvestment. This, too, has been skipped over; somewhat lower irn the absence of the project.the error, if any, would he in the direction of For after 1970, the buffalo) herd was being runoverstating regional activity levels and in- down rapidly in the face of the advances incomes in the hypothetical version of 1967 pre- mechanization which accompanied the proj-sented below. ect, and this resulted in an increased supply of
animals on the hoof for export. To reflect this,1974 iitlout tihe Project the sector's net exports were set $0.6 million
lower than their actual level in 1974. In keep-The departuires of the hypothetical exogenotus ing with the argUrment in the previous section,variahles from their actual values in that year net export deliveries firom sawmilling were leftare naturally more extensive. The most impor- unchanged at their actual value in 1974. Bothtant of them is, of course, the level of paddy the exports of sector 14 and(l gover nment out-output. The small increase over the 1967 level lays (29-31 ) were also lelt at their- 1974 levels.is largely a reflection of improvements in 'rurning to investment activities, an inspec-yields of the main season crop, which Would tion of the time series of buffalo) livestock be-have occurred even if the piroject had not been tween 1967 and 1973 led to a "guesstimate" ofundertaken. As for the sector's production zero deliveries from sector 10 to investmenttechnology, compared with 1967 there is no aictivities in 1974 in the absence of the project.advance in mrechanization but more intensive Deliveries from sector 14 and government in-use of agrochemicals. The small declines in vestment in housing were taken as given, butthe shares in value added of households sup- private invesitment in urban housing was re-plying labor to cultivating households are the duced by about 50:r to reflect the likely reduc-result of a slight fall in the paddy wage mea- tion in the demand for urban housing servicessured in units of paddy, the nominal wage rate had the project not been undertaken. Invest-having tisen more slowly than the price of ii-icii, ill iuiut hotusing was derived from the

84 Februarv 1980 Am 'r. .I. A..ri. Clon.
Table 5. The Composition of Chiangltes in Per Capita Household Incomes I)ue to the Project ($)
Housiehold ClassSource ofIncome Change 1 2 3 4 5 Total
Paddyoutput effect 66 I)8 195 45 15 95dkitribtinke effect 27 8 16 19) 8 6
Other 9 15 17 13 107 5(Total 102 131 230 37 130 139
expenditures of single-cropping households in was generated in the fornm of "downstreamn'1972. In the case of nonresidential construvc- or inidirect effects. Within the project bound-tion, the tail end of Muda project work was cut ary, houiseholds enjoyed large income gainsout, together with a sizable chunk or the from the advent of irrigation-, farm holseholds(modest) private demand for such output. on the rlegion's periphery gained somewhat
Following earlier practice, private transfers from additional seasonal work in paddy culti-were left at their actual levels in 1974. L.unn vation- and nonfarm houiseholds didt rathersum taxes were altered to reflect "guesti- well, especially out of the incoome-expendititremates" of what the stock of vehicles and the linkages of the system.number of businesses would have been in the It is also of sonic inter-est to decompose theabsence of the projectl These changes alTleCedL total change in income (dtue to the project atmainly nonfarm houlseholds. reduLcing their tax maturity into that derived fiom paddy produc-burden by almost $4.5 million. tion and that fromn all other sourcers. And
The ouly remaining issue is wxether perma- within the former, we distinguiish between thenent outmigration from the r-egion might have pure outptut effect on incomes assuming thatbeen higher if there had been no project. Al- the actual 1974 distribution of Nahle addedthough there is no direct evidence on which to held in the absence of the project and a dis-base an answer, it seems plausible that the trihurib C effect resLulting from ch;anges in therapid rise in incomes between 1970 and 1974 diisrLibutio0n vecto r fl,, where the 'distribu-has induced more people to stay in the region tive" effect is delilned as follo's: the incomesthan otherwise would have been the case. In of holusehiol(d clhss A from sectorj in the tworough and ready fashion, it has been assumed situations are ,.Y, and 1kjXj, rcspectively.that the farm population would have been sta- The ou11tpt" effect is Simply Wt.kJ[Xj -X° ,tionary after 1972, w hereas the nonfarm popLu- and the 'distributive'' effect, l)k, is a residuallation would have grown at 0o.sq per annum. defined by: 1)k + (wkJ[X, - X = JX
(o)AkjXoJ, that is, the "output" and "distribu-
Tle Rc.su.s tive" effects sum exactly to the observedchange in income. In aggregale. the "down-
We begin with the net impact ozf the project at t.ream" income increase was almost two-mWbturityn vizth the, - imp914, laid out inptoeblct thirdIS the magnitude of the direct one, and itmatd 4 v Rioz.l goss outut id about a third *ccrulel overwhelmingly to nonfarm house-3 n .Rgoa rs upti bu hr holds. The noni,croditbiiv effect inhigher, fuelled largely by rises in paiddy) and aget arose ro et that the acttirice-milling OUtput. Taken as a whole, the ag- isgreg use rose y trom the ract thm t the nctileiricultural complex a ccoul nited for aboult 70(' of !197 4 paddy techno]Ogb %Nas nioi-e intensie inthe projiect's net inmpact on aggregate gross lts usoe of intermediate inputs and migrant
Frh''demand-driven''g . I te or than its hypothetical counterpart. so thatoutpuit. For the sdmn-rvn i-LP lc h um of the income parameters 1(cok,a} washeaviest absolute increases occur in sectois smealler in the presence of the project.15, 17, 21. 26, 27, 34, and 35. The gain in To complete the pictLre, let us now look atregional value adde(d due to the project is the "autonomous" chapnges between 1967 atdathoLIt 30Q; of what total value added would 194 (Z 7 tt967)- In the e of thehave been in the absence of the project. As theabsolute gain is $117.5 millioni, of which $67 'The gio,N tutptul estimates for 1967 in the absence of the
million is due to the increase in paddy output. project are not reported in table 3. hey differ only From their 1967then for every dollar of value added generated with project ciunterp.irp' in that total gross output is I'; less at
$490.7 nmillion, the btulk ti ihe dkert'pancy being in sectors 13, 14.directly by the project at MlttUrity, aInother 75.' 15, 21, 26. and 314.

Bell tand IHazeiell A ti .t ot an Asgricultuiral Inve.tnent P'rt'jt X I
project, regional gross output would have in- extra drying capacity to handle a second cropcreased by about 30f-, and value added and and did not exceed $5 million (FAO ITIRD), ithousehold incomes by about 35r. The princi- seems plausible that the conmposition of thepal source of autonomous expansion was the investments needed to support "auitonorrmous"increase in government outlays on both cur- growth and "downstreami- effects %Wolld nOtrent and capital accounts, the former rising be so very dlifferent. Now the autonomousover 80%'C and the latter, which were far increase in valtue added bet ee I 1967 and 1974smaller, by about 50%r. Excluding the agricuil- was $110.4 million, while the "do% nstream''tural complex, the output of the remaining sec- valuLIc added attributable to the piroject attors is demand-driven, so that a failure to matuLrity in 1974 was $50.5 m1illion. Appolirti(n-undertake the project coupled with static gov- ing the $240 million additional investment inernment expenditures under other headings the same ratio as thLat for value aidded. wewould have resulted in regional prodUction arrive at an estimate of $75 miillioni for theand incomes growing at only half their actujal cumulative, undiscounted total in' estinent as-pace over the period. Even so, the autono- sociaited with the steady state "dox%rnstreani"mous growth pattern would not have been an increase in value added.equitable one. As table 4 makes plain, the This estimate is, however, almost certainl)principal beneficiaries would have been non- on the high side: for much of residential andfarm households, Whose incomes are well nonresidential eonstruction was undertakenabove the regional average. Similarly, the in- by the state or federal governments. More-comes of nonproject farm households w2ould over, it is unlikely that extra investments werehave been buoyed by rising rubber output: but made muiclh in advance of the appearance ofthe rises in the incomes of paddy farm house- the pro iect's edownstream" effects in 1970.holds over their 1967 levels Xouldd have been FragmentaryN evidence suggests that annualof the order of 10%. private inxestnient in houising and other buiild-
ings would have been about $7 million Ilox' er inBalancin,g I,,,ustmentv the absenice of the project from 1970 onward.
CuMmulated over four years, this approachTo complete this a&Ialysis of the project's im- yields an estimate of -dow%,nstream--relatCdpact on the region, it is necess:lry to form investments of $38 million. Taking the twosome estimate of the investment needed to estimates together, it seems fairly probablerealize the "downstream" effects. At one ex- that realiuing each dollar Of -do0%nstreancfrtreme it could be assumed that all sectors value added associated with the projectother thart that producing paddy were suffer- needed between $0.75 and $1.5 of complenmen-ing from ! kcess capacity to such an extent that tary investment appropriately distributed overno additional investment was needed to conl- all other sectors.plement the project itself. But this is hardlyrealistic in the light of the investments in build-ings, hoLusing. vehicles, and rice milling which Conclusionsaccompanied the surge in incomes after 1970.Unfortunately, the a1Vailable data provide only It must be emphasi/ed that the frailties of thea sketchy investment series for the period in dataz base, and the nminy aslsunmptions thus en-question, so the following estimates of in- tailed in deriving results, demand some cau-vestments related to ''downstrealm'' effects tion in drawk ing conclusio ns fiom the empiricalare inevitably somewhat tentative, analysis. Nevertheless, the hroadkl OFders of
For present purposes. the relevant invest- magnitULde of certain key variables should bement deliveries were made by sectors 14, 26. sufficiently solid to warrant some confi(lenice27, and imports. An estimate of the investment in our main findings. In aggregate. the MIIidaneeded to realize both "autonomous'" and project's downstrealm effects w\ere of the same"downstream" increases in regional value order as its direct effects: for every additionaladded is obtained by omitting co)nstruction de- dollar of value added in paddy prodluctionliveries to the Muda project, WithoLut dis- generated by the project at maturity, about 75;counting, this investment reached a CumlIla- of value added were generated by dowk.nstrearmtive total of $240 nmillion in 1972 prices. Lea'.'- effects. Also, each dollar of dowrnstreim valueing aside additional investments in the rice- added probably was suppoorted by just over amilling sectors, which took thie form mainly of dollar of additional investment in plant and
86 Fehruiary 1980 Ainer. J. Agri. Econ.
equipment spread appropriately over the sec- Referencestors which expanded in response to the proj-ect. The dire :Gt effects of the project did not Bell, Clive, Shanta Devarajan, Peter Hazell, and Rogerworsen the distribution of income among Xffrm Slade. "A Social Accounts Analysis of the Structurehouseholds, but its downstream added value of the Muda Regional Economy." Mimeographed.accrued mainly to the nonfarm households en- Development Research Center, World Bank, Wash-gaged in paddy milling and the production of ington, D.C., Nov. 1976.nontradables- Although the spread in nonfarm Chenery, Hollis B. "The Interdependence of InvestmentDecisions.'" The Alloc-ationi of Economic Resources,incomes w,as wide, the lioin's shaire of down- Deiin. /sA/uiw f (n*?iRsJue.s ws w ed. Moses Abramovitz et al. Stanford, Calif.: Stan-stream income went almost certainly to ford University Press, 1959.households which were better-off than those Hirschman, Albert 0. The Strategy of Economic Develengaged in paddy farming. Thus, while the op/nent. New Haven, Conn., and London: Yale Uni-project's downstream effects did much to versity Press, 1958.boost the aggregate income of this relatively Johnston, Bruce F., and Peter Kilby. Agriculture andpoor region, they worsened the intraregional Structural Traun s/fi rmarion. London: Oxford Univer-distribution of income. Last, it is clear that, sity Press, 1975."new technology" notwithstanding, the proj- .ect's production linkages were much weaker pKut Anoetnwd. Leiden, Neth.: Martinus Nynhof.t 1978,than its consumption linkages, for value added Lit I. M .D eidand A ets. Patiu Apprifa andin paddy production accounted for more than Little . M. D., and J. A. Mirrtees. Prijtet Apraisal and80% of gross output. Hence, even allowing for London: Heinemanni 1974.the expansion of paddy milling and agricul- LondonW inem 1974.Mellor, John W. 711e, NVeit Econoni}i'.~ o)t'Groit/llt. Ithaca,tural machinery services, the doubling of N.Y.: Cornell Univer%ir Press, 1976.paiddy output injected into the system far moreFial demand from rising farm incomes than Pyatt, Graham, Alan R. Roe, and associates. Social Ac-demand for intermediates (with final demand coting fin' Development Planning. Cambridge:exogenously xed). While there can be no ambridge Univesity Press, 1977.claim that these findings are typical for all Scitovsky Tibor; "Two Concepts of External Econoinvestment projects in LDCs, we believe that mies." J. Polit. Econ. 62(954):143-51.they provide a plausible first stab at the pa- Tinbergen, J, "Some Refinements of the Semi-Input-Out-rameters for peasant agriculture, at least. put Method." Pakistan Develop. Rev. 6(1966):243-
47.[Receided Jantary 1979; revisionl u(C(c/(tL'd United Nations. FAo IBRD Cooperative Program. Tlhe
Me-a1v 1979.1 Mudttati Stttudy: A First Report. Rome, Sept. 1975.
Reprinted fromAMERICRAN JOURNAI. oF AGRICULTURAL EcONOMICS
Vol. 62, No. 1, February 1980

THE WORLD BANKHeadquarters:1818 H Street, N.W.Washington, D.C. 20433, U.S.A.
European Office:66, avenue d'1ena75116 Paris, France
Tokyo Office:Kokusai Building,1-1 Marunouchi 3-chomeChiyoda-ku, Tokyo 100, Japan
The full range of World Bank publications, both free and for sale, isdescribed in the World Bank Catalog of Publications, and of the continuingresearch program of the World Bank, in World Bank Research Program:Abstracts of Current Studies. The most recent edition of each is availablewithout charge from:
PUBLICATIONS UNIT
THE WORLD BANK
1818 H STREET, N.W.
WASHINGTON, D.C. 20433
U.S.A.