c o n te n ts
TRANSCRIPT
1

Contents
Contents 2
About 3
Executive summary 4
Background 6
Methods 7
Aims and questions 7
The data 8
Data sources 8
Data limitations 10
Data sharing 12
Findings 13
Impact on teachers’ working lives 13
Background 13
Existing data 13
Teachers’ experiences: survey findings 16
Teachers’ estimates of learning loss 20
Background 20
Existing data 20
Estimates of learning loss: survey findings 22
Conclusions from the survey 24
Data gaps 25
Representativeness 25
Data inclusion 25
How well do respondents represent the teaching workforce? 26
Data quality 26
Granularity of data categories 26
Timeliness of data 27
Challenges to geographical matching 27
Data infrastructure 27
Data use and communication 27
Teacher workload and retention 28
Conclusion 29
Technical Appendix 30
Bibliography 32
Open Data Institute 2021 Data on teachers’ lives during the pandemic 2
About
This report has been researched and produced by the Open Data Institute (ODI),and published in March 2021.
The report’s lead author is Miranda Voss. The research for this project was carriedout by the ODI, in collaboration with two partners: Mime, responsible for the datasourcing, analysis and publication; and Allegory, a strategic communicationagency that has worked with the ODI for eight years and is responsible for theresearch project management and communications.
We would like to thank the ODI’s Louise Burke, Mahlet (Milly) Zimeta, JeniTennison and Roger Hampson for their guidance and support, Ellen Goodman forproject management, and Jo Dobie for copyediting. We would also like to thankEmma Thwaites, Charlotte McLeod (Project Lead), Alex Vryzakis and KristinHadland from Allegory; Steve Preston, Joe Miller, Phil Rossiter, Oli Cheng andLucy Thomas from Mime; and Patrick Roach, Chris Weavers, Fred Grinrod andSarah Moran from the teaching union NASUWT.
Open Data Institute 2021 Data on teachers’ lives during the pandemic 3
Executive summary
This report was written in March 2021, at a time when UK schools were beginningto reopen fully for the second time during the coronavirus (Covid-19) pandemic.There were already indications of significant losses to children’s learning andwell-being, but little information on where the losses would be concentrated, andwhere additional resources were most needed. There was also very little dataabout the experiences of teachers during the pandemic; an under-researched areaduring compulsory school closures, but one that is particularly important tounderstand. About 10% of the teaching workforce leaves the profession each yearand this ‘teacher wastage’ is likely to be particularly problematic at a time whenwe need a stable, motivated workforce as children recover from the effects of thepandemic.
For this report, one of the major UK teachers’ unions, the NASUWT, made datafrom a large longitudinal survey of its members available to the ODI. In theNASUWT’s 2021 ‘Big Question’ survey, additional questions relating to teachingduring the pandemic were added. Some 2021 responses were compared with the2019 and 2020 surveys to identify trends. Data from this survey was combinedwith other open and publicly available data by Mime, an educational dataconsultancy, before being anonymised, aggregated and made available forexploration through an interactive tool.
In this report we outline the key findings from this combined dataset, lookingspecifically at the experiences of teachers during the pandemic. We find thatabout half of teachers were required to take on a dual teaching role: providingclassroom supervision to those children still attending school, and providingremote learning to others. Many teachers were unprepared for online learning,particularly older teachers and special education teachers. Most teachers reportedthat their workload had increased significantly in the previous 12 months and weexplore the reasons for that here. Despite the reported increase in workload andlevels of stress, fewer teachers were considering leaving the profession whencompared with surveys from previous years.
Open Data Institute 2021 Data on teachers’ lives during the pandemic 4

When asked for their estimates of learning loss in their classes, 59% of teacherswho responded felt that at least half of their class had lost ground educationally inthe previous 12 months. Losses were estimated to be particularly substantial inprimary schools and in schools in the most economically deprived areas. Whenasked about factors determining children’s engagement with online learning,teachers identified parental support as the most important.
Although there is a large volume of open and publicly available data on theperformance of schools and children, there is very little open data that capturesthe professional views and experiences of teachers. We believe this survey offersvaluable insight into the effects of the pandemic on teaching and learning, and theconditions necessary for recovery. As such, open data like this can usefully informstrategies at this early stage in pandemic recovery. We hope that the openpublication of this dataset will encourage other organisations to open and sharethe data they hold as well, to support the pandemic response and aid educationresearch and policy making.
Open Data Institute 2021 Data on teachers’ lives during the pandemic 5
Background
The ODI’s report ‘Data about children’s lives in the pandemic’, published inNovember 2020,1 explored the experiences of parents, teachers and childrenduring homeschooling, using a variety of data sources, and asked how better datainfrastructure could provide real-time decision-making support to those involved inthe education and well-being of children. It highlighted the additional pastoralroles taken on by teachers during the pandemic, socially patterned educationalattainment gaps, and rises in rates of referral to Barnardo’s children’s supportservices, which were mostly driven by mental health and emotional concerns.Raised levels of stress and anxiety in teachers were also noted.
The report underlined the need for repeated data collection in order to highlightthe ‘changing needs of different groups of children, families and teachers withinthe current period of uncertainty’. The data used in this follow-up report is takenfrom a survey of the members of a large teachers’ union, the NASUWT. The surveywas carried out in March 2021, at a time when the second wave of the Covid-19pandemic was receding and plans were being made to reopen schools to allpupils. This was an opportune time to examine teachers’ experiences of workduring the pandemic, their assessment of children’s learning losses and theirpriorities for full school reopening. This will inform action by policymakers andteacher and child support organisations, both during the resumption of school lifeand during any future disruption to it.
In this report we outline the results of the NASUWT survey of members in England.Following an assessment of data quality, including recognition of its limitations, wepresent summaries of teachers’ professional lives during the pandemic, includingchanges in workload and priorities for school reopening. We combine teachers’opinions with contextual data from a variety of open datasets to assess whichschools and sectors are likely to have experienced the worst learning losses. Theresults of the survey support other published work, reviewed later in this report,indicating that the impact of partial school closures on children’s learning and theirwell-being varies between communities. Schools, particularly in the state sector,play an important role in levelling up opportunities across communities and thereis a very real risk that the loss of this levelling-up function for a year will worsenexisting inequalities in our country.
1 ODI (2020), ‘Data about children’s lives in the pandemic’
Open Data Institute 2021 Data on teachers’ lives during the pandemic 6

Methods
Aims and questions
In this report we explore how data can shed light on the impact of the pandemicon school education, both on the teaching workforce and on teachers’perceptions of the learning and well-being of children. We use survey responsesand open data specifically to look at:
i) The impact of the pandemic on teachers’ working lives
● The teaching roles they took on● Their preparedness for remote teaching● The change in workload● The likely influence of these experiences on workforce retention● Their priorities and concerns about the reopening of schools
ii) Teachers’ estimates of learning losses in their pupils
● The groups of children likely to have experienced the greatest learning lossesfrom partial school closures
● Teachers’ understanding of the reasons behind lack of engagement withonline teaching
iii) How open data can be used to support policy making
● The current gaps in data infrastructure that limit evidence-informed policymaking in this area
Open Data Institute 2021 Data on teachers’ lives during the pandemic 7

The data
Data sources
This report combines data from several sources. We start each of the two‘Findings’ sections (impact on teachers’ working lives and teachers’ estimates oflearning loss) with a short review of relevant, current, published literature. Theprimary data source used in this report was the annual ‘Big Question’ survey bythe teachers’ union NASUWT. The ‘Big Question’ survey is a longitudinal surveythat has been sent to NASUWT members each year since 2011. For the 2021survey, we added additional questions related to teaching during the pandemic.We were also able to compare some responses with data from the 2019 and 2020surveys to identify trends.
The survey was sent to NASUWT members in all four UK nations, the ChannelIslands and Gibraltar, although this interim report only examines the data fromEngland. This is because education is managed differently across the four nations,and the contextual data we matched to was often only available for England.Unions are understandably cautious about sharing information submitted by theirmembers, but, in the context of the pandemic, the NASUWT leadership decidedthat, as long as suitable safeguards to privacy and security were in place, datacreated by its members could usefully inform solutions and policy making in theeducation sector. The ODI hopes that this initiative will encourage otherorganisations that traditionally keep their data closed to share it in a secure waywhen it could inform public decision making.
The survey data allowed us to examine responses by the type of school thatteachers worked in, and by teacher age and gender. Other non-personal, publicdata was taken from the sources listed in Table 1 and geographically matched withthe postcode stem of schools.
Open Data Institute 2021 Data on teachers’ lives during the pandemic 8

Data category Dataset Geographicallevel
Source Link Date datapublished
Licence
Connectivity Residential householdsunable to access 30Mbps
OA* Ofcom www.ofcom.org.uk/research-and-data/multi-sector-research/infrastructure-research/connected-nations-2020/data-downloads
2020 Ofcom termsof use (open)
Economy Income deprivation affectingchildren
LSOA* Ministry ofHousing,Communitiesand LocalGovernment
https://www.gov.uk/government/statistics/english-indices-of-deprivation-2019
September2019
OGL (open)**
Universal credit andjobseeker’s allowanceclaimants
LSOA* Office forNationalStatistics
https://www.nomisweb.co.uk/datasets/ucjsa January2021
OGL (open)
Working 49 hours or moreper week
OA* Census 2011 https://www.nomisweb.co.uk/census/2011/ks604ew
2011 OGL (open)
Health Covid-19 infection rate MSOA* UK Government https://coronavirus.data.gov.uk/details/download Daily update OGL (open)
Demographics Overcrowded households OA* Census 2011 www.nomisweb.co.uk/census/2011/qs412ew 2011 OGL (open)
Lone parent households OA* Census 2011 https://www.nomisweb.co.uk/census/2011/ks107uk
2011 OGL (open)
Teacher workforce National(England)
Department forEducation
https://www.gov.uk/government/statistics/school-workforce-in-england-november-2019
November2019
OGL (open)
Open Data Institute 2021 Data on teachers’ lives during the pandemic 9
Table 1: Additional sources of open data used in this report
*OA, LSOA and MSOA refer to output area, lower super output area and mediumsuper output area, respectively. These are progressively larger geographical unitsof census data. For further information, see:https://www.ons.gov.uk/methodology/geography/ukgeographies/censusgeography**OGL refers to an Open Government Licence
Data limitations
In any research study there are limitations to the data, and it is important to beaware of these in order to interpret the results accurately.
1. The response rate was low. Of the 250,534 teachers in England who aremembers of NASUWT and were invited to take part in the survey, just 4,490completed the survey in the two-week window allowed for data collection forthis report.
In order to determine how representative the data is of the overall teachingworkforce, we compared the profile of survey respondents with the profile ofthe teaching workforce in English state schools and the membership of theNASUWT (Table 2), using data from the most recent school workforce inEngland dataset (from November 2019). The survey results were thenweighted for these characteristics so that the data was more representative ofthe overall teaching workforce (see Technical Appendix).
Open Data Institute 2021 Data on teachers’ lives during the pandemic 10

Table 2: Demographic profile of survey participants compared with the teachingworkforce in English state schools.
2. Teachers are in a strong position to give an opinion about learning losses and thefactors leading to poor engagement in their pupils. However, it is important torecognise that all opinions are subjective and may come with assumptions. Despitethis, we argue that teachers’ professional opinions about their classes’ learningcontribute important and useful data, given that the alternative is extensive, in-depthtesting of children. While testing children directly may improve the data, concernhas been raised about the effect of early reintroduction of statutory testing onchildren’s well-being, after a year when many will have lost ground educationallyand socially.2
3. We anonymised teachers’ responses and aggregated them at the level of schoolpostcode stem. We then combined these responses with other data from theirschool’s postcode in order to understand learning losses in the context of socialand economic factors. However, the school postcode is only an approximation ofthe residential postcodes of the children who attend that school, as the catchmentarea may extend across several postcodes. It is difficult to mitigate against this and
2Institute of Education (2020), ‘Responding to COVID-19, Briefing Note 3: Resetting educationalpriorities in challenging times’
Open Data Institute 2021 Data on teachers’ lives during the pandemic 11

the approximation needs to be borne in mind when interpreting the results.In addition, postcode stems do not exactly match the census areas they aremapped to.
4. Our analysis of children’s learning losses is at school postcode level, not at the levelof individual children. This means that conclusions cannot be drawn about thelosses and needs of individual children. Similarly, our analysis of teacher experienceis drawn from analysis of a sample, when even within schools, teachers’experiences may vary dramatically. Aggregate data can be used to understandtrends and patterns, but cannot be used to make predictions at an individual level.
Data sharing
Mime data consultancy has created an interactive tool to allow others to explorethe findings. This tool can be used for subgroup analysis, but it should be notedthat groupings containing less than 20 individual responses have been removed inorder to preserve confidentiality. The tool is available at:https://theodi.org/article/data-on-teachers-lives-during-the-pandemic-report
Open Data Institute 2021 Data on teachers’ lives during the pandemic 12

Findings
Impact on teachers’ working lives
Background
Over the past year, there has been a lot of attention paid to the impact of schoolclosures due to the pandemic on children, and whether school closure is aneffective public health tactic to prevent the spread of disease.3 Less attention hasbeen paid to the impact on the teaching workforce. This is an important gap, giventhe role of teachers in mitigating the impact of school closures on children’swell-being and learning.4
Existing data
Retaining teachers is a problem in the UK. Around 10% of the workforce leavesthe state sector every year and the pupil:teacher ratio has been increasing since2011.5 The nature of the workload has been implicated. Performancemanagement, loss of autonomy and limited opportunities for both professionaldevelopment and participation in decision-making have all been identified ascauses of ‘teacher wastage’.6 The NHS is another area of the public sector thathas experienced a growth in performance management in recent decades, anddata on retention of NHS staff has noted similar concerns, and highlighted thatsalary increases only partially mitigate the impact on workforce retention.7
Data that monitors trends in teachers’ motivation and engagement with their workcould play a role in assessing the impact of policy decisions on workforceretention. Publishing the data from a large annual survey allows access to thisdata, with the consent of participants, without the intrusion associated withcommercial workforce analytics that analyse employees’ digital activities.8
8 Social Sciences (2019), ‘Big data and human resources management: The rise of talent analytics’
7 BMJ Open (2020), ‘Relationship between labour force satisfaction, wages and retention within the UKNational Health Service: a systematic review of the literature’
6 British Journal of Educational Studies (2020), ‘What motivates people to teach, and why do theyleave? Accountability, performativity and teacher retention’
5 House of Commons Library (2019), ‘Research Briefing: Teacher recruitment and retention in England’
4 British Journal of Educational Psychology (2020), ‘"Like a rug had been pulled from under you”: Theimpact of COVID-19 on teachers in England during the first six weeks of the UK lockdown’
3 BMJ (2020), ‘Effect of school closures on mortality from coronavirus disease 2019: old and newpredictions’
Open Data Institute 2021 Data on teachers’ lives during the pandemic 13
Challenges of adapting to online teaching
Although the term ‘school closure’ is widely used, it is important to recognise thatschools have remained physically open to the children of key workers andvulnerable children, and have continued providing education to all students. Thismeans that many teachers have had to provide remote teaching for a largeproportion of their pupils, while continuing to provide classroom teaching andsupervision for others. The almost overnight switch to online teaching for themajority of pupils in March 2020 meant that teachers’ preparation for it wasminimal. There was no national policy on the provision of online teaching, andschools were given freedom about how to implement remote learning, whichmeant that skills and materials had to be developed rapidly.9 Live online teachingwas constrained by concerns about child safety and unequal digital access, andso many lessons had to be recorded as podcasts, which can be a time-consumingprocess for teachers, requiring planning, scripting and editing. Although onlineteaching was challenging and teachers missed social interactions with pupils,10
there was evidence of them finding ways to deliver remote learning even for highlysocial subjects such as music,11 and for many teachers, there was a sense thatthey had learned new skills from the challenges posed by the pandemic.12 Someteachers were surprised to find that some of their pupils thrived on homeschooling and they found some unexpected star learners.13
Unfortunately, despite these efforts and some success stories, engagement withonline learning for most pupils has been problematic. A survey of teachers in May2020 indicated that only 42% of pupils had submitted their most recent piece of setwork and 90% of teachers thought their pupils were doing less work than normal.14
Pastoral care
Several reports indicate that teachers’ primary concern during school closures hasbeen with the welfare of their pupils, particularly vulnerable pupils, rather thaneducational issues.15 Some dealt with this by delivering food parcels and learningmaterials directly to children’s homes.16 However, as the pandemic progressed,teachers also became increasingly concerned about the well-being of children
16 British Journal of Educational Psychology (2020), ‘"Like a rug had been pulled from under you”: The
impact of COVID-19 on teachers in England during the first six weeks of the UK lockdown’; PsyArXiv(2020), ‘“We need clear directions, if we’re going to move forward. It’s as simple as that”: Teachers’narratives during partial school reopenings in the COVID-19 pandemic’
15 British Journal of Educational Psychology (2020), ‘"Like a rug had been pulled from under you”: The
impact of COVID-19 on teachers in England during the first six weeks of the UK lockdown’; HumanRights Watch (2020), ‘Children in England going hungry with schools shut. Uneven UK approach forCovid-19 doesn’t guarantee children’s right to food’; International Literacy Centre (2020), ‘Respondingto COVID-19, Briefing Note 3: Resetting educational priorities in challenging times’
14 National Foundation for Educational Research (2020), ‘Pupil engagement in remote learning’
13 British Journal of Educational Psychology (2020), ‘"Like a rug had been pulled from under you”: Theimpact of COVID-19 on teachers in England during the first six weeks of the UK lockdown’
12 PsyArXiv (2020), ‘'We need clear directions, if we’re going to move forward. It’s as simple as that':Teachers’ narratives during partial school reopenings in the COVID-19 pandemic’
11 British Journal of Music Education (2020), ‘Editorial Research: Music education in a time ofpandemic’
10 PsyArXiv (2020), ‘“We need clear directions, if we’re going to move forward. It’s as simple as that”:Teachers’ narratives during partial school reopenings in the COVID-19 pandemic’
9 Technology, Pedagogy and Education (2020), ‘The educational response to Covid-19 across twocountries: a critical examination of initial digital pedagogy adoption’
Open Data Institute 2021 Data on teachers’ lives during the pandemic 14

who had not previously been identified as vulnerable and those who were clearlylosing ground academically.17
Professional relationships and identity
Teachers’ relationships with pupils, parents and colleagues are fundamental totheir sense of well-being, and good relationships can protect against burnout.18
Social distancing rules during school closures have meant less face-to-facecontact with colleagues as well as with children. To some extent, this could becompensated for by virtual support, often using social media.19 However, someteachers found social media problematic as the messages could be quitedemoralising and made it difficult for teachers to separate home and work life.20
A strong sense of professional responsibility was apparent as teachers and schoolleaders took on additional roles in the pandemic, such as cleaning duties when schoolsreturned 21 and food deliveries when the government’s voucher scheme failed.22
Changing attitudes over time
Early in the pandemic, some teachers reported feeling a sense of satisfaction thatthey were able to rise to the challenge and were permitted to use their professionaljudgement to teach and care as well as possible in difficult circumstances.23 Mostof the low points described by a stratum of teachers after the first six weeks oflockdown related to uncertainty, particularly a feeling of rush and lack of claritywhen schools were first closed.24 This feeling may have intensified later in the year,when some teachers reported receiving confusing and contradictory messagesabout school reopening that prevented them from being able to plan ahead.25 Aneed for clear guidance and better communication was strongly expressed by onegroup of teachers.26
26 ibid.
25 PsyArXiv (2020), “'We need clear directions, if we’re going to move forward. It’s as simple as that”:
Teachers’ narratives during partial school reopenings in the COVID-19 pandemic’
24 ibid.
23 British Journal of Educational Psychology (2020), ‘"Like a rug had been pulled from under you”: The
impact of COVID-19 on teachers in England during the first six weeks of the UK lockdown’
22 Human Rights Watch (2020), ‘Children in England going hungry with schools shut. Uneven UK
approach for Covid-19 doesn’t guarantee children’s right to food’
21 PsyArXiv (2020), ‘“We need clear directions, if we’re going to move forward. It’s as simple as that”:
Teachers’ narratives during partial school reopenings in the COVID-19 pandemic’
20 ibid.
19 British Journal of Educational Psychology (2020), ‘"Like a rug had been pulled from under you”: The
impact of COVID-19 on teachers in England during the first six weeks of the UK lockdown’; PsyArXiv(2020), ‘“We need clear directions, if we’re going to move forward. It’s as simple as that”: Teachers’narratives during partial school reopenings in the COVID-19 pandemic’
18 Educational Review (2021), ‘Teacher job satisfaction: the importance of school working conditions
and teacher characteristics’; Teaching and Teacher Education (2013), ‘Job satisfaction andteacher-student relationships across the teaching career: Four case studies’
17 PsyArXiv (2020), ‘“We need clear directions, if we’re going to move forward. It’s as simple as that”:
Teachers’ narratives during partial school reopenings in the COVID-19 pandemic’
Open Data Institute 2021 Data on teachers’ lives during the pandemic 15
While there is evidence that teachers were willing and able, with very little notice,to teach in an entirely different way and to fill the chasm in pastoral care createdby school closures, these efforts have taken their toll: 62% of 7,000 teachersresponding to a survey in February 2021 reported feeling ‘drained and mentallyexhausted’.27 There was also concern expressed among teachers that, at the endof the pandemic, there will be a rapid return to school inspections and pupiltesting, pushing pupils too hard when their learning may have deteriorated,together with doubt about whether teachers’ views would be listened to.28 Thepublication of a large teachers’ survey gives them a voice with which to recordtheir experiences of teaching during school closures and to express their viewsabout needs and priorities for post-pandemic recovery. We report some of the keyfindings below.
Teachers’ experiences: survey findings
Teaching roles
Over half (52%) of the NASUWT ‘Big Question’ survey respondents said they hada dual role during school closures, providing remote teaching for some studentsand continuing to provide classroom teaching and supervision for others; 42%provided remote teaching only; and the rest either provided classroom teachingonly (5%) or had been unable to teach during the pandemic (1%). The teachers’working patterns varied with the age of the children taught: 89% of sixth formcollege teachers were predominantly teaching online, but 71% of primary schoolteachers were providing both face-to-face and online teaching. The highproportion of primary school teachers providing both types of teaching probablyreflects the need to provide classroom teaching and supervision to the youngerchildren of key workers.
Preparation and support for online teaching
Of the teachers who had been delivering online learning, only 9% felt wellprepared for remote teaching. There was a clear age gradient, with 11% ofteachers under 25 feeling well prepared, compared to only 7% of teachers aged50 to 59. When asked if they felt well supported, 19% of teachers aged under 25and 13% of those aged 50 to 59 reported feeling well supported. Teachers overthe age of 60 were surprisingly positive about online teaching, with 12% feelingwell prepared and 20% well supported. Special education teachers were lesslikely to feel well prepared (3%) and well supported (10%). Overall, only 17% ofteachers were given training in dealing with pupils’ online behaviour.
Teachers’ workload during the pandemic
The average weekly hours worked by full-time teachers was 52 hours and 61% feltthat their workload had increased significantly during the pandemic. 81% alsoreported an increase in stress over the previous 12 months.
28 International Literacy Centre (2020), ‘Responding to COVID-19, Briefing Note 3: Resetting
educational priorities in challenging times’
27 Times Educational Supplement (2020), ‘Exclusive: Exhausted teachers “pushed to the brink”’
Open Data Institute 2021 Data on teachers’ lives during the pandemic 16
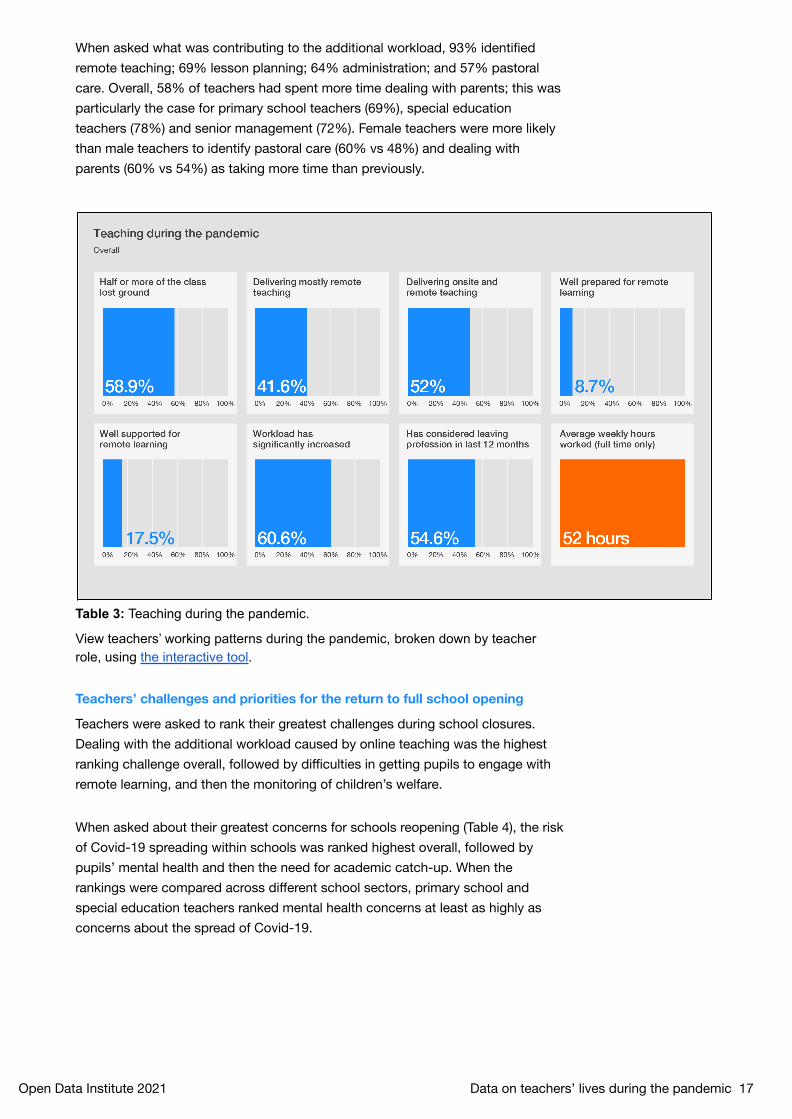
When asked what was contributing to the additional workload, 93% identifiedremote teaching; 69% lesson planning; 64% administration; and 57% pastoralcare. Overall, 58% of teachers had spent more time dealing with parents; this wasparticularly the case for primary school teachers (69%), special educationteachers (78%) and senior management (72%). Female teachers were more likelythan male teachers to identify pastoral care (60% vs 48%) and dealing withparents (60% vs 54%) as taking more time than previously.
Table 3: Teaching during the pandemic.
View teachers’ working patterns during the pandemic, broken down by teacherrole, using the interactive tool.
Teachers’ challenges and priorities for the return to full school opening
Teachers were asked to rank their greatest challenges during school closures.Dealing with the additional workload caused by online teaching was the highestranking challenge overall, followed by difficulties in getting pupils to engage withremote learning, and then the monitoring of children’s welfare.
When asked about their greatest concerns for schools reopening (Table 4), the riskof Covid-19 spreading within schools was ranked highest overall, followed bypupils’ mental health and then the need for academic catch-up. When therankings were compared across different school sectors, primary school andspecial education teachers ranked mental health concerns at least as highly asconcerns about the spread of Covid-19.
Open Data Institute 2021 Data on teachers’ lives during the pandemic 17

Table 4: Average ranking of teachers’ concerns about return to full school opening.View average rankings of concerns, broken down by teacher role, using theinteractive tool. Lower numbers indicate higher ranking.
Teachers were also asked what they thought should be in place before reopeningschools. The responses that had the highest percentages of teachers agreeingwere guidance on pupil numbers (89%), followed by availability of lateral flowtesting (89%) and vaccination for teachers (86%).
Changes in working conditions over time
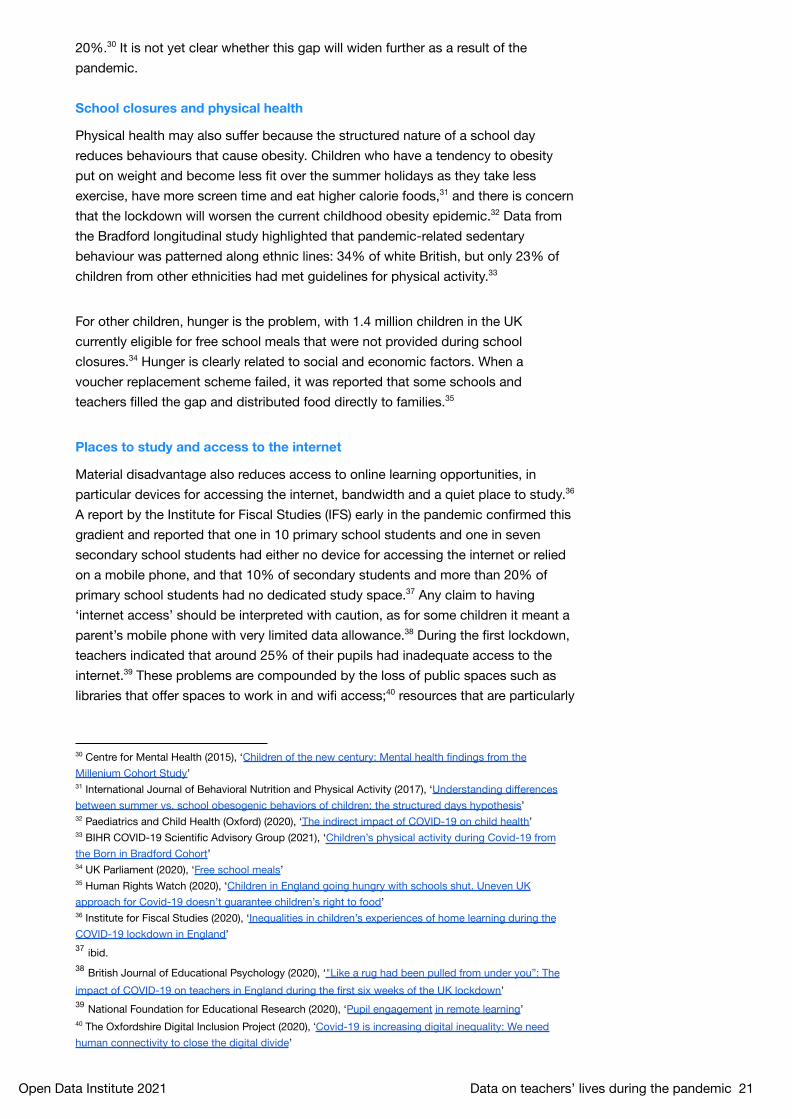
Several questions in the NASUWT survey have been asked for the past threeyears, which allow us to monitor trends. Figures 1 and 2 show how teachers’perceptions of their working conditions have changed over time. Figure 1 showsthat, although stress has increased, in the past 12 months there has been adecline in the proportion of teachers considering leaving the profession or theirjob, and the proportion who felt their job satisfaction had declined. This may bereflective of an uncertain jobs market as a result of the pandemic, or it may reflectgreater job satisfaction during the pandemic. To investigate this further, weexamined 11 indicators of job satisfaction for which there was also data over threeyears. These indicators are shown in Figures 2 and 3. Figure 2 shows positivesentiments about working and Figure 3 shows negative sentiments. It is strikingthat negative sentiments trended down and the positive sentiments trended up.In other words, despite the increase in work and stress, teachers were, onaverage, enjoying their work more. This data suggests that increased professionalautonomy and a reduction in performance management during the pandemic mayhave made teachers more likely to stay in the profession.
Open Data Institute 2021 Data on teachers’ lives during the pandemic 18
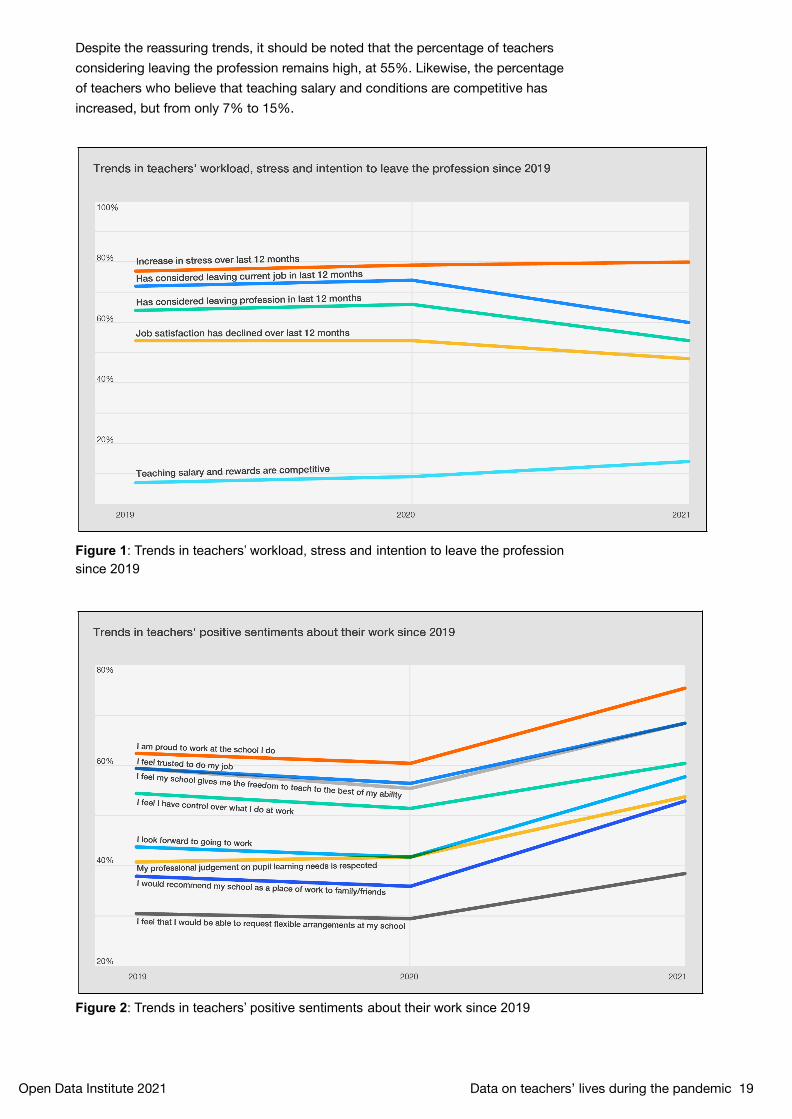
Despite the reassuring trends, it should be noted that the percentage of teachersconsidering leaving the profession remains high, at 55%. Likewise, the percentageof teachers who believe that teaching salary and conditions are competitive hasincreased, but from only 7% to 15%.
Figure 1: Trends in teachers’ workload, stress and intention to leave the professionsince 2019
Figure 2: Trends in teachers’ positive sentiments about their work since 2019
Open Data Institute 2021 Data on teachers’ lives during the pandemic 19
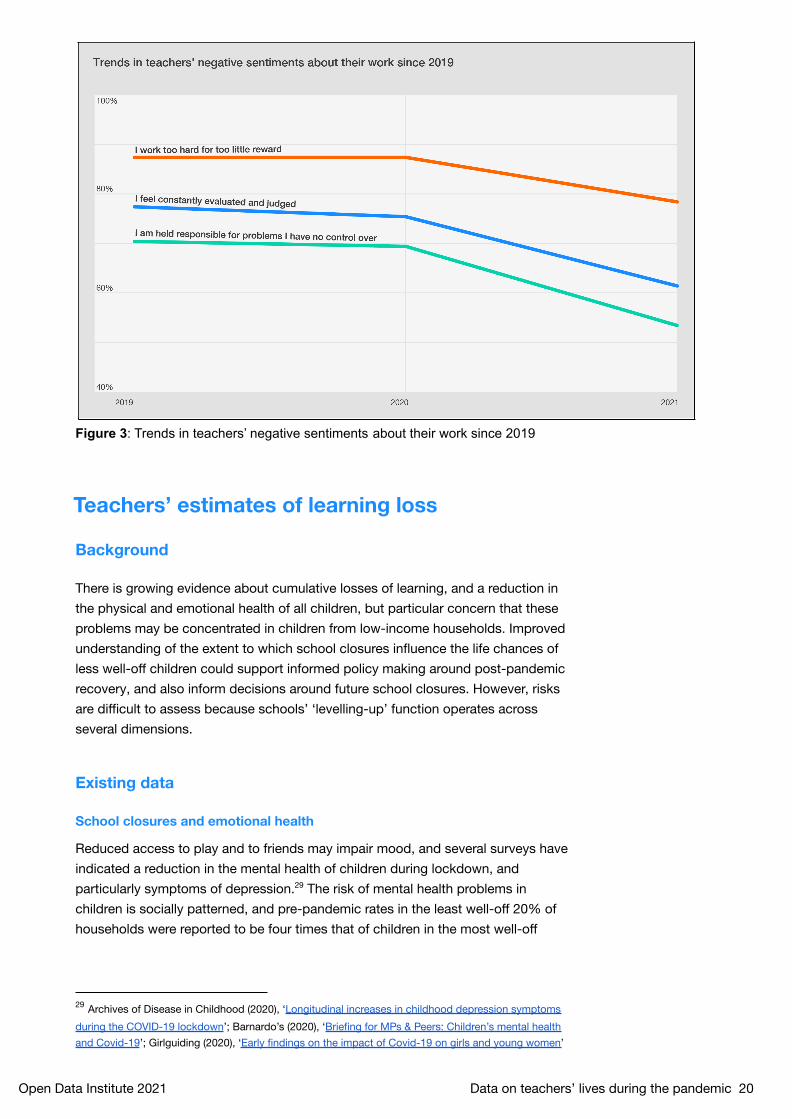
Figure 3: Trends in teachers’ negative sentiments about their work since 2019
Teachers’ estimates of learning loss
Background
There is growing evidence about cumulative losses of learning, and a reduction inthe physical and emotional health of all children, but particular concern that theseproblems may be concentrated in children from low-income households. Improvedunderstanding of the extent to which school closures influence the life chances ofless well-off children could support informed policy making around post-pandemicrecovery, and also inform decisions around future school closures. However, risksare difficult to assess because schools’ ‘levelling-up’ function operates acrossseveral dimensions.
Existing data
School closures and emotional health
Reduced access to play and to friends may impair mood, and several surveys haveindicated a reduction in the mental health of children during lockdown, andparticularly symptoms of depression.29 The risk of mental health problems inchildren is socially patterned, and pre-pandemic rates in the least well-off 20% ofhouseholds were reported to be four times that of children in the most well-off
29 Archives of Disease in Childhood (2020), ‘Longitudinal increases in childhood depression symptoms
during the COVID-19 lockdown’; Barnardo’s (2020), ‘Briefing for MPs & Peers: Children’s mental healthand Covid-19’; Girlguiding (2020), ‘Early findings on the impact of Covid-19 on girls and young women’
Open Data Institute 2021 Data on teachers’ lives during the pandemic 20
20%.30 It is not yet clear whether this gap will widen further as a result of thepandemic.
School closures and physical health
Physical health may also suffer because the structured nature of a school dayreduces behaviours that cause obesity. Children who have a tendency to obesityput on weight and become less fit over the summer holidays as they take lessexercise, have more screen time and eat higher calorie foods,31 and there is concernthat the lockdown will worsen the current childhood obesity epidemic.32 Data fromthe Bradford longitudinal study highlighted that pandemic-related sedentarybehaviour was patterned along ethnic lines: 34% of white British, but only 23% ofchildren from other ethnicities had met guidelines for physical activity.33
For other children, hunger is the problem, with 1.4 million children in the UKcurrently eligible for free school meals that were not provided during schoolclosures.34 Hunger is clearly related to social and economic factors. When avoucher replacement scheme failed, it was reported that some schools andteachers filled the gap and distributed food directly to families.35
Places to study and access to the internet
Material disadvantage also reduces access to online learning opportunities, inparticular devices for accessing the internet, bandwidth and a quiet place to study.36
A report by the Institute for Fiscal Studies (IFS) early in the pandemic confirmed thisgradient and reported that one in 10 primary school students and one in sevensecondary school students had either no device for accessing the internet or reliedon a mobile phone, and that 10% of secondary students and more than 20% ofprimary school students had no dedicated study space.37 Any claim to having‘internet access’ should be interpreted with caution, as for some children it meant aparent’s mobile phone with very limited data allowance.38 During the first lockdown,teachers indicated that around 25% of their pupils had inadequate access to theinternet.39 These problems are compounded by the loss of public spaces such aslibraries that offer spaces to work in and wifi access;40 resources that are particularly
40 The Oxfordshire Digital Inclusion Project (2020), ‘Covid-19 is increasing digital inequality: We needhuman connectivity to close the digital divide’
39 National Foundation for Educational Research (2020), ‘Pupil engagement in remote learning’
38 British Journal of Educational Psychology (2020), ‘"Like a rug had been pulled from under you”: The
impact of COVID-19 on teachers in England during the first six weeks of the UK lockdown’
37 ibid.
36 Institute for Fiscal Studies (2020), ‘Inequalities in children’s experiences of home learning during theCOVID-19 lockdown in England’
35 Human Rights Watch (2020), ‘Children in England going hungry with schools shut. Uneven UKapproach for Covid-19 doesn’t guarantee children’s right to food’
34 UK Parliament (2020), ‘Free school meals’
33 BIHR COVID-19 Scientific Advisory Group (2021), ‘Children’s physical activity during Covid-19 fromthe Born in Bradford Cohort’
32 Paediatrics and Child Health (Oxford) (2020), ‘The indirect impact of COVID-19 on child health’
31 International Journal of Behavioral Nutrition and Physical Activity (2017), ‘Understanding differencesbetween summer vs. school obesogenic behaviors of children: the structured days hypothesis’
30 Centre for Mental Health (2015), ‘Children of the new century: Mental health findings from theMillenium Cohort Study’
Open Data Institute 2021 Data on teachers’ lives during the pandemic 21

important to those less digitally well off.41
However, even when children have access to good bandwidth and devices foraccessing the internet, a digital divide may result from differences in the way theinternet is used. ‘Meaningful internet use’, or the way in which the internet is usedto ‘mobilise information resources, to be able to address a range of everydaygoals and concerns’42 follows other patterns of disadvantage43. The IFS report alsonoted a gradient between household income and both the amount of time spentstudying and the types of resources used, which put low-income children at adisadvantage.44
Unequal ‘learning slides’ when schools close
There are also more subtle disproportionate impacts for the less well-off ofmissing school. Children’s opportunities to learn outside of school are limited bytheir home environment, and a ‘summer slide’ is recognised, where the learning ofdisadvantaged children tends to stagnate during summer holidays, while better-offchildren continue to learn.45 In the United States, the summer slide is thought toaccount for almost two thirds of the achievement gap between income groups.46
Taken together, the data strongly indicates that children from some communitiesare more vulnerable to school closures than others, and that several factorscontribute to this. Our combined dataset allows us to examine in which schoolsand sectors learning losses are likely to be the greatest.
Estimates of learning loss: survey findings
Which children have experienced the greatest learning losses?
Overall, 59% of teachers felt that at least half of their pupils had lost groundacademically over the previous 12 months. This was particularly the case withyounger children: 63% of primary school teachers felt at least half the class hadlost ground, compared to only 43% of sixth form teachers.
There was also a gradient with the deprivation index of the school postcode:estimates were 70% for schools in the most deprived postcodes, compared to48% for the least deprived. Teachers’ estimates of learning loss, lack ofcompletion of set work and underlying reasons for poor engagement arecompared with demographic data from the school’s postcode in Figure 4.
46 ibid.
45 Journal of Education for Students Placed at Risk (JESPAR) (2012), ‘Counteracting summer slide:
social capital resources within socioeconomically disadvantaged families’
44 Institute for Fiscal Studies (2020), ‘Inequalities in children’s experiences of home learning during the
COVID-19 lockdown in England’
43 Educational Review (2012), ‘Learning online? Educational internet use and participation in adult
learning, 2002 to 2010’
42 Journal of Communication (2016), ‘Toward meaningful connectivity: Using multilevel communicationresearch to reframe digital inequality’
41 Telematics and Informatics (2012), ‘Digital inequalities and implications for social inequalities: A
study of Internet penetration amongst university students in South Africa’
Open Data Institute 2021 Data on teachers’ lives during the pandemic 22
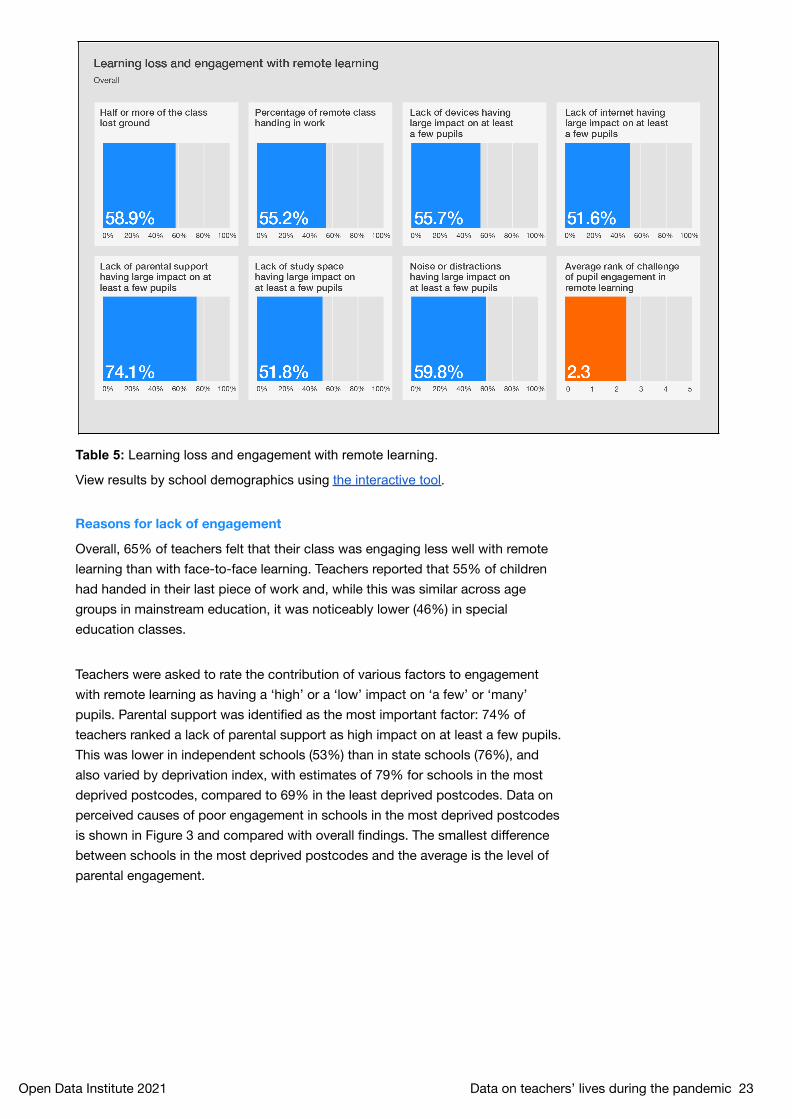
Table 5: Learning loss and engagement with remote learning.
View results by school demographics using the interactive tool.
Reasons for lack of engagement
Overall, 65% of teachers felt that their class was engaging less well with remotelearning than with face-to-face learning. Teachers reported that 55% of childrenhad handed in their last piece of work and, while this was similar across agegroups in mainstream education, it was noticeably lower (46%) in specialeducation classes.
Teachers were asked to rate the contribution of various factors to engagementwith remote learning as having a ‘high’ or a ‘low’ impact on ‘a few’ or ‘many’pupils. Parental support was identified as the most important factor: 74% ofteachers ranked a lack of parental support as high impact on at least a few pupils.This was lower in independent schools (53%) than in state schools (76%), andalso varied by deprivation index, with estimates of 79% for schools in the mostdeprived postcodes, compared to 69% in the least deprived postcodes. Data onperceived causes of poor engagement in schools in the most deprived postcodesis shown in Figure 3 and compared with overall findings. The smallest differencebetween schools in the most deprived postcodes and the average is the level ofparental engagement.
Open Data Institute 2021 Data on teachers’ lives during the pandemic 23

Figure 4: Teachers’ estimates of the frequency and importance of factorscontributing to poor engagement with remote learning in schools in the mostdeprived postcodes. Average findings for all school postcodes are represented byan orange line.
Conclusions from the survey
During the partial school closures of 2020-21, about half of all teachers took on adual role, providing classroom as well as remote teaching. Primary school teacherswere particularly likely to have taken on this dual role, probably because of their rolein providing day care for the children of key workers and vulnerable children.
Over 60% of teachers felt that their workload had increased over the past 12months and the average hours of work for full-time teachers was just over 52 perweek. Despite this, a smaller proportion of teachers said they were planning toleave the profession than in the previous two years, and indicators suggest thatthis was related to more professional autonomy during the pandemic.
Teachers’ estimate of learning losses indicated that these are likely to besubstantial in all groups of children, but there was particular concern from primaryschool teachers, and teachers from schools in more deprived postcodes. A lack ofsupport from a parent or other adult was the most commonly identified factorassociated with poor engagement with online learning. Learning loss is linked to anumber of social and economic measures at the school postcode level.
Open Data Institute 2021 Data on teachers’ lives during the pandemic 24
Data gaps
The data reported in this study has highlighted what we can tell about howteachers’ working lives changed during the pandemic and in which groups ofchildren they are most concerned about learning loss. This report can be seen asan illustration of how open data can inform research and policy making, but it isimportant to assess the availability, reliability, fairness and transparency of theavailable public data. We need to ask whether the data we have is the data weneed to answer the questions we have.
Representativeness
Data inclusion
When data is used for decision making, it is important to consider whether it fairlyrepresents the groups it is thought to describe, or whether some groups havebeen excluded. For example, Gypsy and Traveller communities were included asan ethnic category in the UK census for the first time in 2011, meaning that beforethen, their health and social indicators had not been used in census-drivendecision making.47 Groups need to be visible in the data in order to be representedby it, and it could be argued that, by assessing social data at the level of aschool’s postcode stem, we have averaged out the needs of distinct groups ofchildren and denied them representation. However, the advantage of representingdistinct groups and categories of children needs to be balanced against the risk ofassigning individuals to more granular categories and making assumptions aboutthem that are discriminatory.
In this report we have deliberately not attempted to identify distinct groupings thatcould be used to characterise a particular child. Instead, we highlight theconcentration of educational losses in primary schools, in special education and inschools located in deprived postcodes, which may need additional resources aspost-pandemic recovery unfolds.
How well do respondents represent the teaching workforce?
The low response rate of the survey was not unusual, but it does raise questionsabout the representativeness of the data. We tried to mitigate this by weightingresponses by demographic factors. However, the possibility always remains thatteachers who responded to the survey differed systematically from those who didnot. It might be argued, for example, that teachers would be more likely torespond to the survey if they had had a particularly positive experience during thepandemic or, alternatively, if they had an axe to grind. Responses may also be
47 UK Parliament (2019), ‘Research briefing: Gypsies and Travellers’
Open Data Institute 2021 Data on teachers’ lives during the pandemic 25

influenced by the perceived purposes of a survey which, in this case, could beseen as a tool for lobbying and improving employment conditions.
It is difficult to mitigate against these risks in the present report, but it does raise abroader question about public perceptions of data use and willingness tocontribute data – something that is addressed further below.
Data quality
Granularity of data categories
Surveys that ask workers to rate their job satisfaction within limited responsecategories are blunt instruments for assessing the mood and motivation of theworkforce. Technically, it is possible to collect more detailed information aboutworkers’ performance, engagement and motivation by scraping employees’professional and personal communications and analysing them using naturallanguage processing. While there has been a rise in the use of commercialworkforce analytics that perform these functions in the private sector,48 the use ofthis sort of digital surveillance is intrusive, may lead to discriminatory profiling ofindividuals, and may itself change the behaviour it seeks to monitor.
A similar argument could be made about drawing conclusions about children’slearning losses and the determinants of learning engagement from teachers’opinions. More granular data about how individual children are learning onlinecould certainly be gained from analysing their performance in schoolwork, or evenclickstream data to see what material individual children are accessing and howlong they spend on it. However, we also have to be alert to the ethics and adverseconsequences of data collection itself – such as increased testing or invasions ofprivacy – and how this might feed back into changes in behaviour, such asteaching to the test or the use of mouse movers to simulate activity. Datacollection should be minimised: it should be enough to answer the questions wehave, rather than everything we could collect. In this context, we believe ourapproach of using anonymised and aggregated data published as open data,combined with other publicly available datasets, meets conditions for appropriateand useful granularity.
Timeliness of data
Some of our contextual data was taken from sources that were not concurrentwith the survey. This is particularly the case for data about communities that relieson census data. This report was written in a census year, meaning that the mostrecent published census data is 10 years old. Real-time information aboutcommunities is almost certainly available to those commercial entities that collect
48 Social Sciences (2019), ‘Big data and human resources management: The rise of talent analytics’
Open Data Institute 2021 Data on teachers’ lives during the pandemic 26
personal digital data, but this is not made available for public use.
Challenges to geographical matching
One of the strengths of this report is the linking of teachers’ views to contextualdata about their school’s community. However, this came with challenges. Apostcode stem was used to identify a school’s approximate location. A fullpostcode would have been more precise, but would have identified individualschools. Postcode stems were then mapped as well as possible to census areas.Direct matching would have been preferable, but it is unlikely that teachers wouldknow the lower super output areas of their schools. Common standards forgeographical mapping that are recognised by users would make the analysis ofdata from multiple sources more accurate.
Data infrastructure
Data use and communication
‘Data infrastructure’ consists of a combination of data assets, technology,processes and organisations. The use of data to solve problems and thecommunication of that use to participants and the public is an important part ofdata infrastructure,49 and can create a sense of public ownership and control ofdata. The ‘citizen science’ movement has been very successful in mobilisingcrowd-sourced data to monitor environmental issues,50 indicating that there is anappetite for contributing public data when it is seen to be of value.
If workforce surveys are to be used to monitor teachers’ professional opinions, it isnecessary to make the results as representative as possible and so the lowresponse rate was a concern. Informal enquiries suggested some survey fatigueamong teachers, who have been asked to contribute data to several questionnairesover the course of the year. It seems likely that many of those invited to participatewill have seen the survey as another gratuitous data collection exercise and decidednot to take part. Participation in future surveys of this sort may be promoted ifteachers can see that their collective views and concerns have been noted and haveinformed policy. This places an onus on those designing surveys to ensure that thedata they collect is directed towards problem solving, and an onus on data users tocommunicate this use to contributors.
Teacher workload and retention
Teacher retention is likely to be particularly important as children recover from thedamage to their learning and well-being caused by school closures. Teachers inthis survey indicated that their workload had increased and they were working
50 Nature(2018), ‘No PhDs needed: how citizen science is transforming research’
49 Civil Service Quarterly (2019), ‘An interview with John Pullinger, former UK National Statistician’
Open Data Institute 2021 Data on teachers’ lives during the pandemic 27
over 50 hours per week on average. Data about workload is available from theteacher workload survey that was carried out in 2016 and 2019, but there may bean argument for repeating this survey more regularly or incorporating some of itsmeasures into other tools, such as the school workforce survey.
Data from the NASUWT survey indicated that substantial learning losses areprobable across all groups, but that these are likely to be concentrated in primaryschools and in schools in less well-off postcodes. It follows that teacherrecruitment and retention is particularly important in those sectors and areas, andshould be monitored. Currently, teacher retention data is only available at anational level. Making it openly available at the level of different sectors andregions would increase the transparency of educational management and allowcivil society organisations and interested individuals to determine whether thereare areas where low teacher retention represents a risk to schooling and whereadditional support may be needed.
Better data on teacher well-being is also required to monitor the impact ofeducation policies on teacher motivation and retention. We have a great deal ofinformation about the performance of children and schools, but the consequencesof this approach to performance management on the teaching workforce alsoneeds to be measured and critically assessed so that balanced decisions can bemade about education policy. Common metrics of teacher well-being and jobsatisfaction, and measurement of trends, are necessary.
Open Data Institute 2021 Data on teachers’ lives during the pandemic 28

Conclusion
Researchers, policymakers and citizens who are interested in education haveaccess to a great deal of data about the performance of children and schools fromthe education statistics service, and about teacher numbers and characteristicsfrom the school workforce survey. What is missing is reliable, systematic data onthe well-being and professional views of teachers.
In this report we explored how open and publicly available data can be combinedand used to shed light on the impact of the pandemic on the working lives ofteachers and the learning and well-being of the children they teach. The datahighlighted particular areas of concern regarding children’s learning losses, whichare likely to be more severe in primary schools and in schools in low income areas,and the surprising finding that although teachers had to work harder and weremore stressed than usual, they felt more positive about their work and were lesslikely to consider leaving the profession. We also discussed the limitations of thisdata, in particular the low response rate to the survey, and the difficulty matchingdatasets based on geography.
Data is necessary for good public decision making, and the nature of that dataaffects the quality of those decisions. Timely data enables timely decisions andaction. Granular data – for example about different areas or different schoolsettings – supports targeted interventions. Data from multiple sources – includingthat created by communities and professional bodies to describe and evidencetheir experience – helps to create a rich and nuanced picture.
Opening data, and particularly that used for important decisions, supportstransparency and accountability around those decisions, and enablespolicymakers, researchers and the public to understand and question them.Open data can also help prioritise and support action, such as the provision andtargeting of support services by civil society and businesses.
But no data is perfect, and it is important to surface how it was collected andprocessed, and recognise, as we have in this report, its limitations, so that it canbe critiqued and understood in context.
In education, as in many sectors, we are still far from having the data infrastructurewe need. Teachers are not alone in wanting their opinions and experiences to betaken into account when decisions are made about their working lives. Thepandemic has shown us the importance of timely data in a rapidly changing world,and how much collective knowledge is held within institutions like the NHS, oralready available to organisations like businesses, unions and civil societyorganisations. Making data available, in privacy-protecting, timely and systematicways, means we can harness that collective knowledge for the collective good.
Open Data Institute 2021 Data on teachers’ lives during the pandemic 29

Technical Appendix
Survey data processing and cleaning methods
Data cleaningA series of data cleaning processes were carried out on the raw survey data.These included:
● School postcode outcode or stem (for example SW4) – some respondents enteredfull postcodes and others added characters or spaces, and where possible, thesewere cleaned to provide a valid outcode. Overall, 3,096 postcode outcodes wereidentified and matched to external datasets (see below).
● Education sector – some respondents did not tick which sector ofeducation they teach in, but wrote something in the ‘other’ box. Thesewere recategorised into one of the defined sectors where relevant. Due tosmall numbers, teachers in sixth form colleges, further education collegesor higher education were combined into a ‘post-16’ category. Where morethan one option was ticked, only the first was taken to avoid doublecounting respondents.
● Ethnic group – some respondents did not select any ethnic group butwrote one in the ‘other’ box. Where clear, these were reclassified as one ofthe ethnic groups. Where more than one option was ticked, only the firstwas taken to avoid double counting respondents.
● Position – some respondents did not select a position (for example middlemanager) but wrote one in the ‘other’ box. Where clear, these werereclassified as one of the defined positions. Due to small numbers,headteacher/deputy headteachers and senior management teammembers were combined into a senior manager category.
● Working pattern – some respondents did not select a working pattern (forexample temporary part time) but wrote one in the ‘other’ box. Whereclear, these were reclassified as one of the defined groups. Where morethan one option was ticked, only the first was taken to avoid doublecounting respondents.
● Invalid responses – for two questions (Q15 and Q25 ) we excluded valuesthat were impossible or extremely unlikely. For example, for Q15, weexcluded any responses that stated that the number of pupils that hadsubmitted work was larger than than the total number in the class.Similarly, for Q25, we excluded any respondents who said they worked fulltime and worked fewer than 20 hours per week.
Open Data Institute 2021 Data on teachers’ lives during the pandemic 30
Missing responsesSome respondents did not provide answers to every question. Rather than usingimputation to create artificial responses , non-responses were excluded from theanalysis for each question. This means that, for each question, the analysis showsthe percentages of all those who answered that particular question, not of allsurvey respondents. For example, where a question had possible answers of ‘Yes,‘No’ and ‘Not sure’, we report the number who said ‘Yes’ as a percentage of thenumber who said ‘Yes, ‘No’ or ‘Not sure’.
WeightingComparison to published Department for Education data on the teacher workforceacross all state-funded schools in England revealed that the survey sample wasnot representative (see Table 2). We therefore applied weighting to the surveyresponses to ensure that results were representative of the teacher workforce. Theweights were calculated based on the school sector respondents teach in, theirage band and their gender, since the combination of these variables was availablefrom the school workforce census. In particular, this increased the weighting onthe responses of younger survey respondents and those who taught in primaryschools. To avoid applying large weights to small groups of respondents, regionalweightings were not applied.
The teacher workforce data used is only available for state-funded primary,secondary and special schools. Therefore, independent school teachers and thoseworking in post-16 institutions remained unweighted. Additionally, we did notre-weight the responses to each individual question, so the sample for eachindividual question may not reflect the teacher workforce as a whole.
Linking to external datasetsWe used the school postcode outcode reported by the respondent to link thesurvey data to a selection of external datasets to provide additional context foranalysis (see Table 1). The external data used was published at output area (OA),lower super output area (LSOA) or middle super output area (MSOA) level, andhence could not be directly mapped to the postcode outcode stated byrespondents. To create data for the postcode outcodes, we calculated theproportion of each outcode area that is in each OA, LSOA or MSOA. We usedthese proportions to create weighted re-aggregations of each measure for eachpostcode outcode. Every outcode was then ranked and split into quartiles foreach measure.
Statistical significanceIn order to draw conclusions about sub-groups of teachers within the survey, wetested whether their average response (mean) for each question was statisticallysignificantly different to the average among all other respondents. Statisticalsignificance was calculated using a two-tailed t-test and groups significantlydifferent at the 1% and 5% levels were highlighted.
Open Data Institute 2021 Data on teachers’ lives during the pandemic 31

Bibliography
Allmann K. Covid-19 is increasing digital inequality: We need human connectivityto close the digital divide [Internet]. 2020 [cited 2020 Jul 27]. Available from:https://www.law.ox.ac.uk/research-and-subject-groups/oxfordshire-digital-inclusion-project/blog/2020/04/covid-19-increasing
Andrew A, Cattan S, Dias MC, Farquharson C, Kraftman L, Krutikova S, et al.Inequalities in children’s experiences of home learning during the COVID-19lockdown in England. Fisc Stud. 2020;41(3):653–83.
Ashikkali L, Carroll W, Johnson C. The indirect impact of COVID-19 on childhealth. Paediatr Child Health (Oxford). 2020;30:430–7.
Barnardo’s. Briefing for MPs & Peers: Children’s mental health and Covid-19. 2020
Bignardi G, Dalmaijer ES, Anwyl-Irvine AL, Smith TA, Siugzdaite R, Uh S, et al.Longitudinal increases in childhood depression symptoms during the COVID-19lockdown. Arch Dis Child. 2020;Epub ahead(Dec 9).
BIHR COVID-19 Scientific Advisory Group. Children’s physical activity duringCovid-19 from the Born in Bradford Cohort. 2021
Bimpong KAA, Tolley CL, Slight SP. Relationship between labour forcesatisfaction, wages and retention within the UK National Health Service: asystematic review of the literature. BMJ Open. 2020;10:e034919.
Brazendale K, Beets MW, Weaver RG, Pate RR, Turner-McGrievy GM, KaczynskiAT, et al. Understanding differences between summer vs. school obesogenicbehaviors of children: the structured days hypothesis. Int J Behav Nutr Phys Act.2017;14:100.
Cabinet Office. An interview with John Pullinger, former UK National Statistician[Internet]. Civil Service Quarterly. 2019 [cited 2019 Mar 13]. Available from:https://quarterly.blog.gov.uk/2019/10/30/an-interview-with-john-pullinger-former-uk-national-statistician/
Cromarty H. Research briefing: Gypsies and Travellers [Internet]. 2019. Availablefrom: https://commonslibrary.parliament.uk/research-briefings/cbp-8083/
Daubney A, Fautley M. Editorial Research: Music education in a time of pandemic.Br J Music Educ. 2020;37:107–14.
Foster D. Research Briefing: Teacher recruitment and retention in England[Internet]. 2020. Available from:https://commonslibrary.parliament.uk/research-briefings/cbp-7222/
Girlguiding. Early findings on the impact of Covid-19 on girls and young women
Open Data Institute 2021 Data on teachers’ lives during the pandemic 32

[Internet]. 2020. Available from:https://www.girlguiding.org.uk/globalassets/docs-and-resources/research-and-campaigns/girlguiding-covid19-research-briefing.pdf
Greenhow C, Lewin C, Staudt Willet KB. The educational response to Covid-19across two countries: a critical examination of initial digital pedagogy adoption.Technol Pedagog Educ. 2020.
Gutman LM, Joshi H, Parsonage M, Schoon I. Children of the new century: Mentalhealth findings from the Millenium Cohort Study. 2015.
Hansard. Free School Meals Volume 682: debated on Wednesday 21 October2020 [Internet]. 2020 [cited 2021 Feb 13]. Available from:https://hansard.parliament.uk/commons/2020-10-21/debates/79C0CA8D-CADF-4562-9317-5A51810BB5DE/FreeSchoolMeals
Human Rights Watch. UK: Children in England going hungry with schools shut.Uneven UK approach for Covid-19 doesn’t guarantee children’s right to food[Internet]. 2020. Available from:https://www.hrw.org/news/2020/05/27/uk-children-england-going-hungry-schools-shut
International Literacy Centre. Responding to COVID-19, Briefing Note 3: Resettingeducational priorities in challenging times. 2020.
Irwin, A. No PhDs needed: how citizen science is transforming research [Internet].Nature. 2018. Available from:https://www.nature.com/articles/d41586-018-07106-5
Katz V, Gonzalez C. Toward meaningful connectivity: using multilevelcommunication research to reframe digital inequality. J Commun. 2016;66:236–49.
Kim LE, Asbury K. ‘Like a rug had been pulled from under you’: The impact ofCOVID-19 on teachers in England during the first six weeks of the UK lockdown.Br J Educ Psychol. 2020;90:1062–83.
Kim LE, Leary R, Asbury K. ‘We need clear directions, if we’re going to moveforward. It’s as simple as that’: Teachers’ narratives during partial schoolreopenings in the COVID-19 pandemic. PsyArXiv. 2020.
Lough C. Exclusive: Exhausted teachers ‘pushed to the brink’ [Internet]. TimesEducational Supplement. 2020 [cited 2021 Feb 13]. Available from:https://www.tes.com/news/exclusive-exhausted-teachers-pushed-brink
Lucas M, Nelson J, Sims D. Schools’ responses to Covid-19. Pupil engagement inremote learning [Internet]. 2020. Available from:https://www.nfer.ac.uk/media/4073/schools_responses_to_covid_19_pupil_engagement_in_remote_learning.pdf
Moss G. Responding to COVID-19, Briefing Note 3: Resetting educationalpriorities in challenging times. London; 2020.
Open Data Institute 2021 Data on teachers’ lives during the pandemic 33
Nocker M, Sena V. Big data and human resources management: the rise of talentanalytics. Soc Sci. 2019;8:273.
Open Data Institute. Data about children’s lives in the pandemic [Internet]. 2020.Available from: https://theodi.org/article/data-about-children-during-covid19/
Oyedemi T. Digital inequalities and implications for social inequalities: A study ofInternet penetration amongst university students in South Africa. TelematInformatics. 2012;29:302–13.
Perryman J, Calvert G. What motivates people to teach, and why do they leave?Accountability, performativity and teacher retention. Br J Educ Stud.2020;68(1):3–23.
Rice K, Wynne B, Martin V, Ackland GJ. Effect of school closures on mortality fromcoronavirus disease 2019: old and new predictions. Br Med J. 2020;371:m3588.
Slates SL, Alexander KL, Entwisle D, Olson LS. Counteracting summer slide:social capital resources within socioeconomically disadvantaged families. J EducStudents Placed Risk. 2012;17(3):165–85.
Taylor L. What is data justice? The case for connecting digital rights and freedomsglobally. Big Data Soc. 2017;4(2).
Toropova A, Myrberg E, Johansson S. Teacher job satisfaction: the importance ofschool working conditions and teacher characteristics. Educ Rev.2021;73(1):71–97.
Veldman I, van Tartwijk J, Brekelmans M, Wubbels T. Job satisfaction and teacherstudent relationships across the teaching career: Four case studies. Teach TeachEduc. 2013;32:55–65.
White P, Selwyn N. Learning online? Educational Internet use and participation inadult learning, 2002 to 2010. Educ Rev [Internet]. 2012;64(4):451–69.
Open Data Institute 2021 Data on teachers’ lives during the pandemic 34