c ommunicating f indings & l inking d ata with a ction module 5
Post on 20-Dec-2015
215 views
TRANSCRIPT

COMMUNICATING FINDINGS & LINKING DATA WITH ACTION
Module 5
PART I: PROVIDING FEEDBACK ON DATA COLLECTED / ANALYZED

Part 1: Session Objectives
Understand the importance of feedback in program
improvement and management
Consider how to improve feedback mechanisms in
own work
3

“We are always giving patient forms and data to our M&E Unit, who then gives data to donors and the government. I am the head doctor and I never have the chance to look through the data before they go up. We just keep giving data up and up, and we never hear back about it…”
Head of ART facility, Nigeria

Importance of Feedback
Information needs to be shared At timely and regular intervals
Within, between, up, and down
Paves path between data collectors and users at all levels of the health system

Importance of Feedback
Leads to greater appreciation of data: Improved data quality
Influencing collection of appropriate data
Important element of management and supervision Creates opportunity to monitor & improve
program services
Incentive for staff

Examples of Feedback
Sharing information within a facility or organization
Sharing aggregated service provision data from facilities within a district or between provinces
Meetings between facility and supervising agency to review and discuss information
Meetings between donor and NGO to review information and discuss challenges and opportunities

Working Toward a Culture of Information Use
Information becomes an integral part of decision-making processes, including planning, problem solving, choosing alternatives, feedback, etc.
Empowers people to ask questions, seek improvement, learn, and improve quality

Higher Levels: District, Province, National
Analysts, Evaluators
Service Delivery Point
Feedback Managers,
Government, Donors
Program
Compiled Data
Clinical Histories, Service
Statistics
Reports
Information Flow

Variety of Formats
Narratives Summaries, bulleted items, graphs, charts
In-person discussion One-on-one
Staff meetings, district meetings
Speeches to staff
Supervision visits

Community Distribution ProgramMonthly Performance Review
Distributor: _______________ Supervisor: _________________Region: __________________ Month: _______ Year: ________
Number of NEW clients: _____MARK WITH AN X ON THE BAR BELOW
0 5 22
Number of RETURNING clients: _____MARK WITH AN X ON THE BAR BELOW
0 12 73


Quarterly Performance Indicators
# Indicator Numerator Denominator Percentage
ART
1 % of eligible clients placed on ART
# of new clients on ART Sum of # of new clients on ART and clients on ART waiting list 100%
39 39
2 % of current ART clients
# of active clients on ART # of cumulative clients on ART 92%
1620 1765
3 % of ART clients in 6 month cohort undergoing repeat CD4 testing
# of clients for whom repeat CD4 testing was done at 6 months
Total # of active ART clients in 6 month cohort
94%147 156
Pediatric ART
1 % of children current on ART
# of active children on ART # of cumulative children on ART 78%
45 58
ART Care Follow-up
1 % of non active ART patients who have stopped ART.
# of patients who stopped ART.
# of non active ART patients.
0%0 145
2 % of non active ART patients who transferred out.
# of patients who transferred out.
# of non active ART patients.
6%8 145
3 % of non active ART patients who died.
# of patients who died. # of non active ART patients.73%
106 145
4 % of non active ART patients who have been lost to follow-up.
# of patients who have been lost to follow-up.
# of non active ART patients.
16%23 145

When developing feedback mechanism, consider…
The information being shared
Who will benefit from feedback
The format of the feedback mechanism
The forum in which the feedback will be shared
How often the feedback will be provided
How the feedback will move to the next level
Document the process

Potential barriers to providing feedback
Hierarchy
Role clarification – data clerk & M&E officer
Approval requirements to distribute data
Lack of knowledge of what information stakeholders need

Group Participation
Discuss barriers to providing feedback that you have experienced in your work
Discuss the benefits of feedback that you have experienced in your work
Identify: Two stakeholder groups that would benefit from
receiving feedback The ideal mechanism to provide feedback to them

PART 2: LINKING DECISIONS/QUESTIONS WITH POTENTIAL DATA SOURCES
Part 2: Session Objectives
Identify priority decisions and programmatic questions
Link decisions/questions with potential data sources
Create a time-bound plan for using data in decision making (Framework for Linking Data with Action)
18

Building Data Use into Your Work
PLAN PLAN PLAN !
Regularly review your data – schedule time
Use the Framework for Linking Data with Action
Engage in dialogue with stakeholders to fully understand the
decisions they make
information they need
best way to present that information

Elements of the Framework
Decision makers and stakeholders with potential interest in your data
Decisions / actions that the stakeholder makes (possible uses of data)
Questions to which the stakeholder requires answers
When the decision will be made

Elements of the Framework (cont’d)
Indicators and/or data of interest (to respond to stakeholder need)
Source of data
How will data be presented (what types of analyses, graphs, formats)?

FRAMEWORK FOR LINKING DATA WITH ACTION

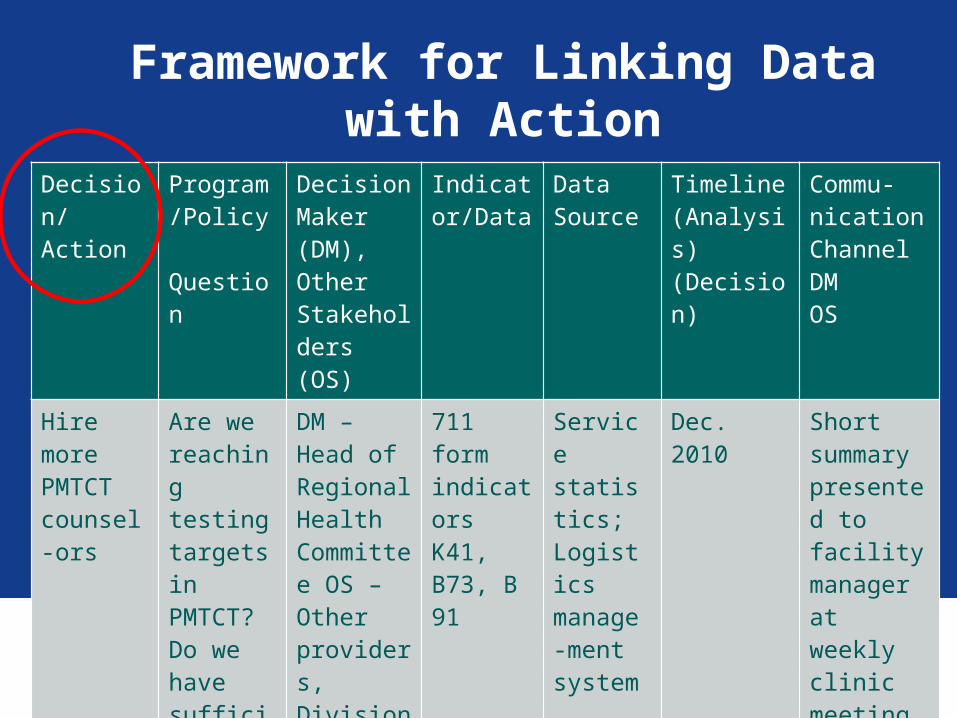
Framework for Linking Data with Action
Decision/ Action
Program/Policy Question
Decision Maker(DM), Other Stakehold-ers (OS)
Indicator/Data
Data Source
Timeline(Analysis) (Decision)
Commu-nication Channel

Framework for Linking Data with Action
Decision/ Action
Program/Policy Question
Decision Maker(DM), Other Stakehold-ers (OS)
Indicator/Data
Data Source
Timeline(Analysis) (Decision)
Commu-nication Channel

What Are Decisions?
Choices that lead to action
All decisions are informed by questions
All questions should be based on data

Decisions Allocation of resources across IPs/ states /
districts/facilities
Revising OVC program approaches to emphasize fostering and adoption
Develop and institute workplace policies on HIV/AIDS in all institutions in state X
Hire and allocate staff to facilities

Programmatic Questions What percentage of HIV+ pregnant women in
care actually are delivering in health facilities?
What percentage of clients starting ART are lost to follow-up?
Are the number of family planning clients decreasing?
What percentage of pregnant patients who are HIV+ actually are receiving ART?

Framework for Linking Data with Action
Decision/ Action
Program/Policy Question
Decision Maker (DM), Other Stakeholders (OS)
Indicator/Data
Data Source
Timeline(Analysis)(Decision)
Commu-nication ChannelDMOS
Are we reaching testing targets in PMTCT?Do we have sufficient test kits?What is nurse: client ratio?
DM – Head of Regional Health Committee OS – Other providers, Division of Clinical Training

Framework for Linking Data with Action
Decision/ Action
Program/Policy Question
Decision Maker (DM), Other Stakeholders (OS)
Indicator/Data
Data Source
Timeline(Analysis)(Decision)
Commu-nication ChannelDMOS
Are we reaching testing targets in PMTCT?Do we have sufficient test kits?What is nurse:client?
DM – Head of Regional Health Committee OS – Other providers, Division of Clinical Training

Framework for Linking Data with Action
Program/Policy Question
Decision Maker (DM), Other Stakeholders (OS)
Indicator/Data
Data Source
Timeline(Analysis)(Decision)
Commu-nication ChannelDMOS
Are we reaching testing targets in PMTCT?Do we have sufficient test kits?What is nurse:client ratio?
DM – Head of Regional Health Committee OS – Other providers, Division of Clinical Training
711 form indicators K41, B73, B 91
Service statistics; Logistics manage-ment system

Framework for Linking Data with Action
Decision/ Action
Program/Policy Question
Decision Maker (DM), Other Stakeholders (OS)
Indicator/Data
Data Source
Timeline(Analysis)(Decision)
Commu-nication ChannelDM OS
Are we reaching testing targets in PMTCT?Do we have sufficient test kits?What is nurse:client ratio?
DM – Head of Regional Health Committee OS – Other providers, Division of Clinical Training
711 form indicators K41, B73, B 91
Service statistics; Logistics manage-ment system

Framework for Linking Data with Action
Decision/ Action
Program/Policy Question
Decision Maker (DM), Other Stakeholders (OS)
Indicator/Data
Data Source
Timeline(Analysis)(Decision)
Commu-nication ChannelDMOS
Are we reaching testing targets in PMTCT?Do we have sufficient test kits?What is nurse:client ratio?
DM – Head of Regional Health Committee OS – Other providers, Division of Clinical Training
711 form indicators K41, B73, B 91
Service statistics; Logistics manage-ment system
Dec. 2010,March 2011,June 2011, September 2011,December 2011

Framework for Linking Data with Action
Decision/ Action
Program/Policy Question
Decision Maker (DM), Other Stakeholders (OS)
Indicator/Data
Data Source
Timeline(Analysis)(Decision)
Commu-nication Channel DMOS
Are we reaching testing targets in PMTCT?Do we have sufficient test kits?What is nurse:client ratio?
DM – Head of Regional Health Committee OS – Other providers, Division of Clinical Training
711 form indicators K41, B73, B 91
Service statistics; Logistics manage-ment system
Dec. 2010

Framework for Linking Data with Action
Decision/ Action
Program/Policy Question
Decision Maker (DM), Other Stakeholders (OS)
Indicator/Data
Data Source
Timeline(Analysis)(Decision)
Commu-nication Channel DMOS
Are we reaching testing targets in PMTCT?Do we have sufficient test kits?What is nurse:client ratio?
DM – Head of Regional Health Committee OS – Other providers, Division of Clinical Training
711 form indicators K41, B73, B 91
Service statistics; Logistics manage-ment system
Dec. 2010 Short summary presented to facility manager at weekly clinic meeting
Framework for Linking Data with Action
Decision/ Action
Program/Policy Question
Decision Maker (DM), Other Stakeholders (OS)
Indicator/Data
Data Source
Timeline(Analysis)(Decision)
Commu-nication Channel DMOS
Hire more PMTCT counsel-ors
Are we reaching testing targets in PMTCT?Do we have sufficient test kits?What is nurse:client ratio?
DM – Head of Regional Health Committee OS – Other providers, Division of Clinical Training
711 form indicators K41, B73, B 91
Service statistics; Logistics manage-ment system
Dec. 2010 Short summary presented to facility manager at weekly clinic meeting

Framework for Linking Data with Action
Creates a time-bound plan for information-informed decision making
Encourages greater use of existing information
Monitors the use of information in decision making

Small Group Activity 6 – Instructions
Select a note taker
On flip chart paper, create the Framework table
Brainstorm three decisions or questions in columns 1 & 2
Complete the remaining columns
Time: 1 hour

Small Group Activity – Report Back
Each group will have 10 minutes to present its completed Framework
Group discussion – are there other data sources that might have been used in this decision? Were there other stakeholders who should have been considered? (10 minutes)

Building Data Use into Your Work
PLAN PLAN PLAN !
Regularly review your data – schedule time
Use the Framework for Linking Data with Action
Engage in dialogue with stakeholders
Consider other tools or methods related to data demand and use

Improving Data Demand & Use: Multifaceted Approach
Applying a combination of: Assessment of current data use, capacity building
needs, and barriers to data use Capacity building initiatives around data use concepts,
use of tools, data analysis… Tool application Organization development (e.g., leadership, systems
improvement) Collaborative efforts between data users and producers

Multifaceted Approach in Nigeria
Large amount of data collected, feeding NNRIMS
Data were not being used effectively at sites or within project
Pervasive mistrust of data
Lack of understanding of how RHIS data could be used
Lack of understanding of how indicators were calculated and used for program improvement

Capacity Building Assessment Organizational Support
Data Users & Data Producers
Data System Improvements
Multifaceted Approach in Nigeria

Capacity Building Assessment Organizational Support
Data Users & Data Producers
Data System Improvements
Multifaceted Approach in Nigeria

Capacity Building Assessment Organizational Support
Data Users & Data Producers
Data System Improvements
Multifaceted Approach in Nigeria

Capacity Building Assessment Organizational Support
Data Users & Data Producers
Data System Improvements
Multifaceted Approach in Nigeria
Multifaceted Approach in Nigeria: Results
86% of respondents implemented solutions to identified barriers to data use
76% reported assisting decision makers with data interpretation

THANK YOU!MEASURE Evaluation is a MEASURE project funded by the U.S. Agency for International Development and implemented by the
Carolina Population Center at the University of North Carolina at Chapel Hill in partnership with Futures Group International, ICF Macro, John Snow, Inc., Management Sciences for Health, and Tulane University. Views expressed in this presentation do not necessarily reflect the views of USAID or the U.S. Government.
MEASURE Evaluation is the USAID Global Health Bureau's primary vehicle for supporting improvements in monitoring and
evaluation in population, health and nutrition worldwide.
Visit us online at http://www.cpc.unc.edu/measure