documentc3
TRANSCRIPT

CHAPTER 3: CHAPTER 3:
ASSESSING FIRM’S ASSESSING FIRM’S FINANCIAL PERFORMANCEFINANCIAL PERFORMANCE
1

3.1 Uses of financial statement
• Firm ‘s financial statements can help managers to carry out three important tasks:
• 3.1.1 Financial statement analysis• 3.1.2 Financial control• 3.1.3 Financial forecasting and planning
2

3.2 Common size statement
Common size statement is a standardized financial statement presenting all items in percentage terms.
Common size balance sheet- Compute all accounts as a percentage (%) of total assets
Common size income statement- Compute all line items as a percentage (%) of sales
3
4
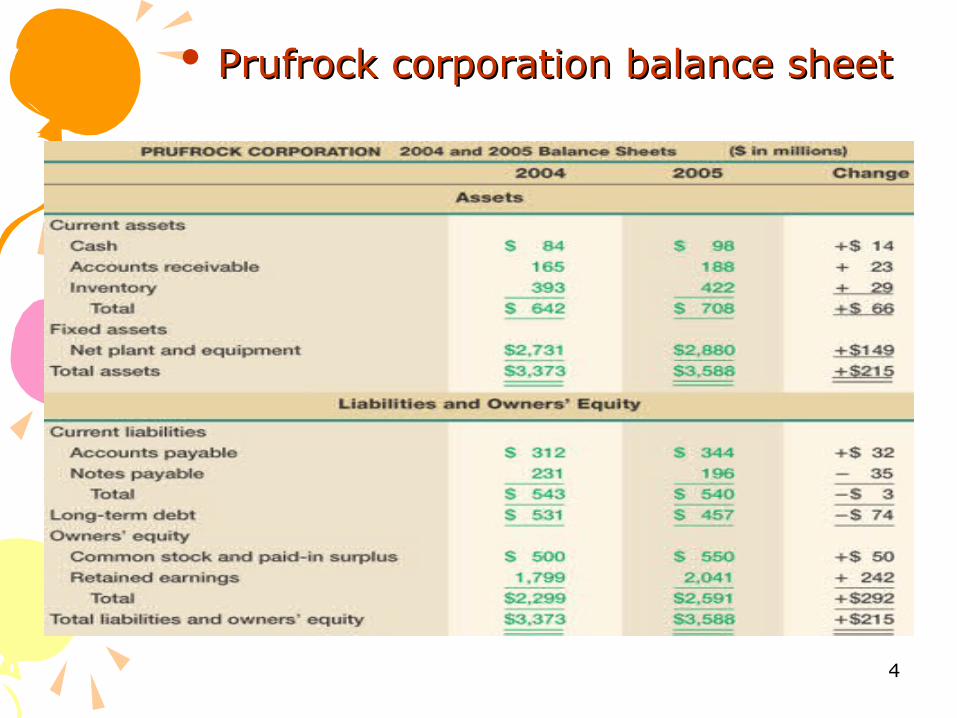
• Prufrock corporation balance sheetPrufrock corporation balance sheet

5
•Prufrock corporation common size balance Prufrock corporation common size balance sheetsheet

6
• Prufrock corporation income statementPrufrock corporation income statement

7
•Prufrock corporation : common-size income Prufrock corporation : common-size income statementstatement

3.2.3 The useful of common size
• Standardized statements make it easier to compare financial information, particularly as the company grows. They are also useful for comparing companies of different sizes, particularly within the same industry.
8

3.3 Trend analysis
Trend Analysis is an exercise of collecting data and attempting to spot a pattern, or trend, in the information.
In some fields of study, the term "trend analysis" has more formally defined meanings.
Although trend analysis is often used to forecast future events, it could be used to estimate or guess uncertain events in the past, such as how many events probably ruled between two dates, based on data such as the average years .
9

3-10
Summary of Standardized Summary of Standardized Financial StatementsFinancial Statements

11© 2011 Pearson Prentice Hall. All rights reserved.
Financial Ratio AnalysisFinancial Ratio AnalysisThe Purpose of Financial Ratio The Purpose of Financial Ratio
AnalysisAnalysis
Financial Analysis using Ratios• A popular way to analyze the financial
statements is by computing ratios. A ratio is a relationship between two numbers, e.g. If ratio of A: B = 30:10 ==> A is 3 times B.
• A ratio by itself may have no meaning. Hence, a given ratio is compared to:– (a) ratios from previous years
– (b) ratios of other firms and/or leaders in the same industry

12© 2011 Pearson Prentice Hall. All rights reserved.
Uses of Financial Ratios: Uses of Financial Ratios: WithinWithin the Firm the Firm
Identify deficiencies in a firm’s performance and take corrective action.
Evaluate employee performance and determine incentive compensation.
Compare the financial performance of different divisions within the firm.
Prepare, at both firm and division levels, financial projections.
Understand the financial performance of the firm’s competitors.
Evaluate the financial condition of a major supplier.

13© 2011 Pearson Prentice Hall. All rights reserved.
Uses of Financial Ratios: Uses of Financial Ratios: OutsideOutside the Firm the Firm
Financial ratios are used by: • Lenders in deciding whether or not to make a
loan to a company.
• Credit-rating agencies in determining a firm’s credit worthiness.
• Investors (shareholders and bondholders) in deciding whether or not to invest in a company.
• Major suppliers in deciding to whether or not to grant credit terms to a company.

14© 2011 Pearson Prentice Hall. All rights reserved.
The Limitations of The Limitations of Financial Ratio AnalysisFinancial Ratio Analysis
• It is sometimes difficult to identify industry categories or comparable peers.
• The published peer group or industry averages are only approximations.
• Industry averages may not provide a desirable target ratio.
• Accounting practices differ widely among firms.
• A high or low ratio does not automatically lead to a specific conclusion.
• Seasons may bias the numbers in the financial statements.

1)Liquidity Ratios:1) Current ratio = Current assets/Current liabilities This ratio measures the degree of liquidity by comparing its
current assets to its current liabilities. Higher figure means that the business financial condition is better as it has enough liquid assets for its operation.
2) Quick ratio = (current assets-inventory/current liabilities)This ratio is a more stringent measure of liquidity than the current ratio. It excludes inventories and other current assets that are least liquid from current assets. Higher ratio shows that the business has enough quick assets or liquid assets to cover its short term debt immediately.
© 2011 Pearson Prentice Hall. All rights reserved.
15

3) Cash ratio = cash/current liabilities4) Net working capital to total assets= net working capital/ total assets.5) Interval measures=current asset/ average daily operating cost average daily operating cost = COGS/365 days
16

22) ASSET MANAGEMENT/ ACTIVITY/ EFFICIENCY RATIOS
1) Average collection periods (ACP)= Accounts receivable/ (Annual credit sales/365)
ACP = Accounts receivable/Daily salesThe ratio measures how long a firm takes to collect its credit accounts. The lower the figure is better.
2) Account receivable turnover = sales/accounts receivables This ratio measures how often accounts receivables are “rolled over” during a year. Higher ratio illustrates that the firm can collect its debt more frequent and thus has few bad debts.
3) Inventory turnover = costs of good sold/inventoryIt measures the number of times a firm’s inventories are sold and replaced during the year. Higher ratio indicates that inventory can be sold and replaced more frequently.
© 2011 Pearson Prentice Hall. All rights reserved.
17

4) Fixed asset turnover = sales/net fixed assetsThis ratio is an overall measure of asset efficiency based on the relation between firm’s sales and the total assets. Higher ratio indicates that firm is managing its assets more effectively.
5) Total asset turnover = sales/total assetsHigher ratio is favored because it indicates the effectiveness of the firm in generating sales from its total assets.
6) Day’s dales in inventory= 365 days/inventory turnover7) NWC = sales/NWC
© 2011 Pearson Prentice Hall. All rights reserved.
18

3)PROFITABILITY RATIOS3)PROFITABILITY RATIOS
1) Gross profit margin= gross profit/ salesThe gross profit margin is a measure of the gross profit earned on sales. The gross profit margin considers the firm's cost of goods sold, but does not include other costs. Higher ratio is better.
2) Net profit margin = Net income/salesA higher profit margin indicates a more profitable company that has better control over its costs compared to its competitors.
3) Operating Profit Margin(OPM) = Operating profit/Sales
OPM examines how effective the company is in managing its cost of goods sold and operating expenses that determine the operating profit.
© 2011 Pearson Prentice Hall. All rights reserved.
19

4) Return on assets (ROA) = Net income/total assets This evaluates how effectively the company employs its
assets to generate a return. It measures efficiency. Higher ratio is better.5) Return on equity (ROE) = Net income/ common equity Return on equity is the bottom line measure for the
shareholders, measuring the profits earned for each dollar invested in the firm's stock. Higher ratio is favored because the firm can generate better return to the owner of the firm.
6) Basic Earning power = EBIT/Total assets
© 2011 Pearson Prentice Hall. All rights reserved.
20

4)LEVERAGE RATIOS4)LEVERAGE RATIOS1) Debt ratio = total debt/total assets
This ratio measures the extent to which a firm has been financed with debt. More debt financing results in more financial risk.
2) Times interest earned= EBIT/interestThe times interest earned ratio indicates how well the firm's earnings can cover the interest payments on its debt. Higher ratio shows better ability in meeting interest payment.
3) Debt to equity ratio = total debt/total equity This ratio indicates what proportion of equity and debt the company is using to finance its assets. A high debt to equity ratio could indicate that the company may be over- leveraged, and should look for ways to reduce its debt.4) Equity multiplier = total assets/total equity5) Cash coverage = (EBIT+depreciation) / interest
© 2011 Pearson Prentice Hall. All rights reserved.
21

5)MARKET VALUE RATIOS5)MARKET VALUE RATIOS1) Earning per share (EPS) = Net income/number of shares outstanding It represents the portion of a firm's earnings that is allocated to each share
of common stock.2) Price earning ratio (PE) = price per share/earnings per share The ratio indicates how much investors are willing to pay per dollar of
current earnings. As such, high P/E Ratios are associated with growth stocks. The most common measure of how expensive a stock is.
3) Price (market) to book ratio=price per share/book value per share his ratio measures how much a company worth at present, in comparison with the amount of capital invested by current and past shareholders into it.4) Book value per share= Total equity/Number of shares outstanding The ratio of stockholder equity to the number of common stocks. Book value per share should not be thought of as an indicator of economic worth, since it reflects accounting valuation (and not necessarily market valuation). 5) price/cash flow = price per share/ cash flow per share
© 2011 Pearson Prentice Hall. All rights reserved.
22

23© 2011 Pearson Prentice Hall. All rights reserved.
Table 4-1

24© 2011 Pearson Prentice Hall. All rights reserved.
Table 4-2

1) 1) LIQUIDITY RATIOLIQUIDITY RATIORATIO FORMULA DAVIES INC. PEER GROUP
1) Current ratio Current assets/current
liabilities
$143m/$64m=2.23
1.80
2) Quick ratio (current assets-inventory/
current liabilities)
($143m-$84m)/$64m =0.92
0.89
3) Cash Ratio Cash/current liabilities
4) Net working capital to total assets
NWC/total assets
5)Interval measure
Current assets/average daily operating
cost
© 2011 Pearson Prentice Hall. All rights reserved.
25

2)ASSET MANAGEMENT/ 2)ASSET MANAGEMENT/ ACTIVITY/EFFICIENCY RATIOSACTIVITY/EFFICIENCY RATIOS
RATIO FORMULA DAVIES INC. PEER GROUP1) Average collection periods (ACP)
Accounts receivable/(Annual credit
sales/365)
$36m/($600m/365)= 21.90 days
25 days
2)Account receivable turnover
sales/accounts receivables
$600m/$36m=16.67x
14.6x
3)Inventory turnover costs of good sold/inventory
$460m/$84m=5.48x
7.00x
4)Fixed asset turnover
sales/net fixed assets
$600m/$295m=2.03x
1.75x
5)Total asset turnover
sales/total assets $600m/$438m=1.37x
1.15x
6) Day’s sales in inventory
365 days/inventory turnover
7) NWC Sales/NWC
© 2011 Pearson Prentice Hall. All rights reserved.
26

3)PROFITABILITY RATIOS3)PROFITABILITY RATIOSRATIO FORMULA DAVIES INC. PEER GROUP
1)Gross profit margin
gross profit/sales $140m/$600m=0.233=23.3%
25%
2)Net profit margin Net income/sales $42m/$600m=0.07=7%
6.5%
3)Operating Profit Margin(OPM)
Operating profit/Sales
$75m/$600m=0.125=12.5%
15.5%
4)Return on assets (ROA)
Net income/total assets
$42m/$438m=0.096=9.6%
10%
5)Return on equity (ROE)
Net income/ common equity
$42m/$203m=0.207=20.7%
18%
6) Basic Earning power (BEP)
EBIT/total assets
© 2011 Pearson Prentice Hall. All rights reserved.
27

4)LEVERAGE RATIOS4)LEVERAGE RATIOS
© 2011 Pearson Prentice Hall. All rights reserved.
28
RATIO FORMULA DAVIES INC. PEER GROUP
1)Debt ratio total debt/total assets $235m/$438m
=0.537=53.7%
35%
2)Times interest earned
EBIT/interest $75m/$15m=5.0x
7.0x
3)Debt to equity ratio
total debt/total equity $235m/$203m=1.16x
2.05x
4) Equity multiplier
Total assets/total equity
5) Cash coverage (EBIT+depreciation) /interest

5)MARKET VALUE RATIOS5)MARKET VALUE RATIOSRATIO FORMULA DAVIES INC. PEER GROUP
1)Earning per share (EPS)
Net income/number of shares
outstanding
$42m/20m=$2.10 $1.89
2) Price earning ratio (PE)
price per share/earnings per
share
(assume the market price for Davies
stock was $32 per share)
$32/$2.10=15.24x 19.0x
3)Price (market) to book ratio
price per share/book value per share
$32/$10.15=3.15x 3.7x
4)Book value per share
Total equity/Number of shares outstanding
$203m/20m=$10.15
$11.05
5)Price per share/ cash flow per share
© 2011 Pearson Prentice Hall. All rights reserved.
29

3.7 Dupont Analysis3.7 Dupont Analysis
30
STEP 1
STEP 2
STEP 3

ADDITIONAL QUESTIONSADDITIONAL QUESTIONS Question 1
Secular Electric has total equity of RM560,000; sales of RM2,250,000; current assets of RM700,000; and total liabilities of RM435,000. What is Secular Electric’s total assets turnover?Total assets turnover = sales/total assets = 2,250,000/total assetsFind total assetsTotal assets = fixed assets + current assetsTotal assets = total equity + total liabilitiesThus, (Fixed assets + 700,000) = 560,000 + 435,000
Fixed assets = 295,000 Thus, total assets = 295,000 + 700,000 = 995,000
Find total assets turnover = 2,250,000/995,000 = 2.26x
© 2011 Pearson Prentice Hall. All rights reserved.
31

Question 2 SRC has a debt ratio of 0.4, current liabilities of RM18,000, and
total assets of RM100,000. What is the level of SRC’s total liabilities?
Total debt=total liabilities
Debt ratio = total debt/total assets = 0.40.4 = total debt/100,000
total debt/liabilities = RM40,000
© 2011 Pearson Prentice Hall. All rights reserved.
32