ca-activation and stretch-activation in insect flight muscle
TRANSCRIPT

Ca-Activation and Stretch-Activation in Insect Flight Muscle
Marco Linari,* Michael K. Reedy,y Mary C. Reedy,y Vincenzo Lombardi,* and Gabriella Piazzesi**Laboratorio di Fisiologia, Dipartimento di Biologia Animale e Genetica, Universita degli Studi di Firenze and Istituto Nazionale di Fisicadella Materia, Firenze, Italy; and yDuke University Medical Center, Department of Cellular Biology, Durham, North Carolina
ABSTRACT Asynchronous insect flight muscle is specialized for myogenic oscillatory work, but can also produce isometrictetanic contraction. In skinned insect flight muscle fibers from Lethocerus, with sarcomere length monitored by a striationfollower, we determined the relation between isometric force (F0) at serial increments of [Ca21] and the additional active forcerecruited at each [Ca21] by a stretch of ;12 nm per half-sarcomere (FSA). The isometric force-pCa relation shows that 1.5–2units of pCa are necessary to raise isometric force from its threshold (pCa ;6.5) to its maximum (F0,max). The amplitude of FSA
depends only on the preceding baseline level of isometric force, which must reach at least 0.05 F0,max to enable stretch-activation. FSA rises very steeply to its maximum as F0 reaches ;0.2 F0,max, then decreases as F0 increases so as to producea constant sum (F0 1 FSA) ¼ Fmax. Thus Ca- and stretch-activation are complementary pathways that trigger a commonprocess of cross-bridge attachment and force production. We suggest that stretch-induced distortion of attached cross-bridgesrelieves the steric blocking by tropomyosin of additional binding sites on actin, thereby enabling maximum force even at low[Ca21].
INTRODUCTION
Stretch of a calcium-activated muscle triggers a delayed
increase of force, a phenomenon called stretch-activation
(SA). Stretch-activation is present in skeletal and, especially,
in cardiac muscle of vertebrates (Steiger, 1977; Vemuri et al.,
1999), but is stronger and longer-lasting in asynchronous
fibrillar insect flight muscle (IFM) (Abbott and Steiger,
1977; Pringle, 1978). Three-quarters of all known insect
species depend for flight on asynchronous IFM (Josephson
et al., 2000b). In these, wingbeat rhythm is not matched to
the rate of neural stimulation, which supports oscillatory
work at a myogenic rather than neurogenic rhythm. During
live insect flight, alternating contractions of antagonistic
muscles sustain high power, oscillatory cycling at frequen-
cies from ;20 Hz in large bugs and beetles to $1000 Hz in
tiny midges (Pringle, 1978; Josephson et al., 2000a,b).
Stretch-activation has been duplicated in skinned muscle
fibers by holding activating calcium at a constant ‘‘priming’’
level (for example, 3 mM free [Ca21]; Tregear et al., 1998),
at which isometric force generation is low. With [Ca21] held
at priming level, a small stretch (i.e., 1.5% of the fiber length)
is followed by a large, delayed rise of active force, persistent
over seconds. Reshortening to the original length triggers
a delayed reduction of force (shortening deactivation). A
stretch superposed on the low force level resulting from
shortening deactivation can again trigger SA, recovering the
prerelease isometric force (Guth et al., 1981).
Stretch-activation is the most important mode for power-
ing flight in insects that have asynchronous IFM (Jewell and
Ruegg, 1966; Abbott and Mannherz, 1970; Josephson et al.,
2000b). However, isometric contraction in intact asynchro-
nous IFM tetanized by electrical or nerve stimulation has
also been well demonstrated by other studies (Machin and
Pringle, 1959; Ikeda and Boettiger, 1965; Heinrich, 1993;
Josephson et al., 2000a, 2001). Isometric contraction can be
produced in glycerinated Lethocerus IFM fibers by simply
raising [Ca21] to $0.01 mM in the presence of MgATP
(Taylor et al., 1999). The physiological role for isometric
contraction in asynchronous IFM is most notable in the use
of tetanus (simultaneous prolonged isometric contraction by
opposing flight muscles) for shivering thermogenesis, which
occurs during the preflight warmup that brings IFM to
;40�C, as required for flight in bees and most larger insects
(Barber and Pringle, 1966; Heinrich, 1993; 1996).
Despite 40 years of investigations, it is still not clear if
force development by stretch-activation implies a mechanism
different from force development determined by Ca-
activation. Moreover, it is controversial whether optimum
stretch-activation requires a high Ca-activated tension (pCa
;4.5; Lund et al., 1987, 1988; Granzier and Wang, 1993), or
a minimal Ca-activated tension (Abbott and Mannherz,
1970; Tregear et al., 1998).
Are stretch-activation and Ca-activation additive, com-
plementary, or competitive? What fraction of the total force
capability remains to be developed by SA after full isometric
activation by Ca21? Does isometric force development after
an increase of [Ca21] actually imply latent stretch-activation
owing to prestretch of the fiber while relaxed (Jewell and
Ruegg, 1966; Granzier and Wang, 1993)?
These questions can be resolved by continuously
monitoring sarcomere length during the mechanical force
responses. This insures 1), that isometric contraction is not
affected by shortening against failing segments of weakened
Submitted November 18, 2003, and accepted for publication April 26, 2004.
Address reprint requests to Gabriella Piazzesi, Laboratorio di Fisiologia del
Dipartimento di Biologia Animale e Genetica, c/o Dipartimento di Fisica,
Via G. Sansone 1, I-50019 Sesto Fiorentino (Fl), Italy. Tel.: 39-055-
457-2385; Fax: 39-055-457-2121; E-mail: [email protected].
� 2004 by the Biophysical Society
0006-3495/04/08/1101/11 $2.00 doi: 10.1529/biophysj.103.037374
Biophysical Journal Volume 87 August 2004 1101–1111 1101
sarcomeres or against excessive end compliance, complica-
tions that can induce shortening deactivation and 2), that the
size of the half-sarcomere stretch chosen for eliciting SA is
maintained constant throughout the experiment, as it must be
for determining the dependence of stretch-activation on
[Ca21] and isometric force.
In Lethocerus IFM skinned fibers with sarcomere length
recording by a striation follower (Huxley et al., 1981), we
have determined the relation between isometric force (F0) at
serial increments of [Ca21] and the additional active force
(FSA) recruited at each [Ca21] by a stretch of ;12 nm per
half-sarcomere. Since Mg21 has been reported to depress
active force in IFM (White and Donaldson, 1975; M. K.
Reedy, unpublished results), experiments were repeated at
two [Mg21] to modulate, at the same [Ca21], the isometric
force on which SA is superimposed. This provides a baseline
for exploring whether SA depends on [Ca21] or on prestretch
isometric force. We find that SA can be triggered above
a threshold level of Ca-activated force (;0.05 of maximal
isometric force, F0,max). The amplitude of FSA depends only
on the preceding baseline level of Ca-activated isometric
force (F0). FSA rises steeply to its maximum as F0 rises from
the threshold level to ;0.2 F0,max. As F0 rises higher, the
amplitude of FSA decreases proportionately, so that the sum
(F01FSA) maintains a maximum constant value (Fmax).
Increasing [Mg21] shifts to the right the dependence of
isometric F0 on pCa, but does not alter the relation between
FSA and F0. These results indicate that stretch-activation and
Ca-activation are complementary in recruiting force-gener-
ating cross-bridges. The dependence of SA on a minimum
number of Ca-activated cross-bridge attachments suggests
that the stretch-induced distortion of cross-bridges acts so as
to spread the displacement of tropomyosin over longer
segments of actin than those activated by calcium-troponin at
low [Ca21]. The mechanism of stretch-activation proposed
in this work provides a framework for explaining the ability
of IFM to produce oscillatory work.
METHODS
Preparation and mounting of the fibers
Single fibers were dissected from glycerinated bundles of the dorsal
longitudinal muscle of the giant waterbug Lethocerus indicus (Fam.
Belostomatidae). The bundles were prepared from dorsal longitudinal
muscles permeabilized in a protease-inhibitor cocktail by osmotic-shock
treatment, cycling alternately between detergent and glycerol buffers before
cryostorage in 75% glycerol relaxing buffer with 5 mM DTT at �80� to
�100�C for up to one year before use, as described (Reedy et al., 1988).
Fibers, selected for maximum transparency (only ;30% develop during
glycerination the glassy transparency that suits them for the striation
follower), were moved from storing solution into relaxing solution. Handcut
aluminum T-clips were gently clamped to the ends of a working segment
3–4-mm long. T-clipped fibers were thenmounted in the experimental trough
containing a drop (;80 ml) of relaxing solution between the lever arms of
a capacitance gauge force transducer (30–40 kHz resonant frequency,
Huxley and Lombardi, 1980) and a fast loudspeaker motor (Lombardi and
Piazzesi, 1990). The T-clipped ends of the relaxed fiber segment were fixed
in air (during timed liftouts of ;20 s) by capillary tube (I.D. 0.25 mm)
application of aqueous rigor solution containing glutaraldehyde (5% v/v) and
were then glued to the clips by similar applications of shellac dissolved in
ethanol (8.3% w/v; Bershitsky and Tsaturyan, 1995). A rapid solution
exchange system held four separate ;80-ml drops of buffer on a thermo-
regulated motordriven platform, each drop;3-mm deep, optically flattened
top and bottom between 33 9-mm rectangles of coverslip glass. Horizontal
translation by a computer-controlled stepper motor (Linari et al., 1993)
changed solutions by moving one drop after another to the fiber, which was
kept aligned and unmoving on the optical axis of a striation follower (Huxley
et al., 1981). The system allowed immediate and continuous recording of
sarcomere length in a selected segment of the fiber in each new solution by
the striation follower. As shown in Fig. 1, sarcomere length recording started
as soon as the glass floor, supporting any new drop, moved into alignment
with the optical axis of the striation follower.
Solutions
The composition of the relaxing and activating solutions (Table 1) was
calculated, at low and high Mg, with a computer program similar to that
described by Brandt et al. (1972), kindly provided by P. W. Brandt. The
concentrations of multivalent ionic species are calculated after solving the
multiple equilibria of two metals (Ca and Mg) and two ligands (EGTA and
ATP), by using the following apparent association constant (log values at
pH ¼ 6.8): CaEGTA, 5.9; MgEGTA, 0.5; CaATP, 3.6; MgATP, 4.0. Potas-
sium propionate was used to adjust the ionic strength to 105 mM in all
final solutions.
Experimental protocol
Fiber length was adjusted in relaxing solution so as to have the fiber just taut.
Relaxed force was 0.04 6 0.03 (mean 6 SE) F0,max (where F0,max is the
isometric force developed at saturating [Ca21] in low [Mg21]). Relaxed
sarcomere length was measured with a 403 objective at 3–5 regions of the
fiber. The variation of sarcomere length along the fibers was at maximum
60.6% (SE). Average sarcomere length from the five fibers selected for
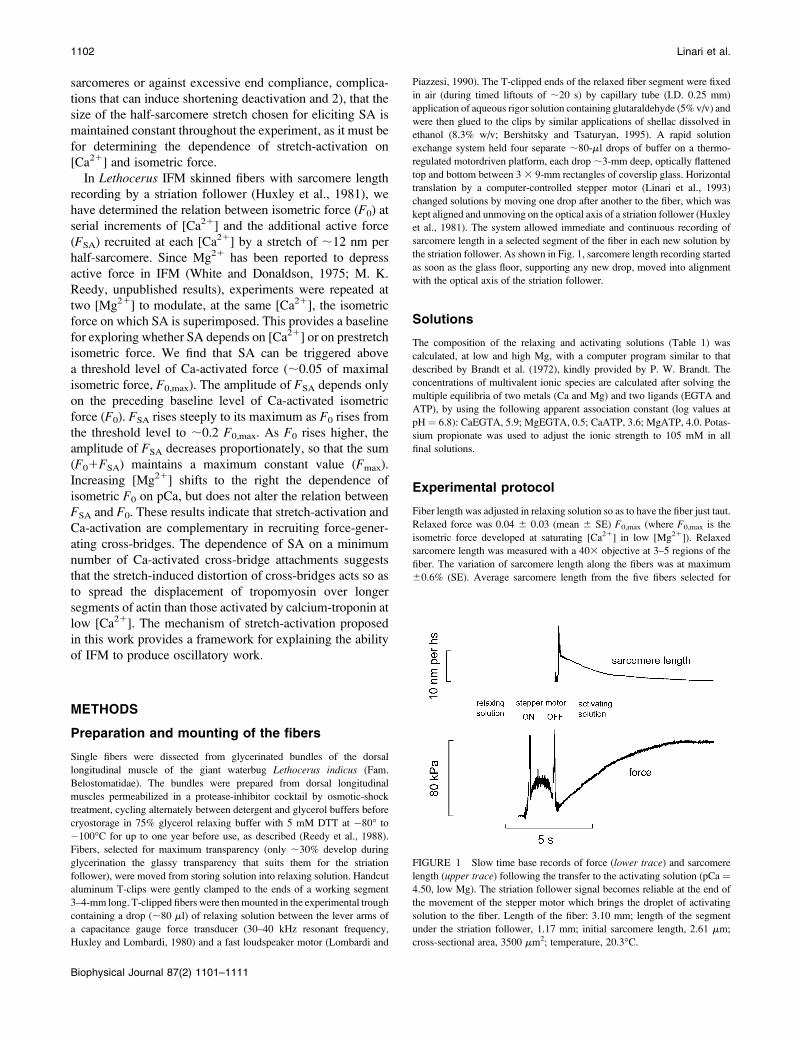
FIGURE 1 Slow time base records of force (lower trace) and sarcomere
length (upper trace) following the transfer to the activating solution (pCa ¼4.50, low Mg). The striation follower signal becomes reliable at the end of
the movement of the stepper motor which brings the droplet of activating
solution to the fiber. Length of the fiber: 3.10 mm; length of the segment
under the striation follower, 1.17 mm; initial sarcomere length, 2.61 mm;
cross-sectional area, 3500 mm2; temperature, 20.3�C.
1102 Linari et al.
Biophysical Journal 87(2) 1101–1111
analysis was 2.656 0.02 mm. The changes in the sarcomere length (nm per
half-sarcomere, hs) of a selected segment;1.0-mm long were continuously
monitored by the striation follower. Only the fibers (five) that maintained
a good sarcomere length signal throughout the whole experiment were
considered for the analysis. In these fibers the shortening accompanying the
rise of maximal Ca-activated force was 2.84 6 1.08 nm/hs and reduced in
proportion to the lower force at lower [Ca21].
For each activation, after the isometric force had attained a steady value
(F0), which required from ;15 s (pCa 3.5) to ;65 s (pCa 6.7), stretch-
activationwas induced by applying to the fiber a 0.5-ms step-stretch of 11.860.5 nm/hs. This was achieved by adjusting the size of the step produced by the
motor to 1.66 0.1% of the fiber length at the beginning of the experiment. In
the selected fibers a constant setting for motor stretch remained adequate to
produce the desired half-sarcomere stretch for the whole duration of the
experiment. Force baseline was measured following development of SA, by
applying a large (30–40 nm/hs) step release 1 s after the stretch (Fig. 2 B).
After eachCa-activation, lasting from20 s (pCa 3.5) to 70 s (pCa6.7), thefiber
was transferred back into relaxing solution. A stretch of the same amplitude
was imposed on the relaxed fiber at several times during the experiment to
determine the passive response to the 12-nm stretch (Fig. 2 A). This was;0.2
F0,max (Fig. 4, row 0). Experiments were done both at 0.3 mM free [Mg21]
(lowMg) and 1mM free [Mg21] (highMg), taking each fiber through the full
pCa range in both cases. The starting [Mg21] level, low or high, chosen for
each serial set of [Ca21] increments from pCa¼ 9 to pCa¼ 4.5 or 3.5 (low or
high Mg21, respectively), was alternated for successive fibers to randomize
the cumulative effects of deterioration of the fiberwith successive activations.
Usually two complete series were obtained, one at high and one at low
[Mg21], before the fiber showed impaired mechanical performance,
consisting of deterioration in the sarcomere length signal and/or decrease of
F0 at saturating [Ca12] by.20%.
Data collection and analysis
Force, motor position, and striation follower signals were recorded with
a sampling interval of 0.5 ms via an A/D card (Computerscope EGAA, RC
Electronics, Goleta, CA) on a PC. The limited time resolution used in this
work does not allow adequate resolution within the phase-1 elastic response
(Fig. 2) and accounts for the apparent inconsistency in height of phase-1
spikes in traces in Fig. 4. The responses were measured directly on the PC
with the EGAA software. Force and motor position were continuously
monitored also on a chart recorder (Multitrace 2 Recorders 5022, Lectromed,
Hertfordshire, UK). Data are expressed as mean 6 SE.
RESULTS
Isometric force-pCa relation in low and high Mg
For the same subsaturating [Ca21], F0 was higher in low Mg
than in high Mg, but the maximal isometric force attained at
saturating pCa (F0,S) was only slightly lower (7%) in high
Mg: 80 6 5 kPa (mean 6 SE, five fibers) in low Mg and
75 6 5 kPa in high Mg. However the paired t-test showedthat this difference is significant (p , 0.05), therefore both
high and low Mg data related to stretch-activation are
presented relative to the maximum isometric force, F0,max,
which is the force at saturating pCa (F0,S) in low Mg.
The force-pCa relations (Fig. 3, low Mg, open circles;high Mg, solid circles) develop roughly the same sigmoidal
curvature and slope in either high or low Mg. When the Hill
equation is fitted to the data, the parameter n (the Hill
coefficient that estimates the steepness of the relation) is
2.17 6 0.14 and 1.97 6 0.20 in low and high Mg,
respectively, in agreement with values reported from non-
flight striated muscle of a marine arthropod (Ashley and
Moisescu, 1977). These values are lower than those reported
for vertebrate skeletal muscle, where the slope of the force-
pCa relation is notably steeper (see Fig. 9 and Discussion).
The high Mg relation is shifted toward higher [Ca21] by
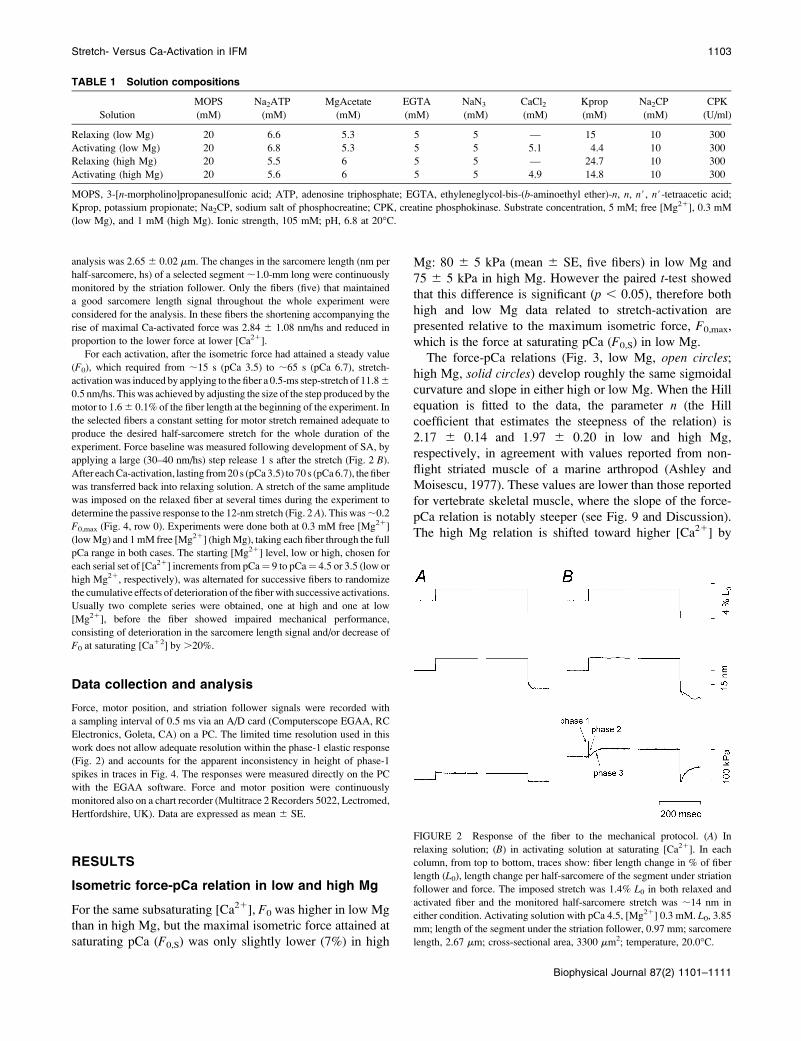
FIGURE 2 Response of the fiber to the mechanical protocol. (A) In
relaxing solution; (B) in activating solution at saturating [Ca21]. In each
column, from top to bottom, traces show: fiber length change in % of fiber
length (L0), length change per half-sarcomere of the segment under striation
follower and force. The imposed stretch was 1.4% L0 in both relaxed and
activated fiber and the monitored half-sarcomere stretch was ;14 nm in
either condition. Activating solution with pCa 4.5, [Mg21] 0.3 mM. L0, 3.85
mm; length of the segment under the striation follower, 0.97 mm; sarcomere
length, 2.67 mm; cross-sectional area, 3300 mm2; temperature, 20.0�C.
TABLE 1 Solution compositions
Solution
MOPS
(mM)
Na2ATP
(mM)
MgAcetate
(mM)
EGTA
(mM)
NaN3
(mM)
CaCl2(mM)
Kprop
(mM)
Na2CP
(mM)
CPK
(U/ml)
Relaxing (low Mg) 20 6.6 5.3 5 5 — 15 10 300
Activating (low Mg) 20 6.8 5.3 5 5 5.1 4.4 10 300
Relaxing (high Mg) 20 5.5 6 5 5 — 24.7 10 300
Activating (high Mg) 20 5.6 6 5 5 4.9 14.8 10 300
MOPS, 3-[n-morpholino]propanesulfonic acid; ATP, adenosine triphosphate; EGTA, ethyleneglycol-bis-(b-aminoethyl ether)-n, n, n#, n#-tetraacetic acid;
Kprop, potassium propionate; Na2CP, sodium salt of phosphocreatine; CPK, creatine phosphokinase. Substrate concentration, 5 mM; free [Mg21], 0.3 mM
(low Mg), and 1 mM (high Mg). Ionic strength, 105 mM; pH, 6.8 at 20�C.
Stretch- Versus Ca-Activation in IFM 1103
Biophysical Journal 87(2) 1101–1111
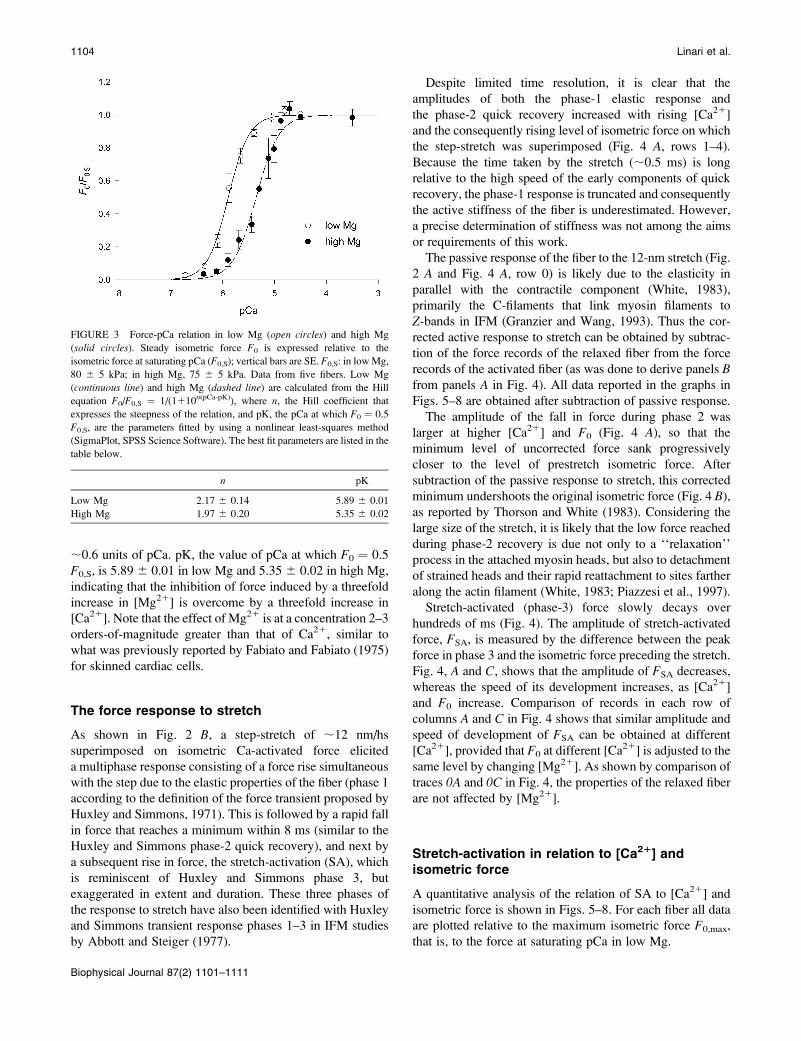
;0.6 units of pCa. pK, the value of pCa at which F0 ¼ 0.5
F0,S, is 5.89 6 0.01 in low Mg and 5.35 6 0.02 in high Mg,
indicating that the inhibition of force induced by a threefold
increase in [Mg21] is overcome by a threefold increase in
[Ca21]. Note that the effect of Mg21 is at a concentration 2–3
orders-of-magnitude greater than that of Ca21, similar to
what was previously reported by Fabiato and Fabiato (1975)
for skinned cardiac cells.
The force response to stretch
As shown in Fig. 2 B, a step-stretch of ;12 nm/hs
superimposed on isometric Ca-activated force elicited
a multiphase response consisting of a force rise simultaneous
with the step due to the elastic properties of the fiber (phase 1
according to the definition of the force transient proposed by
Huxley and Simmons, 1971). This is followed by a rapid fall
in force that reaches a minimum within 8 ms (similar to the
Huxley and Simmons phase-2 quick recovery), and next by
a subsequent rise in force, the stretch-activation (SA), which
is reminiscent of Huxley and Simmons phase 3, but
exaggerated in extent and duration. These three phases of
the response to stretch have also been identified with Huxley
and Simmons transient response phases 1–3 in IFM studies
by Abbott and Steiger (1977).
Despite limited time resolution, it is clear that the
amplitudes of both the phase-1 elastic response and
the phase-2 quick recovery increased with rising [Ca21]
and the consequently rising level of isometric force on which
the step-stretch was superimposed (Fig. 4 A, rows 1–4).
Because the time taken by the stretch (;0.5 ms) is long
relative to the high speed of the early components of quick
recovery, the phase-1 response is truncated and consequently
the active stiffness of the fiber is underestimated. However,
a precise determination of stiffness was not among the aims
or requirements of this work.
The passive response of the fiber to the 12-nm stretch (Fig.
2 A and Fig. 4 A, row 0) is likely due to the elasticity in
parallel with the contractile component (White, 1983),
primarily the C-filaments that link myosin filaments to
Z-bands in IFM (Granzier and Wang, 1993). Thus the cor-
rected active response to stretch can be obtained by subtrac-
tion of the force records of the relaxed fiber from the force
records of the activated fiber (as was done to derive panels Bfrom panels A in Fig. 4). All data reported in the graphs in
Figs. 5–8 are obtained after subtraction of passive response.
The amplitude of the fall in force during phase 2 was
larger at higher [Ca21] and F0 (Fig. 4 A), so that the
minimum level of uncorrected force sank progressively
closer to the level of prestretch isometric force. After
subtraction of the passive response to stretch, this corrected
minimum undershoots the original isometric force (Fig. 4 B),as reported by Thorson and White (1983). Considering the
large size of the stretch, it is likely that the low force reached
during phase-2 recovery is due not only to a ‘‘relaxation’’
process in the attached myosin heads, but also to detachment
of strained heads and their rapid reattachment to sites farther
along the actin filament (White, 1983; Piazzesi et al., 1997).
Stretch-activated (phase-3) force slowly decays over
hundreds of ms (Fig. 4). The amplitude of stretch-activated
force, FSA, is measured by the difference between the peak
force in phase 3 and the isometric force preceding the stretch.
Fig. 4, A and C, shows that the amplitude of FSA decreases,
whereas the speed of its development increases, as [Ca21]
and F0 increase. Comparison of records in each row of
columns A and C in Fig. 4 shows that similar amplitude and
speed of development of FSA can be obtained at different
[Ca21], provided that F0 at different [Ca21] is adjusted to the
same level by changing [Mg21]. As shown by comparison of
traces 0A and 0C in Fig. 4, the properties of the relaxed fiber
are not affected by [Mg21].
Stretch-activation in relation to [Ca21] andisometric force
A quantitative analysis of the relation of SA to [Ca21] and
isometric force is shown in Figs. 5–8. For each fiber all data
are plotted relative to the maximum isometric force F0,max,
that is, to the force at saturating pCa in low Mg.
FIGURE 3 Force-pCa relation in low Mg (open circles) and high Mg
(solid circles). Steady isometric force F0 is expressed relative to the
isometric force at saturating pCa (F0,S); vertical bars are SE. F0,S: in lowMg,
80 6 5 kPa; in high Mg, 75 6 5 kPa. Data from five fibers. Low Mg
(continuous line) and high Mg (dashed line) are calculated from the Hill
equation F0/F0,S ¼ 1/(1110n(pCa-pK)), where n, the Hill coefficient that
expresses the steepness of the relation, and pK, the pCa at which F0 ¼ 0.5
F0,S, are the parameters fitted by using a nonlinear least-squares method
(SigmaPlot, SPSS Science Software). The best fit parameters are listed in the
table below.
n pK
Low Mg 2.17 6 0.14 5.89 6 0.01
High Mg 1.97 6 0.20 5.35 6 0.02
1104 Linari et al.
Biophysical Journal 87(2) 1101–1111

Plots of total force (F0 1 FSA) versus pCa are shown in
Fig. 5 for both low Mg (left panel, open symbols) and high
Mg (right panel, open symbols) together with the corre-
sponding isometric force-pCa relations (solid symbols). Ineither Mg21 concentration, (F0 1 FSA) begins to increase
abruptly, as soon as the [Ca21] is enough to cause the
development of a minimum isometric tension (0.05 F0,max),
which defines the threshold for triggering SA. (F0 1 FSA)
attains its maximum value, Fmax, at a [Ca21] much lower
than that required to raise F0 to its maximum. Fmax always
remains ;10% . F0,max. The (F0 1 FSA)-pCa relation is
shifted to the right at high Mg, similar to the rightward shift
of the F0-pCa relation. However, a precise definition of the
early events in the (F0 1 FSA)-pCa relation and of its Mg-
dependent shift is difficult, due to the abrupt increase of FSA
near the SA triggering threshold.
In Fig. 6 the amplitude of stretch-activated force, FSA, is
plotted versus pCa for the two [Mg21]. FSA increases steeply
to its maximum value within 0.4–0.6 pCa units at the SA
triggering threshold. FSA then decreases to its minimum
value of ;10–20% of Fmax at the [Ca21] high enough to
produce maximum isometric force. The minimum FSA at
saturating pCa is larger in high Mg (;0.2 F0,max) than in low
Mg (;0.1 F0,max) because in high Mg the maximum
isometric force is 7% lower than in low Mg, whereas Fmax
is the same. In parallel with the effect of [Mg21] on the F0-
pCa relation, high Mg also shifts the maximum value of FSA
toward higher [Ca21] by ;0.6 units.
FIGURE 4 Stretch-activated force responses
(FSA) to 0.5-ms ramp-stretch of ;12 nm/hs
superimposed on steady isometric force (F0) at
each different [Ca21]. Note that the limited
time resolution of the records causes inconsis-
tency in the amplitudes for phase-1 elastic
responses. Figures on the right of each trace
indicate the pCa value. Dashed extension of F0
indicates the level above which FSA is
measured. Horizontal rows (1–4) are numbered
from bottom to top in order of increasing
[Ca21]. Row 0 is the response of the relaxed
fiber. Bottom line in each panel shows zero
force. (A and C) Force responses of the
activated fibers are not corrected for the passive
response (bracketed labels). In each row
records were selected to match F0 values within
;5%. (B) Traces obtained from responses of
the activated fiber in A after subtraction of the
force response in the relaxed fiber. F0,S was
85 kPa in low Mg and 80 kPa in high Mg. L0,
3.23 mm; length of the segment under the
striation follower, 0.98 mm; initial sarcomere
length, 2.65mm; cross-sectional area, 4100mm2;
temperature, 20.9�C.
FIGURE 5 Relations of F0 (solid
circles) and (F0 1 FSA) (open circles)
versus pCa at the two [Mg21]. The
ordinate in both graphs is expressed as
relative to F0,max, the isometric force at
saturating pCa in low Mg. Data from
three fibers. Continuous lines are cal-
culated from Hill equation using the
best-fit parameters listed in the table
below.
n pK
Low Mg 2.26 6 0.18 5.94 6 0.02
High Mg 1.89 6 0.20 5.31 6 0.03
Stretch- Versus Ca-Activation in IFM 1105
Biophysical Journal 87(2) 1101–1111

Fig. 7 shows the relations of both (F0 1 FSA) (A) and FSA
(B) versus F0, where all values are expressed as a fraction of
F0,max. The dependence of total force (F0 1 FSA) on F0 in
either the low Mg (open circles) or high Mg (solid circles)regime is the same, independent of [Mg21]. (F0 1 FSA) rises
abruptly as F0 increases and at ;0.2 F0,max has already
attained ;95% of Fmax. This is the consequence of the fact
that SA is not directly dependent on either [Ca21] or [Mg21]
and only depends directly on a minimum level of isometric
force preceding the step. Moreover, as F0 rises above this
minimum threshold value, FSA quickly reaches a maximum
and then reduces in proportion to the further increase in F0.
The complementary role of SA and isometric tension
between 0.2 F0,max and F0,max is made evident in Fig. 7 Bby the linear relation between FSA and F0. In the range where
F0 increases from 0.2 to 1.0 F0,max, FSA reduces proportion-
ally from a maximum of 0.8 F0,max to a minimum of ;0.1
F0,max, independent of the proportions of [Ca21] and
[Mg21]. In fact the slope and the ordinate intercept of the
linear regression equations fitted to low Mg (open circles)and high Mg data (solid circles) do not differ significantly
(see table in Fig. 7 legend). For F0 ,0.05 F0,max, SA is
dramatically impaired, and then, above the threshold level
(;0.05 F0,max), SA develops explosively. This explosive rise
explains the difficulty in precisely defining the relation of
FSA versus pCa when F0 is ,0.2 F0,max.
The rate of stretch-activated force development
The force traces in Fig. 4 show that the development of
stretch-activated force (phase 3) does not occur through
a simple exponential process. At low F0 and large FSA phase
3 shows a sigmoidal time course. As F0 increases and FSA
reduces, phase-3 time course becomes faster and more
exponential-like. Thus the speed of the stretch-activated
force development increases with rising [Ca21]. Fitting the
series of responses with the same equation (sigmoidal or sum
of two exponentials) failed to give satisfactorily results;
however, an estimate of the dependence on [Ca21] of the rate
of FSA development can be obtained by plotting r, the
reciprocal of the time from the minimum of force at the end
of phase 2 to 63% of FSA, against pCa (Fig. 8 A). The 63%time point can only give an approximate estimate of the
overall rate, because it takes in the first component seen at
lower F0 and [Ca21], but the resulting relations nevertheless
turn out to be analytically useful. Thus, at each nonsaturating
pCa, r is higher in low Mg, but at saturating pCa, r reachesthe same value in both high and lowMg. The relations do not
superimpose if the high Mg relation is shifted to the left by
the difference between pK values in Fig. 5 (;0.6 pCa units).
FIGURE 6 Relation of FSA versus pCa. Same data as in Fig. 5. The
ordinate is normalized to F0,max. Lines are the polynomial fit to data. Low
Mg (open circles and continuous line); high Mg (solid circles and dashed
line).
FIGURE 7 Relations of (F01FSA) (A) and FSA (B) versus F0. All data are
made relative to F0,max. Same data and symbols as in Fig. 6. In B, lines are
obtained by linear regression analysis to either low Mg (continuous line) or
high Mg (dashed line) in the range of F0/F0,max .0.09. Parameters (mean6SE) of the line fits in B are listed in the table below.
Slope Ordinate intercept
Low Mg �0.75 6 0.02 0.86 6 0.01
High Mg �0.78 6 0.06 0.92 6 0.04
1106 Linari et al.
Biophysical Journal 87(2) 1101–1111
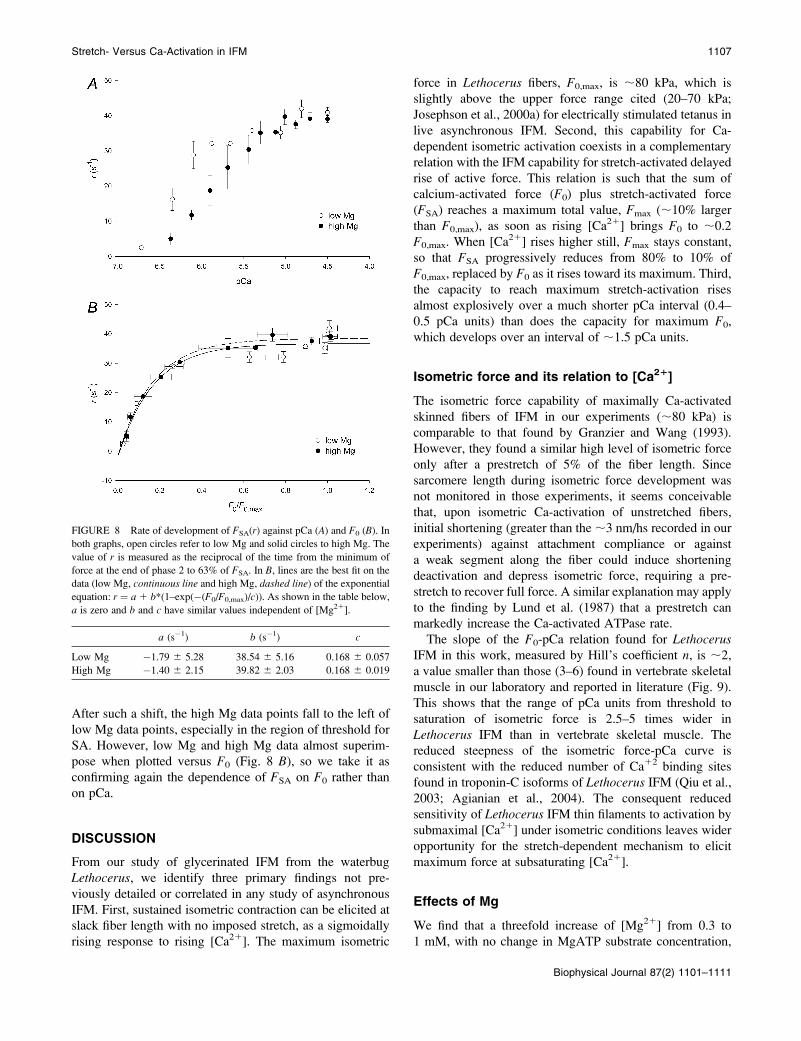
After such a shift, the high Mg data points fall to the left of
low Mg data points, especially in the region of threshold for
SA. However, low Mg and high Mg data almost superim-
pose when plotted versus F0 (Fig. 8 B), so we take it as
confirming again the dependence of FSA on F0 rather than
on pCa.
DISCUSSION
From our study of glycerinated IFM from the waterbug
Lethocerus, we identify three primary findings not pre-
viously detailed or correlated in any study of asynchronous
IFM. First, sustained isometric contraction can be elicited at
slack fiber length with no imposed stretch, as a sigmoidally
rising response to rising [Ca21]. The maximum isometric
force in Lethocerus fibers, F0,max, is ;80 kPa, which is
slightly above the upper force range cited (20–70 kPa;
Josephson et al., 2000a) for electrically stimulated tetanus in
live asynchronous IFM. Second, this capability for Ca-
dependent isometric activation coexists in a complementary
relation with the IFM capability for stretch-activated delayed
rise of active force. This relation is such that the sum of
calcium-activated force (F0) plus stretch-activated force
(FSA) reaches a maximum total value, Fmax (;10% larger
than F0,max), as soon as rising [Ca21] brings F0 to ;0.2
F0,max. When [Ca21] rises higher still, Fmax stays constant,
so that FSA progressively reduces from 80% to 10% of
F0,max, replaced by F0 as it rises toward its maximum. Third,
the capacity to reach maximum stretch-activation rises
almost explosively over a much shorter pCa interval (0.4–
0.5 pCa units) than does the capacity for maximum F0,
which develops over an interval of ;1.5 pCa units.
Isometric force and its relation to [Ca21]
The isometric force capability of maximally Ca-activated
skinned fibers of IFM in our experiments (;80 kPa) is
comparable to that found by Granzier and Wang (1993).
However, they found a similar high level of isometric force
only after a prestretch of 5% of the fiber length. Since
sarcomere length during isometric force development was
not monitored in those experiments, it seems conceivable
that, upon isometric Ca-activation of unstretched fibers,
initial shortening (greater than the ;3 nm/hs recorded in our
experiments) against attachment compliance or against
a weak segment along the fiber could induce shortening
deactivation and depress isometric force, requiring a pre-
stretch to recover full force. A similar explanation may apply
to the finding by Lund et al. (1987) that a prestretch can
markedly increase the Ca-activated ATPase rate.
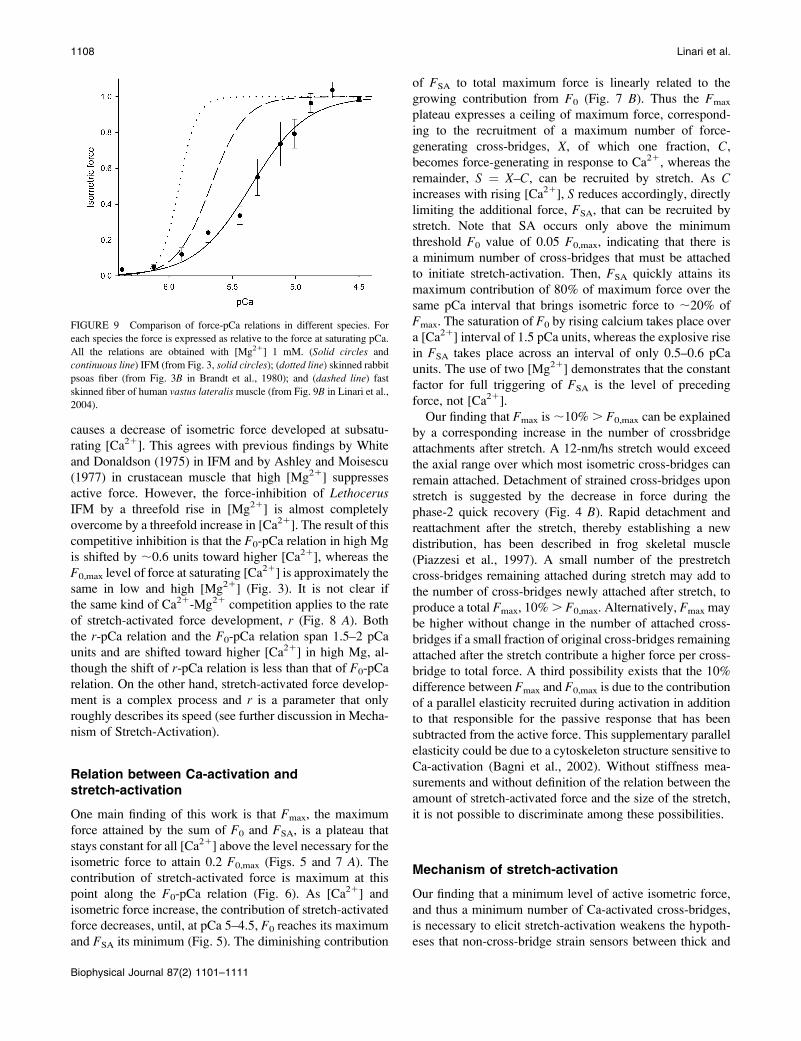
The slope of the F0-pCa relation found for LethocerusIFM in this work, measured by Hill’s coefficient n, is ;2,
a value smaller than those (3–6) found in vertebrate skeletal
muscle in our laboratory and reported in literature (Fig. 9).
This shows that the range of pCa units from threshold to
saturation of isometric force is 2.5–5 times wider in
Lethocerus IFM than in vertebrate skeletal muscle. The
reduced steepness of the isometric force-pCa curve is
consistent with the reduced number of Ca12 binding sites
found in troponin-C isoforms of Lethocerus IFM (Qiu et al.,
2003; Agianian et al., 2004). The consequent reduced
sensitivity of Lethocerus IFM thin filaments to activation by
submaximal [Ca21] under isometric conditions leaves wider
opportunity for the stretch-dependent mechanism to elicit
maximum force at subsaturating [Ca21].
Effects of Mg
We find that a threefold increase of [Mg21] from 0.3 to
1 mM, with no change in MgATP substrate concentration,
FIGURE 8 Rate of development of FSA(r) against pCa (A) and F0 (B). In
both graphs, open circles refer to low Mg and solid circles to high Mg. The
value of r is measured as the reciprocal of the time from the minimum of
force at the end of phase 2 to 63% of FSA. In B, lines are the best fit on the
data (low Mg, continuous line and high Mg, dashed line) of the exponential
equation: r ¼ a 1 b*(1–exp(�(F0/F0,max)/c)). As shown in the table below,
a is zero and b and c have similar values independent of [Mg21].
a (s�1) b (s�1) c
Low Mg �1.79 6 5.28 38.54 6 5.16 0.168 6 0.057
High Mg �1.40 6 2.15 39.82 6 2.03 0.168 6 0.019
Stretch- Versus Ca-Activation in IFM 1107
Biophysical Journal 87(2) 1101–1111
causes a decrease of isometric force developed at subsatu-
rating [Ca21]. This agrees with previous findings by White
and Donaldson (1975) in IFM and by Ashley and Moisescu
(1977) in crustacean muscle that high [Mg21] suppresses
active force. However, the force-inhibition of LethocerusIFM by a threefold rise in [Mg21] is almost completely
overcome by a threefold increase in [Ca21]. The result of this
competitive inhibition is that the F0-pCa relation in high Mg
is shifted by ;0.6 units toward higher [Ca21], whereas the
F0,max level of force at saturating [Ca21] is approximately the
same in low and high [Mg21] (Fig. 3). It is not clear if
the same kind of Ca21-Mg21 competition applies to the rate
of stretch-activated force development, r (Fig. 8 A). Boththe r-pCa relation and the F0-pCa relation span 1.5–2 pCa
units and are shifted toward higher [Ca21] in high Mg, al-
though the shift of r-pCa relation is less than that of F0-pCa
relation. On the other hand, stretch-activated force develop-
ment is a complex process and r is a parameter that only
roughly describes its speed (see further discussion in Mecha-
nism of Stretch-Activation).
Relation between Ca-activation andstretch-activation
One main finding of this work is that Fmax, the maximum
force attained by the sum of F0 and FSA, is a plateau that
stays constant for all [Ca21] above the level necessary for the
isometric force to attain 0.2 F0,max (Figs. 5 and 7 A). Thecontribution of stretch-activated force is maximum at this
point along the F0-pCa relation (Fig. 6). As [Ca21] and
isometric force increase, the contribution of stretch-activated
force decreases, until, at pCa 5–4.5, F0 reaches its maximum
and FSA its minimum (Fig. 5). The diminishing contribution
of FSA to total maximum force is linearly related to the
growing contribution from F0 (Fig. 7 B). Thus the Fmax
plateau expresses a ceiling of maximum force, correspond-
ing to the recruitment of a maximum number of force-
generating cross-bridges, X, of which one fraction, C,becomes force-generating in response to Ca21, whereas the
remainder, S ¼ X–C, can be recruited by stretch. As Cincreases with rising [Ca21], S reduces accordingly, directly
limiting the additional force, FSA, that can be recruited by
stretch. Note that SA occurs only above the minimum
threshold F0 value of 0.05 F0,max, indicating that there is
a minimum number of cross-bridges that must be attached
to initiate stretch-activation. Then, FSA quickly attains its
maximum contribution of 80% of maximum force over the
same pCa interval that brings isometric force to ;20% of
Fmax. The saturation of F0 by rising calcium takes place over
a [Ca21] interval of 1.5 pCa units, whereas the explosive rise
in FSA takes place across an interval of only 0.5–0.6 pCa
units. The use of two [Mg21] demonstrates that the constant
factor for full triggering of FSA is the level of preceding
force, not [Ca21].
Our finding that Fmax is ;10%. F0,max can be explained
by a corresponding increase in the number of crossbridge
attachments after stretch. A 12-nm/hs stretch would exceed
the axial range over which most isometric cross-bridges can
remain attached. Detachment of strained cross-bridges upon
stretch is suggested by the decrease in force during the
phase-2 quick recovery (Fig. 4 B). Rapid detachment and
reattachment after the stretch, thereby establishing a new
distribution, has been described in frog skeletal muscle
(Piazzesi et al., 1997). A small number of the prestretch
cross-bridges remaining attached during stretch may add to
the number of cross-bridges newly attached after stretch, to
produce a total Fmax, 10%. F0,max. Alternatively, Fmax may
be higher without change in the number of attached cross-
bridges if a small fraction of original cross-bridges remaining
attached after the stretch contribute a higher force per cross-
bridge to total force. A third possibility exists that the 10%
difference between Fmax and F0,max is due to the contribution
of a parallel elasticity recruited during activation in addition
to that responsible for the passive response that has been
subtracted from the active force. This supplementary parallel
elasticity could be due to a cytoskeleton structure sensitive to
Ca-activation (Bagni et al., 2002). Without stiffness mea-
surements and without definition of the relation between the
amount of stretch-activated force and the size of the stretch,
it is not possible to discriminate among these possibilities.
Mechanism of stretch-activation
Our finding that a minimum level of active isometric force,
and thus a minimum number of Ca-activated cross-bridges,
is necessary to elicit stretch-activation weakens the hypoth-
eses that non-cross-bridge strain sensors between thick and
FIGURE 9 Comparison of force-pCa relations in different species. For
each species the force is expressed as relative to the force at saturating pCa.
All the relations are obtained with [Mg21] 1 mM. (Solid circles and
continuous line) IFM (from Fig. 3, solid circles); (dotted line) skinned rabbit
psoas fiber (from Fig. 3B in Brandt et al., 1980); and (dashed line) fast
skinned fiber of human vastus lateralis muscle (from Fig. 9B in Linari et al.,
2004).
1108 Linari et al.
Biophysical Journal 87(2) 1101–1111

thin filaments (White, 1983; Bullard et al., 1988; Reedy et al.,
1994) or between thick filaments and Z-band (Thorson and
White, 1983; Al-Khayat et al., 2003) are required to recruit
force generating cross-bridges in IFM. A second proposal,
the match-mismatch model (Wray, 1979), is inconsistent
with our findings. That Ca-activated, isometric force can
reach 90% of the maximum force, whereas stretch-activated
force adds only ;10% to total force, is inconsistent with the
hypothesis that a stretch-induced shift in relative register
between helical arrays on myosin and actin filaments
transforms an isometric state highly inhibited by lattice
mismatch to a state highly enabled by a lattice-matched
position. Moreover, a high degree of lattice register has been
observed in maximally Ca-activated isometric contractions
by EM in IFM quick-frozen for EM tomography (Taylor
et al., 1999; Tregear et al., 2004). We propose that the
mechanism through which stretch promotes recruitment of
cross-bridges in IFM is that the distortion of the Ca-activated
cross-bridges by the stretch displaces tropomyosin (Tm) via
IFM-specific structural interactions involving the regulatory
proteins (Bullard et al., 1988; Agianian et al., 2004), thereby
relieving steric blocking by Tm of myosin binding sites on
actin, and allowing more cross-bridge attachment.
At low [Ca21] with few cross-bridges attached, Tm
blocking of myosin binding sites is considered the main
obstacle to the attachment of more cross-bridges (Brandt
et al., 1987, 1990). Stretch-induced distortion of the attached
cross-bridges can displace longer segments of Tm and open
more binding sites than were opened by Ca-troponin. Our
experiments indicate that the fraction of Ca-activated cross-
bridges required to produce 20% of F0,max is sufficient to
open all of the remaining binding sites to cross-bridge
attachment.
The explosive increase in FSA between 0.05 and 0.2 F0,max
indicates a positive feedback mechanism: the first stretch-
promoted attachments produce further displacement of Tm
allowing further opening of binding sites that repeat the
process as a cascade until saturation of binding sites occurs.
This positive feedback mechanism is particularly evident at
low F0, where, as shown by the sigmoidal shape of tension
rise during stretch-activation, sequential recruitment takes
longer since the initial attachments are fewer. As Ca-
activated cross-bridge attachments increase, the number of
binding sites simultaneously exposed by stretch-induced
displacement of Tm increases, whereas the number of cross-
bridges remaining to be recruited by stretch is reduced. Thus
the rate of the stretch-activated force development increases,
whereas FSA reduces. The positive feedback mechanism
produces a steeply developing saturation of the amplitude of
SA (Fig. 7), whereas the rate of SA development increases
with the number of cross-bridges present before the stretch
(Fig. 8 B). It is possible that the stretch-activation mechanism
we propose is present in all asynchronous IFM. This view is
strengthened by the finding that two TnC isoforms, shown in
Lethocerus IFM to separately enable either stretch-activation
or Ca-activation (Agianian et al., 2004), are also found in
fruitflies and mosquitoes (Qiu et al., 2003). EM evidence
shows that IFM tropomyosin movements in vitro correspond
closely to those shown by vertebrate Tm (Cammarato et al.,
2004). Although the two isoforms of TnC are not found in
other muscles that exhibit stretch-activation, such as verte-
brate myocardium, a mechanism based on axial spread of
tropomyosin displacement, promoted by stretch-induced
distortion of attached cross-bridges, is consistent with present
knowledge of the steric blocking mechanism of regulation, in
which cross-bridge binding and troponin can work in concert
to shift Tm away from the myosin binding sites (Bremel and
Weber, 1972;Maytum et al., 1999; Gordon et al., 2000), even
on actin monomers far from those bound to myosin heads.
Our finding that stretch-activation is almost fully replaced
by Ca-activation at saturating [Ca21] is not in contradiction
with previous studies showing that oscillatory work elicited
by sinusoidal length changes rises with rising [Ca21] (Jewell
and Ruegg, 1966; Blanchard et al., 1999; Irving et al., 2001).
Under oscillatory work conditions, deactivation caused by
the shortening phase, whatever the [Ca21], very probably
induces low force and low number of cross-bridge attach-
ments (Guth et al., 1981), from which the subsequent
restretch phase would recover large FSA, according to the
stretch-activation mechanism proposed here. To model in
detail the interplay between shortening deactivation and
stretch-activation will require future work aimed at de-
termining the dependence on the size of the length change of
both shortening deactivation and stretch-activation and the
related changes in number of cross-bridges.
The authors thank Professor Philip Brandt, Drs. Belinda Bullard and David
Popp for fruitful discussions, and the reviewers for their substantial
contribution to improving the final presentation of the work. We also thank
Mr. Alessandro Aiazzi, Mr. Mario Dolfi, and Ms. Carmen Lucaveche for
skilled technical assistance and Mr. Adrio Vannucchi for preparation of
some illustrations.
The Ministero dell’Istruzione, dell’Universita e della Ricerca, the
Universita di Firenze (Budget 13/04), the United States Public Health
Service-National Institutes of Health (AM 14317 to M.K.R.), and the North
Atlantic Treaty Organisation (Collaborative Research Grant 961199)
supported this research.
REFERENCES
Abbott, R. H., and G. H. Mannherz. 1970. Activation by ADP and thecorrelation between tension and ATPase activity in insect fibrillarmuscle. Pflugers Arch. 321:223–232.
Abbott, R. H., and G. Steiger. 1977. Temperature and amplitudedependence of tension transients in glycerinated skeletal and insectfibrillar muscle. J. Physiol. 266:13–42.
Agianian, B., U. Krzic, F. Qiu, W. A. Linke, K. Leonard, and B. Bullard.2004. A troponin switch that regulates muscle contraction by stretchinstead of calcium. EMBO J. 23:772–779.
Al-Khayat, H. A., L. Hudson, M. K. Reedy, T. C. Irving, and J. M. Squire.2003. Myosin head configuration in relaxed insect flight muscle: x-raymodeled resting crossbridges in a pre-powerstroke state are poised foractin binding. Biophys. J. 85:1063–1079.
Stretch- Versus Ca-Activation in IFM 1109
Biophysical Journal 87(2) 1101–1111

Ashley, C. C., and D. G. Moisescu. 1977. Effect of changing thecomposition of the bathing solutions upon the isometric tension-pCarelationship in bundles of crustacean myofibrils. J. Physiol. 270:627–652.
Bagni, M. A., G. Cecchi, B. Colombini, and F. Colomo. 2002. A non-cross-bridge stiffness in activated frog muscle fibers. Biophys. J. 82:3118–3127.
Barber, S., B., and J. W. S. Pringle.1966. Functional aspects of flight inbelostomatid bugs (Heteroptera). Proc. R. Soc. Lond. B Biol. Sci.164:21–39.
Bershitsky, S. Y., and A. K. Tsaturyan. 1995. Force generation and workproduction by covalently cross-linked actin-myosin cross-bridges inrabbit muscle fibers. Biophys. J. 69:1011–1021.
Blanchard, E., C. Seidman, J. G. Seidman, M. LeWinter, and D. Maughan.1999. Altered crossbridge kinetics in the aMHC403/1 mouse model offamilial hypertrophic cardiomyopathy. Circ. Res. 84:475–483.
Brandt, P. W., J. P. Reuben, and H. Grundfest. 1972. Regulation of tensionin the skinned crayfish muscle fiber. II. Role of calcium. J. Gen. Physiol.59:305–317.
Brandt, P. W., R. N. Cox, and M. Kawai. 1980. Can the binding of Ca21 totwo regulatory sites on troponin C determine the steep pCa/tensionrelationship of skeletal muscle? Proc. Natl. Acad. Sci. USA. 77:4717–4720.
Brandt, P. W., M. S. Diamond, J. S. Rutchik, and F. H. Schachat. 1987. Co-operative interactions between troponin-tropomyosin units extend thelength of the thin filament in skeletal muscle. J. Mol. Biol. 195:885–896.
Brandt, P. W., D. Roemer, and F. H. Schachat. 1990. Co-operativeactivation of skeletal muscle thin filaments by rigor crossbridges. Theeffect of troponin C extraction. J. Mol. Biol. 212:473–480.
Bremel, R. D., and A. Weber. 1972. Cooperation within actin filament invertebrate skeletal muscle. Nat. New Biol. 238:97–101.
Bullard, B., K. Leonard, A. Larkins, G. Butcher, C. Karlik, and E. A.Fyrberg. 1988. Troponin of asynchronous flight muscle. J. Mol. Biol.204:621–637.
Cammarato, A., V. Hatch, J. Saide, R. Craig, J. C. Sparrow, L. S.Tobacman, and W. Lehman. 2004. Drosophila muscle regulationcharacterized by electron microscopy and three-dimensional reconstruc-tion of thin filament mutants. Biophys. J. 86:1618–1624.
Fabiato, A., and F. Fabiato. 1975. Effects of magnesium on contractileactivation on skinned cardiac cells. J. Physiol. 249:497–517.
Gordon, A. M., E. Homsher, and M. Regnier. 2000. Regulation ofcontraction in striated muscle. Physiol. Rev. 80:853–924.
Granzier, H. L., and K. Wang. 1993. Interplay between passive tension andstrong and weak binding cross-bridges in insect indirect flight muscle. Afunctional dissection by gelsolin-mediated thin filament removal. J. Gen.Physiol. 101:235–270.
Guth, K., H. J. Kuhn, T. Tsuchiya, and J. C. Ruegg. 1981. Length-dependent state of activation—length-change-dependent kinetics of crossbridges in skinned insect flight muscle. Biophys. Struct. Mech. 7:139–169.
Heinrich, B. 1993. The Hot Blood Insects: Strategies and Mechanisms ofInsect Thermoregulation. Harvard University Press, Cambridge, UK.
Heinrich, B. 1996. The Thermal Warriors: Strategies of Insect Survival.Harvard University Press, Cambridge, UK.
Huxley, A. F., and V. Lombardi. 1980. A sensitive force transducer withresonant frequency 50 kHz. J. Physiol. 305:15–16.
Huxley, A. F., V. Lombardi, and D. Peachey. 1981. A system for fastrecording of longitudinal displacement of a striated muscle fibre.J. Physiol. 317:12–13.
Huxley, A. F., and R. M. Simmons. 1971. Proposed mechanism of forcegeneration in striated muscle. Nature. 233:533–538.
Ikeda, K., and E. G. Boettiger. 1965. Studies on the flight mechanism ofinsects. 3. The innervation and electrical activity of the basilar fibrillarflight muscle of the beetle, Oryctes rhinoceros. J. Insect Physiol. 11:791–802.
Irving, T., S. Bhattacharya, I. Tesic, J. Moore, G. Farman, A. Simcox, J.Vigoreaux, and D. Maughan. 2001. Changes in myofibrillar structure andfunction produced by N-terminal deletion of the regulatory light chain inDrosophila. J. Muscle Res. Cell Motil. 22:675–683.
Jewell, B. R., and J. C. Ruegg. 1966. Oscillatory contraction of insectfibrillar muscle after glycerol extraction. Proc. R. Soc. B. 164:429–459.
Josephson, R. K., J. G. Malamud, and D. R. Stokes. 2000a. Power outputby an asynchronous flight muscle from a beetle. J. Exp. Biol. 203:2667–2689.
Josephson, R. K., J. G. Malamud, and D. R. Stokes. 2000b. Asynchronousmuscle: a primer. J. Exp. Biol. 203:2713–2722.
Josephson, R. K., J. G. Malamud, and D. R. Stokes. 2001. The efficiency ofan asynchronous flight muscle from a beetle. J. Exp. Biol. 204:4125–4139.
Linari, M., A. Aiazzi, M. Dolfi, G. Piazzesi, and V. Lombardi. 1993. Asystem for studying tension transients in segments of skinned musclefibres from rabbit psoas. J. Physiol. 473:8P.
Linari, M., R. Bottinelli, M. A. Pellegrino, M. Reconditi, C. Reggiani, andV. Lombardi. 2004. The mechanism of the force response to stretch inhuman skinned muscle fibres with different myosin isoforms. J. Physiol.554:335–352.
Lombardi, V., and G. Piazzesi. 1990. The contractile response duringsteady lengthening of stimulated frog muscle fibres. J. Physiol. 431:141–171.
Lund, J., M. R. Webb, and D. C. S. White. 1987. Changes in the ATPaseactivity of insect fibrillar flight muscle during calcium and strainactivation probed by phosphate-water oxygen exchange. J. Biol. Chem.262:8584–8590.
Lund, J., M. R. Webb, and D. C. S. White. 1988. Changes in the ATPaseactivity of insect fibrillar flight muscle during sinusoidal lengthoscillation probed by phosphate-water oxygen exchange. J. Biol. Chem.263:5505–5511.
Machin, K. E., and J. W. Pringle. 1959. The physiology of insect fibrillarmuscle. II. Mechanical properties of a beetle flight muscle. Proc. R. Soc.B. 151:204–225.
Maytum, R., S. S. Lehrer, and M. A. Geeves. 1999. Cooperativity andswitching within the three-state model of muscle regulation.Biochemistry. 38:1102–1110.
Piazzesi, G., M. Linari, M. Reconditi, F. Vanzi, and V. Lombardi. 1997.Cross-bridge detachment and attachment following a step-stretchimposed on active single frog muscle fibres. J. Physiol. 498:3–15.
Pringle, J. W. 1978. Stretch-activation of muscle: function and mechanism.Proc. R. Soc. B. 201:107–130.
Qiu, F., A. Lakey, B. Agianian, A. Hutchings, G. W. Butcher, S. Labeit, K.Leonard, and B. Bullard. 2003. Troponin C in different insect muscletypes: identification of two isoforms in Lethocerus, Drosophila andAnopheles that are specific to asynchronous flight muscle in the adultinsect. Biochem. J. 371:811–821.
Reedy, M. C., M. K. Reedy, and R. T. Tregear. 1988. Two attached non-rigor crossbridge forms in insect flight muscle. J. Mol. Biol. 204:357–383.
Reedy, M. C., M. K. Reedy, K. R. Leonard, and B. Bullard. 1994. Gold/Fabimmuno-electron microscopy localization of troponin H and troponinT in Lethocerus flight muscle. J. Mol. Biol. 239:52–67.
Steiger, G. J. 1977. Stretch-activation and tension transients in cardiac,skeletal and insect flight muscle. In Insect Flight Muscle. R. T. Tregear,editor. Elsevier, Amsterdam, The Netherlands. 221–268.
Taylor, K. A., H. Schmitz, M. C. Reedy, Y. E. Goldman, C. Franzini-Armstrong, H. Sasaki, R. T. Tregear, K. Poole, C. Lucaveche, R. J.Edwards, L. F. Chen, H. Winkler, and M. K. Reedy. 1999. Tomographic3D reconstruction of quick-frozen, Ca21-activated contracting insectflight muscle. Cell. 99:421–431.
Thorson, J., and D. C. White. 1983. Role of cross-bridge distortion in thesmall-signal mechanical dynamics of insect and rabbit striated muscle.J. Physiol. 343:59–84.
1110 Linari et al.
Biophysical Journal 87(2) 1101–1111
Tregear, R. T., R. J. Edwards, T. C. Irving, K. J. Poole, M. C. Reedy, H.Schmitz, E. Towns-Andrews, and M. K. Reedy. 1998. X-ray diffractionindicates that active cross-bridges bind to actin target zones in insectflight muscle. Biophys. J. 74:1439–1451.
Tregear, R. T., M. C. Reedy, Y. E. Goldman, K. A. Taylor, H. Winkler, C.Franzini-Armstrong, H. Sasaki, C. Lucaveche, and M. K. Reedy. 2004.Cross-bridge number, position and angle in target zones of cryofixedisometrically active insect flight muscle. Biophys. J. 86:3009–3019.
Vemuri, R., E. B. Lankford, K. Poetter, S. Hassanzadeh, K. Takeda, Z. X.Yu, V. J. Ferrans, and N. D. Epstein. 1999. The stretch-activation
response may be critical to the proper functioning of the mammalianheart. Proc. Natl. Acad. Sci. USA. 96:1048–1053.
White, D. C. 1983. The elasticity of relaxed insect fibrillar flight muscle.J. Physiol. 343:31–57.
White, D. C. S., and M. M. K. Donaldson. 1975. Mechanical andbiochemical cycles in muscle contraction. CIBA Found. Symp. 341–353.
Wray, J. S. 1979. Filament geometry and the activation of insect flightmuscles. Nature. 280:325–326.
Stretch- Versus Ca-Activation in IFM 1111
Biophysical Journal 87(2) 1101–1111