calculating the lightness of areas in a single plane · calculating the lightness of areas in a...
TRANSCRIPT

Calculating The Lightness Of Areas In A Single Plane
John McCann
McCann ImagingBelmont, MA/[email protected]
sults, then these experiments cannot be used as evidence forthe existence of “High Vision” mechanisms.
Key words: lightness, brightness, Early Vision, High Vision,models of vision, sensation, perception.
Introduction
Lightness, the appearance of objects between white and black,is more complicated for humans than for technologies. Allcameras, whether film, vidicon and charge coupled device,record images by counting photons. Humans generate im-ages in which the lightness is independent of the quanta count.1
A wide variety of different mechanisms have been proposedto account for what we see. Land and McCann2 proposed aspatial comparison extending Wallach’s3 observation about theimportance of edge ratios. Stockham4 suggested low-spatialfrequency filtering. Gilchrist5, Adelson6 and Logvinenko7 allsuggested mechanisms in which apparent depth altered theappearance of lightness.
The problem raised by Land and McCann was whetherspatial comparisons could be used to separate reflectance fromillumination given that the only input data was the radiance,(reflectance x illumination), at each pixel in the image. Theinitial work suggested that reflectances changed abruptly andthat illuminations changed gradually, so that reflectance andillumination could be teased apart by the different rates ofchange on the retina.
This mechanism was shown to be incorrect for humanvision for two reasons. First, measurements of real life im-ages showed that there are as many gradual changes in reflec-tance and abrupt changes in illumination as the converse. Sec-ond, extensive quantitative experiments8 showed that there isno single threshold rate of change in radiance on the retina atvisual threshold. In other words, we could not find psycho-physical support for the ‘rate of change on the retina” thresh-old” mechanism. This created a vacuum in the goal of ourmodel’s calculations. If humans see identical lightnesses from
Abstract
This paper studies three different “Diamond Wall” experi-ments. This paper demonstrates that “Early Vision” explana-tions are possible, without reliance on apparent illumination,transparency, apparent depth and junctions.
In Part 1, grays ordinarily look darker on light back-grounds. Adelson showed that two rows of diamonds lookedthe same on different backgrounds when the diamond tipscrossed into the other background. He added different graytips, consistent with illumination changes, thus releasing therest of the diamonds to no-longer looking the same. Grays onlight backgrounds reverted to looking darker.
New experiments show that the introduction of any edgealong the light-dark background boundary releases the dia-monds to look different in different surrounds. WhereasAdelson introduced diamond tips consistent with illumination,we used lines, dots, Cornsweet edges and non-consistent tipsto release the diamonds to look different.
Other results showed that apparent illumination and ap-parent depth were not necessary because small abstract dis-plays (one-quarter diamond) affected lightnesses the same asthe complex displays.
In Part 2, Logvinenko Effect shows that straight edges,consistent with perceived illumination, produce contrastlightnesses different than corrugated edges, inconsistent withperceived illumination. New experiments showed that this ef-fect, along with White’s Effect, are caused by low-spatial fre-quency sampling.
In Part 3, we apply complex “Early Vision” models toimages associated with “High Vision” hypotheses. The argu-ment is that flat displays, which are perceived as flat, requirea quite complex visual mechanism just to account for the prop-erties of flat lightnesses. Any experimental verification of theexistence of “High Vision” lightness mechanisms should betested first with realistic flat “Early Vision” models.
The results show that three different “Early Vision” ap-proaches account for three different “Diamond Wall” experi-ments. If “Early Vision” mechanisms can account for the re-

both reflectance displays and transparency displays having iden-tical radiances, then we cannot really isolate actual reflectanceand from actual illumination. Here the distinction betweensensation and perception11 becomes important. In this paperlightness sensations are the appearances of objects betweenlight and dark. Brightnesses are the sensations of how intensethe illumination appears. Perceived lightnesses are sensationsof lightness, that have been modified by past experience. Wecan easily identify that a piece of paper has a uniform reflec-tance (perceived lightness), even though we see that there is ashadow falling across the image. We see that the paper in thesun has higher sensations of brightness and higher sensationsof lightness. In the past we have used the analogy to painters.The job of sensation lightness is to form a image analogous tothe paint selected by a fine-arts painter making a shadow. Headds black paint to the shadow to recreate the sensation. Thejob of the house painter is recognize the color of the paint onthe house, ignoring the illumination. People can perform allthree tasks, but scientists are frustrated by the lack of com-monly used definitions of terms.
The B&W Mondrian had a white area and a black areasending the same radiances to the eye. Experiments with mod-
Figure 1. A diagram of alternative theories of lightness mechanisms.“Early Vision” suggests that lightness sensations come before depthperceptions. “High Vision” suggests depth comes before lightness.“Mid Vision” suggests that lightness, shape and shadow are all cal-culated in parallel.
Figure 2. These four displays support “High Vision”. A is a control using identical gray diamonds. B adds a dark tips to the top diamonds andlight tips to the bottom diamonds. This control shows that the tips do not change the appearance of the grays. C places a dark surroundaround the bottom row, while leaving a light surround around the top row. Surprisingly, the change of the grays is small. D is the combinationof the tips from B and the surround from C. Here the rows of gray diamonds surrounded by white look darker than those surrounded by black.The “High Vision“ hypothesis is that the human visual system interprets the grays on white as grays in bright light and the grays on black asshadow. The dark tips on the upper diamonds and the light tips on the bottom ones provide consistent evidence of the bright light/shadehypothesis. In “High Vision“ theory, humans perceive the lightness of the lower diamonds to be lighter because they appear to be in a shadow.
els showed that the reset, “normalization” process was themechanism predicting appearance in B&W Mondrians and thedifferent appearance of grays on white and black backgrounds(Simultaneous Contrast). These displays have been success-fully modeled by many different generations of Retinex mod-els, starting with McCann, McKee and Taylor9. Later experi-ments with real life images, 20 years ago, used a scene with aboy holding a white card in the shade that had the same radi-ance as the black paper in the sun. Again, a Retinex modelcreated a new low-dynamic-range image displaying details ofboth sun and shadow areas. Recent experiments have usedRetinex processing to generate improved color images in re-productions made on small gamut media. More details onRetinex are available in a recent review paper.10
Experiments by Alexander Logvinenko7 illustrate experi-ments being studied with a revitalized interest in Gestalt visualphenomena. The experiments use “Diamond Wall” displaysintroduced by Adelson. The input digits are the same for ap-parently light and the dark diamonds. Adelson’s andLogvinenko’s analysis centers on the apparent depth and ap-parent illumination and apparent transparency observed fromthese flat displays. In their analysis observers see planes in theimage, differing in depth, that appear to be in bright illumina-tion (light areas) and other planes that appear in shadow (darkareas). It is the perception of different depth planes, or shadowplanes, that causes the change in lightness. The problem hereis that the displays use light and dark surrounds as well. Wehave to tease apart the effects due to depth from those due toSimultaneous Contrast [Part 1]. Further, we need to identifyvisual effects that are controlled by low-frequency samplingeffects [Part 2]. Finally, we need to give “Early Vision” a fairchance, as to whether it can account for complex targets. SinceLeonardo, we have known that lightness is more complicatedthan the input value at a pixel. We should use a complex “EarlyVision” lightness model that can account for a variety of flat,planar displays which appear flat, to see if they can account forlightness without invoking a depth hypothesis. Displays thatlack both apparent depth and apparent shadows would still re-quire a complex lightness mechanism to explain SimultaneousContrast, the black and white Mondrian, the color Mondrian,
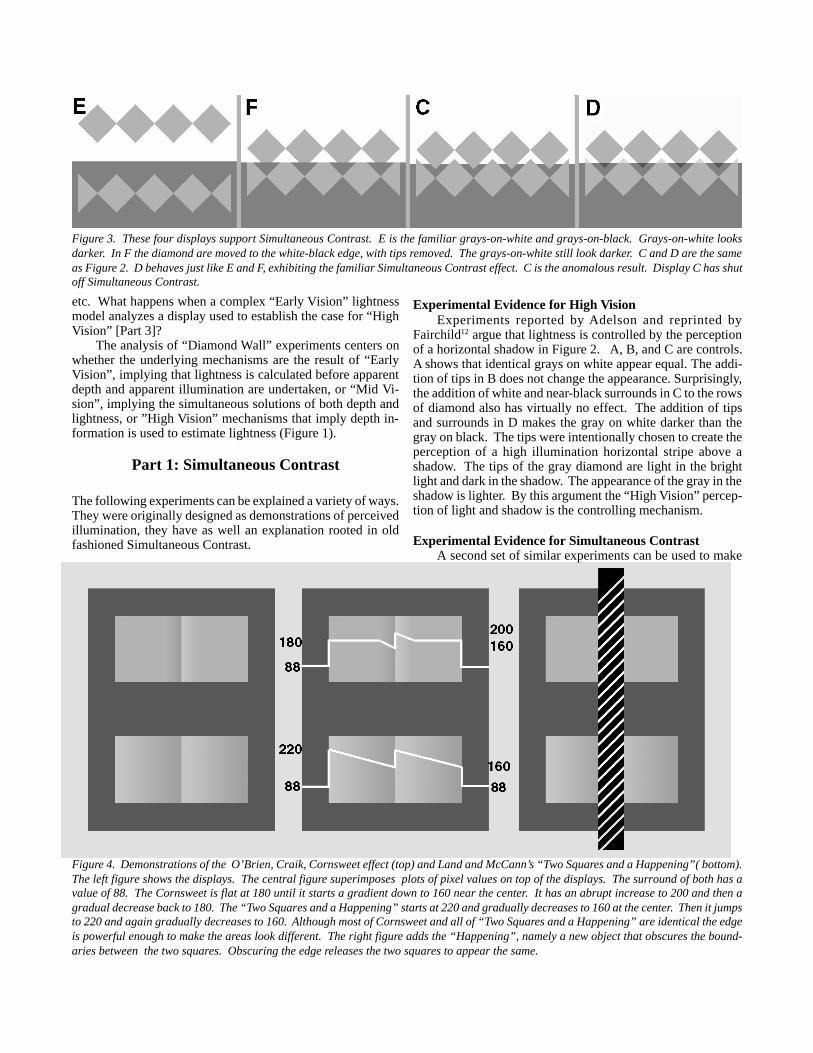
Figure 3. These four displays support Simultaneous Contrast. E is the familiar grays-on-white and grays-on-black. Grays-on-white looksdarker. In F the diamond are moved to the white-black edge, with tips removed. The grays-on-white still look darker. C and D are the sameas Figure 2. D behaves just like E and F, exhibiting the familiar Simultaneous Contrast effect. C is the anomalous result. Display C has shutoff Simultaneous Contrast.
Figure 4. Demonstrations of the O’Brien, Craik, Cornsweet effect (top) and Land and McCann’s “Two Squares and a Happening”( bottom).The left figure shows the displays. The central figure superimposes plots of pixel values on top of the displays. The surround of both has avalue of 88. The Cornsweet is flat at 180 until it starts a gradient down to 160 near the center. It has an abrupt increase to 200 and then agradual decrease back to 180. The “Two Squares and a Happening” starts at 220 and gradually decreases to 160 at the center. Then it jumpsto 220 and again gradually decreases to 160. Although most of Cornsweet and all of “Two Squares and a Happening” are identical the edgeis powerful enough to make the areas look different. The right figure adds the “Happening”, namely a new object that obscures the bound-aries between the two squares. Obscuring the edge releases the two squares to appear the same.
etc. What happens when a complex “Early Vision” lightnessmodel analyzes a display used to establish the case for “HighVision” [Part 3]?
The analysis of “Diamond Wall” experiments centers onwhether the underlying mechanisms are the result of “EarlyVision”, implying that lightness is calculated before apparentdepth and apparent illumination are undertaken, or “Mid Vi-sion”, implying the simultaneous solutions of both depth andlightness, or ”High Vision” mechanisms that imply depth in-formation is used to estimate lightness (Figure 1).
Part 1: Simultaneous Contrast
The following experiments can be explained a variety of ways.They were originally designed as demonstrations of perceivedillumination, they have as well an explanation rooted in oldfashioned Simultaneous Contrast.
Experimental Evidence for High VisionExperiments reported by Adelson and reprinted by
Fairchild12 argue that lightness is controlled by the perceptionof a horizontal shadow in Figure 2. A, B, and C are controls.A shows that identical grays on white appear equal. The addi-tion of tips in B does not change the appearance. Surprisingly,the addition of white and near-black surrounds in C to the rowsof diamond also has virtually no effect. The addition of tipsand surrounds in D makes the gray on white darker than thegray on black. The tips were intentionally chosen to create theperception of a high illumination horizontal stripe above ashadow. The tips of the gray diamond are light in the brightlight and dark in the shadow. The appearance of the gray in theshadow is lighter. By this argument the “High Vision” percep-tion of light and shadow is the controlling mechanism.
Experimental Evidence for Simultaneous ContrastA second set of similar experiments can be used to make
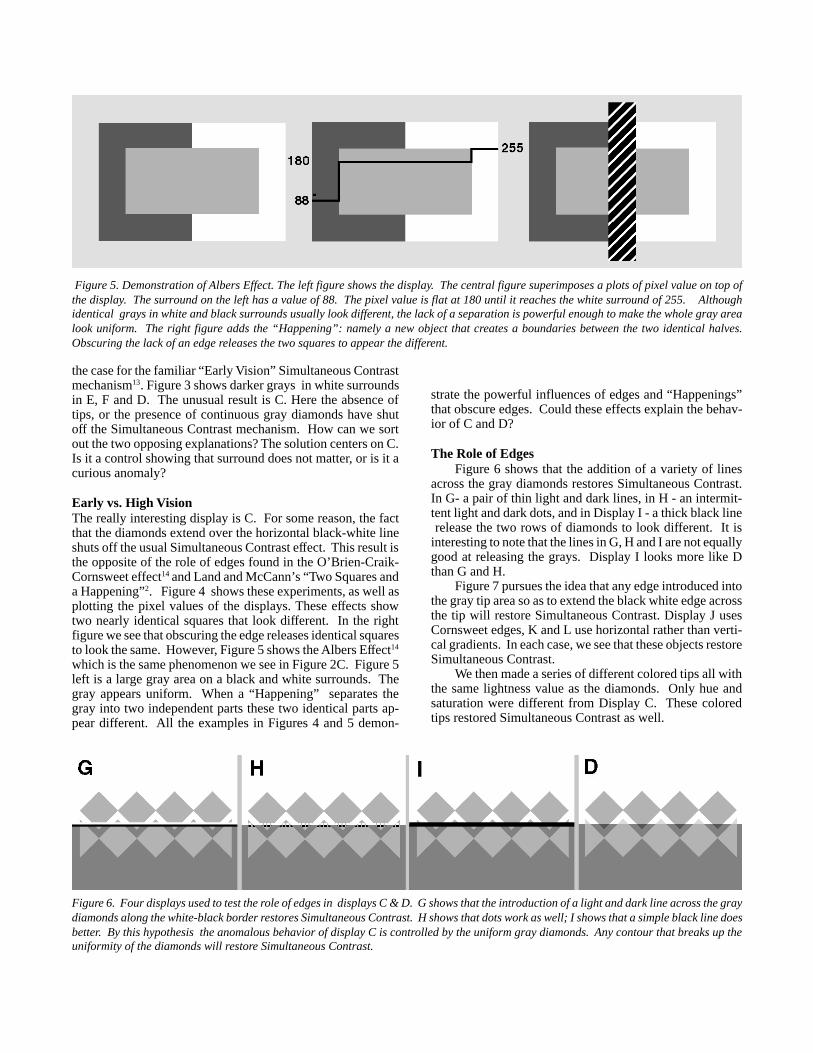
Figure 6. Four displays used to test the role of edges in displays C & D. G shows that the introduction of a light and dark line across the graydiamonds along the white-black border restores Simultaneous Contrast. H shows that dots work as well; I shows that a simple black line doesbetter. By this hypothesis the anomalous behavior of display C is controlled by the uniform gray diamonds. Any contour that breaks up theuniformity of the diamonds will restore Simultaneous Contrast.
the case for the familiar “Early Vision” Simultaneous Contrastmechanism13. Figure 3 shows darker grays in white surroundsin E, F and D. The unusual result is C. Here the absence oftips, or the presence of continuous gray diamonds have shutoff the Simultaneous Contrast mechanism. How can we sortout the two opposing explanations? The solution centers on C.Is it a control showing that surround does not matter, or is it acurious anomaly?
Early vs. High VisionThe really interesting display is C. For some reason, the factthat the diamonds extend over the horizontal black-white lineshuts off the usual Simultaneous Contrast effect. This result isthe opposite of the role of edges found in the O’Brien-Craik-Cornsweet effect14 and Land and McCann’s “Two Squares anda Happening”2. Figure 4 shows these experiments, as well asplotting the pixel values of the displays. These effects showtwo nearly identical squares that look different. In the rightfigure we see that obscuring the edge releases identical squaresto look the same. However, Figure 5 shows the Albers Effect14
which is the same phenomenon we see in Figure 2C. Figure 5left is a large gray area on a black and white surrounds. Thegray appears uniform. When a “Happening” separates thegray into two independent parts these two identical parts ap-pear different. All the examples in Figures 4 and 5 demon-
strate the powerful influences of edges and “Happenings”that obscure edges. Could these effects explain the behav-ior of C and D?
The Role of EdgesFigure 6 shows that the addition of a variety of lines
across the gray diamonds restores Simultaneous Contrast.In G- a pair of thin light and dark lines, in H - an intermit-tent light and dark dots, and in Display I - a thick black line release the two rows of diamonds to look different. It isinteresting to note that the lines in G, H and I are not equallygood at releasing the grays. Display I looks more like Dthan G and H.
Figure 7 pursues the idea that any edge introduced intothe gray tip area so as to extend the black white edge acrossthe tip will restore Simultaneous Contrast. Display J usesCornsweet edges, K and L use horizontal rather than verti-cal gradients. In each case, we see that these objects restoreSimultaneous Contrast.
We then made a series of different colored tips all withthe same lightness value as the diamonds. Only hue andsaturation were different from Display C. These coloredtips restored Simultaneous Contrast as well.
Figure 5. Demonstration of Albers Effect. The left figure shows the display. The central figure superimposes a plots of pixel value on top ofthe display. The surround on the left has a value of 88. The pixel value is flat at 180 until it reaches the white surround of 255. Althoughidentical grays in white and black surrounds usually look different, the lack of a separation is powerful enough to make the whole gray arealook uniform. The right figure adds the “Happening”: namely a new object that creates a boundaries between the two identical halves.Obscuring the lack of an edge releases the two squares to appear the different.

Figure 7. Four additional displays testing gradient edges. Below each display, is a 4x magnification of 2 tips. This will allow you to see theconstruction of the gradients which are hard to see in the displays. Display J uses a Cornsweet edge in the gray tips. It is a gradient that equalsthe gray diamond at the top, as it moved down it gets darker, until the level of the white-black edge, it jumps lighter and then gets darker untilit is again equal to the gray diamond. Display K uses horizontal gradients. In the center of each diamond tip there is a vertical edge. Thelight side of the edge is equal to the light tip in D. The dark edge is equal to the dark tip in D. These lines are connected by gradients ofvalues. The center of the gradient has the same value as the gray diamonds.. Display L has a gradient oscillating from the value of the lighttip in D to the value of the dark tip in D. All of these insertions near the white -black edge release the diamonds to look different, thus re-enabling Simultaneous Contrast.
Figure 8. These displays repeat C and D while introducing simplified versions C’ and D’. The same lightnesses are seen in displays C and asimplified one-quarter diamond pattern C’. The same is true for D and D’ with tips. There is no difference in lightness between the complexdisplays with implied illumination and the simple ones without any implied illumination.
Simplified DisplaysFigure 8 shows a portion of Display C, along with a sim-
plified, one-quarter diamond segment. The black lines iden-tify the part of C that was magnified to make C’. On the rightside of Figure 8 is the same comparison of D and D’. C’and D’show the same contrast behavior as C and D. The effects wesee in C and D do not require long edges intersecting manyareas. They do not require either apparent depth or apparentshadow. The contrast behavior is the same in C’/ D’ as in C/D,because the mechanism controlling their lightness is local.13
Inconsistent TipsFigure 9 shows three “Quarter Diamond” displays. On
the left is C’, in which the central grays look most like eachother. In the middle is D’ which adds tips consistent with ashadow interpretation. If we visualize that the entire lower
triangle is made of the same paper, and the top triangle is adifferent darker paper, and if we visualize the horizontal levelof the white-black edge in the surround as the edge of a cubewith two visible faces, and we visualize that the top face of thecube is in bright light and the bottom is in a shadow, we can seethat the change in appearance of the chips is consistent with ashadow making the bottom triangle tip lighter in the bright lightand the top triangle tip darker in the shade. In Display M’ wereverse the tips. Now, the lighter tip is on the bottom and thedarker is on top. It is still possible to visualize the white-blackedge as the edge of a cube, but the tips are clearly differentpatches than the rest of the triangles. M’ shows that reversedtips act to restore Simultaneous Contrast.13 Illumination-con-sistent tips are not required for the gray area surrounded bywhite to look darker than the gray area surrounded by black.
In Summary, there are three arguments for Simultaneous

Contrast or “Early Vision” as the controlling mechanism forlightness in this particular “Diamond Wall” experiment. First,any edge, continuous in G or intermittent in H, and a solidblack line in I, restores Simultaneous Contrast (Figures 6 &7).Second, the rows of diamonds are made up of a simple repeat-ing pattern. The lightnesses of these simple patterns are thesame as those seen in the complex patterns. The simple pat-terns have removed, or at least reduced, the perceived illumi-nation edge (Figure 8). Third, the tips used in D to make ashadow-consistent image restores Simultaneous Contrast. Thesame is true if we reverse the tips and make a shadow-incon-
Figure 10. Adelson effect illustrating the difference in lightness with straight light-dark edges and angular borders. Logvinenko’s argumentis that the straight edges are associated with a perceived illumination edges, and are different from grays that are not associated withperceived illumination. This pair of displays have the same gray diamonds and the same surrounding areas. The black ellipses identify theareas around gray diamonds that are identical in both displays. Copies of the identical segments are placed in the margin, at the same relativespacings, for comparison . The gray diamonds have the same horizontal separations, but have different vertical separations.
sistent image (Figure 9). Simultaneous Contrast is all we needto understand the lightness effects in this diamond experiment.That is not to say that these displays all have the same apparentdepth. They do not. It is just to say that we do not need thedepth effects to explain the lightness differences. These ex-periments are arguments for “Early-Vision” lightness mecha-nisms because Simultaneous Contrast can account for light-ness appearance without the need for higher-level mental pro-cesses.
Figure 9. Display M’ shows the reversal of the tips, so that they are inconsistent with the illumination hypothesis. The difference in lightnessis slightly smaller than that found in D’, however it is larger that found in C’. These inconsistent tips act to restore Simultaneous Contrast.
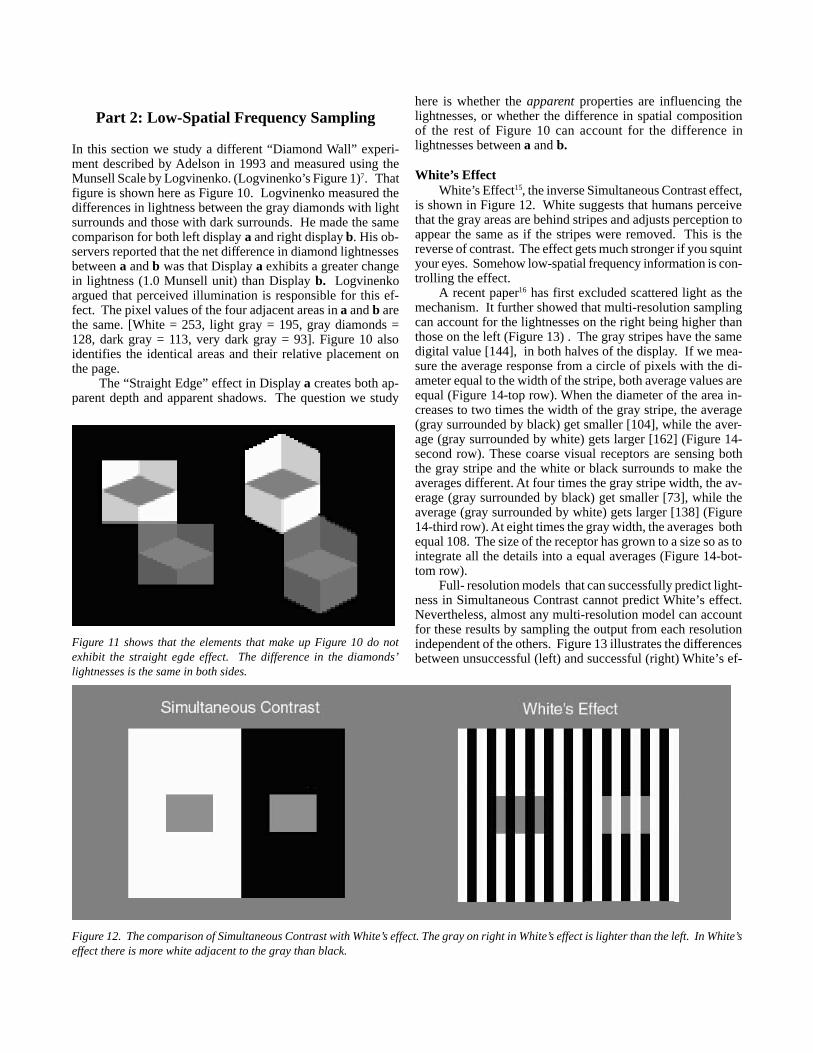
Figure 11 shows that the elements that make up Figure 10 do notexhibit the straight egde effect. The difference in the diamonds’lightnesses is the same in both sides.
Figure 12. The comparison of Simultaneous Contrast with White’s effect. The gray on right in White’s effect is lighter than the left. In White’seffect there is more white adjacent to the gray than black.
Part 2: Low-Spatial Frequency Sampling
In this section we study a different “Diamond Wall” experi-ment described by Adelson in 1993 and measured using theMunsell Scale by Logvinenko. (Logvinenko’s Figure 1)7. Thatfigure is shown here as Figure 10. Logvinenko measured thedifferences in lightness between the gray diamonds with lightsurrounds and those with dark surrounds. He made the samecomparison for both left display a and right display b. His ob-servers reported that the net difference in diamond lightnessesbetween a and b was that Display a exhibits a greater changein lightness (1.0 Munsell unit) than Display b. Logvinenkoargued that perceived illumination is responsible for this ef-fect. The pixel values of the four adjacent areas in a and b arethe same. [White = 253, light gray = 195, gray diamonds =128, dark gray = 113, very dark gray = 93]. Figure 10 alsoidentifies the identical areas and their relative placement onthe page.
The “Straight Edge” effect in Display a creates both ap-parent depth and apparent shadows. The question we study
here is whether the apparent properties are influencing thelightnesses, or whether the difference in spatial compositionof the rest of Figure 10 can account for the difference inlightnesses between a and b.
White’s EffectWhite’s Effect15, the inverse Simultaneous Contrast effect,
is shown in Figure 12. White suggests that humans perceivethat the gray areas are behind stripes and adjusts perception toappear the same as if the stripes were removed. This is thereverse of contrast. The effect gets much stronger if you squintyour eyes. Somehow low-spatial frequency information is con-trolling the effect.
A recent paper16 has first excluded scattered light as themechanism. It further showed that multi-resolution samplingcan account for the lightnesses on the right being higher thanthose on the left (Figure 13) . The gray stripes have the samedigital value [144], in both halves of the display. If we mea-sure the average response from a circle of pixels with the di-ameter equal to the width of the stripe, both average values areequal (Figure 14-top row). When the diameter of the area in-creases to two times the width of the gray stripe, the average(gray surrounded by black) get smaller [104], while the aver-age (gray surrounded by white) gets larger [162] (Figure 14-second row). These coarse visual receptors are sensing boththe gray stripe and the white or black surrounds to make theaverages different. At four times the gray stripe width, the av-erage (gray surrounded by black) get smaller [73], while theaverage (gray surrounded by white) gets larger [138] (Figure14-third row). At eight times the gray width, the averages bothequal 108. The size of the receptor has grown to a size so as tointegrate all the details into a equal averages (Figure 14-bot-tom row).
Full- resolution models that can successfully predict light-ness in Simultaneous Contrast cannot predict White’s effect.Nevertheless, almost any multi-resolution model can accountfor these results by sampling the output from each resolutionindependent of the others. Figure 13 illustrates the differencesbetween unsuccessful (left) and successful (right) White’s ef-

Figure 15 The results of a calculation done with the process shown inFigure 14.
Figure 16. The average radiance in Figure 10b at the 32 x32 averagelevel. The corresponding average for Fig 10a is uniform. The blackoutlines show the locations of the gray diamonds at full resolution.
Figure 13. The left side shows that multi-resolution computations do not explain Whites effect. The right side shows that models that directlyinclude calculations from low-resolution stages can explain Whites effect.
fect models. On the left the model averages the input image toform a series of smaller, lower resolution images. The pro-cessing begins with the smallest image. The results are inter-polated up to make an output image the size of the next largerinput image. The interpolated precessed image and the aver-aged input image are then processed and interpolated up to thenext size. This operation is iterated until all sizes are processedand a full-resolution processed image is produced. Using aRetinex model10 with a very wide range of parameters we failedto replicate Whites effect data.16
Figure 13-(right) illustrate how any process can explainWhites effect. Instead of generating a single output after allthe resolutions have been averaged, we can extract a partialoutput from each resolution. Figure 15 plots the model re-sponse to Whites effect using a combination of outputs fromall layers. The process is to make a series of averaged images,each half the size as the previous. The combination is per-formed in Photoshop. First, we used bicubic interpolation tocreate a family of low-resolution images all the same size.Second, we installed each resolution in a layered image with30% transparency for each layer, highest resolution on top. The
Figure 14. Sampling values of hypothetical large receptor pools. Singlereceptors and pools up to the width of the gray stripes give equalresponses (144). As the pool get larger the black stripes on the leftlower the pool response to as low as 73, while the white stripes raisethe pool on the right to a high as 198. As the pool gets larger, thepool response returns to equal values.
grays on the left are darker than those on the right, thus show-ing that the combination of image made by low-spatial fre-quency sampling is all that is needed to explain White’s ef-fect.
Straight Edge EffectLet us return to the edges in Figure 10. Can low-spatial
frequency sampling, used as an explanation White’s effect,explain the difference in lightness between gray diamonds(light surround vs. dark surround) in Figure 10a and 10b. Or,as Adelson and Logvinenko asserts, the lightnesses are differ-ent because the long light-dark straight edges (10a) can beinterpreted as an illumination edge, while the sawtooth light-dark edges (10b) cannot.
The vertical spacing between corresponding gray dia-monds is smaller in Fig 10a than in 10b. If we compare theaverages both figures we find they are similar for 2x2, 4x4,8x8, 16x16. However, they are markedly different for 32x32.Fig 16 shows the 32x32 averaged down and bicubically inter-polated back up. The corresponding image for Figure 10a isuniform.
We can make remove this low-spatial frequency artifactfrom Figure 10 by reconstructing it with the same verticaldistances in a and in b. It is possible that matching the dis-plays at the average 32 level might make the Logvinenko Ef-fect disappear?
Figure 17 is the reconstruction of Figure 10 with equalvertical distance between gray diamonds. The lightness dif-ferences between 17a with straight edges are still larger than17b. Although this made the two displays much more likeeach other in the very low-spatial frequencies, it did not re-move all the differences.
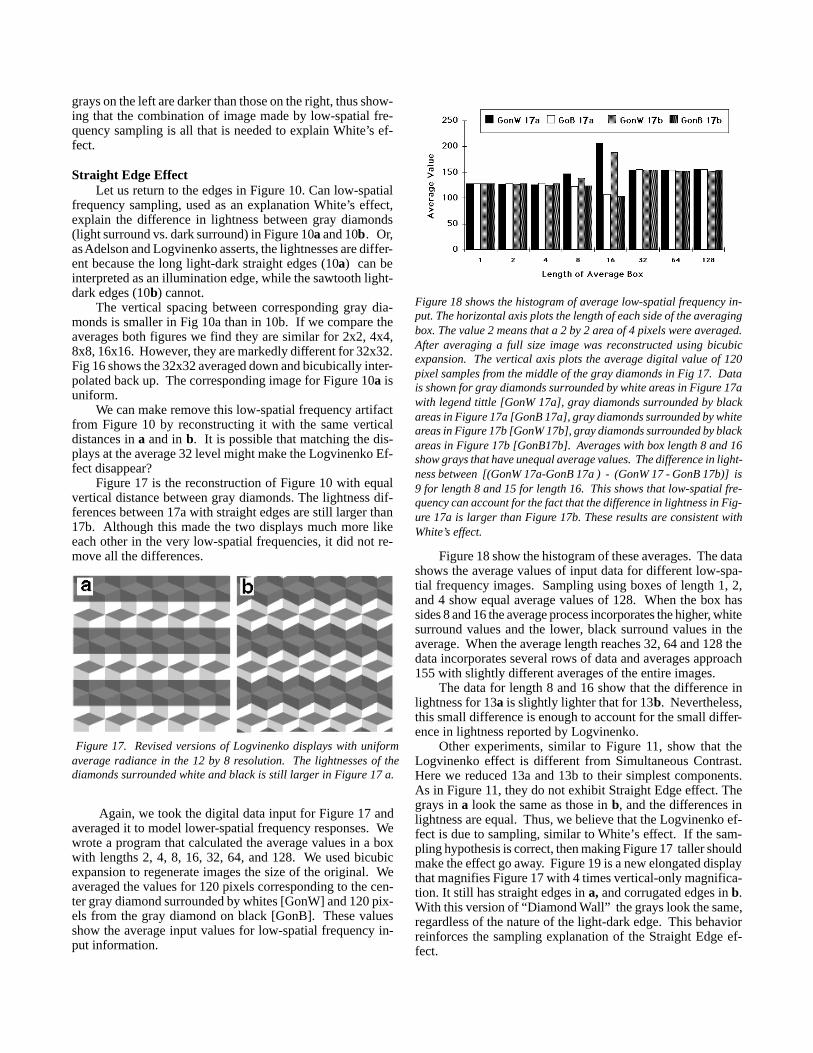
Figure 18 shows the histogram of average low-spatial frequency in-put. The horizontal axis plots the length of each side of the averagingbox. The value 2 means that a 2 by 2 area of 4 pixels were averaged.After averaging a full size image was reconstructed using bicubicexpansion. The vertical axis plots the average digital value of 120pixel samples from the middle of the gray diamonds in Fig 17. Datais shown for gray diamonds surrounded by white areas in Figure 17awith legend tittle [GonW 17a], gray diamonds surrounded by blackareas in Figure 17a [GonB 17a], gray diamonds surrounded by whiteareas in Figure 17b [GonW 17b], gray diamonds surrounded by blackareas in Figure 17b [GonB17b]. Averages with box length 8 and 16show grays that have unequal average values. The difference in light-ness between [(GonW 17a-GonB 17a ) - (GonW 17 - GonB 17b)] is9 for length 8 and 15 for length 16. This shows that low-spatial fre-quency can account for the fact that the difference in lightness in Fig-ure 17a is larger than Figure 17b. These results are consistent withWhite’s effect.
Figure 17. Revised versions of Logvinenko displays with uniformaverage radiance in the 12 by 8 resolution. The lightnesses of thediamonds surrounded white and black is still larger in Figure 17 a.
Figure 18 show the histogram of these averages. The datashows the average values of input data for different low-spa-tial frequency images. Sampling using boxes of length 1, 2,and 4 show equal average values of 128. When the box hassides 8 and 16 the average process incorporates the higher, whitesurround values and the lower, black surround values in theaverage. When the average length reaches 32, 64 and 128 thedata incorporates several rows of data and averages approach155 with slightly different averages of the entire images.
The data for length 8 and 16 show that the difference inlightness for 13a is slightly lighter that for 13b. Nevertheless,this small difference is enough to account for the small differ-ence in lightness reported by Logvinenko.
Other experiments, similar to Figure 11, show that theLogvinenko effect is different from Simultaneous Contrast.Here we reduced 13a and 13b to their simplest components.As in Figure 11, they do not exhibit Straight Edge effect. Thegrays in a look the same as those in b, and the differences inlightness are equal. Thus, we believe that the Logvinenko ef-fect is due to sampling, similar to White’s effect. If the sam-pling hypothesis is correct, then making Figure 17 taller shouldmake the effect go away. Figure 19 is a new elongated displaythat magnifies Figure 17 with 4 times vertical-only magnifica-tion. It still has straight edges in a, and corrugated edges in b.With this version of “Diamond Wall” the grays look the same,regardless of the nature of the light-dark edge. This behaviorreinforces the sampling explanation of the Straight Edge ef-fect.
Again, we took the digital data input for Figure 17 andaveraged it to model lower-spatial frequency responses. Wewrote a program that calculated the average values in a boxwith lengths 2, 4, 8, 16, 32, 64, and 128. We used bicubicexpansion to regenerate images the size of the original. Weaveraged the values for 120 pixels corresponding to the cen-ter gray diamond surrounded by whites [GonW] and 120 pix-els from the gray diamond on black [GonB]. These valuesshow the average input values for low-spatial frequency in-put information.
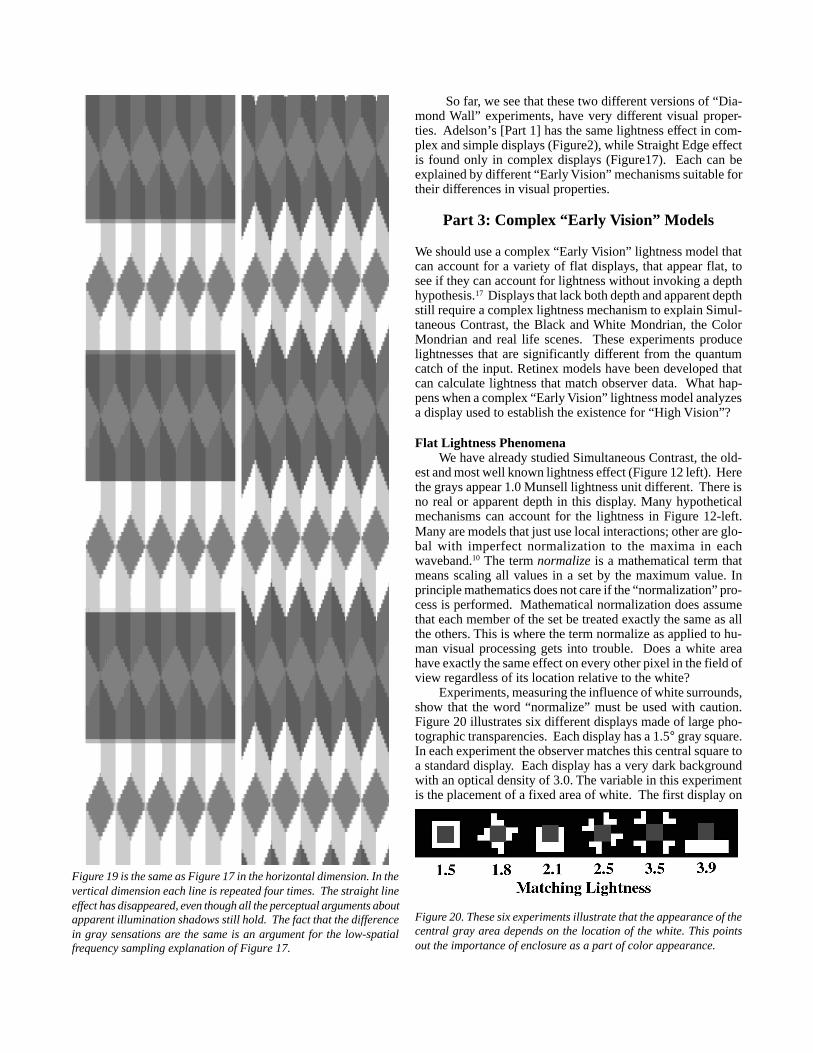
Figure 19 is the same as Figure 17 in the horizontal dimension. In thevertical dimension each line is repeated four times. The straight lineeffect has disappeared, even though all the perceptual arguments aboutapparent illumination shadows still hold. The fact that the differencein gray sensations are the same is an argument for the low-spatialfrequency sampling explanation of Figure 17.
Figure 20. These six experiments illustrate that the appearance of thecentral gray area depends on the location of the white. This pointsout the importance of enclosure as a part of color appearance.
So far, we see that these two different versions of “Dia-mond Wall” experiments, have very different visual proper-ties. Adelson’s [Part 1] has the same lightness effect in com-plex and simple displays (Figure2), while Straight Edge effectis found only in complex displays (Figure17). Each can beexplained by different “Early Vision” mechanisms suitable fortheir differences in visual properties.
Part 3: Complex “Early Vision” Models
We should use a complex “Early Vision” lightness model thatcan account for a variety of flat displays, that appear flat, tosee if they can account for lightness without invoking a depthhypothesis.17 Displays that lack both depth and apparent depthstill require a complex lightness mechanism to explain Simul-taneous Contrast, the Black and White Mondrian, the ColorMondrian and real life scenes. These experiments producelightnesses that are significantly different from the quantumcatch of the input. Retinex models have been developed thatcan calculate lightness that match observer data. What hap-pens when a complex “Early Vision” lightness model analyzesa display used to establish the existence for “High Vision”?
Flat Lightness PhenomenaWe have already studied Simultaneous Contrast, the old-
est and most well known lightness effect (Figure 12 left). Herethe grays appear 1.0 Munsell lightness unit different. There isno real or apparent depth in this display. Many hypotheticalmechanisms can account for the lightness in Figure 12-left.Many are models that just use local interactions; other are glo-bal with imperfect normalization to the maxima in eachwaveband.10 The term normalize is a mathematical term thatmeans scaling all values in a set by the maximum value. Inprinciple mathematics does not care if the “normalization” pro-cess is performed. Mathematical normalization does assumethat each member of the set be treated exactly the same as allthe others. This is where the term normalize as applied to hu-man visual processing gets into trouble. Does a white areahave exactly the same effect on every other pixel in the field ofview regardless of its location relative to the white?
Experiments, measuring the influence of white surrounds,show that the word “normalize” must be used with caution.Figure 20 illustrates six different displays made of large pho-tographic transparencies. Each display has a 1.5° gray square.In each experiment the observer matches this central square toa standard display. Each display has a very dark backgroundwith an optical density of 3.0. The variable in this experimentis the placement of a fixed area of white. The first display on

the left surrounded the gray with an equal width of white. Ob-servers matched the gray to Munsell value 1.5. The next ex-periment cut the white into four pieces and placed them oneach side of the gray. The effect of this was to remove thewhite from the corners. Measurements showed a small increasein matching lightness to 1.8. The third experiment removedthe white from one side. The match moved up to 2.1. The nexttwo experiments moved the whites out to the corners.Lightnesses moved to 2.5 and 3.5. Finally, placing all the whiteon one side, lightness reached 3.5.
These experiments along with others that measure the ef-fects of angular separation from whites18 make the same point.Spatial positions of test patches relative to whites have largeeffects on lightness. Matches varied from 1.5 to 3.5 Munsell
Figure 21 shows the Black and White Mondrian. The tips of arrowsshow light areas at the top and dark areas at the bottom with equalradiance at the eye.
Figure 22 (left). The scanned photograph of the sun/shade image. The white in the shade has the same input digital value (119) as the blackin the sun. Figure 22 (right). The Retinex Output photograph of the sun/shade image. The white in the shade has a processed value of 175compared the black in the sun with 126.
units. That is 28% of the lightness difference between whiteand black. This variability was controlled by the enclosureand separation of the area white area. A successful lightnessmodel must mimic these human visual properties for flat dis-plays, that look flat. In the theoretical evaluation of complexdisplays we should turn first to models that can account for alarge variety of flat lightnesses. Such models can provide an“Early Vision” alternative explanation to “High Vision” phe-nomenon.
Ratio-Product-Reset-Average models have been used cal-culate the observed lightness in Simultaneous Contrast (Fig-ure 1- left) since 1970.19 Black and White Mondrian had awhite patch and black patch sending the same radiances to theeye. (Figure 21). It was modeled in the original Land andMcCann 2 article. Color Mondrians were modeled by the sametechnique.9 A variety of outdoor images including “John atYosemite”, a real-life equivalent to the B&W Mondrian. It con-sisted a black card in the sun having the same radiance as awhite card in the shade.1 Figure 22 is a recent photograph oftwo Jobo reflectance targets: one in sun and one in shade. Thephoto was taken in Belmont, MA on a cool fall day without asingle cloud in the sky. The shadow was 32 times darker thanthe sun. The black reflectance in sun and the white reflectancein the shade both have 119 as the scanned input digit. Theprocessed image has the sun image essentially the same. Theblack reflectance in the sun has only moved from digit 119 to126. However, the white reflectance in the shade has movedfrom 119 up to 175. This display is a flat recreation of “John atYosemite” without depth and apparent depth.
All of the above experiments used the same Ratio-Prod-uct-Reset-Average model. It takes the information from theentire field of view and calculates an imperfect global normal-ization of the image. It is sensitive to the separation and enclo-sure of this maximum. It works only with quanta catch at theretina as the only input. It can account for the observed light-ness in all the above flat images without depth or apparent depthinformation. Can it account for ‘Diamond Wall” apparent depthexperiments?
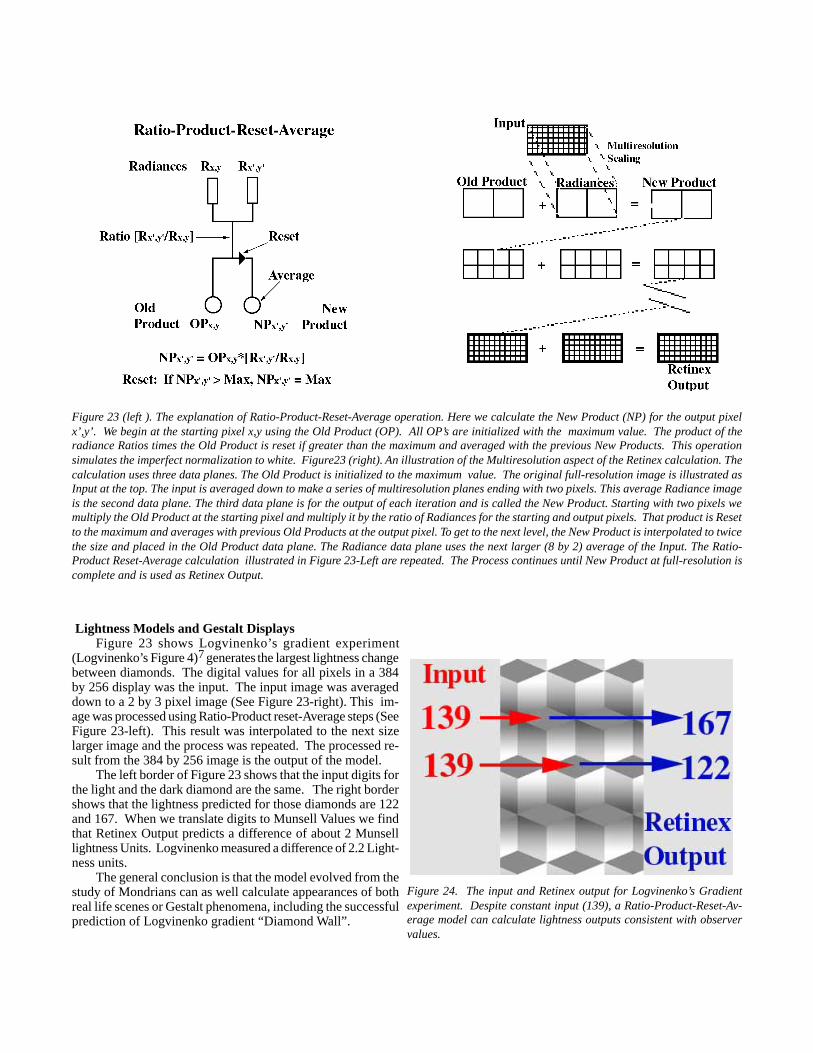
Lightness Models and Gestalt DisplaysFigure 23 shows Logvinenko’s gradient experiment
(Logvinenko’s Figure 4)7 generates the largest lightness changebetween diamonds. The digital values for all pixels in a 384by 256 display was the input. The input image was averageddown to a 2 by 3 pixel image (See Figure 23-right). This im-age was processed using Ratio-Product reset-Average steps (SeeFigure 23-left). This result was interpolated to the next sizelarger image and the process was repeated. The processed re-sult from the 384 by 256 image is the output of the model.
The left border of Figure 23 shows that the input digits forthe light and the dark diamond are the same. The right bordershows that the lightness predicted for those diamonds are 122and 167. When we translate digits to Munsell Values we findthat Retinex Output predicts a difference of about 2 Munselllightness Units. Logvinenko measured a difference of 2.2 Light-ness units.
The general conclusion is that the model evolved from thestudy of Mondrians can as well calculate appearances of bothreal life scenes or Gestalt phenomena, including the successfulprediction of Logvinenko gradient “Diamond Wall”.
Figure 23 (left ). The explanation of Ratio-Product-Reset-Average operation. Here we calculate the New Product (NP) for the output pixelx’,y’. We begin at the starting pixel x,y using the Old Product (OP). All OP’s are initialized with the maximum value. The product of theradiance Ratios times the Old Product is reset if greater than the maximum and averaged with the previous New Products. This operationsimulates the imperfect normalization to white. Figure23 (right). An illustration of the Multiresolution aspect of the Retinex calculation. Thecalculation uses three data planes. The Old Product is initialized to the maximum value. The original full-resolution image is illustrated asInput at the top. The input is averaged down to make a series of multiresolution planes ending with two pixels. This average Radiance imageis the second data plane. The third data plane is for the output of each iteration and is called the New Product. Starting with two pixels wemultiply the Old Product at the starting pixel and multiply it by the ratio of Radiances for the starting and output pixels. That product is Resetto the maximum and averages with previous Old Products at the output pixel. To get to the next level, the New Product is interpolated to twicethe size and placed in the Old Product data plane. The Radiance data plane uses the next larger (8 by 2) average of the Input. The Ratio-Product Reset-Average calculation illustrated in Figure 23-Left are repeated. The Process continues until New Product at full-resolution iscomplete and is used as Retinex Output.
Figure 24. The input and Retinex output for Logvinenko’s Gradientexperiment. Despite constant input (139), a Ratio-Product-Reset-Av-erage model can calculate lightness outputs consistent with observervalues.

In Part 2, we found the “Diamond Wall” displays in theLogvinenko Effect were very different in low-spatial frequencycomponents. We made an improved display that still exhib-ited the Logvinenko’s Effect. We showed that this improvedimage did not remove all the differences in low-spatial fre-quency input and that sampling can the cause of the effect.
In Part 3, we showed that the largest lightness shifts fromthe Logvinenko Gradient display can be explained by an “EarlyVision” model calculation.
All of these experiments share the same categorization.They are all explicable by “Early Vision” mechanisms, sinceSimultaneous Contrast, or multi-resolution sampling or aRetinex model can predict their appearance. The corollary ofthat statement is that these experiments cannot be used as evi-dence of the existence of “High Vision” lightness mechanisms.
Acknowledgments
The author wants to thank Alexander Logvinenko and TedAdelson and Mary McCann for very helpful discussions.
References
1J.J. McCann, “Color Theory and Color Imaging Systems: Past,Present and Future”, J. Imaging. Sci. and Technol., 42, 70, (1998).
2 E. H. Land and J. J. McCann, “Lightness and Retinex Theory”, J.opt. Soc. Am. 61, p. 1, (1971).
3 H. Wallach, J. Exptl. Psychol, 38, pg. 310, (1948).4 T.P. Stockham, Image Processing in the Context of a Visual Model,
Proc. IEEE, vol 60, pp. 828-284, (1972).5 A. Gilchrist, “Perceived lightness depends on perceived spatial ar-
rangement”, Science, 195,185-187, (1975).A. Gilchrist, “ (1979). “The perception of surface blacks and whites”,
Scientific American, Vol. 24, no. 3, 88-97.A. Gilchrist, S. Delman, and A. Jacobsen, “The classification and
integration of edges as critical to the perception of reflectance andillumination”, Perception and Psychophysics, Vol. 33, No. 5, 425-436, (1983).
A. Gilchrist, “Lightness contrast and failures of lightness constancy:a common explanation. Perception and Psychophysics, 43 (5), 415-424, (1988).
A. Gilchrist, “ Lightness, Brightness and Transparency. Hillsdale:Lawrence Erlbaum Associates, (1994).
J. Cataliotti, & A. Gilchrist, “ Local and global processes in light-ness perception. Perception and Psychophysics, 57(2), 125-135,(1995).
6 E. H. Adelson and A. P. Pentland, “The perception of shading andreflectance, in Channels” in the Visual Nervous System: Neuro-physiology, Psychophysics and Models, Ed.. Blum (London: Freundpp.. 195-208, (1991).
E. H. Adelson, “Perceptual Organization and the Judgment ofBrightness”, Science, 262:2042-2044 (1993).
P. Sinha, and E. H. Adelson, “Recovering Reflectance in a World ofPainted Polyhedra”, Proc. of Fourth International Conference onComputer Vision , 4, pp.156-163, Berlin; May 11-14 (1993).
P. Sinha, and E. H. Adelson, “Verifying the Consistency of ShadingPatterns and 3-D Structures”, Proc. of the IEEE Workshop on Quali-
Discussion
It should be noted that the combination of Adelson’s andLogvinenko’s ideas need to be handled carefully. They bothauthors have experimented extensively with Adelson’s “Dia-mond Wall” patterns. That is not to mean that their analysisof human vision are the same. Adelson has restated some ofhis earlier hypotheses in a “Mid Vision” framework using thecategorization of junctions. It is reminiscent of Letvin’s tri-ads. However, Adelson’s intersections deal with depth, whileLetvin’s dealt with the color of the illuminant. Logvinenkobuilds his arguments around perceived illumination, rather thanperceived depth.
If we review the above section, this time evaluating ap-parent illumination, we arrive at similar argument but with analtered list of experiments. Simultaneous Contrast and theeffect of enclosure and separation have neither apparent illu-mination, nor apparent shadows. However, both the Blackand White Mondrian and the Figure 22 have apparent illumi-nations - one is gradual, and one is abrupt. In principle, per-ceived illumination could be used to account for these experi-ments, if we only knew how to calculate this perception. Asdescribed earlier, such a calculation requires that we that knowhow to extract both reflectance and illumination from radi-ance. As discussed earlier humans see the same lightness sen-sations from identical radiances made by either reflectancesand transparencies. As the problem stands today, we can cal-culate lightness and color sensations using “Early Vision”mechanisms limited to simple computational steps (sum, dif-ference, reset, average). These lightnesses are then availableto calculate perceptions of depth and illumination. In the endwe are left with the same conclusions for apparent illumina-tion, as apparent depth. We have a simpler mechanism is wecan model lightness sensations using only the radiance on theretina. So far, we can account for the lightness in “DiamondWall experiments with Early Vision” mechanisms. It makescalculating the perceived depth and illumination easier to cal-culate if lightness is out of the way. We can use calculatedlightness as the input to shape from shading to help calculateapparent depth.
Conclusions
This paper has reviewed a wide variety of visual displays alldealing with the “High Vision” and “Early Vision” theories.
In Part 1, Adelson’s “Diamond Rows” can have either adepth / shadow perception explanation, or a Simultaneous Con-trast sensation explanation. The experiments here argue forthe sensation mechanism for three reasons. First, as with theAlbers’s effect, any edge added to the anomalous target Crestores Simultaneous Contrast. Second, the long rows ofdiamonds - helpful in creating apparent illumination - are notnecessary. The same lightness effects are found in simple,one quarter diamond displays. Third, Simultaneous Contrastis restored when the tips in Display D are reversed. The tips,now inconsistent with a depth/shadow perception, performthe same “releasing” function .
Biography
John McCann received his B.A. degree in Biology fromHarvard University in 1964. He managed the Vision ResearchLaboratory at Polaroid from 1961 to 1996. His work concen-trated on research in human color vision, large format instantphotography and the reproduction of fine art. He is a Fellowof the IS&T. He is a past President of IS&T and the ArtistsFoundation, Boston. Along with Giordano Berreta be co-chaired the IS&T /SPIE 2000 Electronic Imaging Meeting.He is currently consulting and continuing his research on colorvision.
tative Vision pp. 71-81, New York, NY; June 14 (1993).E. H. Adelson, “Lightness Perception and Lightness Illusions” in M.
Gazzaniga, M.S., ed., The Cognitive Neurosciences, Cambridge,MA: MIT Press, pp. 339-351 (1999).
7 A.D. Logvinenko, Perception, “Lightness Induction Revisited” 28,pp. 803-816, (1999).
8 J.J. McCann, R. L. Savoy, and J.. Hall, Jr., Visibility of ContinuousLuminance Gradients, Vision Research, 18, pp. 891-894 (1978).
R. L. Savoy and J.J. McCann, Visibility of low spatial-frequencysine-wave targets: dependence on number of cycles, J. opt. Soc.Am., 65, No. 3 pg 343-350, (1975).
J.J. McCann and J. A. Hall, Jr. Effects of average-luminance sur-rounds on the visibility of sine-wave gratings, J. opt. Soc. Am., 70,No. 2, pp. 212-219, (1980).
J. J. McCann, R. L. Savoy and J. A. Hall, Jr. Visibility of LowFrequency Sine-Wave Targets, Dependence on Number of Cycles
and Surround Parameters, Vision Research, 18, No. 7, pp. 891-894, (1978).
J.J. McCann, “Visibility of gradients and low-spatial frequency si-nusoids: Evidence for a distance constancy mechanism”, J. Photogr.Sci.Eng., 22, 64-68, (1978).
R. L. Savoy, Low Spatial Frequencies and Low Number of Cyclesat Low Luminances, J. Photogr. Sci. Eng., 22, No. 2, pp. 76-79,(1978)
9 J. McCann, S. McKee and T. Taylor, Quantitative Studies in Retinextheory, A comparison between theoretical predictions and observerresponses to Color Mondrian experiments, Vision Res., 16, pp. 445-458, (1976).
10 J.J. McCann, “Lessons Learned from Mondrians Applied to RealImages and Color Gamuts”, Proc. IS&T/SID Seventh Color Imag-ing Conference, pp. 1-8, (1999).
11 J .J, .McCann & K. L .Houston, “Color Sensation, Color Percep-tion and Mathematical Models of Color Vision,” in: Colour Vi-sion, J.D. Mollon, & Sharpe, ed., Academic Press, London, pp.891-894 (1983).
J. J. McCann, “Simultaneous Contrast and Color Constancy: Signa-tures of Human Image Processing”, in Proc of 9 th. AnnualVancouver Cognitive Science Conference, “Colour Perception:Philosophical, Psychological, Artistic and Computational Aspects”Oxford Press, in press, (2000).
12 M. D Fairchild, Color Appearance Models , Addison-Wesley Pub.Co., Reading, p. 153, (1997).
13 J. J. McCann and A. Logvinenko, “Lightness from Early VisionSpatial Comparisons, Mid Vision Junctions or High Vision Per-ceptions : The Debate Part 2”, Perception, Proc. ECVP, Trieste,p?,(1999).
J. J. McCann, “Calculating The Lightness Of Areas In A SinglePlane”, B. Rogowitz and T. Pappas, Eds., SPIE Proc. vol. 3959,in press, (2000).
14 T. N. Cornsweet, “Visual Perception”, Academic press, New York,pp. 270,279, (1970);
V. O’Brien, Contour Perception, Illusion and Reality, J. opt. Soc. Am.,48, pp. 112-119, (1958).
K. J W. Craik, “The Nature of Psychology”, Cambridge UniversityPress, London, (1966).
J, Albers, Interaction of Color, Yale University Press, New Haven,1963.
15M. White, “A new effect of pattern lightness”, Perception, 8, pp.
413-416, (1979);M. White, “The effect of the nature of the surround on the perceived
lightness”, Perception, 10, 215-230, (1981).16 J. J. McCann, “Spatial Contrast and Scatter: Opposing Partners
in Sensations”, B. Rogowitz and T. Pappas, Eds., SPIE Proc., Vol.3644, pp. 97-104, (1999).
17J. J. McCann, “Calculating The Lightness Of Areas In A SinglePlane”, B. Rogowitz and T. Pappas, Eds., SPIE Proc., vol. 3959,in press, (2000).
18 J. J. McCann and R. L. Savoy, “Measurement of Lightness: Depen-dence on the Position of a White in the Field of View “, B. Rogowitz,Ed., SPIE Proc., Vol. 1453, pp. 402-411, (1991).
19 J. J. McCann, E. H. Land and S. M. V. Tatnall, , “A Technique forComparing Human Visual Responses with a Mathematical Modelfor Lightness”, Am. J. Optometry and Archives of Am. Acad. Op-tometry, 47(11), pp. 845-855, (1970).