calgary housing market report - feb 2015
TRANSCRIPT

CALGARYREAL ESTATEMARKET REPORTFeb 2015
Realty Professionals
Cell: 403 831 0842Email: [email protected]
Web: www.jerrycharlton.com

Market Status
INFORMATION HEREIN DEEMED RELIABLE BUT NOT GUARANTEED SOURCE: CREB Calgary Real Estate Board
0
+1 +7
+2 +6
+4+3 +5
+8
4.35
Selle
r’s
Balanced
Buyer’s
monthsof inventory

INFORMATION HEREIN DEEMED RELIABLE BUT NOT GUARANTEED SOURCE: CREB Calgary Real Estate Board
Market Status (13 months history)No. of months of inventory
2
0
4
6
8
Feb.2014
BUYE
R’S
MAR
KET
NEUT
RAL
MAR
KET
SELL
ER’S
MAR
KET 1.43
Mar.2014
1.22
Apr.2014
1.50
May2014
1.54
Jun.2014
1.79
Jul.2014
2.01
Aug.2014
2.03 2.12 2.00
Set.2014
Oct.2014
2.072.66
Nov.2014
Dec.2014
5.03
Jan.2015
Feb.2015
4.35

Average Prices
INFORMATION HEREIN DEEMED RELIABLE BUT NOT GUARANTEED SOURCE: CREB Calgary Real Estate Board
Calgaryless
–3.0%
$462,294
-0.5%
Compared to LAST MONTH,homes areselling for
Month to Month Year to Year
Jan2015
$460,930
Feb2015
$462,294
Feb2014
$482,783
Feb2015
City of Calgary average SOLD price
Compared to LAST YEAR,homes areselling for
less-0.5%Calgary
more–4.2%+0.3%

INFORMATION HEREIN DEEMED RELIABLE BUT NOT GUARANTEED SOURCE: CREB Calgary Real Estate Board
Month to Month Year to Year
Jan2015
$526,394
Feb2015
$526,760 $553,493
Feb2014
Feb2015
$526,760
Detached homes average SOLD price
Compared to LAST MONTH,single family homes areselling for
Compared to LAST YEAR,single family homes areselling for
less
-4.8%Detachedmore
+0.1%

INFORMATION HEREIN DEEMED RELIABLE BUT NOT GUARANTEED SOURCE: CREB Calgary Real Estate Board
Month to Month Year to Year
Jan2015
$305,473
Feb2015
$308,942 $308,942
Feb2014
$327,288
Feb2015
Apartment average SOLD price
Compared to LAST MONTH,apartment condos areselling for
more
Compared to LAST YEAR,apartment condos areselling for
less
-5.9%
lessCondos
+1.14%

INFORMATION HEREIN DEEMED RELIABLE BUT NOT GUARANTEED SOURCE: CREB Calgary Real Estate Board
$433,056
Month to Month Year to Year
Jan2015
$403,264
Feb2015
$407,265 $407,265
Feb2014
Feb2015
Attached average SOLD price
Compared to LAST MONTH,townhouses areselling for
Compared to LAST YEAR,townhouses areselling for
lessAttached-6.0%
more+1.0%

INFORMATION HEREIN DEEMED RELIABLE BUT NOT GUARANTEED SOURCE: CREB Calgary Real Estate Board
Prices in $ and Price movement in percentage
200
0
100
300
400
500
Years - Residential Average Price
14 years average of price increase for city of Calgary is 7.96%2004 2005 2006 2007 2008 2009 2010 2011 2012 2013 2014
YTD
+12.79%
+39.79%
+18.26% –2.47%
–4.65%
+4.01% +1.10% +3.44%+6.54% +1.45%
+10.58%
227,2
69
256,3
27
358,3
26 423,7
70
413,2
93
409,8
85
394,0
64 414,3
87
428,6
49
456,7
03
2003
+9.93%
205,5
22
483,0
79
2015
461,7
22
463,3
03
–0.34%

INFORMATION HEREIN DEEMED RELIABLE BUT NOT GUARANTEED SOURCE: CREB Calgary Real Estate Board
2,9502,711
Month to Month Year to Year
Jan2015
Feb2015
2,9503,286
Feb2014
Feb2015
NEW listings
Compared to LAST MONTH,there are
lessnew listings
Compared to LAST YEAR,there are
morenew listings
+8.8%-10.2%

INFORMATION HEREIN DEEMED RELIABLE BUT NOT GUARANTEED SOURCE: CREB Calgary Real Estate Board
Listing inventory & SOLD (13 months history)
0
4,000
3,000
2,000
1,000
5,000Active listings Sold listings
Feb.2014
1,850
2,641
Mar.2014
2,481
3,033
Apr.2014
2,539
3,820
May2014
2,945
4,528
Jun.2014
2,664
4,759
Jul.2014
2,328
4,678
Aug.2014
2,263
4,591
Set.2014
2,146
4,559
Oct.2014
2,145
4,292
Nov.2014
1,779
3,681
Dec.2014
1,082
2,882
Jan.2015
879
4,420
Feb.2015
1,217
5,296

INFORMATION HEREIN DEEMED RELIABLE BUT NOT GUARANTEED SOURCE: CREB Calgary Real Estate Board
Month to Month Year to Year
Jan2015
12.86%
113 SOLDout of
879 allSOLD
Feb2015
Feb2014
28.86%
534 SOLDout of
1,850 allSOLD
Feb2015
12.16%
148 SOLDout of
1,217 allSOLD
12.16%
148 SOLDout of
1,217 allSOLD
Homes sold at or above asking price
Compared to LAST MONTH,there are
less homesselling ator aboveasking price
Compared to LAST YEAR,there are
–5.40%less homesselling ator aboveasking price
-57.58%
INFORMATION HEREIN DEEMED RELIABLE BUT NOT GUARANTEED SOURCE: CREB Calgary Real Estate Board
Month to Month Year to Year
Jan2015
Feb2015
Feb2014
Feb2015
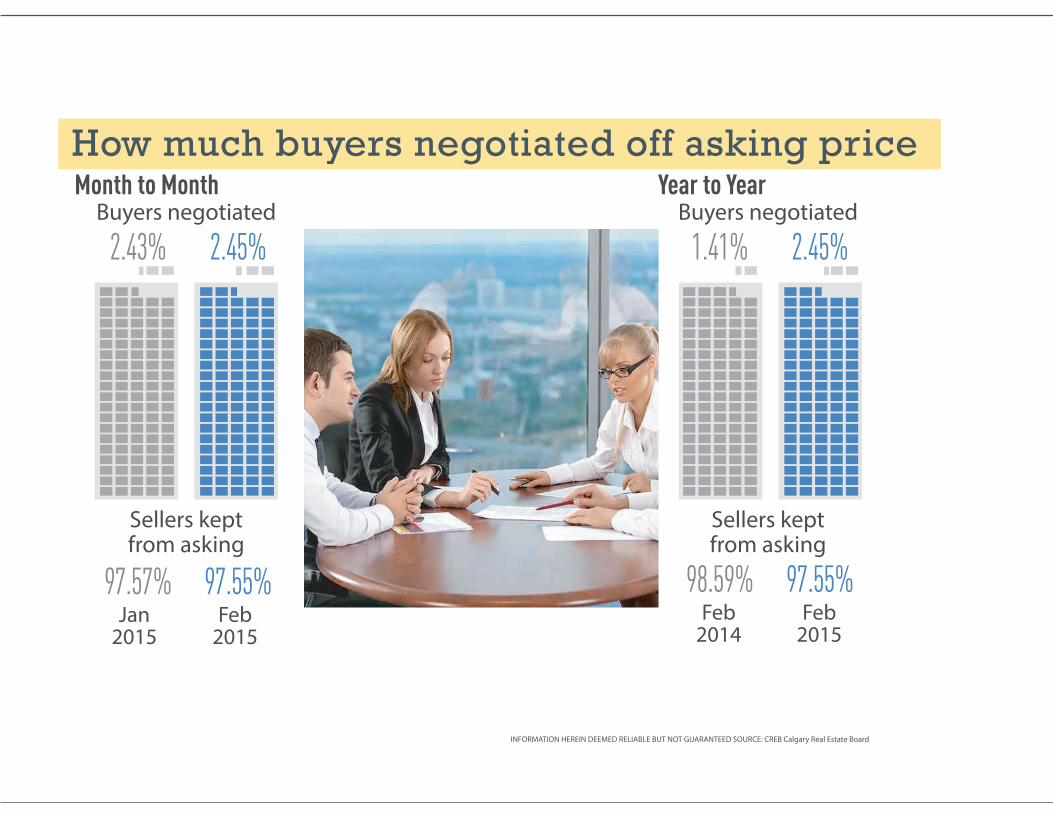
Sellers keptfrom asking
97.57% 97.55%
Sellers keptfrom asking
98.59% 97.55%
Buyers negotiated
2.43% 2.45%Buyers negotiated
1.41% 2.45%
How much buyers negotiated off asking price

INFORMATION HEREIN DEEMED RELIABLE BUT NOT GUARANTEED SOURCE: CREB Calgary Real Estate Board
Month to Month Year to Year
Jan2015
Feb2015
Feb2014
Feb2015
$5,195$8,968
Average $ amount SOLD over askingSingle Family
Compared to LAST MONTH,homes sold over listreceived
Compared to LAST YEAR,homes sold over listreceived
Over asking
$less
–42.1%more
$5,195$4,539
+14.5%

INFORMATION HEREIN DEEMED RELIABLE BUT NOT GUARANTEED SOURCE: CREB Calgary Real Estate Board
Over asking
Month to Month Year to Year
Jan2015
$1,606Feb
2015Feb
2014Feb
2015
$2,193 $2,193$4,104
Average $ amount SOLD over askingCondos
Compared to LAST MONTH,condos sold over listreceived
Compared to LAST YEAR,homes sold over listreceived
-46.6%
$more less
+36.6%

INFORMATION HEREIN DEEMED RELIABLE BUT NOT GUARANTEED SOURCE: CREB Calgary Real Estate Board
Month to Month Year to Year
Jan2015
879 SOLDout of
4,420 listed
Feb2015
Feb2014
70.05%
1,217 SOLDout of
5,296 listed
1,850 SOLDout of
2,641 listed
Feb2015
1,217 SOLDout of
5,296 listed
Odds of selling(Percentage of Homes Sold VS Listings)
Compared to LAST MONTH,the odds of selling increasedby
Compared to LAST YEAR,the odds of selling decreasedby
–66.49%
22.98%22.98%19.89%
+15.55%

INFORMATION HEREIN DEEMED RELIABLE BUT NOT GUARANTEED SOURCE: CREB Calgary Real Estate Board
Month to Month Year to Year
DOM35
DOM30
DOM35
DOM41
Average Days on Market
Feb 2014
Feb 2015
Jan 2015
Feb 2015
Compared to LAST MONTH,homes are selling
faster
Compared to LAST YEAR,homes are selling
slower+17.1% -14.3%