california air resources board/sustainability assessment ... · pathway • beet lcas for ca cannot...
TRANSCRIPT

California Air Resources Board/Sustainability Assessment
Sustainability Assessment for Agricultural Biofuels in California
Stephen Kaffka Department of Plant Sciences
University of California, Davis and Director, California Biomass
Collaborative
March 20, 2012

Outline
• What do we mean by agricultural sustainability?
• Mendota Advanced Beet Energy Coop and an example_using a cropping system optimization model for multiple purposes
• Sustainability and Certification • Proposed Actions


Sustainability and Best Management Practices: Policy implications
1. Change is the constant characteristic of agricultural practices
2. New technology and learning occurs constantly, but unevenly.
3. Sustainability assessments will vary locally
4. Policies, social preferences and external influences are in flux, and the most important ones are unpredictable

Hansen, J. W. (1996). Agric. Systems, 50:117-143
In discussing agricultural sustainability, we must use language carefully. We must be careful to define our boundary conditions. We should not use qualitative terms for quantitative phenomena.
How can we define/measure sustainability?

Types of definitions of sustainability:
• A philosophy or ideology • A set of strategies • The capacity to fulfill a set of
goals • The ability to continue over
time
Hansen, 1996

Proscriptive standards: Set of rules defining sustainability
Agriculture is sustainable
Agriculture is not sustainable
Does farming follow
the rules?
Yes No

But if sustainability is determined by definition, then it is logically impossible to evaluate how sustainable farming practices actually are, if adherence to a set of predetermined rules or standards is the criteria for evaluation. This circularity makes definitions of sustainability poor guides for research.
Hanson, 1996

Useful ways to characterize sustainability at the field and farm scale —Hanson, 1996
Element Definition
Literal An ability to continue through time
System-oriented
An objective property of a particular agricultural system whose components, boundaries and hierarchy are specified
Quantitative A continuous variable(s), permitting comparisons of alternative systems or approaches
Predictive Focuses on the future, not the present or past Stochastic Variability is a determinant of sustainability and a
component of prediction
Diagnostic Can be used to identify and prioritize constraints on a system that limits its sustainability

“…long term experiments … provide data on which to base rational judgments about the biophysical aspects of sustainability.” D.S. Powlson, 1996

Manure comparison plots at Rothamsted, England after 150 years—RF Denison photo
--Manure only-- --Manure + NPK--

0
1
2
3
4
5
6
7
8
9
10
1850 1875 1900 1925 1950 1975 2000
Whe
at g
rain
yie
ld (t
/ha)
Unmanured, continuous wheat
Continuous wheat:FYM PK+144 kg N
1st wheat in rotation:FYM+96 kg N Best NPK
Red Rosto
ck
Red C
lub
Squ. Mas
ter
Red Standard
Squ. Mas
ter
Cappell
e Des
p.
Flanders
Brimsto
ne
Apollo
Hereward
Introduction of: liming fungicidesfallowing herbicides
Powlson and Poulton, 2003
Long-term winter wheat yield trends, Rothamsted, England

A long-term experiment in California: Russell Ranch , UC Davis

Cropping system comparisons
System Irrigation N source Pesticides
Corn/tomato Irrigated Manure+ WLCC Organic
Corn/tomato Irrigated Fertilizer+ WLCC As needed
Corn/tomato Wheat/tomato
Irrigated Fertilizer As needed
Wheat/fallow Irrigated WLCC As needed
Wheat/fallow Irrigated Fertilizer As needed
Wheat/fallow Irrigated None As needed
Wheat/fallow Dry land WLCC As needed
Wheat/fallow Dry land Fertilizer As needed
Wheat/fallow Dry land None As needed
H2O N/C

Conventional Organic

Maize Treatments, 2004/5 Conventional Organic
Variety Seed rate (per ha)
ST 7570RR 80,250
ST 7570 80,250
Herbicides/ Pesticides
Yes No
Nutrient inputs 50 kg/ha NPK + 185 kg N
Vetch+ pea CC (180 kg N/ha)+
Compost (4 t wet wt): 240 kg N/ha

LTRAS (1994-2003)
Cropping SystemCCT LCT OCT CWT
Cha
nge
in s
oil o
rgan
ic c
arbo
n (M
g)
-4
-2
0
2
4
6
8
(Kong et al., 2005)

LTRAS (1994-2003)
Cropping SystemCCT LCT OCT CWT
Cha
nge
in s
oil o
rgan
ic N
(Mg)
0.0
0.2
0.4
0.6
0.8
1.0

Maize yields, 1994-2005, LTRAS
Year1994 1996 1998 2000 2002 2004 2006
Mai
ze y
ield
(kg
ha-1
)
0
2000
4000
6000
8000
10000
12000
14000
16000
conv. maize organic maize

Tomato yields (1994 to 2005) LTRAS
Year1994 1996 1998 2000 2002 2004 2006
Tom
ato
yiel
d (M
g ha
-1FW
)
0
20
40
60
80
100
ConventionalOrganic

Tomato Fruit Quality, LTRAS (1994-2004)
Farming SystemConventional Organic
Flav
inoi
ds (m
g g-
1 D
M)
0
20
40
60
80
100
120
140
Quercitin Naringenin Kampferol
Mitchell et al., 2009
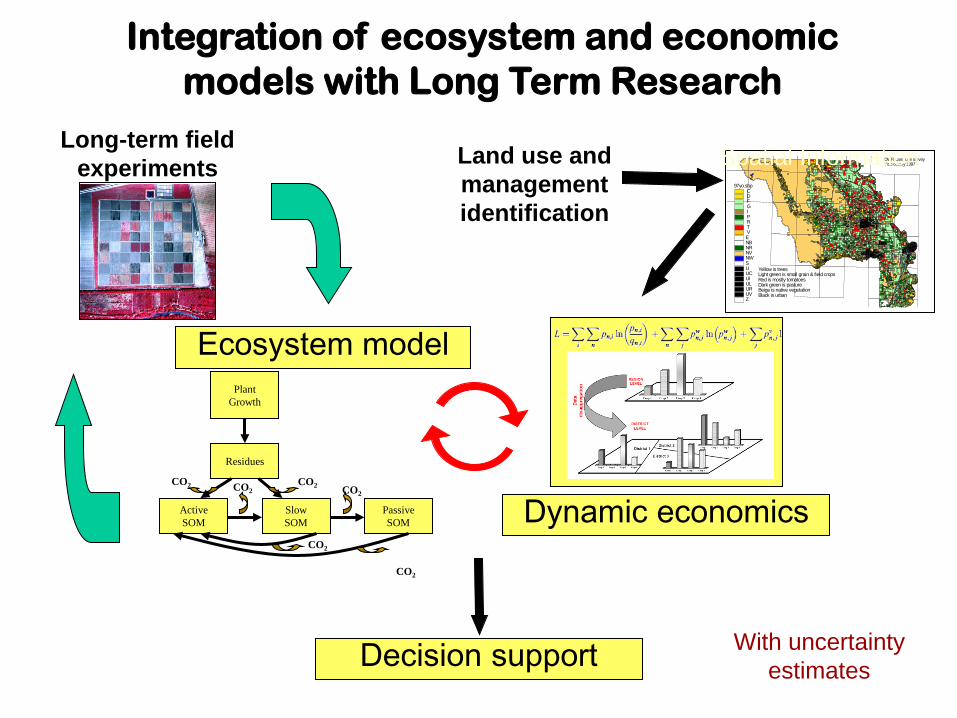
97yo.shp C D F G I P R T VENBNRNVNWSUUCUIULURUVZ
Yellow is treesLight green is small grain & field cropsRed is mostly tomatoesDark green is pastureBeige is native vegetationBlack is urban
DWR Land use surveyYolo county 1997
CO2
Ecosystem model
Active SOM
Slow SOM
Passive SOM
Residues
Plant Growth
CO2 CO2 CO2
CO2
CO2
Integration of ecosystem and economic models with Long Term Research
Land use and management identification
Long-term field experiments Spatial Information
Dynamic economics
Decision support With uncertainty estimates

Outline
• What do we mean by agricultural sustainability?
• Mendota Advanced Beet Energy Coop and an example_using a cropping system optimization model for multiple purposes
• Sustainability and Certification • Proposed Actions

25 Mendota Advanced Bioenergy Beet Cooperative March 2012. All rights
reserved
Why Mendota? Excellent infrastructure, access to irrigation water in surrounding area for farmers, site availability, social need of disadvantaged population, Funded through the AB 118 program.
The Mendota Coop was created by farmers (ex-sugarbeet growers)

Acknowledgements
• Alissa Kendall (Civil and Env. Eng; UCD) • Ruihong Zhang (Bio &Ag Engineering, UCD) • Mark Jenner (California Biomass
Collaborative) • Mendota Advanced Beet Energy Coop • Cliff Ohmart (Sure Harvest)

Integrated biorefinery, Jan. 2012

Imperial Valley, August 2011 harvest 157 t/ha roots and 27 t gross sugar/ha
75 cm
Imperial Valley (1978-2004)
Year1975 1980 1985 1990 1995 2000 2005
Roo
t yie
ld (t
/ac)
0
10
20
30
40
50
Sug
ar %
0
2
4
6
8
10
12
14
16
18
20
root yieldsugar %
Beets grow better in CA, including the SJV, than anywhere else in the world

Mendota Advanced Energy Beet COOP Management challenges: • Must manage multiple pathogen vectors • Beet root quality varies over the season • Deliver (unstorable) beets year round via a complex
planting and harvest system. A twelve month harvest is unprecedented in the world, but has been adopted. New harvest equipment should make this possible.
ROPA Harvester:

Mendota Bioenergy LLC Harvest Area 30
Coarse textured soils in the feedstock supply region. These will be used for supply during wet months.

Beet Supply From Different Regions
31
Harvest Areas
1# 2# 3# 4 A&B# 4C# 4D# 4E# TOTALS
Harvest (ha)
2,700 2,877 4,200 400 2,300 1,600 1,000 15,200 ha
Median Distance
50 km 40 km 32 km 100 km 80 km 50 km 110 km
1Q Jan-Mar
24,000 228,000 124,000 376,000 t 342,000 mt
2Q Apr-June
244,000 127,600 371,600 t 338,000 mt
3Q July-Sept.
156,900 214,000 371,100 t 337,7002 mt
4Q Oct-Dec
204,000 40,000 360,000 t 327,670 mt
TOTALS 268,000 t 243,880 mt
284,200 t 258,600 mt
420,000 t 380,600 mt
40,000 t 36,400 mt
228,000 t 254,800 mt
160,000 T 145,600 mt
100,000 t 91,000 mt
1,498,400 t 1,363,600 mt

Aphid-transmitted viruses will move from north to south
Curly top virus (leafhopper transmitted) moves south to north
Beet Field Locations Require Careful Siting

Mendota Advanced Energy Beet COOP Policy Challenges: • There is no Renewable Fuel Standard (EPA) pathway • There is no Low Carbon Fuel Standard (CARB)
pathway • Beet LCAs for CA cannot be extrapolated from
existing analyses and are not included in large-scale economic models used for LCA and ILUC estimates.
• To be successful, biofuels must be produced with very low CI. Biomass production, logistics and delivery have to be efficient. A single average value will not account for variance in such a system.
• Several different types of biomass energy systems must be integrated into an integrated biorefinery. LCA’s for such an analysis are unprecedented.

Mendota Advanced Bioenergy Beet Cooperative
Estimated Use: • 1 million tons of local energy beets • 80,000 tons of agricultural residue Generate • 6.3 MW of certified Green-e electricity • 33.5 million gallons of advanced ethanol • 1.6 million standard cubic feet of biomethane • 365 acre-feet of irrigation water recycled from
the City of Mendota’s wastewater • $90 million of direct economic activity and jobs in
a community of over 40 percent unemployment

Agronomic System
Conversion
Operational Framework for Beet-Ethanol LCA Model (Alissa Kendall)
Reference Life Cycle Inventories
GREET Model and Commercial Life Cycle Inventory Databases
Beet Production
N2O Field Emissions
Equipment Fuel Use
and Emissions
CARB’s OFFROAD
Model
IPCC Emissions
Factors
Distance Calculations
ArcGIS
Pre-Treatment
Fermentation Distillation
Digester Heat Plant / Boiler
Legend
Worksheet
Reference Sheet / Look-up Table
External model
Co-Product Valorization & Allocation Logistics

Some values from direct or attributional (LCA) assessment of GHG costs for maize-based ethanol biofuel Source: NRC, 2011
Life Cycle Assessment (LCA) is required for both the RFS2 and California’s Low Carbon Fuel Standard (LCFS)

Integrated biorefinery design (2012) Portions of the ethanol will be cellulosic

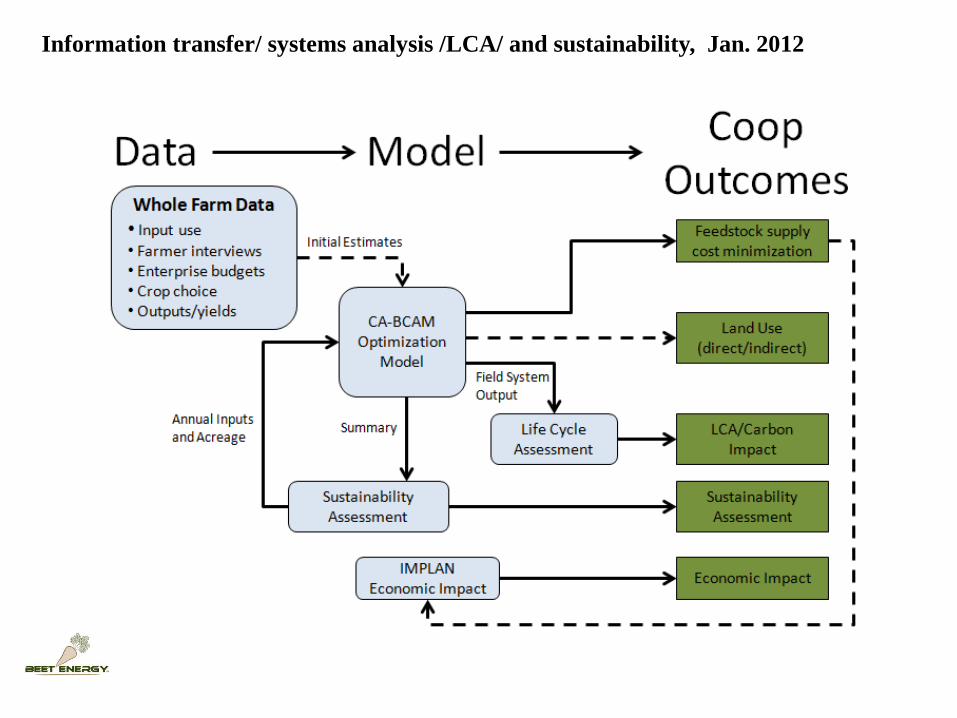
Information transfer/systems analysis/LCA/ and sustainability, Jan. 2012

It is not Food vs. Fuel:
Crops have multiple roles, and multiple effects in cropping systems, both positive and negative. In general, having more crop alternatives benefits agriculture and is widely considered to be a feature of agricultural sustainability.
It is essential to think of biofuel crops as part of optimized cropping systems.

Estimating Biofuel Carbon Intensity and Minimizing GHG
Emissions Using Economic Models
Steve Kaffka, Mark Jenner Department of Plant Sciences & California Biomass Collaborative

The Challenge:
• Is there potential in CA for producing biofuel feedstocks on farms? How can we accurately estimate the true potential of purpose-grown crops and crop residues for biomass energy in CA cropping systems.
• Existing large scale (national) models do not reflect CA well (REAP, POLYSYS, GTAP, FASOM). How can we do this better?

Estimating fuel CI
Since California’s soils, water, related natural resources, and associated biomass production potentials are highly diverse:
• One California Biomass Collaborative objective is to fill in the resource ‘gaps’ in national-scale models for the benefit of bioenergy feedstock development in California.
• Another is to estimate the likely locations, types, and costs of agricultural biomass in California to support use of these resources for energy where it is sensible to do so.
• A third is to support the development of beneficial biomass based businesses.

Defining representative cropping systems
• 10 years of pesticide use/crop choice data for most of the crop producing areas of California from CA DPR.
• DPR data is for 1-section units (640 acres). • Naturally occurring cropping patterns on
17,000 sections within five macro-regions of California were used in Multidimensional Scaling, Cluster Analysis.
• 45 individual cropping systems were identified.

Northern California – 9 Clusters of Cropping Systems
42
43
44
45
UTM
_N
400000 500000 600000 700000
UTM_E
Lassen County
Humbolt County
Sacramento Valley

Counties in Analysis Regions
Northern California (NCA)
9 Cropping Clusters
Central California (CEN)
9 Cropping Clusters South San Joaquin (SSJ)
8 Cropping Clusters

Crop Data Coverage
• Model includes annual crop acres, but not perennial fruit/nut tree and vine crops or irrigated pastures.
• DPR data was calibrated with historical County Agricultural Commissioner crop data.
Regionmodel code
Crop Acres (Census of Ag)
Annual Crop Acres
Total Counties
DPR Counties
Crop/Farm Clusters
Northern CA NCA 3,190,441 1,538,971 29 14 9Central CA CEN 2,314,332 1,179,789 9 5 9South SJV SSJ 2,094,486 1,193,752 3 3 8Southern CA (IV) SCA 818,787 599,237 6 2 6Coastal CA COA 1,038,340 395,633 11 6 13
9,456,386 4,907,383 45

Crop Score Dist % Dist %Rice 7.215 29.3% |||||||||||||||||||||||||||| 32.0%Tomato 3.944 16.0% |||||||||||||||| 17.5%Wheat 3.285 10.2% |||||||||| 11.2%Beans 2.486 10.1% |||||||||| 11.0%Safflower 2.292 9.3% ||||||||| 10.2%Melons 2.285 9.3% ||||||||| 10.1%Corn 1.271 5.2% ||||| 5.6%Alfalfa 0.542 2.2% || 2.4%Onion 0.424 1.7% ||Cotton 0.271 1.1% |Carrots 0.236 1.0% |Oats 0.132 0.5% |Sorghum 0.125 0.5% |Sugarbeet 0.063 0.3%Barley 0.028 0.1%Ryegrass 0.021 0.1%Broccoli 0.014 0.1%Sudangrass 0.014 0.1%Bermudagrass 0.000 0.0%Forage Grasses 0.000 0.0%Garlic 0.000 0.0%Lettuce 0.000 0.0%Potato 0.000 0.0%Rape 0.000 0.0%
24.646 100%
Example: Northern CA (C7)
Green box shows a representative farm defined by 90% of crops in Cluster 7
Minor crop acres, shifting acres

Regions Have Different Characteristics
0.0
0.5
1.0
1.5
2.0
2.5
3.0
3.5
4.0
4.5
5.0
0 2 4 6 8 10 12 14 16 18Crops/Cluster
Water (ac-ft)NCA SSJ
476,419 ac
301,912 ac
Relative,Cluster Size (ac)

Approach: PMP model development
• Develop a cropping systems optimization model with sufficient detail to capture the effects of region and landscape position.
• Run the model on as small a unit as the data allows, and then sum the results to aggregate regional and state level potential.

CBC Optimization Model
Subject to: j= {acres, ac-ft of water}
PMP function
Energy crop function
Production function
P e,g,i,j = farm price of crop i, and energy crop e, in region g, and resource, j. C e,g,i,j = farm cost of crop i, and energy crop e, in region g, and resource, j. Y e,g,i,j = yield of crop, i, and energy crop e, in region, g, and resource, j. X e,g,i,j = level of hectares r applied to energy crop e, in region g for crop i. Ᾱg,j = constrained hectares of crop j in region g. β g,i,j = intercept of the quadratic (marginal) curve of crop, i, in region, g, resource, j. ω g,i,j = slope of quadratic (marginal) curve of crop, i, in region, g, and resource, j.
A
Each crop activity has an associated resource use budget, so resource use can be calculated and compared for a cropping system with and without the energy crop.

Assumptions and Caveats • ‘Profit’ in this model refers to the
incremental increase in profit for the crop analyzed. For example: a ‘$20/acre profit’ level refers to an additional $20 per acre for that crop compared to others already in the system – not total farm profit. This reflects the amount a bioenergy firm would have to pay to acquire a particular feedstock (a contract price).
• All prices and costs were set at 2007 price levels for consistency across all crop budgets. They are currently being modified.
• Water use is consistent with allocations during the period for which DPR data was acquired (1999-2008).

Acreage shifts (%) in each aggregated region at $20/acre increase in profit. This indicates where crop adoption is most likely
0.0%0.5%1.0%1.5%2.0%2.5%3.0%3.5%4.0%4.5%5.0%
Canola SweetSorghum
Sugarbeet Safflower Bermudagrass
NCA CEN SSJ SCA
Increases in profit were tested over the range: $0 to $40 per acre.

Conclusions
• Local effects make a large difference • Model can be tailored to very specific
applications, including individual farms • Actual data can be used for LCA GHG
calculations, not estimates, at the COOP scale • The crops displaced in California may have
limited international impact (ILUC)

On-going work • Collect data on cropping systems from individual
growers who are representative of the potential grower community likely to participate in the COOP from across the supply region.
• Model the costs and resource use of beet production by grower and production/harvest area.
• Model the effects of differing planting/harvest patterns on the cost of beet production and on other crops, resource use and crop displacement. Convert these estimates to CI values.

Outcomes • Robust estimates of costs across the supply area
and year. Everyone will know in general what it costs to deliver beets on a daily basis at different times during the year. CI for biofuel produced can be optimized (minimized).
• Robust estimates of the resource use efficiency of beet production for the entire production region and year.
• Robust estimates of alternative crops displaced and comparative resource use. This is unprecedented and will help create superior LCAs, support an individual fuel pathway, and inform CARB.

Outline
• What do we mean by agricultural sustainability?
• Mendota Advanced Beet Energy Coop and an example_using a cropping system optimization model for multiple purposes
• Sustainability and Certification • Proposed Actions

What do we mean by sustainability?
The Easy Part:
• Environmentally sound • Economically profitable • Socially just

The objectives of agriculture (multifunctionality):
1. To provide an adequate food supply for a growing
human population at a reasonable price. 2. To provide an increasingly high quality diet for all
the world’s people. (Diet diversity, more animal protein)
3. To maintain the income of farmers at levels comparable to that of the urban population
4. To maintain the natural resource base of agriculture. (soil erosion, soil quality?)
5. To use non-renewable resources prudently. 6. To maintain and provide habitat and resources for
other species, and to maintain the function of supporting natural ecosystems.

Economic efficiency
Agroecological sustainability
Equity
Production Continuity
of the resource base
Consumption
Changes in natural
resources
Policy level
Farm Level
Field level
Kruseman et al., 1996
What we call sustainable depends on the boundary conditions
Information transfer/ systems analysis /LCA/ and sustainability, Jan. 2012

Sustainability and Best Management Practices: Policy implications
To define sustainable farming practices well, and have an effective sustainability standard for biofuel production, a mechanism for frequent evaluation is needed. Learning must be embedded in any standard. The use of standards must be inseparable from a constant evaluation process, in order not to inhibit positive change.
A flexible standard?

S U S T A I N A B I L I T Y F R O M T H E G R O U N D U P
SureHarvest’s Continuous Improvement Framework
1. Principles: The values that define your strategy
2. Processes: The set of managed activities that create internal and external value (e.g. production, sales, etc.)
3. Practices: The methods used to accomplish the desired operational results (e.g., irrigation management best practices)
4. Performance: The metrics and measurements used to evaluate practice and process results
5. Progress: The approach used to document, communicate and drive continuous improvement over time (e.g. assessment, benchmarking, action plans, training, reporting, etc.)

S U S T A I N A B I L I T Y F R O M T H E G R O U N D U P
5P’s in Action: Winegrape Example
Sell crop at a profit Produce highest quality crop possible and optimize yields
Adopt model of continuous improvement for the farm
Irrigation Management Nutrient Management Pest Management
Install flow meter
Monitor for leaks and clogs
Test for distribution uniformity
Water use efficiency
Optimized yield and quality
Nutrient use efficiency Lower crop loss, reduced pesticide risks
Assessment & re-assessment
Monitor for pests
Use economic thresholds
Use reduced risk pesticides
Tissue sampling
Develop nutrient budget
Use fertigation
Benchmarking Action Plans Implement improvements
Performance
Progress
Practices
Principles
Processes

Outline
• Are there opportunities for biofuel production from crops and residues in CA? (the role of LCFS and RFS2)
• Mendota Advanced Beet Energy Coop and an example_using a cropping system optimization model for multiple purposes
• Sustainability Considerations • Generalizing

Sustainability and Best Management Practices: Policy implications
In CA, there are many statutes, rules and regulatory activities that in effect are sustainability standards. Adopting additional 3rd party standards in areas where these function well is largely unnecessary or duplicative and undermines many current state processes.
But the LCFS provides an additional positive mechanism that incentivizes gains in efficiency for feedstock producers.
Improving efficiency spares natural resources

On-going regulatory processes in California: CV-Salts CVRWQCB
• In 2006, the Central Valley Water Board, the State Water Board, and stakeholders began a joint effort to address salinity and nitrate problems in California’s Central Valley and adopt long-term solutions that will lead to enhanced water quality and economic sustainability. Central Valley Salinity Alternatives for Long-Term Sustainability (CV-SALTS) is a collaborative basin planning effort aimed at developing and implementing a comprehensive salinity and nitrate management program.
• In July 2008, the Central Valley Salinity Coalition (CVSC) was
formed. CVSC represents stakeholder groups working with the Board in the CV-SALTS effort. Its purpose is to organize, facilitate and fund efforts needed to fulfill the goals of CV-SALTS. CVSC coordinates the meetings of the CV-SALTS committees, maintains an independent web site, and manages the projects originating from this effort. Their website: www.cvsalinity.org.

On-going regulatory processes in California: IRRIGATED LANDS
REGULATORY PROGRAM The Irrigated Lands Regulatory Program (ILRP) regulates discharges from irrigated agricultural lands. Its purpose is to prevent agricultural discharges from impairing the waters that receive the discharges. To protect these waters, Regional Water Boards have issued conditional waivers of waste discharge requirements to growers that contain conditions requiring water quality monitoring of receiving waters and corrective actions when impairments are found. http://www.swrcb.ca.gov/water_issues/programs/agriculture/

On-going regulatory processes in California: Pest Management Alliance Grants
SACRAMENTO -- The California Department of Pesticide Regulation awards grants to …to reduce pesticide risks in neighborhoods, schools, and farm fields across the state...DPR's Pest Management Alliance program…encourages industry-wide innovations that benefit workers, consumers, and the environment. IPM works with nature to minimize pests, nurture beneficial organisms, and promote least-toxic pest control. The program focuses on reduced risk pest management strategies. Since 1996, more than 200 projects have received support. Recent Alliance grants: • The Almond Board of California, to reduce the use of high-toxicity pesticides, with field demonstration orchards in Butte, Kern, and
Stanislaus counties. • The California Association of Winegrape Growers, to prevent sulfur drift and seek herbicide alternatives with vineyards in Alameda,
Mendocino, Monterey, Napa, Riverside, San Joaquin, San Luis Obispo, Santa Barbara, Sonoma, and Stanislaus counties. • The California Citrus Research Board, to encourage biological controls on key citrus pests, with demonstration groves in Kern and
Tulare counties • The California Dried Plum Board, to reduce the use of high-toxicity insecticides and pesticide runoff into surface and ground water, with
field work in Butte, Fresno, Glenn, Madera, Merced, Sutter, Tehama, Tulare, Yolo, and Yuba counties. • The California Tree Fruit Agreement, to develop an IPM system for controlling major stone fruit pests in Fresno, Kings, Sutter, Tulare,
and Yuba counties. • The University of California, in cooperation with California's nursery industry, to seek more environmentally-friendly pest control
methods against the red imported fire ant and the glassy-winged sharpshooter. Demonstration nurseries are in Los Angeles, Orange, Riverside, San Bernardino, and San Diego counties.
• The Walnut Marketing Board, to compare and demonstrate the effectiveness of reduced-risk alternatives to conventional walnut pest control in Butte, Contra Costa, Fresno, Glenn, Kings, San Joaquin, Solano, Stanislaus, Sutter, Tehama, Tulare, Yolo and Yuba counties. http://www.cdpr.ca.gov/docs/pressrls/archive/2002/020214.htm
These programs are only some of many in which CA leads the world in trying to regulate and improve the total outcome of natural resource use within the state. Sustainability standards provide a filter with which to evaluate existing regulations for their usefulness.

Conclusions/Recommendations The LCFS provides a strong incentive to minimize resource per unit of biofuel produced. This incentive is congruent with farmers’ interests and with many characteristics associated with sustainability. How to do assessment:
• A project-based (or ground-up) approach should be used for all
California based biofuel production businesses when in-state agricultural biomass is used for feedstocks.
• Adopt the use of whole farm and representative farm models defined for well-chosen regions. Use these to account for crop resource use, farm resource use, and crop displacement in diverse cropping systems. This data can be used in LCA models to estimate carbon intensity related to feedstock production.
• Use actual data or locally adjusted representative farm models to create fuel CI estimates (CARB’s 2A/2B pathway). This includes actual crop displacement to be used for estimation of market-mediated effects.

Conclusions/Recommendations
Certification: • Third party sustainability standards applied within California may be
largely redundant and incompatible with state regulatory processes. They cannot be used to displace, undermine or make more complex the process of compliance with the state’s already intensive and dynamic regulatory structure and processes.
• Sustainability standards within the LCFS should not become a fugitive pathway to impose additional regulations on agriculture outside of the regulatory pathways and processes currently functioning, unless a significant omission can be identified, that is unlikely to be rectified in the future. In-state mechanisms should be preferred.
• ACTION: The state should create something like a programmatic standard or EIR for in-state biomass production that identifies and accounts for existing regulations, certification and compliance measures. This will substitute for other certifications. An objective of all recent governors is to harmonize the state’s diverse policies and regulations. Sustainability standards provide an opportunity for doing so.

Conclusions/Recommendations
Certification: • For fuels imported into California, there are many
third party standards that have been developed. All are likely to provide assurance that a set of guidelines have been followed, with few substantive differences likely to result among them. In that case, several should be allowed, letting the fuel providers decide among a range of acceptable standards.
• The cost of compliance should be the primary distinguishing characteristic among the standards.
• Standards that presumptively discriminate against irrigated systems or the use of modern crop varieties should not be considered.

Conclusions/Recommendations Requirements
Learning must be the defining characteristic of sustainability standards, because the key characteristic of sustainability is flexibility: the capacity to respond to changing factors. • Encourage process focused methods. These are
superior to adopting arbitrary thresholds. The goal is to provide additional incentives that encourage improvement over time in all critical areas of farm management.
• The LCFS can help pay for the cost of public goods difficult to fund otherwise.

Can we have a prudent bioenergy policy that increases sustainability?
“…legal systems embody the rule of law to the extent that their rules
are: 1. Prospective rather than retroactive, 2. Not impossible to comply with, 3. Are promulgated (made known) 4. Are clear 5. Are coherent with respect to each other 6. Are stable enough to be guidelines for longer-term conduct 7. Are administered consistently and uniformly.
(Natural Law and Natural Rights _ J. Finnis, 1980)
Do the rules and regulations discussed here comply with this overview of just and effective law?