technical report - comparing power generation options and ...€¦ · lcas conducted on the...
TRANSCRIPT

TECHNICAL REPORT
COMPARING POWER GENERATION OPTIONS AND ELECTRICITY MIXES NOVEMBER 2014
Prepared for
Hydro-Québec
Unité environnement et développement durable
Direction principale Environnement et Affaires corporatives 75 boul. René-Lévesque ouest, 2e étage Montréal, Québec H2Z 1A4

INTERNATIONAL LIFE CYCLE CHAIR PARTNERS
International Life Cycle Chair
Polytechnique Montréal Département de génie chimique 2900, Édouard-Montpetit Montréal, Québec, Canada C.P. 6079, Succ. Centre-ville H3C 3A7
www.chaire-cycledevie.org
Report submitted by: BUREAU DE LA RECHERCHE ET CENTRE DE DÉVELOPPEMENT TECHNOLOGIQUE (B.R.C.D.T.) ÉCOLE POLYTECHNIQUE DE MONTRÉAL Université de Montréal Campus C.P. 6079, Succ. Centre-ville Montréal, Québec H3C 3A7

This report was prepared by the International Life Cycle Chair (ILC Chair), the primary research arm of the International Reference Centre for the Life Cycle of Products, Processes and Services (CIRAIG), operated jointly by Polytechnique Montréal and the school of management sciences at UQAM (ESG-UQAM).
The ILC Chair began its research activities on January 1, 2012. It is directed by four chairholders from Polytechnique Montréal and ESG-UQAM, allying engineering with social sciences. It brings together 13 industrial partners who are leaders in sustainable development: ArcelorMittal, Bombardier, Mouvement Desjardins, Hydro-Québec, LVMH, Michelin, Nestlé, RECYC-QUÉBEC, SAQ, Solvay, Total, Umicore and Veolia. Today, the ILC Chair is one of the world's largest private investments in life-cycle research.
WARNING
Except for documents produced entirely by CIRAIG or ESG-UQAM, including this report, any reference to the ILC Chair, CIRAIG, Polytechnique Montréal or ESG-UQAM in public communications associated with this project and its results must have the prior written approval of a duly authorized representative of CIRAIG, Polytechnique Montréal or ESG-UQAM.

© ILC Chair
Page iv COMPARING POWER GENERATION OPTIONS AND ELECTRICITY MIXES November 2014
Report Team
Production
Pablo Tirado-Seco, Analyst
Research, analysis and LCA for Hydro-Québec kWh
Geneviève Martineau, Senior Analyst
Writing and quality control
Collaborators
Sophie Fallaha, M.Sc.A.
Director, Industrial Relations, ILC Chair Project coordination
François Saunier, Analyst Quality control
Management
Réjean Samson, Director General, CIRAIG-Poly
Principal Chairholder, ILC Chair Scientific management

Hydro-Québec Technical Report
November 2014 COMPARING POWER GENERATION OPTIONS AND ELECTRICITY MIXES Page v
Executive Summary
Since electric power can be generated by various means, its environmental impacts vary accordingly. Hydro-Québec, with a view to improving its understanding of the issues, tasked the International Reference Centre for the Life Cycle of Products, Processes and Services (CIRAIG) with conducting a comparative study on the environmental impacts of the different power generation options and electricity mixes1 in several parts of the world. The study was based on life cycle assessment (LCA), a method for assessing the environmental impacts of a product or service over all or part of its life cycle. Consumption and emission levels at the various stages—from raw material extraction to power generation (in the case of generation options) and distribution (in the case of electricity mixes)—were compiled and converted into environmental impacts.
Comparing power generation options
Data on the impacts of power generation options were gathered from a bibliographic review of LCAs conducted on the subject. The LCAs covered power generation from both non-renewal thermal sources (natural gas, coal, oil and nuclear) and renewables (hydropower, solar, wind and biomass). Over 60 reports and articles published since 2007 and representative of the study context were identified and analyzed. The data gathered were also referenced against an earlier study conducted by CIRAIG for Hydro-Québec on the impacts of electricity generated, transmitted and distributed by the company in 2012.
The data show that, for the seven environmental impact indicators studied,2 the results for Hydro-Québec's hydroelectric generation options were among the best, due to their low use of resources during the production stage. Conversely, thermal generation based on non-renewable sources gave the worst results, due to the extraction, processing and use of fuels. Note that results can vary widely within the same option depending on the technology or fuel considered, especially for thermal (fossil and biomass). The results from the Hydro-Québec reference study were, for most indicators, similar to those obtained from the literature on hydroelectric options. The few discrepancies stemmed from differences in the hypotheses posed from one study to the next.
Comparing electricity mixes
The electricity mix comparison used ecoinvent v3.0, a database widely consulted in LCA. Based on data for all Canadian provinces and American states, as well as for a few other countries selected by Hydro-Québec, the study looked at four widely used environmental impact indicators: Climate Change, Human Health, Ecosystem Quality and Resource Use. It concluded that the environmental performance of the kilowatthour distributed in Québec is among the best, comparing favorably with other parts of the world where the electricity mix has a large hydropower component, like
1 In this report, "electricity mix" (sometimes called "power mix" or "grid mix") means all generation options, i.e., all generating stations in operation within the territory, along with purchases from independent producers and imports from neighboring systems.
2 Only indicators for which a sufficient amount of data was available were retained for option comparison purposes: Climate Change, Ozone Layer Depletion, Acidification, Eutrophication, Human Toxicity, Resource Use and Photochemical Oxidation.
© ILC Chair
Page vi COMPARING POWER GENERATION OPTIONS AND ELECTRICITY MIXES November 2014
Manitoba and Norway. More generally, areas where the mix has a large proportion of renewables have better profiles overall, while those making extensive use of fossil fuels (coal and/or natural gas, such as China and some parts of the U.S.) do not perform as well.
Hydro-Québec Technical Report
November 2014 COMPARING POWER GENERATION OPTIONS AND ELECTRICITY MIXES Page vii
Table of Contents
REPORT TEAM .......................................................................................................................................... IV
EXECUTIVE SUMMARY .............................................................................................................................. V
TABLE OF CONTENTS ............................................................................................................................... VII
LIST OF TABLES ......................................................................................................................................... IX
LIST OF FIGURES ....................................................................................................................................... IX
ABBREVIATIONS AND ACRONYMS ............................................................................................................ X
1 BACKGROUND .................................................................................................................................. 1
2 DESCRIPTION OF GENERATION OPTIONS AND ELECTRICITY MIXES ................................................... 2
2.1 Power generation options .............................................................................................. 2
2.1.1 Renewable power generation options ....................................................................... 2
2.1.2 Non-renewable generation options ........................................................................... 4
2.2 Electricity mixes .............................................................................................................. 4
3 METHODOLOGY .............................................................................................................................. 10
3.1 Life cycle assessment .................................................................................................... 10
3.1.1 Impact assessment methods .................................................................................... 11
3.1.2 Environmental indicators .......................................................................................... 12
3.2 Bibliographic review ...................................................................................................... 14
4 HYDRO-QUÉBEC KWH LIFE CYCLE ASSESSMENT .............................................................................. 15
4.1 Phase 1: Definition of system studied........................................................................... 15
4.2 Phase 2: Life cycle inventory (data collection) .............................................................. 16
4.3 Phase 3: Life cycle impact assessment (results)............................................................ 16
4.3.1 Québec electricity mix .............................................................................................. 16
4.3.2 Hydro-Québec hydropower ...................................................................................... 18
5 PRESENTATION OF COMPARATIVE DATASHEETS ............................................................................ 21
5.1 Environmental indicators selected for comparison ...................................................... 21
5.2 Comparison of power generation options .................................................................... 23
6 REFERENCES ................................................................................................................................... 28
6.1 General .......................................................................................................................... 28
6.2 Comparative datasheet ― Climate Change .................................................................. 29
6.3 Comparative datasheet ― Ozone Layer Depletion ...................................................... 33
6.4 Comparative datasheet – Acidification ......................................................................... 35
6.5 Comparative datasheet – Eutrophication ..................................................................... 38

© ILC Chair
Page viii COMPARING POWER GENERATION OPTIONS AND ELECTRICITY MIXES November 2014
6.6 Comparative datasheet ― Human Toxicity .................................................................. 40
6.7 Comparative datasheet ― Resource Depletion ............................................................ 41
6.8 Comparative datasheet ― Photochemical Oxidation (Smog) ...................................... 43
APPENDIX A: COMPARATIVE DATASHEETS ............................................................................................. 47
APPENDIX B: GLOSSARY .......................................................................................................................... 49
APPENDIX C: BIBLIOGRAPHIC REVIEW..................................................................................................... 52
C.1 Survey of bibliographic references ............................................................................... 52
C.2 Sorting ........................................................................................................................... 53
C.3 Compilation of existing results ...................................................................................... 53

Hydro-Québec Technical Report
November 2014 COMPARING POWER GENERATION OPTIONS AND ELECTRICITY MIXES Page ix
List of Tables
Table 2-1: Composition of electricity mixes for Canadian provinces studied (2008, 2012) ............. 7
Table 2-2: Composition of electricity mixes of NERC regions (U.S. portion only) (2008)................. 7
Table 2-3: Composition of electricity mixes in the U.S. Northeast and Québec (Hydro-Québec) in 2012 .................................................................................................................................................. 8
Table 2-4: Composition of electricity mixes of various countries (2008) ......................................... 9
Table 3-1: Impact assessment methods ......................................................................................... 12
Table 3-2: Environmental indicators used in CML and IMPACT 2002+ .......................................... 13
Table 5-1: List of comparative datasheets of generation options and electricity mixes ............... 22
Table 5-2: References used to quantify potential environmental impacts of generation options 24
Table C-1: Databases and search platforms used .......................................................................... 52
List of Figures3
Figure 2-1: The eight NERC regions .................................................................................................. 6
Figure 3-1: Life stages covered by an LCA ...................................................................................... 10
Figure 3-2: LCA phases.................................................................................................................... 11
Figure 4-1: Results for the Human Health, Ecosystem Quality and Climate Change indicators for the generation or purchase, transmission and distribution of 1 kWh of electricity in Québec by the Hydro-Québec main system in 2012 (IMPACT World+ method) ................................................... 17
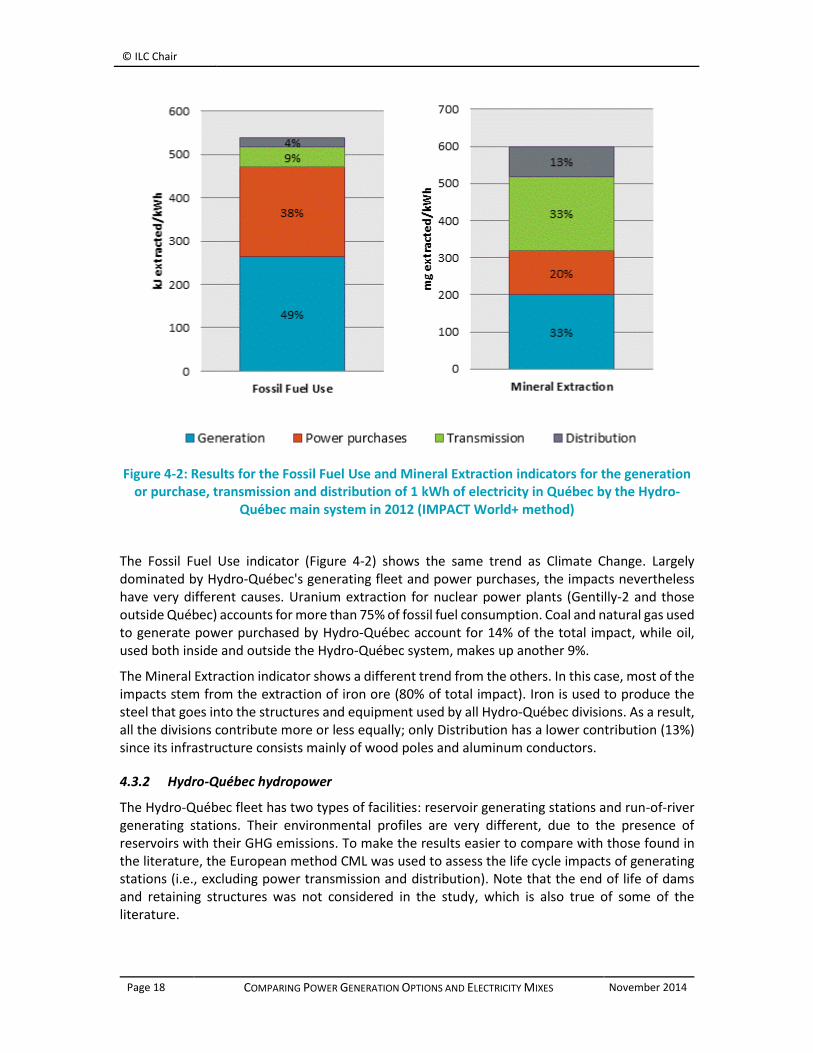
Figure 4-2: Results for the Fossil Fuel Use and Mineral Extraction indicators for the generation or purchase, transmission and distribution of 1 kWh of electricity in Québec by the Hydro-Québec main system in 2012 (IMPACT World+ method) ............................................................................ 18
Figure 4-3: Relative contribution of life cycle stages of Hydro-Québec reservoir generating stations (CML method) ................................................................................................................................. 19
Figure 4-4: Relative contribution of life cycle stages of Hydro-Québec run-of-river generating stations (CML method) ................................................................................................................... 20
3 Because the numbering is different, the comparative datasheets are not included in this list.

© ILC Chair
Page x COMPARING POWER GENERATION OPTIONS AND ELECTRICITY MIXES November 2014
Abbreviations and Acronyms
LCA Life cycle assessment
Bq 14C eq. Becquerel of carbon-14 equivalent
CFC Chlorofluorocarbons
CIRAIG International Reference Centre for the Life Cycle of Products, Processes and Services
CO2 Carbon dioxide
VOCs Volatile organic compounds
DALY Disabled adjusted life years
EPD Environmental product declaration
LCIA Life cycle impact assessment
LCI Life cycle inventory
IPCC Intergovernmental Panel on Climate Change
ISO International Organization for Standardization
kg 1,4-DB eq. Kilogram of dichlorobenzene equivalent
kg CFC-11 eq. Kilogram of trichlorofluoromethane equivalent
kg C2H4 eq. Kilogram of ethylene equivalent
kg C2H3Cl eq. Kilogram of chloroethylene equivalent
kg. CO2 eq. Kilogram of carbon dioxide equivalent
kg PM2,5 Kilogram of fine particles (diameter less than 2.5 micrometres)
kg PO4 eq. Kilogram of phosphate equivalent
kg Sb eq. Kilogram of antimony equivalent
kg SO2 eq. Kilogram of sulphur dioxide equivalent
m² arable eq. Square metre of arable land equivalent
MJ Megajoule of energy
PDF*m²*yr Potentially disappeared fraction of species over a given area and a given time period
GWP Global warming potential
CT Combustion turbine
TEG Triethylene glycol

Hydro-Québec Technical Report
November 2014 COMPARING POWER GENERATION OPTIONS AND ELECTRICITY MIXES Page xi
Country and Region Codes
AB Alberta, Canada NERC North American Electric Reliability Corporation
AR Argentina NH New Hampshire, U.S.A.
AT Austria NL Netherlands
BE Belgium NO Norway
BT Bhutan NPCC Northeast Power Coordinating Council (U.S.A.)
CA Canada NS Nova Scotia, Canada
CH Switzerland NY New York, U.S.A.
CT Connecticut, U.S.A. ON Ontario, Canada
CZ Czech Republic PL Poland
DE Germany PT Portugal
DK Denmark PY Paraguay
EE Estonia QC Québec, Canada
ERCOT Electric Reliability Council of Texas (or TRE) (U.S.A.)
RFC Reliability First Corporation (U.S.A.)
ES Spain RI Rhode Island, U.S.A.
FI Finland RU Russia
FR France SE Sweden
FRCC Florida Reliability Coordinating Council (U.S.A.)
SERC SERC Reliability Corporation (U.S.A.)
GB Great Britain SK Saskatchewan (Canada)
HU Hungary SPP Southwest Power Pool (U.S.A.)
IT Italy TRE Texas Reliability Entity (or ERCOT) (U.S.A.)
MA Massachusetts, U.S.A. TW Taiwan
MB Manitoba, Canada UA Ukraine
ME Maine, U.S.A. UY Uruguay
MRO Midwest Reliability Organization (U.S.A.) VE Venezuela
MX Mexico VT Vermont, U.S.A.
WECC Western Electricity Coordinating Council (U.S.A.)


Hydro-Québec Technical Report
November 2014 COMPARING POWER GENERATION OPTIONS AND ELECTRICITY MIXES Page 1
1 Background
At the request of Hydro-Québec, the International Reference Centre for the Life Cycle of Products, Processes and Services (CIRAIG) conducted a comparative life cycle analysis of the environmental impacts of power generation options, based on publicly accessible data on the various generation options in the world. The electricity mixes4 (or grid mixes) of certain countries, states or provinces were also compared.
This report contains
descriptions of the power generation options available and the electricity mixes found in the compared regions (Chapter 2);
a description of the methodology used and the data consulted (Chapter 3);
a summary of the life cycle assessment of the Hydro-Québec kilowatthour, adapted to facilitate comparison with the published data (Chapter 4); and
datasheets comparing the generation options and electricity mixes according to various environmental indicators (Chapter 5 and Appendix A).
4 In this report, "electricity mix" (sometimes called "power mix" or "grid mix") means all generation options used, i.e., all generating stations in operation within the territory, along with purchases from independent producers and imports from neighboring systems.

© ILC Chair
Page 2 COMPARING POWER GENERATION OPTIONS AND ELECTRICITY MIXES November 2014
2 Description of Generation Options and Electricity Mixes
This chapter describes the main power generation options available and the electricity mixes retained for comparison with that of Québec.
2.1 Power generation options
This study focused on centralized power generation connected to a distribution grid. Off-grid or distributed generation (including customer generation) has been examined in another CIRAIG study for Hydro-Québec5 and is therefore not discussed here.
2.1.1 Renewables
An energy source is said to be renewable if it is naturally replenished at a rate at least equal to its rate of use. This includes biomass, solar (photovoltaic and concentrated), geothermal, moving water (hydraulic) and wind (IPCC, 2011).
Hydropower: In a hydroelectric (or hydraulic) power plant, the kinetic energy of water is converted into mechanical energy and then into electricity. There are two main types of hydroelectric plants:
o A run-of-river generating station is fed directly by a river and has little or no water storage; its capacity therefore varies with the river's flow.
o A reservoir generating station gets its water from an artificial lake created by a dam and sometimes other retaining structures.
The second category includes pumped-storage plants. These have a pumping mode that uses energy from other generating stations to pump water up to a reservoir when demand is low (usually at night) and let it through the turbines during peak periods.
In addition, there are other, less well-known ways to generate power from water:
o Tidal energy is present in the surge of enormous volumes of water as ocean tides rise and fall; the energy is captured by means of a dam built across an estuary. As the tide goes in and out, it drives turbines that generate electricity. Tidal power stations need suitable sites (bays or estuaries) with a large tidal range (Planète énergies, 2013a).
o There are several types of systems for harnessing wave energy, such as onshore or submerged oscillating water columns, tapered channel systems and floating caisson arrays. In all cases, the aim is to drive a turbine that generates electricity (Planète énergies, 2013b).
5 CIRAIG. (2013). ACV des filières de production décentralisée d’énergie électrique à petite échelle. 52 p. and app.; CIRAIG. (2013). ACV des filières de production décentralisée d'énergie thermique à petite échelle. 74 p. and app.

Hydro-Québec Technical Report
November 2014 COMPARING POWER GENERATION OPTIONS AND ELECTRICITY MIXES Page 3
o Osmotic energy uses the salt concentrated in seawater to produce electricity. The key element of this technology is a semi-permeable, double-sided membrane that lets water through but captures mineral salts. The membrane is in contact with freshwater on one side and seawater on the other. The salt molecules attract the freshwater, which migrates to the compartment containing saltwater in a phenomenon called osmosis. The moving water drives a turbine that generates power (Planète énergies, 2013c). This is still an emerging technology.
o Hydrokinetic energy: The flow of rivers and ocean currents is a significant motive force. Experiments are currently focusing on the use of underwater turbines, large propellers or turbines tethered in arrays to the seabed or floating mid-water. At present, this technology is still in the demonstration stage (Planète énergies, 2013e).
Thermal – Biomass: Bioenergy can be produced from various feedstocks, including forest residues, agricultural and livestock waste, short-rotation tree plantations, energy crops, the organic fraction of municipal waste, and any other organic matter. Through several different processes, these raw materials can be used to generate electricity or heat directly, or to produce biofuels in gaseous, liquid or solid form (IPCC, 2011).
The heat capacity of organic matter can be used to generate electricity through thermal processes (pyrolysis, gasification, combustion) or biochemical processes (anaerobic digestion or methanization) (EDF, 2013a).
o Biomass combustion: Combustion processes generally use fibrous biomass (wood residues, bagasse, straw, etc.). In cogeneration, for example, residues serve as boiler feedstock to produce steam and electricity.
o Biogas combustion: Fermentable biomass such as manure, liquid residue and waste is first converted into biogas by micro-organisms. When decomposition takes place in the absence of oxygen, it produces a gas with a composition very close to that of natural gas (primarily methane and carbon dioxide). The gas can then be burned in a thermal power plant or other adapted facility to generate power.
Wind energy: Wind turbines harness the kinetic energy of the wind, which they transmit to a generator to produce electricity. Wind farms can be built on open land or offshore. Their output is intermittent, since it depends on wind speed.
Solar energy: Direct solar energy can be used in two ways to generate electric power (solar thermal, i.e., using the sun's rays as a source of heat, is not considered here):
o In a photovoltaic solar power plant, interconnected solar panels capture the sunlight. Each cell contains a conductive material called silicium, which frees electrons and thus creates a direct current (EDF, 2013b). The output of such a plant is intermittent, since it depends on the amount of sunlight available.
o A concentrated solar power system has thousands of tracking mirrors or lenses to concentrate a large area of sunlight onto a small receiver at the top of a tower. The concentrated light is converted to heat, which drives a steam turbine connected to a generator. This type of solar plant benefits from thermal inertia, which reduces intermittency (EDF, 2012).
Geothermal energy involves extracting heat stored in very deep rock formations (up to a dozen kilometres deep) and converting it to useful electric power and thermal energy. Deep

© ILC Chair
Page 4 COMPARING POWER GENERATION OPTIONS AND ELECTRICITY MIXES November 2014
geothermal is similar to artificially creating a geothermal deposit in a crystalline massif. A few kilometres down, a heat transfer fluid is pressure-injected into the rock. It flows through the cracks and heats up, and the resulting steam is pumped to a heat exchanger for power generation.
2.1.2 Non-renewables
When an energy source cannot be naturally replenished quickly enough to keep pace with its consumption, it is said to be non-renewable. This is the case for fossil fuels—coal, oil and natural gas—as well as nuclear fuel. All of these fuels are used in thermal power plants.
Thermal – Coal: For the purpose of this study, lignite6 is considered to be coal.
Thermal – Natural gas: Some gas-fired plants are "combined cycle" plants, meaning that the combustion turbine (CT) cycle is combined with a heat recovery boiler cycle. Natural gas is combusted in the CT, which generates electricity and produces very hot exhaust fumes. Heat from the fumes is recovered by the boiler to produce steam, and some of the steam is passed through a second turbine to generate more electricity.
Thermal – Blast furnace gas: Gas recovered from blast furnaces during steel manufacture can also be used to generate power, although it does not have as much heating value as natural gas.
Thermal – Oil: In an oil-fired power plant, fuel oil is combusted either in one or more diesel engines that drive the generator directly, or in a conventional boiler that raises steam to drive a turbine which in turn drives the generator.
Thermal – Nuclear: In a nuclear power plant, the nuclear reactor serves as the boiler. Some technologies are based on enriched uranium while others use natural uranium.
To compare the potential environmental impacts of the different types of facilities, the literature on LCAs of centralized generation options was reviewed (see the review in Section 3.2). Note that for some of the options presented above, including osmotic energy and hydrokinetic energy, no LCAs have been published; those options have therefore been excluded from the comparative datasheets in Appendix A.
2.2 Electricity mixes
The electricity distributed to consumers is usually the product of not one but several generation options, corresponding to the output from facilities in operation in the territory along with power imported from neighboring systems. This is called the "electricity mix".
6 A soft coal, usually dark brown, often having a distinct woodlike texture, and intermediate in density and carbon content (65 to 75%) between peat and bituminous coal. (www.dictionary.com/browse/lignite)
Thermal plant
A generating facility that uses the heat given off by combustion of biomass or a fossil fuel (coal, natural
gas, oil) or by nuclear reaction. The heat can be
converted to an intermediary form
(steam, exhaust) or directly into mechanical energy, for example by a
diesel engine.

Hydro-Québec Technical Report
November 2014 COMPARING POWER GENERATION OPTIONS AND ELECTRICITY MIXES Page 5
In this study, the Québec electricity mix was compared with the mixes of neighboring regions or Québec's largest trading partners for which environmental data were available. Several countries whose electricity mixes are often compared with that of Québec were also added to the list.
The compositions of the electricity mixes selected for this exercise were obtained from the ecoinvent v3.0 database7 (ecoinvent Centre, online). They are summarized in Table 2-1 for the Canadian provinces, Table 2-2 for the eight NERC regions,
7 Most of the electricity mix compositions in the ecoinvent v3.0 database are from 2008.

© ILC Chair
Page 6 COMPARING POWER GENERATION OPTIONS AND ELECTRICITY MIXES November 2014
Table 2-3 for the northeastern states (modeled using data from the U.S. Energy Information Administration) and Table 2-4 for other countries. These tables show the breakdown of generation options in 2008 or, in the case of the U.S. Northeast and Québec, in 2012, for the portion of electricity generated in a given region. Imports are indicated separately and may also involve several options or mixes. In the case of the U.S. Northeast (Table 2-3), data on imports from other regions were not available; consequently, only the generation data for each state were analyzed. Lastly, the tables also show the percentage—sometimes approximate—of transmission and distribution losses in each region. This information, obtained through the ecoinvent v3.0 database processes, is based on distribution to the consumer and therefore covers high-, medium- and low-voltage systems.
There are eight NERC regions encompassing Canada, the U.S. and part of Mexico, as shown in Figure 2-1. However, in their electricity mixes (described in Table 2-2), we considered only the U.S. portion and excluded the data for Canadian provinces and Mexico.
Figure 2-1: The eight NERC regions
(Combs, 2008)
For definitions of the country and region codes used, see the list on page xi.

Hydro-Québec Technical Report
November 2014 COMPARING POWER GENERATION OPTIONS AND ELECTRICITY MIXES Page 7
Table 2-1: Composition of electricity mixes for Canadian provinces studied (2008, 2012)
Generation option New
Brunswick
Québec (with
Gentilly-2) Ontario Manitoba
Newfoundland and
Labrador
British Columbia
Coal 36.7% 0.3% 23.7% 0.2% N/A N/A
Oil 15.9% 0.03% 0.2% 0.1% 8.4% 0.1%
Natural gas 6.2% 0.21% 6.7% 0.2% N/A 2.6%
Nuclear 13.8% 2.62% 39.6% N/A N/A N/A
Hydropower 11.9% 95.33% 21.1% 96.6% 91.5% 80.7%
Wind N/A 0.88% 0.2% 0.7% N/A N/A
Biomass N/A 0.53% 1.1% N/A N/A 3.0%
Biogas/Waste N/A 0.09% < 0.1% N/A N/A N/A
Blast furnace gas N/A N/A < 0.1% N/A N/A N/A
Imports and purchases (region
and%)
NS (< 1%) NPCC (3.6%) QC (11.3%)
Included in breakdown
above
MB (0.2%) NPCC (3.9%)
QC (3.1%)
ON (0.3%) SK (1.8%)
MRO (0.2%) QC (0.1%)
AB (0.4%) WECC
(13.2%)
Transmission/distribution losses (low
voltage)* 6.7%* 7.5% 6.7%* 6.7%* 6.7%* 6.7%*
Sources: Québec: Hydro-Québec (Tirado et al., 2014); Other Canadian provinces: ecoinvent v3.0 (2008 data). Due to rounding, figures may not total 100%. Generation options for which N/A is indicated were not included in the modeling.
* In ecoinvent 3.0, transmission and distribution losses for Canadian provinces other than Québec are estimates based on European averages. The Canadian average is higher (8.4%) but has not yet been incorporated into the database.
Table 2-2: Composition of electricity mixes of NERC regions (U.S. portion only) (2008)
Generation option
NPCC RFC SERC FRCC MRO SPP ERCOT /
TRE WECC
Coal 9.3% 60.5% 50.2% 24.0% 69.0% 61.0% 32.8% 28.4%
Oil 1.6% 0.5% 0.7% 4.5% 0.4% 0.2% 1.0% 0.5%
Natural gas 33.2% 8.0% 16.9% 55.6% 2.7% 25.6% 47.5% 31.7%
Nuclear 27.1% 28.5% 26.6% 14.2% 10.6% 4.3% 12.2% 9.4%
Hydropower 12.1% 0.8% 3.8% < 0.1% 4.1% 3.8% 0.2% 22.5%
Wind 0.8% 0.7% 0.1% N/A 7.0% 4.3% 5.8% 3.0%
Biomass 3.2% 0.9% 1.8% 1.8% 1.5% 0.8% 0.1% 1.3%
Biogas/Waste N/A N/A N/A N/A N/A N/A N/A N/A
Blast furnace gas N/A N/A N/A N/A N/A N/A N/A N/A
Imports and purchases
NB (0.5%) NS (< 0.1%) ON (6.3%) QC (5.9%)
N/A N/A N/A MX (4.5%) SK (0.1%)
N/A MX (0.4%) BC (1.1%)
Transmission/distribution losses (low voltage)*
5.9% 5.9% 5.9% 5.9% 5.9% 5.9% 5.9% 5.9%
Source: ecoinvent v3.0. Due to rounding, figures may not total 100%. Generation options for which N/A is indicated were not included in the modeling.
* Losses are estimates based on the national average (ecoinvent 3.0).

© ILC Chair
Page 8 COMPARING POWER GENERATION OPTIONS AND ELECTRICITY MIXES November 2014
Table 2-3: Composition of electricity mixes in the U.S. Northeast and Québec (Hydro-Québec) in 2012
Generation option
CT MA ME NH NY RI VT Hydro-Québec
Production
Coal 1.81% 5.90% 0.31% 6.58% 3.35% N/A N/A N/A
Oil 0.31% 0.48% 0.58% 0.11% 0.43% 0.22% 0.05% 0.2%
Natural gas 45.79% 68.16% 41.89% 36.59% 43.80% 98.51% 0.04% N/A
Nuclear 47.28% 16.19% < 0.1% 42.51% 30.03% N/A 75.95% 2.3%
Hydropower 0.86% 2.52% 25.87% 6.69% 18.16% 0.05% 16.88% 97.6%
Wind N/A 0.25% 6.15% 1.08% 2.20% 0.02% 1.63% N/A
Biomass 1.85% 4.76% 22.26% 6.09% 1.58% 1.21% 5.38% N/A
Biogas/Waste N/A N/A N/A N/A N/A N/A N/A N/A
Blast furnace gas
N/A N/A N/A N/A N/A N/A N/A N/A
Other 2.09% 2.59% 2.94% 0.34% 0.75% N/A 0.08% N/A
Imports and purchases
Excluded Excluded Excluded Excluded Excluded Excluded Excluded Excluded
Transmission losses*
3.2% 3.2% 3.2% 3.2% 3.2% 3.2% 3.2% 5.4%
Source: US EIA (http://www.eia.gov/electricity/data/state/). Generation options for which N/A is indicated were not included in the modeling. These electricity mixes do not include imports and purchases, only power generated within the state.
For Hydro-Québec Production: Hydro-Québec, 20128 * Losses are estimates based on the national average (ecoinvent 3.0).
8 These data do not always cover the same options as the data of Tirado et al. (2014), owing to differences in how the
system is defined. In the case of the kWh analysis, Hydro-Québec's thermal generating stations were excluded in light of their negligible contribution to the company's total output.

Hydro-Québec Technical Report
November 2014 COMPARING POWER GENERATION OPTIONS AND ELECTRICITY MIXES Page 9
Table 2-4: Composition of electricity mixes of various countries (2008)
Generation option
Germany Brazil China Denmark Spain U.S.A. Finland France India Mexico Russia Norway Portugal Sweden
Coal 41.60% 1.60% 76.80% 34.70% 15.20% 44.41% 14.30% 4.20% 67.20% 8.10% 16.50% < 0.1% 19.3% 0.40%
Oil 1.40% 3.30% 0.70% 2.20% 5.60% 0.86% 0.40% 1.00% 4.00% 18.80% 1.60% < 0.1% 7.1% 0.50%
Natural gas 12.30% 5.50% 0.90% 13.80% 37.80% 22.90% 11.70% 3.80% 9.60% 50.00% 47.60% 0.29% 26.2% 0.40%
Nuclear 22.70% 2.60% 2.10% N/A 18.60% 19.82% 23.80% 75.40% 1.70% 3.80% 16.00% N/A N/A 38.10%
Hydropower 4.30% 72.00% 18.60% 0.10% 8.70% 6.63% 18.70% 10.80% 14.30% 15.90% 17.30% 96.59% 13.3% 43.50%
Wind 6.50% 0.10% 0.40% 14.40% 10.70% 1.89% 0.30% 1.10% 1.70% 0.10% < 0.1% 0.63% 10.5% 1.30%
Biomass 1.30% 5.70% 0.10% 3.60% 0.60% 1.34% 10.50% 0.30% 0.20% 0.30% < 0.1% 0.21% 2.6% 5.40%
Biogas/Waste 3.00% N/A N/A 4.20% 0.70% N/A 0.60% 0.80% N/A < 0.1% 0.20% < 0.1% 1.1% 1.40%
Blast furnace gas
1.10% 0.80% 0.40% N/A 0.30% 0.37% 0.60% 0.50% N/A 2.90% 0.40% < 0.1% 0.3% 0.60%
Peat N/A N/A N/A N/A N/A N/A N/A N/A N/A N/A N/A N/A N/A 0.40%
Other N/A N/A N/A N/A N/A N/A N/A N/A N/A N/A N/A N/A N/A N/A
Imports and purchases
AT (1.1%)
DK (1.5%)
CZ (1.3%)
FR (1.7%)
NL (0.1%)
PL (<0.1%)
PY (5.2%)
AR (2.4%)
VE (0.5%)
UY (0.3%)
TW (0.1%)
SE (14.0%)
NO (10%)
DE (2.9%)
FR (1.5%)
PT (0.4%)
CA (1.29%)
MX
(<0.1%)
RU (12.0%)
SE (3.1%)
EE (2.5%)
HU (1.3%)
NO (0.2%)
CH (0.7%)
BE (0.4%)
ES (0.3%)
DE (0.2%)
GB (0.2%)
IT (0.2%)
BT (1.2%) TRE (0.1%) UA (0.3%)
SE (1.68%)
DK (0.3%)
NL (0.23%)
RU (0.12%)
FI (<0.1%)
ES (19.7%)
NO (4.8%)
FI (2.0%)
DK (0.9%)
DE (0.3%)
PL (0.1%)
Transmission/distribution
losses (low voltage)
4.9% 14.0% 5.6% 6.1% 5.0% 5.9% 3.7% 6.1% 13.1% 15.4% 2.7% 7.6% 7.4% 7.2%
Source: ecoinvent v3.0. Due to rounding, figures may not total 100%. Generation options for which N/A is indicated were not included in the modeling.

© ILC Chair
Page 10 COMPARING POWER GENERATION OPTIONS AND ELECTRICITY MIXES November 2014
3 Methodology
In this chapter, we explain the life cycle assessment and its indicators. We also present the bibliographic research that led to the compilation of the environmental data used to compare generation options and electricity mixes.
3.1 Life cycle assessment
A life cycle assessment (LCA), or environmental balance sheet, consists in evaluating the environmental impacts of a product or service—sometimes referred to as a "product system"— over its entire life cycle, from resource extraction to manufacture, packaging, distribution and consumption to disposal (including re-use and recycling if applicable), as shown in Figure 3-1. This makes it one of the most comprehensive, effective tools for evaluating the environmental impacts of a product or service, e.g., "supplying electricity".
Figure 3-1: Life stages covered by an LCA

Hydro-Québec Technical Report
November 2014 COMPARING POWER GENERATION OPTIONS AND ELECTRICITY MIXES Page 11
Each stage in a product's life cycle consumes resources—which may be renewable (e.g., hydropower, wood, water) or non-renewable (e.g., oil, natural gas, metal)—and generates emissions such as greenhouse gases, waste and effluent. The impacts of resource consumption and emissions may be global (climate change, ozone layer depletion), regional (acidification and eutrophication of lakes and streams,9 smog) or local (human and environmental toxicity10). The LCA combines data gathered for a specific study (primary data) with generic data obtained from databases (secondary data). Taken together, the results constitute a set of estimated potential impacts.
For companies, product designers and governments, the LCA is, above all, an important tool for making socially responsible decisions. Governed by the ISO 14040 series of standards,11 it is a rigorous method consisting of four separate phases involving the identification and quantification of inputs and outputs associated with the product or service, as well as assessing the potential impacts of these flows of material and energy.
3.1.1 Impact assessment methods
Impact assessment consists in inventorying material and energy inputs and outputs over a product's life cycle and using models to translate them into potential environmental impacts, as shown in Figure 3-2.
Figure 3-2: LCA phases
9 Acidification occurs when CO2 and other sulphurous or nitrous compounds previously emitted into the atmosphere are absorbed by a body of water. This alters the pH, which degrades all the ecosystem services. Eutrophication refers to the pollution of an aquatic environment through the excessive addition of nutrients, which promote algae overproduction and ultimately damage the aquatic ecosystem by reducing sunlight and depleting the available oxygen. 10 Impact of substances with a toxic effect on ecosystems. 11 ISO 14040:2006 describes the principles and framework for life cycle assessments and life cycle inventories. More information at www.iso.org/iso/catalogue_detail?csnumber=37456.

© ILC Chair
Page 12 COMPARING POWER GENERATION OPTIONS AND ELECTRICITY MIXES November 2014
Environmental indicators can be of two types, depending on whether the cause-and-effect modeling method is problem-oriented or damage-oriented. Some methods of Life Cycle Impact Assessment (LCIA) use both approaches (Table 3-1).
Problem-oriented (or "midpoint") methods stop at the primary effects arising as a direct result of the activities studied; for example, chlorofluorocarbide (CFC) emissions and their negative impacts on the ozone layer.
Damage-oriented (or "endpoint") methods, on the other hand, seek to categorize environmental impacts according to their consequences identified as far as possible down the chain of cause and effect. In other words, they try to take secondary impacts into account. For example, rather than simply studying emissions of ozone-depleting substances such as CFCs, an endpoint method will attempt to quantify the potential impacts of ozone depletion on human health (cancer, cataracts, etc.). Such methods are therefore better at identifying potential impacts, but it can be difficult to follow the chain of cause and effect, especially when causality has not been clearly established.
Table 3-1: Impact assessment methods
Name Problem-oriented
or damage-oriented
Geographical context
Number of impact
categories Reference
EcoIndicator 99 Damage Europe 12 Goedkoop et al., 2001
CML Problem Europe 10 Guinée et al., 2002
EDIP 2003 Problem Europe 8 Hauschild et al., 2003
TRACI Problem U.S.A. 9 Bare et al., 2002
LIME Both Japan 11 Hayashi et al. 2004
LEO-SCS-002 Problem U.S.A. 25 Leonardo Academy, 2012
IMPACT 2002+ Both Europe 12 Jolliet et al. 2003
ReCiPe Both Europe 15 Goedkoop et al., 2009
IMPACT World+ Both World,
continents 18 www.impactworldplus.org
3.1.2 Environmental indicators
The impact categories, or midpoints and endpoints—which we will refer to as environmental indicators in the interest of simplicity—vary from one LCIA method to the next. An LCIA will typically cover about 15 indicators. For illustration purposes, Table 3-2 lists the indicators found in CML and IMPACT 2002+, which are the methods most widely cited in the literature.
IMPACT World+, mentioned in Table 3-1, is the most recent method, officially available since May 2013. It is not yet fully documented, and not all LCA software programs have incorporated it into their platforms yet, but it takes advantage of the latest advances in environmental modeling. In addition, it offers many scientific innovations and includes new impact categories of interest, such as water use.

Hydro-Québec Technical Report
November 2014 COMPARING POWER GENERATION OPTIONS AND ELECTRICITY MIXES Page 13
Table 3-2: Environmental indicators used in CML and IMPACT 2002+ Indicator – Damage category (IMPACT 2002+)
Indicator – Midpoint
Unit of measure
Remarks
IMPACT 2002+ CML
Climate change (kg CO2 eq.)
Global warming potential (GWP)
kg CO2 eq. Global impact. IPCC models and factors are used in all methods. IMPACT 2002+ uses a 500-year time
horizon, while other methods use a 100-year horizon.
Human health (DALY)
Human toxicity N/A kg 1,4-DB eq. Local to global impact. Effects of toxic substances on the human environment.
Respiratory effects (organic/inorganic)
kg C2H4 eq. / kg PM2,5
N/A Local impact. "Inorganic" (winter smog): caused by fine particles (< 2.5 µm). "Organic": caused by
volatile organic compounds (VOCs)
Carcinogens/ Non-carcinogens
kg C2H3Cl eq. N/A Local impact of carcinogenic and non-carcinogenic substances on human health.
Ionizing radiation Bq 14C eq. N/A Local impact caused by radiation-emitting substances.
Ecosystem quality (PDF*m²*yr)
Acidification kg SO2 eq. Regional impact. Applies to aquatic environments but may also include terrestrial environments,
depending on the method.
Eutrophication kg PO4--eq. Regional impact. Caused by an imbalance of nutrients in aquatic ecosystems.
Ozone layer depletion kg CFC-11 eq. Global impact. Reduction of the stratospheric ozone layer and increase in UV rays reaching the earth.
Photochemical oxidation (smog)
kg C2H4 eq. Regional impact. Summer smog caused by ozone buildup in the troposphere, mainly due to VOC
emissions.
Aquatic/terrestrial ecotoxicity (seawater and freshwater)
kg TEG ground/water
kg 1,4-DB eq. Local impact. Effects of toxic substances on ecosystem biodiversity. Different methods use different
models and measurement units for this indicator.
Land use m² arable eq. N/A Regional impact. Loss of biodiversity due to human land use.
Resources (MJ)
Non-renewable energy MJ Global impact. Measures the quantity of energy extracted in the form of fossil fuels or uranium.
Mineral extraction/ Abiotic resource depletion
additional MJ kg Sb eq. Global impact. CML and Impact 2002+ use different models and measurement units for this indicator. "Mineral extraction" (IMPACT 2002+) refers to the additional energy needed to extract minerals from
low-grade deposits. CML assesses the extraction rate and rarity of each mineral.

© ILC Chair
Page 14 COMPARING POWER GENERATION OPTIONS AND ELECTRICITY MIXES November 2014
Section 5.1 explains the environmental indicators used in this study to compare generation options and electricity mixes. Note that some of the indicators seen in impact assessment methods do not appear in the comparative datasheets on generation options; this is because our bibliographic review found few or no occurrences of them.
3.2 Bibliographic review
The aim of the bibliographic review was to extract the results of generation option LCAs published since 2007.
In the end, 67 articles served to compile over 1,000 data elements covering a dozen generation options and more than 20 environmental indicators of various kinds.
Section 5.2 contains a table summarizing the articles retained, while Appendix C describes the approach for conducting the research.

Hydro-Québec Technical Report
November 2014 COMPARING POWER GENERATION OPTIONS AND ELECTRICITY MIXES Page 15
4 Hydro-Québec kWh Life Cycle Assessment
Hydro-Québec has been using LCAs for several years to evaluate products and services. In 2014, the company mandated CIRAIG to conduct an LCA of electric power generation, transmission and distribution in Québec. CIRAIG adopted the European method IMPACT 2002+ (Jolliet et al., 2003) for the study. New results have been produced with the method IMPACT World+ so that electricity mixes can be compared using the most up-to-date tools available. In addition, in order to compare the impacts of Hydro-Québec hydropower with those of other generation options found in the literature, new results have been produced using the CML method.
In this chapter we present the results of the 2014 LCA, adapted to IMPACT World+ and CML. It was these results that served as the basis for the profile of Hydro-Québec's hydropower options (reservoir and run-of-river) and of the Québec electricity mix in the comparative datasheets in Appendix A.
4.1 Phase 1: Definition of system studied
The LCA studied "the generation or purchase, transmission and distribution of 1 kWh of electricity in Québec through Hydro-Québec's main power system in 2012".
The generation (or purchase), transmission and distribution of electricity by Hydro-Québec involves a variety of infrastructure and activities located throughout the province and in adjacent areas.
Generation
Most of the electricity generated by Hydro-Québec's main power system is from hydropower plants (close to 97% of total output in 2012). The company has two types of hydropower plants: run-of-river (38) and reservoir (20), accounting for 37% and 63%, respectively, of installed capacity. Until December 28, 2012, the company also operated a nuclear power plant, Gentilly-2. Since it generated 2.3% of total output in 2012, it was included in the study. Other Hydro-Québec generating facilities were, however, excluded because they were no longer in operation (e.g., Cap-Chat wind farm, shut down in 2008, and Tracy conventional oil-fired generating station, shut down in 2011), or their output was not significant and their contribution to environmental impacts was therefore deemed negligible (Bécancour, La Citière and Cadillac gas turbine generating stations, accounting for 0.2% of total output).
Purchases
In addition to generating power, Hydro-Québec also makes purchases from independent producers in the province (mainly small hydropower, biomass and wind energy) and from neighboring systems in adjacent provinces and the U.S. Northeast. Power purchases account for nearly 20% of the electricity sold by Hydro-Québec: Churchill Falls, in Newfoundland and Labrador, is the largest source (71% of all Hydro-Québec power purchases), followed by non-utility hydropower in Québec (14%), thermal (nuclear, natural gas, coal and oil)(7%), wind (4%) and biomass (3%).
Transmission
Power from the generating facilities is brought to the load centres by the transmission system, operated by the division Hydro-Québec TransÉnergie. There are two components to the

© ILC Chair
Page 16 COMPARING POWER GENERATION OPTIONS AND ELECTRICITY MIXES November 2014
transmission system: lines and substations. Lines are made up of support structures (towers), equipment and conductors. Substations operating at various voltages perform switching operations, or they maintain or transform the voltage. In 2012, the transmission system had 33,911 km of lines and 516 transformer substations.
Distribution
The distribution system, operated by the division Hydro-Québec Distribution, comprises all the facilities designed to distribute power, from the transformer substations in the transmission system to the customer connection points.Most of the distribution system is overhead (more than 2,700,000 poles and 114,649 km of lines) but some is underground (3,900 km).
4.2 Phase 2: Life cycle inventory (data collection)
To gather all the information needed for the LCA, data were collected through sampling in close collaboration with Hydro-Québec. Given the scope of the system studied, a representative sample of the various activites of each division was first defined. Primary data (obtained directly from Hydro-Québec and its suppliers) were collected for this sample and extrapolated to cover the rest of the power system. Secondary data and assumptions (from the literature, expert opinions, etc.) were gathered to complete the data collection.
The primary data from Hydro-Québec and its suppliers had to do with the construction and operation of generating stations (products used to run them, fuels, emissions, etc.), transformer substations and transmission and distribution lines, as well as quantities of power generated, purchased and lost in transmission and distribution. The information was gathered by means of electronic questionnaires sent to experts in each division and meetings with environment advisors, then rounded out during field visits.
The secondary data, which served to complement the information supplied by the Hydro-Québec divisions, consisted of the ecoinvent database, the CIRAIG in-house database, available public databases, a literature review and the contributions of a number of experts.
4.3 Phase 3: Life cycle impact assessment (results)
4.3.1 Québec electricity mix
The life cycle impacts presented in this section were assessed using the most recent method, IMPACT World+ v1.0. In this method, impacts are assessed according to specific environmental issues (climate change, resource depletion, aquatic acidification, land use and transformation, etc.), then grouped into two damage categories (Human Health and Ecosystem Quality). This makes it easier to understand the results, and the main contributors to the environmental issues can be quickly identified. Two midpoint indicators are presented separately: Abiotic depletion (divided into Mineral Resources and Fossil Fuels) and Climate Change, since they are key issues in power generation. The figures below summarize the results according to the indicators selected.12
12 Note that in the LCA method used, the Human Health and Ecosystem Quality indicators include potential impacts linked to water use. However, because the ecoinvent v2.2 database used to model the life cycle is not fully adapted to assess water flows, this introduces an unquantified uncertainty into the results.

Hydro-Québec Technical Report
November 2014 COMPARING POWER GENERATION OPTIONS AND ELECTRICITY MIXES Page 17
Figure 4-1: Results for the Human Health, Ecosystem Quality and Climate Change indicators
for the generation or purchase, transmission and distribution of 1 kWh of electricity in Québec by the Hydro-Québec main system in 2012 (IMPACT World+ method)
In IMPACT World+, the effects of climate change on human health and ecosystems are covered by the indicators Human Health and Ecosystem Quality. Since the effects of global warming are predominant, the environmental profiles for the three indicators in Figure 4-1 are very similar, that is, the contributions of the three Hydro-Québec divisions and power purchases are more or less the same.
For these three indicators, the impacts of the distributed kWh are dominated by Hydro-Québec's generating fleet and power purchases. In terms of generation, the potential impacts stem mainly from CO2 emitted by reservoir hydropower stations and, to a lesser extent, from the production of materials used to build dams and associated infrastructure. As for power purchases, although they account for only 20% of the electricity brought onto the grid, they are responsible for 37% of total GHG emissions. This is because, even though only 7% of power purchases come from fossil-fuel-fired plants, the profile is strongly affected because such facilities have very high emissions levels. Emissions attributable to the transmission and distribution grids stem mainly from transmission and distribution losses, construction of infrastructure (transformer substations and transformers) and fuel consumption during grid operation (service vehicles).
© ILC Chair
Page 18 COMPARING POWER GENERATION OPTIONS AND ELECTRICITY MIXES November 2014
Figure 4-2: Results for the Fossil Fuel Use and Mineral Extraction indicators for the generation
or purchase, transmission and distribution of 1 kWh of electricity in Québec by the Hydro-Québec main system in 2012 (IMPACT World+ method)
The Fossil Fuel Use indicator (Figure 4-2) shows the same trend as Climate Change. Largely dominated by Hydro-Québec's generating fleet and power purchases, the impacts nevertheless have very different causes. Uranium extraction for nuclear power plants (Gentilly-2 and those outside Québec) accounts for more than 75% of fossil fuel consumption. Coal and natural gas used to generate power purchased by Hydro-Québec account for 14% of the total impact, while oil, used both inside and outside the Hydro-Québec system, makes up another 9%.
The Mineral Extraction indicator shows a different trend from the others. In this case, most of the impacts stem from the extraction of iron ore (80% of total impact). Iron is used to produce the steel that goes into the structures and equipment used by all Hydro-Québec divisions. As a result, all the divisions contribute more or less equally; only Distribution has a lower contribution (13%) since its infrastructure consists mainly of wood poles and aluminum conductors.
4.3.2 Hydro-Québec hydropower
The Hydro-Québec fleet has two types of facilities: reservoir generating stations and run-of-river generating stations. Their environmental profiles are very different, due to the presence of reservoirs with their GHG emissions. To make the results easier to compare with those found in the literature, the European method CML was used to assess the life cycle impacts of generating stations (i.e., excluding power transmission and distribution). Note that the end of life of dams and retaining structures was not considered in the study, which is also true of some of the literature.

Hydro-Québec Technical Report
November 2014 COMPARING POWER GENERATION OPTIONS AND ELECTRICITY MIXES Page 19
Figure 4-3 shows the results for the indicators in the CML 2001 method for reservoir generating stations. They are shown as the relative contribution of each life cycle stage (generating station construction, construction of associated structures, and operation). Generally speaking, construction of the generating station and associated structures seems to be the main source of impacts, with contributions of over 65% for all indicators except Mineral Extraction and Climate Change. Material production and transportation, along with construction of generating stations and retaining structures, are the leading sources of impact for all indicators where infrastructure construction dominates. In the case of Mineral Extraction, most of the impacts can be attributed to metals such as cadmium, which is used to build equipment for generating station operation (batteries, capacitors, etc.). The Climate Change indicator, for its part, is dominated by CO2 emissions, which occur mainly in the first ten years after reservoir impoundment; this is why the operation stage is the prevailing factor, with a contribution of more than 80%.
Figure 4-3: Relative contribution of life cycle stages of Hydro-Québec reservoir generating
stations (CML method)
Figure 4-4 shows the results for the indicators in the CML 2001 method for run-of-river generating stations. As in Figure 4-3, they are shown as the relative contribution of each life cycle stage (generating station construction, construction of associated structures (dikes and dams), and operation). Generally speaking, the contributions are similar to those for reservoir generating stations, except for the indicator Climate Change. Because there are no reservoirs to emit CO2, the operation stage has a much lower contribution in this respect, leaving the two construction stages as the main contributors to Climate Change and all other indicators except Mineral Extraction. For the latter, most of the impacts stem, once again, from the metals used to manufacture the equipment required for generating station operation.

© ILC Chair
Page 20 COMPARING POWER GENERATION OPTIONS AND ELECTRICITY MIXES November 2014
Figure 4-4: Relative contribution of life cycle stages of Hydro-Québec run-of-river generating
stations (CML method)

Hydro-Québec Technical Report
November 2014 COMPARING POWER GENERATION OPTIONS AND ELECTRICITY MIXES Page 21
5 Presentation of Comparative Datasheets
This chapter explains the datasheets comparing the environmental impacts of the generation options and electricity mixes found in certain regions (countries, states or provinces) according to a life cycle approach.
For the purpose of this study, we selected the power generation options for which there were recent published LCA data (2007 or later) representative of the North American context or similar climates.
The electricity mixes were obtained from the ecoinvent v3.0 database or the U.S. Energy Information Administration database. They show the percentage of each generation option that made up the region's electricity mix in 2008 or 2012 (most recent data available).
Datasheets comparing generation options and electricity mixes according to environmental indicators are presented in Appendix A.
Note that the comparative datasheets were designed to be consulted independently; consequently, some text is repeated in each datasheet to ensure that the reader has all the information needed to understand the results.
5.1 Environmental indicators selected for comparison
We selected seven indicators for which sufficient data were available in the literature:
1. Climate Change: Warming potential of life cycle emissions of GHGs. 2. Ozone Layer Depletion: Life cycle emissions of ozone-depleting substances. 3. Acidification: Life cycle emissions of acidifying substances. 4. Eutrophication: Life cycle emissions of nutrients causing imbalance and degradation of
aquatic environments. 5. Human Toxicity: Life cycle emissions of toxic substances. 6. Resource Depletion: Life cycle use of non-renewable (fossil or mineral) resources. The
surveyed articles used different methods to measure mineral extraction, yielding results that cannot be integrated. Consequently, only articles based on the CML method were included in this datasheet.
7. Photochemical Oxidation (smog): Life cycle emissions of substances contributing to the formation of tropospheric ozone (summer smog).
Each indicator is described in greater detail in its datasheet. Note that a large majority of the studies adopted the CML method to quantify environmental indicators.13 Although CML is not the most recent impact assessment method (see 3.1.1), it was used to analyze Hydro-Québec hydropower and the generation options available in the ecoinvent v2.2 database (CML Baseline, April 2013 version) so as to produce indicator results comparable to those in the literature.
Note that there are also indicators for substance ecotoxicity. The literature yielded a sufficient number of occurrences, but the current quantification methods produce unreliable results due to
13 CML is also used to create environmental product declarations (EPDs) (www.environdec.com/en/The-International-EPD-
System/General-Programme-Instructions/Characterisation-factors-for-default-impact-assessment-categories/)

© ILC Chair
Page 22 COMPARING POWER GENERATION OPTIONS AND ELECTRICITY MIXES November 2014
deficient characterization of the impact of metals in the environment. Ecotoxicity indicators were therefore excluded from this comparative analysis, as recommended by a group of experts in the field (Aboussouan et al., 2004).
Electricity mixes were compared on the basis of data available in the ecoinvent v3.0 database, as mentioned previously, using the most recent method, i.e., IMPACT World+ v1.0. Four indicators were retained:
1. Climate Change: A midpoint indicator that measures the warming potential of life cycle GHG emissions.
2. Human Health: A damage-oriented indicator grouping together a number of impact categories with potential effects on human health, including global warming as presented in the Climate Change datasheet. The other categories making up this indicator are water use, respiratory effects of organic and inorganic substances, carcinogenic and non-carcinogenic substances, ionizing radiation and ozone layer depletion.
3. Ecosystem Quality: A damage-oriented indicator grouping together a number of impact categories with potential effects on ecosystems, including global warming as presented in the Climate Change datasheet. The other categories making up this indicator are acidification of aquatic (marine or freshwater) and terrestrial environments, eutrophication (marine or freshwater), freshwater ecotoxicity, land use, water use, thermal pollution and ionizing radiation.
4. Resource Depletion: A midpoint indicator that measures life cycle use of non-renewable (fossil or mineral) resources.
As soon as possible, the option and electricity mix comparisons were grouped together into common datasheets. Nine comparative datasheets, listed in Table 5-1, are presented in Appendix A.
Table 5-1: List of comparative datasheets of generation options and electricity mixes
Datasheet Comparison of power generation
options Comparison of electricity mixes
LCI Database ecoinvent 2.2 ecoinvent 3.01
LCIA Method CML V3.01 IMPACT WORLD+
Climate Change X X
Ozone Layer Depletion X
Acidification X
Eutrophication X
Human Toxicity X
Photochemical Oxidation (smog) X
Resource Depletion X X
Human Health X
Ecosystem Quality X

Hydro-Québec Technical Report
November 2014 COMPARING POWER GENERATION OPTIONS AND ELECTRICITY MIXES Page 23
5.2 Comparison of power generation options
The references used to quantify the potential environmental impacts of generation options are listed in Table 5-2.
Each datasheet presents the results for a specific environmental indicator, with a bar chart summarizing the information gathered from the literature. For each available option, the indicator median14 per kWh of electricity is shown, and variability within a given option is illustrated by means of uncertainty bars indicating the range of values reported in the references (minimum to maximum). The bar chart is accompanied by a table providing other statistics (average, number of points for each option, maximum and minimum values).
Variability depends on several factors, including:
Technology: Different technologies are available within a given option. For instance, gas-fired plants can be single-cycle or combined-cycle, and may or may not have a CO2 capture system15
(rare today). Wind farms, solar farms, biomass plants and nuclear plants can also employ a variety of technologies. Biogas can be generated through methanization of different feedstocks (agricultural residues, municipal waste, etc.) by means of various technologies.
Fuel: Some coal-fired plants burn anthracite, or hard coal, while others burn lignite. Biomass plants, too, can use several types of feedstock (various tree species, agricultural residues, etc.). When fuel heating values and compositions are different, the emissions given off in the generation of a kWh also change.
Cogeneration: Some options—in particular, thermal plants fueled by hydrocarbons or biomass—can generate heat or steam along with electric power. In that case, only a portion of the total environmental impacts should be assigned to power generation. The method used to calculate this portion will affect the results, especially in the case of coal- and biomass-fueled generation, where the technologies generating the coproducts present lower indicator results than the average for their respective options.
Year: Vattenfall, a major European energy company, publishes up-to-date EPDs on the output from its generating facilities. It can be seen that the data for a given facility vary from one year to the next (see for example Vattenfall, 2010 and 2013a).16 Since the data compared in the datasheets were taken from references dating anywhere between 2007 and 2014, it follows that some of the variability is attributable to the year used in the analysis.
IA method: As explained in 3.1.1, there are several different LCIA methods using models to translate emissions into potential environmental impacts. The indicators compared in the datasheets sometimes come from studies based on different methods, which causes variability in the results. The choice of software may also affect results.
Fuel source: Each study comes with its specific considerations used to model power generation. For certain indicators, the results are affected when distance and the means
14 The median is the value separating the higher half of a data sample from the lower half. We chose to use the median rather than the average because it is less influenced by extreme values.
15 In the case of natural gas, combined-cycle plants generally have lower impacts than conventional plants, mainly because they are more efficient. Carbon capture systems (sometimes found in gas- and coal-fired plants) reduce CO2 emissions but also increase fuel consumption and the emission of other substances because they involve an additional processing stage.
16 Where several results are for the same generating station, only the most recent data were used in the compilation.

© ILC Chair
Page 24 COMPARING POWER GENERATION OPTIONS AND ELECTRICITY MIXES November 2014
used to transport fuels from their place of extraction or production to the generating station are factored in. Origin (country or region) also influences the impacts attributable to fuel supply, due to the wide range of extraction and processing technologies.
Exhaustiveness of inventory: The list of materials consumed and substances emitted in infrastructure construction and operation is not always as complete in one study as in the next; this results in impacts that vary from one article to the next. This applies in particular to reservoir GHG emissions, which have not been taken into account in some studies.
Number of studies available: In some cases, only one source was available to characterize an option for a given indicator; consequently, the datasheet contains no uncertainty bars.
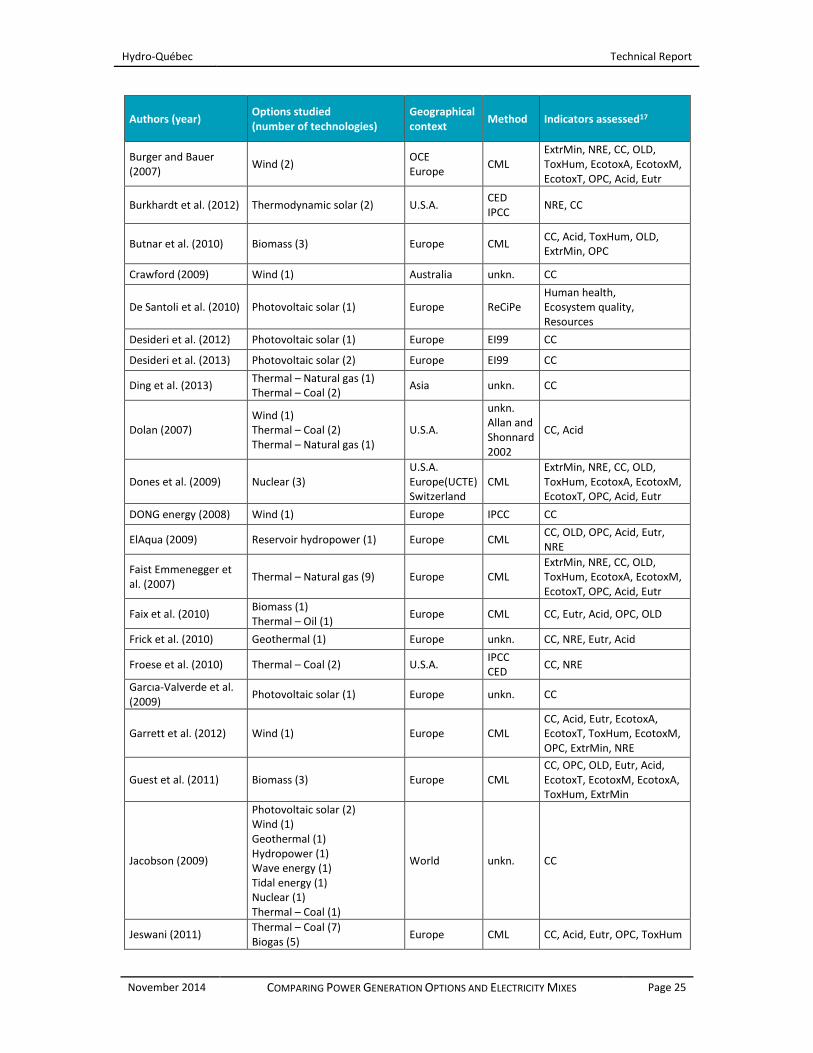
Table 5-2: References used to quantify potential environmental impacts of generation options
Authors (year) Options studied (number of technologies)
Geographical context
Method Indicators assessed17
Ardente et al. (2008) Wind (1) Europe CML CC, OLD, OPC
Arnoy et al. (2013) Run-of-river hydropower (1) Europe CML CC, OLD, Acid, Eutr, OPC
Axpo New Energies (2008)
Biogas (1) Europe CML CC, OLD, OPC, Acid, Eutr, NRE
Axpo (2010) Reservoir hydropower (1) Europe CML CC, OLD, OPC, Acid, Eutr, NRE
Axpo (2011) Biogas (1) Europe CML CC, OLD, OPC, Acid, Eutr, NRE
Axpo (2012) Run-of-river hydropower (1) Europe CML CC, OLD, OPC, Acid, Eutr, NRE
Axpo Nuclear Energy (2011)
Nuclear (1) Europe CML CC, OLD, OPC, Acid, Eutr, NRE
Badea et al. (2010) Thermal – Coal (1) Thermal – Natural gas (1) Nuclear (1)
Europe CML CC, ExtrMin, Acid, OPC, Eutr
Bauer (2007) Biomass (4), energy/exergy allocation
Switzerland CML ExtrMin, NRE, CC, OLD, ToxHum, EcotoxA, EcotoxM, EcotoxT, OPC, Acid, Eutr
Beerten et al. (2009) Nuclear (3) Europe Oceania
IPCC CC
Bellerive (2009) Thermal – Natural gas (2) Thermal – Coal (2)
Europe IMPACT 2002+
CC, OLD, Acid, LU, NRE, ExtrMin, Cancer, Non-Cancer, Resp., EcotoxA, EcotoxT, Eutr, Rad
Bolliger et al. (2007) Run-of-river hydropower (1) Reservoir hydropower (2)
Europe CML ExtrMin, NRE, CC, OLD, ToxHum, EcotoxA, EcotoxM, EcotoxT, OPC, Acid, Eutr
17 CC: Climate Change OLD: Ozone layer depletion NRE: Non-renewable energy PCOP: Photochemical oxidation potential ToxHum: Human toxicity potential Acid: Acidification Eutr: Eutrophication LU: Land use ExtrMin: Mineral extraction Cancer: Carcinogenic effects Non-Cancer: Non-carcinogenic effects Resp.: Respiratory effects EcotoxA: Aquatic ecotoxicity potential EcotoxT: Terrestrial ecotoxicity potential EcotoxM: Marine ecotoxicity potential Rad: Ionizing radiation Human health: (damage-oriented approach) Ecosystem quality: (damage-oriented approach) Resources: Resource consumption (damage-oriented approach)
Hydro-Québec Technical Report
November 2014 COMPARING POWER GENERATION OPTIONS AND ELECTRICITY MIXES Page 25
Authors (year) Options studied (number of technologies)
Geographical context
Method Indicators assessed17
Burger and Bauer (2007)
Wind (2) OCE Europe
CML ExtrMin, NRE, CC, OLD, ToxHum, EcotoxA, EcotoxM, EcotoxT, OPC, Acid, Eutr
Burkhardt et al. (2012) Thermodynamic solar (2) U.S.A. CED IPCC
NRE, CC
Butnar et al. (2010) Biomass (3) Europe CML CC, Acid, ToxHum, OLD, ExtrMin, OPC
Crawford (2009) Wind (1) Australia unkn. CC
De Santoli et al. (2010) Photovoltaic solar (1) Europe ReCiPe Human health, Ecosystem quality, Resources
Desideri et al. (2012) Photovoltaic solar (1) Europe EI99 CC
Desideri et al. (2013) Photovoltaic solar (2) Europe EI99 CC
Ding et al. (2013) Thermal – Natural gas (1) Thermal – Coal (2)
Asia unkn. CC
Dolan (2007) Wind (1) Thermal – Coal (2) Thermal – Natural gas (1)
U.S.A.
unkn. Allan and Shonnard 2002
CC, Acid
Dones et al. (2009) Nuclear (3) U.S.A. Europe(UCTE) Switzerland
CML ExtrMin, NRE, CC, OLD, ToxHum, EcotoxA, EcotoxM, EcotoxT, OPC, Acid, Eutr
DONG energy (2008) Wind (1) Europe IPCC CC
ElAqua (2009) Reservoir hydropower (1) Europe CML CC, OLD, OPC, Acid, Eutr, NRE
Faist Emmenegger et al. (2007)
Thermal – Natural gas (9) Europe CML ExtrMin, NRE, CC, OLD, ToxHum, EcotoxA, EcotoxM, EcotoxT, OPC, Acid, Eutr
Faix et al. (2010) Biomass (1) Thermal – Oil (1)
Europe CML CC, Eutr, Acid, OPC, OLD
Frick et al. (2010) Geothermal (1) Europe unkn. CC, NRE, Eutr, Acid
Froese et al. (2010) Thermal – Coal (2) U.S.A. IPCC CED
CC, NRE
Garcıa-Valverde et al. (2009)
Photovoltaic solar (1) Europe unkn. CC
Garrett et al. (2012) Wind (1) Europe CML CC, Acid, Eutr, EcotoxA, EcotoxT, ToxHum, EcotoxM, OPC, ExtrMin, NRE
Guest et al. (2011) Biomass (3) Europe CML CC, OPC, OLD, Eutr, Acid, EcotoxT, EcotoxM, EcotoxA, ToxHum, ExtrMin
Jacobson (2009)
Photovoltaic solar (2) Wind (1) Geothermal (1) Hydropower (1) Wave energy (1) Tidal energy (1) Nuclear (1) Thermal – Coal (1)
World unkn. CC
Jeswani (2011) Thermal – Coal (7) Biogas (5)
Europe CML CC, Acid, Eutr, OPC, ToxHum

© ILC Chair
Page 26 COMPARING POWER GENERATION OPTIONS AND ELECTRICITY MIXES November 2014
Authors (year) Options studied (number of technologies)
Geographical context
Method Indicators assessed17
Jungbluth (2007) Thermal – Oil (1) CH CML ExtrMin, NRE, CC, OLD, ToxHum, EcotoxA, EcotoxM, EcotoxT, OPC, Acid, Eutr
Jungbluth et al. (2009) Photovoltaic solar (11) CH CML ExtrMin, NRE, CC, OLD, ToxHum, EcotoxA, EcotoxM, EcotoxT, OPC, Acid, Eutr
Kabir et al. (2012) Wind (1) Canada IPCC unkn.
CC, Acid, NRE
Karlsdottir et al. (2010) Geothermal (1) Europe CML CC
Koornneef et al. (2008) Thermal – Coal (3) Europe CML CC, ExtrMin, OPC, ToxHum, EcotoxA, EcotoxT, EcotoxM, OLD, Acid, Eutr
Koroneos et al. (2008) Thermodynamic solar (1) Europe EI95 CC, Acid, Eutr, OLD, OPC
Lechon et al. (2008) Thermodynamic solar (2) Europe CML CC, ExtrMin, OLD, ToxHum, EcotoxA, EcotoxM, EcotoxT, OPC, Acid, Eutr
Lecointe et al. (2007) Nuclear (1) Europe IPCC CC
Martinez et al. (2009) Wind (1) Europe CML ExtrMin, CC, OLD, ToxHum, EcotoxA, EcotoxM, EcotoxT, OPC, Acid, Eutr
Odeh and Cockerill (2008)
Thermal – Coal (3) Thermal – Natural gas (4)
Europe IPCC CC
Penht and Henkel (2009)
Thermal – Coal (5) Europe CML NRE, CC, OPC, Eutr, Acid
Piemonte et al. (2010) Thermodynamic solar (1) Europe CML CC, OLD, ToxHum, Acid, Eutr
Reich-Weiser et al. (2008)
Photovoltaic solar (1) Europe, U.S.A.
unkn. CC
Ribeiro et al. (2010) Hydropower (1) Brazil IPCC CC
Röder et al. (2007) Thermal – Coal (5) UCTE NORDEL CENTREL
CML ExtrMin, NRE, CC, OLD, ToxHum, EcotoxA, EcotoxM, EcotoxT, OPC, Acid, Eutr
Roedl (2010) Biomass (1) Europe CML CC, Eutr, Acid, OPC
Rule et al. (2009)
Geothermal (1) Hydropower (1) Tidal energy (1) Wind (1)
New Zealand unkn. CC, NRE
Searcy et al. (2008) Biomass (2) Thermal – Coal (1)
AmN IPCC CC
Singh et al. (2011) Thermal – Natural gas (2) Europe CML CC, Acid, OPC, Resp, ToxHum, EcotoxT, EcotoxA, EcotoxM
Sorensen et al. (2008) Tidal power (1) Europe IPCC CC
Stopatto (2008) Photovoltaic solar (1) Europe unkn. CC
Styles et al. (2007) Biomass (2) Thermal – Coal (2)
Europe IPCC CC

Hydro-Québec Technical Report
November 2014 COMPARING POWER GENERATION OPTIONS AND ELECTRICITY MIXES Page 27
Authors (year) Options studied (number of technologies)
Geographical context
Method Indicators assessed17
Tirado et al. (2014) Hydropower (2) Nuclear (1)
Canada
IMPACT 2002+, CML, IW+
CC, Santé humaire, Ecosystem Quality, NRE ExtrMin, OLD, ToxHum, EcotoxA, EcotoxM, EcotoxT, OPC, Acid, Eutr
Tiwary et al. (2010) Biomass (5) Europe IPCC CC
Tremeac and Meunier (2009)
Wind (1) Europe IMPACT 2002+
CC, Human health, Ecosystem Quality, NRE
Vattenfall (2011) Hydropower (1) Europe CML CC, OLD, Acid, OPC, Eutr
Vattenfall (2013a) Nuclear (1) Europe CML CC, Acid, OPC, Eutr
Vattenfall (2013b) Wind (1) Europe, North America
CML CC, OLD, Acid, OPC, Eutr
Vattenfall (2013c) Wind (1) Europe-UK CML CC, Acid, OPC, Eutr
Vattenfall (2014) Nuclear (2) Europe CML CC, Acid, OPC, Eutr
Viebahn et al. (2008) Thermodynamic solar (2) Europe unkn. CC
Wagner et al. (2011) Wind (1) Europe unkn. NRE, CC, Eutr, ToxHum, OPC, Acid
Whitaker et al. (2013) Thermodynamic solar (1) U.S.A. IPCC CED
CC, NRE
Woollcombe-Adams et al. (2009)
Tidal energy (1) Europe unkn. CC

© ILC Chair
Page 28 COMPARING POWER GENERATION OPTIONS AND ELECTRICITY MIXES November 2014
6 References
6.1 General
ABOUSSOUAN, L., VAN DE MEENT, D., SCHÖNNENBECK, M., HAUSCHILD, M., DELBEKE, K., STRUIJS, J., RUSSELL, A., UDO DE HAES, H., ATHERTON, J., VAN TILBORG, W., KARMAN, C., KORENROMP, R., SAP, G., BAUKLOH, A., DUBREUIL, A., ADAMS, W., HEIJUNGS, R., JOLLIET, O., DE KONING, A., CHAPMAN, P., LIGTHART, T., VERDONCK, F., VAN DER LOOS, R., EIKELBOOM, R. and KUYPER, J. (2004). Declaration of Apeldoorn on LCIA of Non-Ferrous Metals. 15 April 2004, Apeldoorn, Netherlands. Retrieved from http://www.zinc.org/general/apeldoorn_declaration.pdf on 25 June 2014.
BARE, J. C., NORRIS, G. A., PENNINGTON, D. W. and MCKONE, T. (2002). TRACI: The Tool for the Reduction and Assessment of Other Environmental Impacts. Journal of Industrial Ecology, 6 (3&4), 49-78.
COMBS, S. (2008). The Energy Report 2008. Chapter 27: Electricity. Texas Comptroller of Public Accounts. Retrieved from http://www.trcc.state.tx.us/specialrpt/energy/pdf/96-1266EnergyReport.pdf on 21 May 2014.
ECOINVENT CENTRE. The ecoinvent Database. Retrieved from http://www.ecoinvent.org/database/ on 22 May 2014.
EDF (2013a). La biomass. Retrieved from http://energie.edf.com/energies-nouvelles/biomass-47908.html on 22 May 2014.
EDF (2013b). Comment fonctionne une centrale photovoltaïque? Retrieved from http://jeunes.edf.com/article/comment-fonctionne-une-centrale-photovoltaique,173 on 22 May 2014.
EDF (2012). Une technologie dévoilée. Le solaire thermodynamique à concentration. Publication EDF R&D, June 2012. 4 pages. Retrieved from http://chercheurs.edf.com/fichiers/fckeditor/Commun/Innovation/Publications/technodevoilee/technologiedevoilee01internet.pdf on 22 May 2014.
GOEDKOOP, M.J. and SPRIENSMA, R. (2001). The Eco-indicator 99 - A Damage Oriented Method for Life Cycle Impact Assessment - Methodology Report (3rd ed.): PRé Consultants B.V. 144 pages.
GOEDKOOP, M.J., HEIJUNGS, R., HUIJBREGTS, M., DE SCHRYVER, A., STRUIJS, J. and VAN ZELM, R. (2009). ReCiPe 2008, A life cycle impact assessment method which comprises harmonised category indicators at the midpoint and the endpoint level. First edition Report I: Characterisation; 6.
GUINÉE, J. B., GORRÉE, M., HEIJUNGS, R., HUPPES, G., KLEIJN, R., KONING, A. and HUIJBREGTS, M. (2001). An operational guide to the ISO standards: Part A, Part B, Part 2B and Part 3. Ministry of Housing, Spatial Planning, and the Environment (VROM) and Centre of Environmental Science – Leiden University (CML).
HAUSCHILD, M. and POTTING, J. (2003). Spatial differentiation in life cycle impact assessment: The EDIP2003 methodology. Institute for Product Development, Technical University of Denmark. 149 pages.
HAYASHI, K., OKAZAKI, M., ITSUBO, N. and INABA, A. (2004). Development of Damage Function of Acidification for Terrestrial Ecosystems Based on the Aluminum Toxicity on Net Primary Production. International Journal of Life Cycle Assessment, 9, 13-22.
HYDRO-QUÉBEC (2014). Personal communication with C. Turpin (12 September 2014).
IPCC (2006). 2006 IPCC Guidelines for National Greenhouse Gas Inventories, prepared by the National Greenhouse Gas Inventories Programme, Eggleston H.S., Buendia L., Miwa K., Ngara T. and Tanabe K. (eds). Published: IGES, Japan.

Hydro-Québec Technical Report
November 2014 COMPARING POWER GENERATION OPTIONS AND ELECTRICITY MIXES Page 29
IPCC (2011). IPCC Special Report on Renewable Energy Sources and Climate Change Mitigation, Retrieved from http://srren.ipcc-wg3.de/report on 21 May 2014.
JOLLIET, O., MARGNI, M., CHARLES, R., HUMBERT, S., PAYET, J., REBITZER, G. and ROSENBAUM, R. (2003). IMPACT 2002+: A New Life Cycle Impact Assessment Methodology. International Journal of Life Cycle Assessment 8(6) pp. 324-330.
LEONARDO ACADEMY (2012). LEO-SCS-002: Life Cycle Impact Assessment Framework and Guidance for Establishing Public Declarations and Claims, 36 pages.
MOOMAW, W., BURGHERR, P., HEATH, G., LENZEN, M., NYBOER, J. and BERBRUGGEN, A. (2011). Annex II: Methodology. In IPCC Special Report on Renewable Energy Sources and Climate Change Mitigation [O. Edenhofer, R. Pichs-Madruga, Y. Sokona, K. Seyboth, P. Matschoss, S. Kadner, T. Zwickel, P. Eickemeier, G. Hansen, S. Schlömer, C. von Stechow (eds.)], Cambridge University Press, Cambridge, United Kingdom and New York, NY, USA (pp. 973-1000). Retrieved from http://srren.ipcc-wg3.de/report/IPCC_SRREN_Annex_II.pdf on 30 May 2014.
PLANÈTE ÉNERGIES (2013a). Les voies du futur – L’énergie des marées. Dated 10 December 2013. Retrieved from http://www.planete-energies.com/fr/l-energie-demain/les-voies-du-futur/l-energie-des-oceans/les-marees-une-energie-au-rendez-vous-301.html on 22 May 2014.
PLANÈTE ÉNERGIES (2013b). Les voies du futur – Les vagues, un mouvement perpétuel. Dated 10 December 2013. Retrieved from http://www.planete-energies.com/fr/l-energie-demain/les-voies-du-futur/l-energie-des-oceans/les-vagues-un-mouvement-a-exploiter-303.html on 22 May 2014.
PLANÈTE ÉNERGIES (2013c). Les voies du futur – L’eau salée, moteur de l’énergie osmotique. Dated 16 April 2013. Retrieved from http://www.planete-energies.com/fr/l-energie-demain/les-voies-du-futur/l-energie-des-oceans/l-energie-osmotique-600138.html.
PLANÈTE ÉNERGIES 2013d). Les voies du futur – La mer, une réserve de chaleur inexploitée. Dated 10 December 2013. Retrieved from http://www.planete-energies.com/fr/l-energie-demain/les-voies-du-futur/l-energie-des-oceans/l-energie-thermique-des-oceans-307.html on 22 May 2014.
PLANÈTE ÉNERGIES (2013e). Les voies du futur – Les courants marins, un potentiel considérable. Dated 10 December 2013. Retrieved from http://www.planete-energies.com/fr/l-energie-demain/les-voies-du-futur/l-energie-des-oceans/les-courants-marins-une-force-motrice-305.html on 22 May 2014.
TIRADO SECO, P., DUSSAULT, M., FALLAHA, S., MICHAUD, R. and SAMSON, R. (2014). Analyse du cycle de vie de la production, du transport et de la distribution d’électricité au Québec. Technical report. CIRAIG. May 2014. 45 pages.
VATTENFALL (2010). Certified Environmental Product Declaration EPD® of Electricity from Forsmark Nuclear Power Plant. S-P 00021, 2010-12-16, Vattenfall AB Nuclear Power, Sweden, 83 pages. Retrieved from http://gryphon.environdec.com/data/files/6/7310/epd21.pdf on 26 June 2014.
VATTENFALL (2013a). Certified Environmental Product Declaration EPD® of Electricity from Forsmark Nuclear Power Plant. Version 1.2 S-P 0021 2013-03-27. Vattenfall AB Nuclear Power, Sweden, 52 pages. Retrieved from http://gryphon.environdec.com/data/files/6/9914/epd21_Vattenfall_Forsmark_Nuclear_Power_Plant_2014-03-27.pdf on 26 June 2014.
6.2 Comparative datasheet ― Climate Change
1. ARDENTE, F., BECCALI, M., CELLURA, M. and LO BRANO, V. (2008). Energy performances and life cycle assessment of an Italian wind farm. Renewable and Sustainable Energy Reviews, 12(1), pp. 200–217.
© ILC Chair
Page 30 COMPARING POWER GENERATION OPTIONS AND ELECTRICITY MIXES November 2014
2. ARNØY, S. and MODAHL, I.S. (2013). Life Cycle Data for Hydroelectric Generation at Embretsfoss 4 (E4) Power Station. Background Data for Life Cycle Assessment (LCA) and Environmental Product Declaration (EPD). 39 pages. Retrieved from http://ostfoldforskning.no/uploads/dokumenter/publikasjoner/703.pdf on 9 April 2014.
3. AXPO (2010). Environmental Product Declaration: Löntsch high head storage power plant, 26 pages. Retrieved from http://gryphon.environdec.com/data/files/6/8611/epd332.pdf on 9 April 2014.
4. AXPO (2011). Environmental Product Declaration: Otelfingen Kompogas Facility, 21 pages. Retrieved from http://gryphon.environdec.com/data/files/6/8789/epd176_Axpo_Otelfingen_Kompogas_Facility_2012.pdf on 9 April 2014.
5. AXPO (2012). Environmental Product Declaration: Wildegg-Brugg Run-of-River Power Plant, 21 pages. Retrieved from http://gryphon.environdec.com/data/files/6/9037/epd205_Axpo_Wildegg_Brugg.pdf on 9 April 2014.
6. AXPO NEW ENERGIES (2008). Environmental Product Declaration: Genesys Plant Busslingen, 24 pages Retrieved from http://gryphon.environdec.com/data/files/6/8319/epd263en.pdf on 9 April 2014.
7. AXPO NUCLEAR ENERGY (2011). Environmental Product Declaration: Beznau Nuclear Power Plant - Update 2011, 40 pages. Retrieved from http://gryphon.environdec.com/data/files/6/7562/epd144en_v2.pdf on 9 April 2014.
8. BADEA, A.A., VODA, I. and DINCA, C.F. (2010). Comparative Analysis Of Coal, Natural Gas And Nuclear Fuel Life Cycles By Chains Of Electrical Energy Production. U.P.B. Sci. Bull., Series C 72(2), 221-238.
9. BAUER C. (2007) Holzenergie. In: Sachbilanzen von Energiesystemen: Grundlagen für den ökologischen Vergleich von Energiesystemen und den Einbezug von Energiesystemen in Ökobilanzen für die Schweiz (ed. Dones R.). Swiss Centre for Life Cycle Inventories, Dübendorf, CH. [ecoinvent Report no. 6 - wood-based cogeneration].
10. BEERTEN, J., LAES, E., MESKENS, G. and D'HAESELEER, W. (2009). Greenhouse gas emissions in the nuclear life cycle: A balanced appraisal. Energy Policy, 37(12), 5056-5068.
11. BELLERIVE, N. (2009). Comparaison de la performance environnementale de la production thermique d'électricité avec et sans séquestration géologique du dioxyde de carbone. M.Sc.A. dissertation, École Polytechnique, Montréal, Canada.
12. BOLLIGER R. and BAUER C. (2007) Wasserkraft. In: Sachbilanzen von Energiesystemen: Grundlagen für den ökologischen Vergleich von Energiesystemen und den Einbezug von Energiesystemen in Ökobilanzen für die Schweiz (ed. Dones R.). Swiss Centre for Life Cycle Inventories, Dübendorf, CH. [ecoinvent Report No. 6, part VIII- hydropower].
13. BURGER B. and BAUER C. (2007) Windkraft. In: Sachbilanzen von Energiesystemen: Grundlagen für den ökologischen Vergleich von Energiesystemen und den Einbezug von Energiesystemen in Ökobilanzen für die Schweiz (ed. Dones R.). Swiss Centre for Life Cycle Inventories, Dübendorf, CH. [ecoinvent Report No. 6, part XIII- wind energy].
14. BURKHARDT, J.J., HEATH, G. and COHEN, E. (2012). Life Cycle Greenhouse Gas Emissions of Trough and Tower Concentrating Solar Power Electricity Generation: Systematic Review and Harmonization. Journal of Industrial Ecology, 16(SUPPL.1), S93-S109.
15. BUTNAR, I., RODRIGO, J., GASOL, C.M. and CASTELLS, F. (2010). Life-cycle assessment of electricity from biomass: Case studies of two biocrops in Spain. Biomass & Bioenergy, 34(12), 1780-1788.
16. CRAWFORD, R.H. (2009). Life cycle energy and greenhouse emissions analysis of wind turbines and the effect of size on energy yield. Renewable and Sustainable Energy Reviews, 13, 2653–2660.
17. DESIDERI, U., PROIETTI, S., ZEPPARELLI, F., SDRINGOLA, P. and BINI, S. (2012). Life Cycle Assessment of a ground-mounted 1778 kW p photovoltaic plant and comparison with traditional energy production systems. Applied Energy, 97, 944-955.

Hydro-Québec Technical Report
November 2014 COMPARING POWER GENERATION OPTIONS AND ELECTRICITY MIXES Page 31
18. DESIDERI, U., ZEPPARELLI, F., MORETTINI, V. and GARRONI, E. (2013). Comparative analysis of concentrating solar power and photovoltaic technologies: Technical and environmental evaluations. Applied Energy, 102, 765-784.
19. DING, Y.J., HAN, W.J., CHAI, Q.H., YANG, S.H. and SHEN, W. (2013). Coal-based synthetic natural gas (SNG): A solution to China's energy security and CO2 reduction? Energy Policy, 55, 445-453.
20. DOLAN, S.L. (2007). Life cycle assessment and energy synthesis of a theoretical offshore wind farm for Jacksonville, Florida. M.Sc. dissertation, University of Florida, 125 pages.
21. DONES R., BAUER C. and DOKA G. (2009) Kernkraft. Data v2.1 In: Sachbilanzen von Energiesystemen: Grundlagen für den ökologischen Vergleich von Energiesystemen und den Einbezug von Energiesystemen in Ökobilanzen für die Schweiz (ed. Dones R.). Swiss Centre for Life Cycle Inventories, Dübendorf, CH. [ecoinvent Report No. 6, part VII – nuclear].
22. DONG Energy (2008). Life cycle approaches to assess emerging energy technologies: Final report on offshore wind technology. Fredericia, Denmark: New Energy Externalities Developments for Sustainability, 60 pages.
23. ELAQUA AG (2009). Environmental Product Declaration. Au-Schönenberg Small-Scale Hydro Power Plant, 24 pages. Retrieved from http://gryphon.environdec.com/data/files/6/7871/epd262.pdf on 9 April 2014.
24. FAIST EMMENEGGER M., HECK T. and JUNGBLUTH N. (2007) Erdgas. In: Sachbilanzen von Energiesystemen: Grundlagen für den ökologischen Vergleich von Energiesystemen und den Einbezug von Energiesystemen in Ökobilanzen für die Schweiz (ed. Dones R.). Swiss Centre for Life Cycle Inventories, Dübendorf, CH. [ecoinvent Report No. 6 - gas-fired thermal].
25. FAIX, A., SCHWEINLE, J., SCHÖLL, S., BECKER, G. and MEIER, D. (2010). (GTI-tcbiomass) Life-cycle assessment of the BTO® process (biomass-to-oil) with combined heat and power generation. Environmental Progress & Sustainable Energy, 29(2), 193-202.
26. FRICK, S., KALTSCHMITT, M. and SCHROEDER, G. (2010). Life cycle assessment of geothermal binary power plants using enhanced low-temperature reservoirs. Energy, 35(5), 2281-2294.
27. FROESE, R. E., SHONNARD, D. R., MILLER, C. A., KOERS, K. P. and JOHNSON, D. M. (2010). An evaluation of greenhouse gas mitigation options for coal-fired power plants in the US Great Lakes States. Biomass and Bioenergy, 34, 251–262.
28. GARCIA-VALVERDE, R., MIGUEL, C., MARTINEZ-BEJAR, R. and URBINA, A. (2009). Life cycle assessment study of a 4.2 kWp stand-alone photovoltaic system. Solar Energy, 83(9), 1434–1445.
29. GARRETT, P. and RØNDE, K. (2012). Life cycle assessment of wind power: comprehensive results from a state-of-the-art approach. International Journal of Life Cycle Assessment, 1-12.
30. GUEST, G., BRIGHT, R.M., CHERUBINI, F., MICHELSEN, O. and ANDERS HAMMER, S. (2011). Life Cycle Assessment of Biomass-based Combined Heat and Power Plants. Journal of Industrial Ecology, 15(6), 908-921.
31. JACOBSON, M.Z. (2009). Review of solutions to global warming, air pollution, and energy security. Energy & Environmental Science, 2, 148–173.
32. JESWANI, H.K., GUJBA, H. and AZAPAGIC, A. (2011). Assessing Options for Electricity Generation from Biomass on a Life Cycle Basis: Environmental and Economic Evaluation. Waste and Biomass Valorization, 2(1), 33-42.
33. JUNGBLUTH N. (2007) Erdöl. In: Sachbilanzen von Energiesystemen: Grundlagen für den ökologischen Vergleich von Energiesystemen und den Einbezug von Energiesystemen in Ökobilanzen für die Schweiz (ed. Dones R.). Swiss Centre for Life Cycle Inventories, Dübendorf, CH. [ecoinvent Report No. 6 - oil-fired thermal].
34. JUNGBLUTH N., STUCKI M. and FRISCHKNECHT R. (2009) Photovoltaics. Data v2.1 In: Sachbilanzen von Energiesystemen: Grundlagen für den ökologischen Vergleich von Energiesystemen und den Einbezug von Energiesystemen in Ökobilanzen für die Schweiz (ed. Dones R.). Swiss Centre for Life Cycle Inventories, Dübendorf, CH. [ecoinvent Report No. 6 - photovoltaic solar].
35. KABIR, M.R., ROOKE, B., DASSANAYAKE, G.D.M. and FLECK, B.A. (2012). Comparative life cycle energy, emission, and economic analysis of 100 kW nameplate wind power generation. Renewable Energy, 37(1), 133-141.

© ILC Chair
Page 32 COMPARING POWER GENERATION OPTIONS AND ELECTRICITY MIXES November 2014
36. KARLSDOTTIR, M.R., PALSSON, O.P. and PALSSON, H. (2010). Factors for Primary Energy Efficiency and CO2 Emission of Geothermal Power Production. World Geothermal Congress, Bali, Indonesia.
37. KOORNNEEF, J., VAN KEULEN, T., FAAIJ, A. and TURKENBURG, W. (2008). Life cycle assessment of a pulverized coal power plant with post-combustion capture, transport and storage of CO2. International Journal of Greenhouse Gas Control, 2(4), 448-467.
38. KORONEOS, C.J., PIPERIDIS, S.A., TATATZIKIDIS, C.A. and ROVAS, D.C. (2008). Life Cycle Assessment of a Solar Thermal Concentrating System, WSEAS Conferences in Spain. September 2008, 209-217
39. LECHÓN, Y., DE LA RÚA, C. and SÁEZ, R. (2008). Life cycle environmental impacts of electricity production by solarthermal power plants in Spain. Journal of Solar Energy Engineering, Transactions of the ASME, 130(2) 0210121-0210127.
40. LECOINTE, C., LECARPENTIER, D., MAUPU, V., LE BOULCH, D. and RICHARD, R. (2007). Final report on technical data, costs and life cycle inventories of nuclear power plants. Rome, Italy: New Energy Externalities Developments for Sustainability, 62 pages.
41. MARTÍNEZ, E., SANZ, F., PELLEGRINI, S., JIMÉNEZ, E. and BLANCO, J. (2009). Life-cycle assessment of a 2-MW rated power wind turbine: CML method. International Journal of Life Cycle Assessment, 14(1), 52-63.
42. ODEH, N.A. and COCKERILL, T.T. (2008). Life cycle GHG assessment of fossil fuel power plants with carbon capture and storage. Energy Policy, 36(1), 367-380.
43. PEHNT, M. and HENKEL, J. (2009). Life cycle assessment of carbon dioxide capture and storage from lignite power plants. International Journal of Greenhouse Gas Control, 3(1), 49-66.
44. PIEMONTE, V., DE FALCO, M., TARQUINI, P. and GIACONIA, A. (2010). Life cycle assessment of a high temperature molten salt concentrated solar power plant. Computer Aided Chemical Engineering, 28, 1063-1068, Retrieved from http://www.scopus.com/inward/record.url?eid=2-s2.0-78650294050&partnerID=40&md5=36d8f426cf32c5edf2756200c6d2236c on 9 April 2014.
45. REICH-WEISER, C., FLETCHER, T., DORNFELD, D.A. and HORNE, S. (2008). Development of the Supply Chain Optimization and Planning for the Environment (SCOPE) tool - applied to solar energy. IEEE International Symposium on Electronics and the Environment, San Francisco, CA, ISEE.
46. RIBEIRO, F.D.M. and DA SILVA, G.A. (2010). Life-cycle inventory for hydroelectric generation: a Brazilian case study. Journal of Cleaner Production, 18(1), 44-54.
47. RÖDER A., BAUER C. and DONES R. (2007) Kohle. In: Sachbilanzen von Energiesystemen: Grundlagen für den ökologischen Vergleich von Energiesystemen und den Einbezug von Energiesystemen in Ökobilanzen für die Schweiz (ed. Dones R.). Swiss Centre for Life Cycle Inventories, Dübendorf, CH. [Ecoinvent Report No. 6, part VII - coal-fired thermal].
48. ROEDL, A. (2010). Production and energetic utilization of wood from short rotation coppice—a life cycle assessment. The International Journal of Life Cycle Assessment, 15(6), 567-578.
49. RULE, B.M., WORTH, Z.J. and BOYLE, C.A. (2009). Comparison of life cycle carbon dioxide emissions and embodied energy in four renewable electricity generation technologies in New Zealand. Environmental Science & Technolology, 43(16), 6406–6413.
50. SEARCY, E. and FLYNN, P.C. (2008). Processing of Straw/Corn Stover: Comparison of Life Cycle Emissions. International Journal of Green Energy, 5(6), 14.
51. SINGH, B., STROMMAN, A.H. and HERTWICH, E. (2011). Life cycle assessment of natural gas combined cycle power plant with post-combustion carbon capture, transport and storage. International Journal of Greenhouse Gas Control, 5(3), 457-466.
52. SORENSEN, H.C. and NAEF, S. (2008). Report on Technical Specification of Reference Technologies (Wave and Tidal Power Plant). New Energy Externalities Developments for Sustainability (NEEDS), Rome, Italy and SPOK Consult, Copenhagen, Denmark, 59 pages.
53. STOPPATO, A. (2008). Life cycle assessment of photovoltaic electricity generation. Energy, 33(2), 224-232.
54. STYLES, D. and JONES, M.B. (2007). Energy crops in Ireland: Quantifying the potential life-cycle greenhouse gas reductions of energy-crop electricity. Biomass and Bioenergy, 31, 759–772.
55. TIWARY, A. and COLL, J. (2010). Mitigating secondary aerosol generation potentials from biofuel use in the energy sector. Science of the Total Environment, 408(3), 607–616.

Hydro-Québec Technical Report
November 2014 COMPARING POWER GENERATION OPTIONS AND ELECTRICITY MIXES Page 33
56. TREMEAC, B. and MEUNIER, F. (2009). Life cycle analysis of 4.5MW and 250W wind turbines. Renewable and Sustainable Energy Reviews, 13(8), 2104-2110.
57. VATTENFALL (2011). Certified Environmental Product Declaration EPD® of Electricity from Vattenfall’s Nordic Hydropower, S-P-00088, 2011-12-31, Vattenfall AB, Sweden, 63 pages. Retrieved from http://gryphon.environdec.com/data/files/6/7470/epd88_v2011.pdf on 26 June 2014.
58. VATTENFALL (2013a). Certified Environmental Product Declaration EPD® of Electricity from Forsmark Nuclear Power Plant. Version 1.2, S-P 0021 2013-03-27. Vattenfall AB Nuclear Power, Sweden, 52 pages. Retrieved from http://gryphon.environdec.com/data/files/6/9914/epd21_Vattenfall_Forsmark_Nuclear_Power_Plant_2014-03-27.pdf on 26 June 2014.
59. VATTENFALL (2013b). Certified Environmental Product Declaration EPD® of Electricity from Vattenfall’s Nordic Wind Farms. S-P-00183, 2013-02-01, Vattenfall AB, Sweden, 46 pages. Retrieved from http://gryphon.environdec.com/data/files/6/9018/epd183_Vattenfall_Nordic_Wind_2013.pdf on 26 June 2014.
60. VATTENFALL (2013c). Certified Environmental Product Declaration EPD® of Electricity from Vattenfall’s Wind Farms in the UK. S-P-00515, 2013-12-31, Vattenfall AB, Sweden, 42 pages. Retrieved from http://gryphon.environdec.com/data/files/6/9781/epd517_Vattenfall_Wind_UK.pdf on 26 June 2014.
61. VATTENFALL (2014). Certified Environmental Product Declaration EPD® of Electricity from Rinhals Nuclear Power Plant, version 1.2, S-P-00026, 2014-03-27, Vattenfall AB, Sweden, 52 pages. Retrieved from http://gryphon.environdec.com/data/files/6/7470/epd88_v2011.pdf on 26 June 2014.
62. VIEBAHN, P., KRONSHAGE, S., TRIEB, F. and LECHON, Y. (2008). Final report on technical data, costs, and life cycle inventories of solar thermal power plants, Project co-funded by the European Commission within the Sixth Framework Programme (2002-2006), 95. Retrieved from http://www.needs-project.org/docs/results/RS1a/RS1a%20D12.2%20Final%20report%20concentrating%20solar%20thermal%20power%20plants.pdf on 9 April 2014.
63. WAGNER, H.-J., BAACK, C., EICKELKAMP, T., EPE, A., LOHMANN, J. and TROY, S. (2011). Life cycle assessment of the offshore wind farm alpha ventus. Energy, 36(5), 2459-2464.
64. WHITAKER, M.B., HEATH, G.A., BURKHARDT, J.J. and TURCHI, C.S. (2013). Life Cycle Assessment of a Power Tower Concentrating Solar Plant and the Impacts of Key Design Alternatives. Environmental Science & Technology, 47(11), 5896-5903.
65. WOOLLCOMBE-ADAMS, C., WATSON, M. and SHAW, T. (2009). Severn Barrage tidal power project: implications for carbon emissions. Water and Environment Journal, 23(1), 63–68.
6.3 Comparative datasheet ― Ozone Layer Depletion
1. ARDENTE, F., BECCALI, M., CELLURA, M. and LO BRANO, V. (2008). Energy performances and life cycle assessment of an Italian wind farm. Renewable and Sustainable Energy Reviews, 12(1), 200–217.
2. ARNØY, S. and MODAHL, I.S. (2013). Life Cycle Data for Hydroelectric Generation at Embretsfoss 4 (E4) Power Station. Background Data for Life Cycle Assessment (LCA) and Environmental Product Declaration (EPD). 39 pages. Retrieved from http://ostfoldforskning.no/uploads/dokumenter/publikasjoner/703.pdf on 9 April 2014.
3. AXPO (2010). Environmental Product Declaration: Löntsch high head storage power plant, 26 pages. Retrieved from http://gryphon.environdec.com/data/files/6/8611/epd332.pdf on 9 April 2014.

© ILC Chair
Page 34 COMPARING POWER GENERATION OPTIONS AND ELECTRICITY MIXES November 2014
4. AXPO (2011). Environmental Product Declaration: Otelfingen Kompogas Facility, 21 pages Retrieved from http://gryphon.environdec.com/data/files/6/8789/epd176_Axpo_Otelfingen_Kompogas_Facility_2012.pdf on 9 April 2014.
5. AXPO (2012). Environmental Product Declaration: Wildegg-Brugg run-of-river Power Plant, 21 pages. Retrieved from http://gryphon.environdec.com/data/files/6/9037/epd205_Axpo_Wildegg_Brugg.pdf on 9 April 2014.
6. AXPO NEW ENERGIES (2008). Environmental Product Declaration: Genesys Plant Busslingen, 24 pages. Retrieved from http://gryphon.environdec.com/data/files/6/8319/epd263en.pdf on 9 April 2014.
7. AXPO NUCLEAR ENERGY (2011). Environmental Product Declaration: Beznau Nuclear Power Plant - Update 2011, 40 pages. Retrieved from http://gryphon.environdec.com/data/files/6/7562/epd144en_v2.pdf on 9 April 2014.
8. BAUER C. (2007) Holzenergie. In: Sachbilanzen von Energiesystemen: Grundlagen für den ökologischen Vergleich von Energiesystemen und den Einbezug von Energiesystemen in Ökobilanzen für die Schweiz (ed. Dones R.). Swiss Centre for Life Cycle Inventories, Dübendorf, CH. [Ecoinvent Report No. 6 - wood-based cogeneration].
9. BELLERIVE, N. (2009). Comparaison de la performance environnementale de la production thermique d'électricité avec et sans séquestration géologique du dioxyde de carbone. M.Sc.A. dissertation, École Polytechnique, Montréal, Canada.
10. BOLLIGER R. and BAUER C. (2007) Wasserkraft. In: Sachbilanzen von Energiesystemen: Grundlagen für den ökologischen Vergleich von Energiesystemen und den Einbezug von Energiesystemen in Ökobilanzen für die Schweiz (ed. Dones R.). Swiss Centre for Life Cycle Inventories, Dübendorf, CH. [Ecoinvent Report No. 6, part VIII- hydropower].
11. BURGER B. and BAUER C. (2007) Windkraft. In: Sachbilanzen von Energiesystemen: Grundlagen für den ökologischen Vergleich von Energiesystemen und den Einbezug von Energiesystemen in Ökobilanzen für die Schweiz (ed. Dones R.). Swiss Centre for Life Cycle Inventories, Dübendorf, CH. [Ecoinvent Report No. 6, part XIII - wind energy].
12. BUTNAR, I., RODRIGO, J., GASOL, C.M. and CASTELLS, F. (2010). Life-cycle assessment of electricity from biomass: Case studies of two biocrops in Spain. Biomass & Bioenergy, 34(12), 1780-1788.
13. DONES R., BAUER C. and DOKA G. (2009) Kernkraft. Data v2.1 In: Sachbilanzen von Energiesystemen: Grundlagen für den ökologischen Vergleich von Energiesystemen und den Einbezug von Energiesystemen in Ökobilanzen für die Schweiz (ed. Dones R.). Swiss Centre for Life Cycle Inventories, Dübendorf, CH. [Ecoinvent Report No. 6, part VII – nuclear].
14. ELAQUA AG (2009). Environmental Product Declaration. Au-Schönenberg Small-Scale Hydro Power Plant, 24 pages. Retrieved from http://gryphon.environdec.com/data/files/6/7871/epd262.pdf on 9 April 2014.
15. FAIST EMMENEGGER M., HECK T. and JUNGBLUTH N. (2007) Erdgas. In: Sachbilanzen von Energiesystemen: Grundlagen für den ökologischen Vergleich von Energiesystemen und den Einbezug von Energiesystemen in Ökobilanzen für die Schweiz (ed. Dones R.). Swiss Centre for Life Cycle Inventories, Dübendorf, CH. [Ecoinvent Report No. 6 - gas-fired thermal].
16. FAIX, A., SCHWEINLE, J., SCHÖLL, S., BECKER, G. and MEIER, D. (2010). (GTI-tcbiomass) Life-cycle assessment of the BTO® process (biomass-to-oil) with combined heat and power generation. Environmental Progress & Sustainable Energy, 29(2), 193-202.
17. GUEST, G., BRIGHT, R.M., CHERUBINI, F., MICHELSEN, O. and ANDERS HAMMER, S. (2011). Life Cycle Assessment of Biomass-based Combined Heat and Power Plants. Journal of Industrial Ecology, 15(6), 908-921.
18. JUNGBLUTH N. (2007) Erdöl. In: Sachbilanzen von Energiesystemen: Grundlagen für den ökologischen Vergleich von Energiesystemen und den Einbezug von Energiesystemen in Ökobilanzen für die Schweiz (ed. Dones R.). Swiss Centre for Life Cycle Inventories, Dübendorf, CH. [Ecoinvent Report No. 6 - oil-fired thermal].

Hydro-Québec Technical Report
November 2014 COMPARING POWER GENERATION OPTIONS AND ELECTRICITY MIXES Page 35
19. JUNGBLUTH N., STUCKI M. and FRISCHKNECHT R. (2009) Photovoltaics. Data v2.1 In: Sachbilanzen von Energiesystemen: Grundlagen für den ökologischen Vergleich von Energiesystemen und den Einbezug von Energiesystemen in Ökobilanzen für die Schweiz (ed. Dones R.). Swiss Centre for Life Cycle Inventories, Dübendorf, CH. [Ecoinvent Report No. 6 - photovoltaic solar].
20. KOORNNEEF, J., VAN KEULEN, T., FAAIJ, A. and TURKENBURG, W. (2008). Life cycle assessment of a pulverized coal power plant with post-combustion capture, transport and storage of CO2. International Journal of Greenhouse Gas Control, 2(4), 448-467.
21. KORONEOS, C.J., PIPERIDIS, S.A., TATATZIKIDIS, C.A. and ROVAS, D.C. (2008). Life Cycle Assessment of a Solar Thermal Concentrating System, WSEAS Conferences in Spain. September 2008, 209-217.
22. LECHÓN, Y., DE LA RÚA, C. and SÁEZ, R. (2008). Life cycle environmental impacts of electricity production by solarthermal power plants in Spain. Journal of Solar Energy Engineering, Transactions of the ASME, 130(2) 0210121-0210127.
23. MARTÍNEZ, E., SANZ, F., PELLEGRINI, S., JIMÉNEZ, E. and BLANCO, J. (2009). Life-cycle assessment of a 2-MW rated power wind turbine: CML method. International Journal of Life Cycle Assessment, 14(1), 52-63.
24. PIEMONTE, V., DE FALCO, M., TARQUINI, P. and GIACONIA, A. (2010). Life cycle assessment of a high temperature molten salt concentrated solar power plant. Computer Aided Chemical Engineering, 28, 1063-1068, Retrieved from http://www.scopus.com/inward/record.url?eid=2-s2.0-78650294050&partnerID=40&md5=36d8f426cf32c5edf2756200c6d2236c on 9 April 2014.
25. RÖDER A., BAUER C. and DONES R. (2007) Kohle. In: Sachbilanzen von Energiesystemen: Grundlagen für den ökologischen Vergleich von Energiesystemen und den Einbezug von Energiesystemen in Ökobilanzen für die Schweiz (ed. Dones R.). Swiss Centre for Life Cycle Inventories, Dübendorf, CH. [Ecoinvent Report No. 6, part VII - coal-fired thermal].
26. VATTENFALL (2011). Certified Environmental Product Declaration EPD® of Electricity from Vattenfall’s Nordic Hydropower, S-P-00088, 2011-12-31, Vattenfall AB, Sweden, 63 pages. Retrieved from http://gryphon.environdec.com/data/files/6/7470/epd88_v2011.pdf on 26 June 2014.
27. VATTENFALL (2013b). Certified Environmental Product Declaration EPD® of Electricity from Vattenfall’s Nordic Wind Farms. S-P-00183, 2013-02-01, Vattenfall AB, Sweden, 46 pages. Retrieved from http://gryphon.environdec.com/data/files/6/9018/epd183_Vattenfall_Nordic_Wind_2013.pdf on 26 June 2014.
6.4 Comparative datasheet – Acidification
1. ARNØY, S. and MODAHL, I.S. (2013). Life Cycle Data for Hydroelectric Generation at Embretsfoss 4 (E4) Power Station. Background Data for Life Cycle Assessment (LCA) and Environmental Product Declaration (EPD). 39 pages. Retrieved from http://ostfoldforskning.no/uploads/dokumenter/publikasjoner/703.pdf on 9 April 2014.
2. AXPO (2010). Environmental Product Declaration: Löntsch high head storage power plant, 26 pages. Retrieved from http://gryphon.environdec.com/data/files/6/8611/epd332.pdf on 9 April 2014.
3. AXPO (2011). Environmental Product Declaration: Otelfingen Kompogas Facility, 21 pages Retrieved from http://gryphon.environdec.com/data/files/6/8789/epd176_Axpo_Otelfingen_Kompogas_Facility_2012.pdf on 9 April 2014.
4. AXPO (2012). Environmental Product Declaration: Wildegg-Brugg run-of-river Power Plant, 21 pages. Retrieved from http://gryphon.environdec.com/data/files/6/9037/epd205_Axpo_Wildegg_Brugg.pdf on 9 April 2014.

© ILC Chair
Page 36 COMPARING POWER GENERATION OPTIONS AND ELECTRICITY MIXES November 2014
5. AXPO NEW ENERGIES (2008). Environmental Product Declaration: Genesys Plant Busslingen, 24 pages Retrieved from http://gryphon.environdec.com/data/files/6/8319/epd263en.pdf on 9 April 2014.
6. AXPO NUCLEAR ENERGY (2011). Environmental Product Declaration: Beznau Nuclear Power Plant - Update 2011, 40 pages. Retrieved from http://gryphon.environdec.com/data/files/6/7562/epd144en_v2.pdf on 9 April 2014.
7. BADEA, A.A., VODA, I. and DINCA, C.F. (2010). Comparative Analysis Of Coal, Natural Gas And Nuclear Fuel Life Cycles By Chains Of Electrical Energy Production. U.P.B. Sci. Bull., Series C 72(2), 221-238.
8. BAUER C. (2007) Holzenergie. In: Sachbilanzen von Energiesystemen: Grundlagen für den ökologischen Vergleich von Energiesystemen und den Einbezug von Energiesystemen in Ökobilanzen für die Schweiz (ed. Dones R.). Swiss Centre for Life Cycle Inventories, Dübendorf, CH. [Ecoinvent Report No. 6 - wood-based cogeneration].
9. BELLERIVE, N. (2009). Comparaison de la performance environnementale de la production thermique d'électricité avec et sans séquestration géologique du dioxyde de carbone. M.Sc.A. dissertation, École Polytechnique, Montréal, Canada.
10. BOLLIGER R. and BAUER C. (2007) Wasserkraft. In: Sachbilanzen von Energiesystemen: Grundlagen für den ökologischen Vergleich von Energiesystemen und den Einbezug von Energiesystemen in Ökobilanzen für die Schweiz (ed. Dones R.). Swiss Centre for Life Cycle Inventories, Dübendorf, CH. [Ecoinvent Report No. 6, part VIII - hydropower].
11. BURGER B. and BAUER C. (2007) Windkraft. In: Sachbilanzen von Energiesystemen: Grundlagen für den ökologischen Vergleich von Energiesystemen und den Einbezug von Energiesystemen in Ökobilanzen für die Schweiz (ed. Dones R.). Swiss Centre for Life Cycle Inventories, Dübendorf, CH. [Ecoinvent Report No. 6, part XIII - wind energy].
12. BUTNAR, I., RODRIGO, J., GASOL, C.M. and CASTELLS, F. (2010). Life-cycle assessment of electricity from biomass: Case studies of two biocrops in Spain. Biomass & Bioenergy, 34(12), 1780-1788.
13. DOLAN, S.L. (2007). Life cycle assessment and energy synthesis of a theoretical offshore wind farm for Jacksonville, Florida, M.Sc. dissertation, University of Florida, 125 pages.
14. DONES R., BAUER C. and DOKA G. (2009) Kernkraft. Data v2.1 In: Sachbilanzen von Energiesystemen: Grundlagen für den ökologischen Vergleich von Energiesystemen und den Einbezug von Energiesystemen in Ökobilanzen für die Schweiz (ed. Dones R.). Swiss Centre for Life Cycle Inventories, Dübendorf, CH. [Ecoinvent Report No. 6, part VII – nuclear].
15. ELAQUA AG (2009). Environmental Product Declaration. Au-Schönenberg Small-Scale Hydro Power Plant, 24 pages. Retrieved from http://gryphon.environdec.com/data/files/6/7871/epd262.pdf on 9 April 2014.
16. FAIST EMMENEGGER M., HECK T. and JUNGBLUTH N. (2007) Erdgas. In: Sachbilanzen von Energiesystemen: Grundlagen für den ökologischen Vergleich von Energiesystemen und den Einbezug von Energiesystemen in Ökobilanzen für die Schweiz (ed. Dones R.). Swiss Centre for Life Cycle Inventories, Dübendorf, CH. [Ecoinvent Report No. 6 - gas-fired thermal].
17. FAIX, A., SCHWEINLE, J., SCHÖLL, S., BECKER, G. and MEIER, D. (2010). (GTI-tcbiomass) Life-cycle assessment of the BTO® process (biomass-to-oil) with combined heat and power generation. Environmental Progress & Sustainable Energy, 29(2), 193-202.
18. FRICK, S., KALTSCHMITT, M. and SCHROEDER, G. (2010). Life cycle assessment of geothermal binary power plants using enhanced low-temperature reservoirs. Energy, 35(5), 2281-2294.
19. GARRETT, P. and RØNDE, K. (2012). Life cycle assessment of wind power: comprehensive results from a state-of-the-art approach. International Journal of Life Cycle Assessment, 1-12.
20. GUEST, G., BRIGHT, R.M., CHERUBINI, F., MICHELSEN, O. and ANDERS HAMMER, S. (2011). Life Cycle Assessment of Biomass-based Combined Heat and Power Plants. Journal of Industrial Ecology, 15(6), 908-921.
21. JESWANI, H.K., GUJBA, H. and AZAPAGIC, A. (2011). Assessing Options for Electricity Generation from Biomass on a Life Cycle Basis: Environmental and Economic Evaluation. Waste and Biomass Valorization, 2(1), 33-42.

Hydro-Québec Technical Report
November 2014 COMPARING POWER GENERATION OPTIONS AND ELECTRICITY MIXES Page 37
22. JUNGBLUTH, N. (2007) Erdöl. In: Sachbilanzen von Energiesystemen: Grundlagen für den ökologischen Vergleich von Energiesystemen und den Einbezug von Energiesystemen in Ökobilanzen für die Schweiz (ed. Dones R.). Swiss Centre for Life Cycle Inventories, Dübendorf, CH. [Ecoinvent Report No. 6 - oil-fired thermal].
23. JUNGBLUTH, N., STUCKI M. and FRISCHKNECHT, R. (2009) Photovoltaics. Data v2.1 In: Sachbilanzen von Energiesystemen: Grundlagen für den ökologischen Vergleich von Energiesystemen und den Einbezug von Energiesystemen in Ökobilanzen für die Schweiz (ed. Dones R.). Swiss Centre for Life Cycle Inventories, Dübendorf, CH. [Ecoinvent Report No. 6 - photovoltaic solar].
24. KABIR, M.R., ROOKE, B., DASSANAYAKE, G.D.M. and FLECK, B.A. (2012). Comparative life cycle energy, emission, and economic analysis of 100 kW nameplate wind power generation. Renewable Energy, 37(1), 133-141.
25. KOORNNEEF, J., VAN KEULEN, T., FAAIJ, A. and TURKENBURG, W. (2008). Life cycle assessment of a pulverized coal power plant with post-combustion capture, transport and storage of CO2. International Journal of Greenhouse Gas Control, 2(4), 448-467.
26. KORONEOS, C.J., PIPERIDIS, S.A., TATATZIKIDIS, C.A. and ROVAS, D.C. (2008). Life Cycle Assessment of a Solar Thermal Concentrating System, WSEAS Conferences in Spain. September 2008, 209-217
27. LECHÓN, Y., DE LA RÚA, C. and SÁEZ, R. (2008). Life cycle environmental impacts of electricity production by solarthermal power plants in Spain. Journal of Solar Energy Engineering, Transactions of the ASME, 130(2) 0210121-0210127.
28. MARTÍNEZ, E., SANZ, F., PELLEGRINI, S., JIMÉNEZ, E. and BLANCO, J. (2009). Life-cycle assessment of a 2-MW rated power wind turbine: CML method. International Journal of Life Cycle Assessment, 14(1), 52-63.
29. PEHNT, M. and HENKEL, J. (2009). Life cycle assessment of carbon dioxide capture and storage from lignite power plants. International Journal of Greenhouse Gas Control, 3(1), 49-66.
30. PIEMONTE, V., DE FALCO, M., TARQUINI, P. and GIACONIA, A. (2010). Life cycle assessment of a high temperature molten salt concentrated solar power plant. Computer Aided Chemical Engineering, 28, 1063-1068, Retrieved from http://www.scopus.com/inward/record.url?eid=2-s2.0-78650294050&partnerID=40&md5=36d8f426cf32c5edf2756200c6d2236c on 9 April 2014.
31. RÖDER A., BAUER C. and DONES, R. (2007) Kohle. In: Sachbilanzen von Energiesystemen: Grundlagen für den ökologischen Vergleich von Energiesystemen und den Einbezug von Energiesystemen in Ökobilanzen für die Schweiz (ed. Dones R.). Swiss Centre for Life Cycle Inventories, Dübendorf, CH. [Ecoinvent Report No. 6, part VII - coal-fired thermal].
32. ROEDL, A. (2010). Production and energetic utilization of wood from short rotation coppice—a life cycle assessment. The International Journal of Life Cycle Assessment, 15(6), 567-578.
33. SINGH, B., STROMMAN, A.H. and HERTWICH, E. (2011). Life cycle assessment of natural gas combined cycle power plant with post-combustion carbon capture, transport and storage. International Journal of Greenhouse Gas Control, 5(3), 457-466.
34. VATTENFALL (2011). Certified Environmental Product Declaration EPD® of Electricity from Vattenfall’s Nordic Hydropower, S-P-00088, 2011-12-31, Vattenfall AB, Sweden, 63 pages. Retrieved from http://gryphon.environdec.com/data/files/6/7470/epd88_v2011.pdf on 26 June 2014.
35. VATTENFALL (2013a). Certified Environmental Product Declaration EPD® of Electricity from Forsmark Nuclear Power Plant. Version 1.2 S-P 0021 2013-03-27. Vattenfall AB Nuclear Power, Sweden, 52 pages. Retrieved from http://gryphon.environdec.com/data/files/6/9914/epd21_Vattenfall_Forsmark_Nuclear_Power_Plant_2014-03-27.pdf on 26 June 2014.
36. VATTENFALL (2013b). Certified Environmental Product Declaration EPD® of Electricity from Vattenfall’s Nordic Wind Farms. S-P-00183, 2013-02-01, Vattenfall AB, Sweden, 46 pages. Retrieved from http://gryphon.environdec.com/data/files/6/9018/epd183_Vattenfall_Nordic_Wind_2013.pdf on 26 June 2014.
37. VATTENFALL (2013c). Certified Environmental Product Declaration EPD® of Electricity from Vattenfall’s Wind Farms in the UK. S-P-00515, 2013-12-31, Vattenfall AB, Sweden, 42 pages.

© ILC Chair
Page 38 COMPARING POWER GENERATION OPTIONS AND ELECTRICITY MIXES November 2014
Retrieved from http://gryphon.environdec.com/data/files/6/9781/epd517_Vattenfall_Wind_UK.pdf on 26 June 2014.
38. VATTENFALL (2014). Certified Environmental Product Declaration EPD® of Electricity from Rinhals Nuclear Power Plant, version 1.2 S-P-00026, 2014-03-27, Vattenfall AB, Sweden, 52 pages. Retrieved from http://gryphon.environdec.com/data/files/6/7470/epd88_v2011.pdf on 26 June 2014.
39. WAGNER, H.-J., BAACK, C., EICKELKAMP, T., EPE, A., LOHMANN, J. and TROY, S. (2011). Life cycle assessment of the offshore wind farm alpha ventus. Energy, 36(5), 2459-2464.
6.5 Comparative datasheet – Eutrophication
1. ARNØY, S. and MODAHL, I.S. (2013). Life Cycle Data for Hydroelectric Generation at Embretsfoss 4 (E4) Power Station. Background Data for Life Cycle Assessment (LCA) and Environmental Product Declaration (EPD). 39 pages. Retrieved from http://ostfoldforskning.no/uploads/dokumenter/publikasjoner/703.pdf on 9 April 2014.
2. AXPO (2010). Environmental Product Declaration: Löntsch high head storage power plant, 26 pages. Retrieved from http://gryphon.environdec.com/data/files/6/8611/epd332.pdf on 9 April 2014.
3. AXPO (2011). Environmental Product Declaration: Otelfingen Kompogas Facility, 21 pages Retrieved from http://gryphon.environdec.com/data/files/6/8789/epd176_Axpo_Otelfingen_Kompogas_Facility_2012.pdf on 9 April 2014.
4. AXPO (2012). Environmental Product Declaration: Wildegg-Brugg Run-of-River Power Plant, 21 pages. Retrieved from http://gryphon.environdec.com/data/files/6/9037/epd205_Axpo_Wildegg_Brugg.pdf on 9 April 2014.
5. AXPO NEW ENERGIES (2008). Environmental Product Declaration: Genesys Plant Busslingen, 24 pages Retrieved from http://gryphon.environdec.com/data/files/6/8319/epd263en.pdf on 9 April 2014.
6. AXPO NUCLEAR ENERGY (2011). Environmental Product Declaration: Beznau Nuclear Power Plant - Update 2011, 40 pages. Retrieved from http://gryphon.environdec.com/data/files/6/7562/epd144en_v2.pdf on 9 April 2014.
7. BADEA, A.A., VODA, I. and DINCA, C.F. (2010). Comparative Analysis Of Coal, Natural Gas And Nuclear Fuel Life Cycles By Chains Of Electrical Energy Production. U.P.B. Sci. Bull., Series C 72(2), 221-238.
8. BAUER, C. (2007) Holzenergie. In: Sachbilanzen von Energiesystemen: Grundlagen für den ökologischen Vergleich von Energiesystemen und den Einbezug von Energiesystemen in Ökobilanzen für die Schweiz (ed. Dones R.). Swiss Centre for Life Cycle Inventories, Dübendorf, CH. [Ecoinvent Report No. 6 - wood-based cogeneration].
9. BELLERIVE, N. (2009). Comparaison de la performance environnementale de la production thermique d'électricité avec et sans séquestration géologique du dioxyde de carbone. M.Sc.A. dissertation, École Polytechnique, Montréal, Canada.
10. BOLLIGER, R. and BAUER, C. (2007) Wasserkraft. In: Sachbilanzen von Energiesystemen: Grundlagen für den ökologischen Vergleich von Energiesystemen und den Einbezug von Energiesystemen in Ökobilanzen für die Schweiz (ed. Dones R.). Swiss Centre for Life Cycle Inventories, Dübendorf, CH. [Ecoinvent Report No. 6, part VIII - hydropower].
11. BURGER, B. and BAUER, C. (2007) Windkraft. In: Sachbilanzen von Energiesystemen: Grundlagen für den ökologischen Vergleich von Energiesystemen und den Einbezug von Energiesystemen in Ökobilanzen für die Schweiz (ed. Dones R.). Swiss Centre for Life Cycle Inventories, Dübendorf, CH. [Ecoinvent Report No. 6, part XIII - wind energy].

Hydro-Québec Technical Report
November 2014 COMPARING POWER GENERATION OPTIONS AND ELECTRICITY MIXES Page 39
12. DONES, R., BAUER, C. and DOKA, G. (2009). Kernkraft. Data v2.1 In: Sachbilanzen von Energiesystemen: Grundlagen für den ökologischen Vergleich von Energiesystemen und den Einbezug von Energiesystemen in Ökobilanzen für die Schweiz (ed. Dones R.). Swiss Centre for Life Cycle Inventories, Dübendorf, CH. [Ecoinvent Report No. 6, part VII – nuclear].
13. ELAQUA AG (2009). Environmental Product Declaration. Au-Schönenberg Small-Scale Hydro Power Plant, 24 pages. Retrieved from http://gryphon.environdec.com/data/files/6/7871/epd262.pdf on 9 April 2014.
14. FAIST EMMENEGGER, M., HECK, T. and JUNGBLUTH, N. (2007) Erdgas. In: Sachbilanzen von Energiesystemen: Grundlagen für den ökologischen Vergleich von Energiesystemen und den Einbezug von Energiesystemen in Ökobilanzen für die Schweiz (ed. Dones R.). Swiss Centre for Life Cycle Inventories, Dübendorf, CH. [Ecoinvent Report No. 6 - gas-fired thermal].
15. FAIX, A., SCHWEINLE, J., SCHÖLL, S., BECKER, G. and MEIER, D. (2010). (GTI-tcbiomass) Life-cycle assessment of the BTO® process (biomass-to-oil) with combined heat and power generation. Environmental Progress & Sustainable Energy, 29(2), 193-202.
16. FRICK, S., KALTSCHMITT, M. and SCHROEDER, G. (2010). Life cycle assessment of geothermal binary power plants using enhanced low-temperature reservoirs. Energy, 35(5), 2281-2294.
17. GARRETT, P. and RØNDE, K. (2012). Life cycle assessment of wind power: comprehensive results from a state-of-the-art approach. International Journal of Life Cycle Assessment, 1-12.
18. GUEST, G., BRIGHT, R.M., CHERUBINI, F., MICHELSEN, O. and ANDERS HAMMER, S. (2011). Life Cycle Assessment of Biomass-based Combined Heat and Power Plants. Journal of Industrial Ecology, 15(6), 908-921.
19. JESWANI, H.K., GUJBA, H. and AZAPAGIC, A. (2011). Assessing Options for Electricity Generation from Biomass on a Life Cycle Basis: Environmental and Economic Evaluation. Waste and Biomass Valorization, 2(1), 33-42.
20. JUNGBLUTH, N. (2007) Erdöl. In: Sachbilanzen von Energiesystemen: Grundlagen für den ökologischen Vergleich von Energiesystemen und den Einbezug von Energiesystemen in Ökobilanzen für die Schweiz (ed. Dones R.). Swiss Centre for Life Cycle Inventories, Dübendorf, CH. [Ecoinvent Report No. 6 - oil-fired thermal].
21. JUNGBLUTH, N., STUCKI, M. and FRISCHKNECHT, R. (2009). Photovoltaics. Data v2.1 In: Sachbilanzen von Energiesystemen: Grundlagen für den ökologischen Vergleich von Energiesystemen und den Einbezug von Energiesystemen in Ökobilanzen für die Schweiz (ed. Dones R.). Swiss Centre for Life Cycle Inventories, Dübendorf, CH. [Ecoinvent Report No. 6 - photovoltaic solar].
22. KOORNNEEF, J., VAN KEULEN, T., FAAIJ, A. and TURKENBURG, W. (2008). Life cycle assessment of a pulverized coal power plant with post-combustion capture, transport and storage of CO2. International Journal of Greenhouse Gas Control, 2(4), 448-467.
23. KORONEOS, C.J., PIPERIDIS, S.A., TATATZIKIDIS, C.A. and ROVAS, D.C. (2008). Life Cycle Assessment of a Solar Thermal Concentrating System, WSEAS Conferences in Spain. September 2008, 209-217
24. LECHÓN, Y., DE LA RÚA, C. and SÁEZ, R. (2008). Life cycle environmental impacts of electricity production by solarthermal power plants in Spain. Journal of Solar Energy Engineering, Transactions of the ASME, 130(2) 0210121-0210127.
25. MARTÍNEZ, E., SANZ, F., PELLEGRINI, S., JIMÉNEZ, E. and BLANCO, J. (2009). Life-cycle assessment of a 2-MW rated power wind turbine: CML method. International Journal of Life Cycle Assessment, 14(1), 52-63.
26. PEHNT, M. and HENKEL, J. (2009). Life cycle assessment of carbon dioxide capture and storage from lignite power plants. International Journal of Greenhouse Gas Control, 3(1), 49-66.
27. PIEMONTE, V., DE FALCO, M., TARQUINI, P. and GIACONIA, A. (2010). Life cycle assessment of a high temperature molten salt concentrated solar power plant. Computer Aided Chemical Engineering, 28, 1063-1068, Retrieved from http://www.scopus.com/inward/record.url?eid=2-s2.0-78650294050&partnerID=40&md5=36d8f426cf32c5edf2756200c6d2236c on 9 April 2014.
28. RIBEIRO, F.D.M. and DA SILVA, G.A. (2010). Life-cycle inventory for hydroelectric generation: a Brazilian case study. Journal of Cleaner Production, 18(1), 44-54.

© ILC Chair
Page 40 COMPARING POWER GENERATION OPTIONS AND ELECTRICITY MIXES November 2014
29. RÖDER, A., BAUER, C. and DONES, R. (2007) Kohle. In: Sachbilanzen von Energiesystemen: Grundlagen für den ökologischen Vergleich von Energiesystemen und den Einbezug von Energiesystemen in Ökobilanzen für die Schweiz (ed. Dones R.). Swiss Centre for Life Cycle Inventories, Dübendorf, CH. [Ecoinvent Report No. 6, partie VII - coal-fired thermal].
30. ROEDL, A. (2010). Production and energetic utilization of wood from short rotation coppice—a life cycle assessment. The International Journal of Life Cycle Assessment, 15(6), 567-578.
31. VATTENFALL (2011). Certified Environmental Product Declaration EPD® of Electricity from Vattenfall’s Nordic Hydropower, S-P-00088, 2011-12-31, Vattenfall AB, Sweden, 63 pages. Retrieved from http://gryphon.environdec.com/data/files/6/7470/epd88_v2011.pdf on 26 June 2014.
32. VATTENFALL (2013a). Certified Environmental Product Declaration EPD® of Electricity from Forsmark Nuclear Power Plant. Version 1.2 S-P 0021 2013-03-27. Vattenfall AB Nuclear Power, Sweden, 52 pages. Retrieved from http://gryphon.environdec.com/data/files/6/9914/epd21_Vattenfall_Forsmark_Nuclear_Power_Plant_2014-03-27.pdf on 26 June 2014.
33. VATTENFALL (2013b). Certified Environmental Product Declaration EPD® of Electricity from Vattenfall’s Nordic Wind Farms. S-P-00183, 2013-02-01, Vattenfall AB, Sweden, 46 pages. Retrieved from http://gryphon.environdec.com/data/files/6/9018/epd183_Vattenfall_Nordic_Wind_2013.pdf on 26 June 2014.
34. VATTENFALL (2013c). Certified Environmental Product Declaration EPD® of Electricity from Vattenfall’s Wind Farms in the UK. S-P-00515, 2013-12-31, Vattenfall AB, Sweden, 42 pages. Retrieved from http://gryphon.environdec.com/data/files/6/9781/epd517_Vattenfall_Wind_UK.pdf on 26 June 2014.
35. VATTENFALL (2014). Certified Environmental Product Declaration EPD® of Electricity from Rinhals Nuclear Power Plant, version 1.2 S-P-00026, 2014-03-27, Vattenfall AB, Sweden, 52 pages. Retrieved from http://gryphon.environdec.com/data/files/6/7470/epd88_v2011.pdf on 26 June 2014.
36. WAGNER, H.-J., BAACK, C., EICKELKAMP, T., EPE, A., LOHMANN, J. and TROY, S. (2011). Life cycle assessment of the offshore wind farm alpha ventus. Energy, 36(5), 2459-2464.
6.6 Comparative datasheet ― Human Toxicity
1. BAUER, C. (2007). Holzenergie. In: Sachbilanzen von Energiesystemen: Grundlagen für den ökologischen Vergleich von Energiesystemen und den Einbezug von Energiesystemen in Ökobilanzen für die Schweiz (ed. Dones R.). Swiss Centre for Life Cycle Inventories, Dübendorf, CH. [Ecoinvent Report No. 6 - wood-based cogeneration].
2. BOLLIGER, R. and BAUER, C. (2007) Wasserkraft. In: Sachbilanzen von Energiesystemen: Grundlagen für den ökologischen Vergleich von Energiesystemen und den Einbezug von Energiesystemen in Ökobilanzen für die Schweiz (ed. Dones R.). Swiss Centre for Life Cycle Inventories, Dübendorf, CH. [Ecoinvent Report No. 6, part VIII - hydropower].
3. BURGER, B. and BAUER, C. (2007) Windkraft. In: Sachbilanzen von Energiesystemen: Grundlagen für den ökologischen Vergleich von Energiesystemen und den Einbezug von Energiesystemen in Ökobilanzen für die Schweiz (ed. Dones R.). Swiss Centre for Life Cycle Inventories, Dübendorf, CH. [Ecoinvent Report No. 6, part XIII - wind energy].
4. BUTNAR, I., RODRIGO, J., GASOL, C.M. and CASTELLS, F. (2010). Life-cycle assessment of electricity from biomass: Case studies of two biocrops in Spain. Biomass & Bioenergy, 34(12), 1780-1788.
5. DONES, R., BAUER, C. and DOKA, G. (2009) Kernkraft. Data v2.1 In: Sachbilanzen von Energiesystemen: Grundlagen für den ökologischen Vergleich von Energiesystemen und den

Hydro-Québec Technical Report
November 2014 COMPARING POWER GENERATION OPTIONS AND ELECTRICITY MIXES Page 41
Einbezug von Energiesystemen in Ökobilanzen für die Schweiz (ed. Dones R.). Swiss Centre for Life Cycle Inventories, Dübendorf, CH. [Ecoinvent Report No. 6, part VII – nuclear].
6. FAIST EMMENEGGER, M., HECK, T. and JUNGBLUTH, N. (2007). Erdgas. In: Sachbilanzen von Energiesystemen: Grundlagen für den ökologischen Vergleich von Energiesystemen und den Einbezug von Energiesystemen in Ökobilanzen für die Schweiz (ed. Dones R.). Swiss Centre for Life Cycle Inventories, Dübendorf, CH. [Ecoinvent Report No. 6 - gas-fired thermal].
7. GARRETT, P. and RØNDE, K. (2012). Life cycle assessment of wind power: comprehensive results from a state-of-the-art approach. International Journal of Life Cycle Assessment, 1-12.
8. GUEST, G., BRIGHT, R.M., CHERUBINI, F., MICHELSEN, O. and ANDERS HAMMER, S. (2011). Life Cycle Assessment of Biomass-based Combined Heat and Power Plants. Journal of Industrial Ecology, 15(6), 908-921.
9. JESWANI, H.K., GUJBA, H. and AZAPAGIC, A. (2011). Assessing Options for Electricity Generation from Biomass on a Life Cycle Basis: Environmental and Economic Evaluation. Waste and Biomass Valorization, 2(1), 33-42.
10. JUNGBLUTH, N. (2007) Erdöl. In: Sachbilanzen von Energiesystemen: Grundlagen für den ökologischen Vergleich von Energiesystemen und den Einbezug von Energiesystemen in Ökobilanzen für die Schweiz (ed. Dones R.). Swiss Centre for Life Cycle Inventories, Dübendorf, CH. [Ecoinvent Report No. 6 - oil-fired thermal].
11. JUNGBLUTH, N., STUCKI, M. and FRISCHKNECHT, R. (2009) Photovoltaics. Data v2.1 In: Sachbilanzen von Energiesystemen: Grundlagen für den ökologischen Vergleich von Energiesystemen und den Einbezug von Energiesystemen in Ökobilanzen für die Schweiz (ed. Dones R.). Swiss Centre for Life Cycle Inventories, Dübendorf, CH. [Ecoinvent Report No. 6 - photovoltaic solar].
12. KOORNNEEF, J., VAN KEULEN, T., FAAIJ, A. and TURKENBURG, W. (2008). Life cycle assessment of a pulverized coal power plant with post-combustion capture, transport and storage of CO2. International Journal of Greenhouse Gas Control, 2(4), 448-467.
13. LECHÓN, Y., DE LA RÚA, C. and SÁEZ, R. (2008). Life cycle environmental impacts of electricity production by solarthermal power plants in Spain. Journal of Solar Energy Engineering, Transactions of the ASME, 130(2) 0210121-0210127.
14. MARTÍNEZ, E., SANZ, F., PELLEGRINI, S., JIMÉNEZ, E. and BLANCO, J. (2009). Life-cycle assessment of a 2-MW rated power wind turbine: CML method. International Journal of Life Cycle Assessment, 14(1), 52-63.
15. PIEMONTE, V., DE FALCO, M., TARQUINI, P. and GIACONIA, A. (2010). Life cycle assessment of a high temperature molten salt concentrated solar power plant. Computer Aided Chemical Engineering, 28, 1063-1068, Retrieved from http://www.scopus.com/inward/record.url?eid=2-s2.0-78650294050&partnerID=40&md5=36d8f426cf32c5edf2756200c6d2236c on 9 April 2014.
16. RÖDER, A., BAUER, C. and DONES, R. (2007). Kohle. In: Sachbilanzen von Energiesystemen: Grundlagen für den ökologischen Vergleich von Energiesystemen und den Einbezug von Energiesystemen in Ökobilanzen für die Schweiz (ed. Dones R.). Swiss Centre for Life Cycle Inventories, Dübendorf, CH. [Ecoinvent Report No. 6, part VII - coal-fired thermal].
17. SINGH, B., STROMMAN, A.H. and HERTWICH, E. (2011). Life cycle assessment of natural gas combined cycle power plant with post-combustion carbon capture, transport and storage. International Journal of Greenhouse Gas Control, 5(3), 457-466.
18. WAGNER, H.-J., BAACK, C., EICKELKAMP, T., EPE, A., LOHMANN, J. and TROY, S. (2011). Life cycle assessment of the offshore wind farm alpha ventus. Energy, 36(5), 2459-2464.
6.7 Comparative datasheet ― Resource Depletion
1. AXPO (2010). Environmental Product Declaration: Löntsch high head storage power plant, 26 pages. Retrieved from http://gryphon.environdec.com/data/files/6/8611/epd332.pdf on 9 April 2014.

© ILC Chair
Page 42 COMPARING POWER GENERATION OPTIONS AND ELECTRICITY MIXES November 2014
2. AXPO (2011). Environmental Product Declaration: Otelfingen Kompogas Facility, 21 pages. Retrieved from http://gryphon.environdec.com/data/files/6/8789/epd176_Axpo_Otelfingen_Kompogas_Facility_2012.pdf on 9 April 2014.
3. AXPO (2012). Environmental Product Declaration: Wildegg-Brugg run-of-river Power Plant, 21 pages. Retrieved from http://gryphon.environdec.com/data/files/6/9037/epd205_Axpo_Wildegg_Brugg.pdf on 9 April 2014.
4. AXPO NEW ENERGIES (2008). Environmental Product Declaration: Genesys Plant Busslingen, 24 pages Retrieved from http://gryphon.environdec.com/data/files/6/8319/epd263en.pdf on 9 April 2014.
5. AXPO NUCLEAR ENERGY (2011). Environmental Product Declaration: Beznau Nuclear Power Plant - Update 2011, 40 pages. Retrieved from http://gryphon.environdec.com/data/files/6/7562/epd144en_v2.pdf on 9 April 2014.
6. BADEA, A.A., VODA, I. and DINCA, C.F. (2010). Comparative Analysis Of Coal, Natural Gas And Nuclear Fuel Life Cycles By Chains Of Electrical Energy Production. U.P.B. Sci. Bull., Series C 72(2), 221-238.
7. BAUER, C. (2007) Holzenergie. In: Sachbilanzen von Energiesystemen: Grundlagen für den ökologischen Vergleich von Energiesystemen und den Einbezug von Energiesystemen in Ökobilanzen für die Schweiz (ed. Dones R.). Swiss Centre for Life Cycle Inventories, Dübendorf, CH. [Ecoinvent Report No. 6 - wood-based cogeneration].
8. BELLERIVE, N. (2009). Comparaison de la performance environnementale de la production thermique d'électricité avec et sans séquestration géologique du dioxyde de carbone. M.Sc.A. dissertation, École Polytechnique, Montréal, Canada.
9. BOLLIGER, R. and BAUER, C. (2007) Wasserkraft. In: Sachbilanzen von Energiesystemen: Grundlagen für den ökologischen Vergleich von Energiesystemen und den Einbezug von Energiesystemen in Ökobilanzen für die Schweiz (ed. Dones R.). Swiss Centre for Life Cycle Inventories, Dübendorf, CH. [Ecoinvent Report No. 6, part VIII - hydropower].
10. BURGER, B. and BAUER, C. (2007). Windkraft. In: Sachbilanzen von Energiesystemen: Grundlagen für den ökologischen Vergleich von Energiesystemen und den Einbezug von Energiesystemen in Ökobilanzen für die Schweiz (ed. Dones R.). Swiss Centre for Life Cycle Inventories, Dübendorf, CH. [Ecoinvent Report No. 6, part XIII - wind energy].
11. BURKHARDT, J.J., HEATH, G. and COHEN, E. (2012). Life Cycle Greenhouse Gas Emissions of Trough and Tower Concentrating Solar Power Electricity Generation: Systematic Review and Harmonization. Journal of Industrial Ecology, 16(SUPPL.1), S93-S109.
12. BUTNAR, I., RODRIGO, J., GASOL, C.M. and CASTELLS, F. (2010). Life-cycle assessment of electricity from biomass: Case studies of two biocrops in Spain. Biomass & Bioenergy, 34(12), 1780-1788.
13. DONES R., BAUER C. and DOKA G. (2009) Kernkraft. Data v2.1 In: Sachbilanzen von Energiesystemen: Grundlagen für den ökologischen Vergleich von Energiesystemen und den Einbezug von Energiesystemen in Ökobilanzen für die Schweiz (ed. Dones R.). Swiss Centre for Life Cycle Inventories, Dübendorf, CH. [Ecoinvent Report No. 6, part VII – nuclear].
14. ELAQUA AG (2009). Environmental Product Declaration. Au-Schönenberg Small-Scale Hydro Power Plant, 24 pages. Retrieved from http://gryphon.environdec.com/data/files/6/7871/epd262.pdf on 9 April 2014.
15. FAIST EMMENEGGER, M., HECK, T. and JUNGBLUTH, N. (2007). Erdgas. In: Sachbilanzen von Energiesystemen: Grundlagen für den ökologischen Vergleich von Energiesystemen und den Einbezug von Energiesystemen in Ökobilanzen für die Schweiz (ed. Dones R.). Swiss Centre for Life Cycle Inventories, Dübendorf, CH. [Ecoinvent Report No. 6 - gas-fired thermal].
16. FRICK, S., KALTSCHMITT, M. and SCHROEDER, G. (2010). Life cycle assessment of geothermal binary power plants using enhanced low-temperature reservoirs. Energy, 35(5), 2281-2294.

Hydro-Québec Technical Report
November 2014 COMPARING POWER GENERATION OPTIONS AND ELECTRICITY MIXES Page 43
17. FROESE, R. E., SHONNARD, D. R., MILLER, C. A., KOERS, K. P. and JOHNSON, D. M. (2010). An evaluation of greenhouse gas mitigation options for coal-fired power plants in the US Great Lakes States. Biomass and Bioenergy, 34, 251–262.
18. GARRETT, P. and RØNDE, K. (2012). Life cycle assessment of wind power: comprehensive results from a state-of-the-art approach. International Journal of Life Cycle Assessment, 1-12.
19. GUEST, G., BRIGHT, R.M., CHERUBINI, F., MICHELSEN, O. and ANDERS HAMMER, S. (2011). Life Cycle Assessment of Biomass-based Combined Heat and Power Plants. Journal of Industrial Ecology, 15(6), 908-921.
20. JUNGBLUTH, N. (2007). Erdöl. In: Sachbilanzen von Energiesystemen: Grundlagen für den ökologischen Vergleich von Energiesystemen und den Einbezug von Energiesystemen in Ökobilanzen für die Schweiz (ed. Dones R.). Swiss Centre for Life Cycle Inventories, Dübendorf, CH. [Ecoinvent Report No. 6 - oil-fired thermal].
21. JUNGBLUTH N., STUCKI M. and FRISCHKNECHT R. (2009) Photovoltaics. Data v2.1 In: Sachbilanzen von Energiesystemen: Grundlagen für den ökologischen Vergleich von Energiesystemen und den Einbezug von Energiesystemen in Ökobilanzen für die Schweiz (ed. Dones R.). Swiss Centre for Life Cycle Inventories, Dübendorf, CH. [Ecoinvent Report No. 6 - photovoltaic solar].
22. KABIR, M.R., ROOKE, B., DASSANAYAKE, G.D.M. and FLECK, B.A. (2012). Comparative life cycle energy, emission, and economic analysis of 100 kW nameplate wind power generation. Renewable Energy, 37(1), 133-141.
23. KOORNNEEF, J., VAN KEULEN, T., FAAIJ, A. and TURKENBURG, W. (2008). Life cycle assessment of a pulverized coal power plant with post-combustion capture, transport and storage of CO2. International Journal of Greenhouse Gas Control, 2(4), 448-467.
24. LECHÓN, Y., DE LA RÚA, C. and SÁEZ, R. (2008). Life cycle environmental impacts of electricity production by solarthermal power plants in Spain. Journal of Solar Energy Engineering, Transactions of the ASME, 130(2) 0210121-0210127.
25. MARTÍNEZ, E., SANZ, F., PELLEGRINI, S., JIMÉNEZ, E. and BLANCO, J. (2009). Life-cycle assessment of a 2-MW rated power wind turbine: CML method. International Journal of Life Cycle Assessment, 14(1), 52-63.
26. PEHNT, M. and HENKEL, J. (2009). Life cycle assessment of carbon dioxide capture and storage from lignite power plants. International Journal of Greenhouse Gas Control, 3(1), 49-66.
27. RÖDER A., BAUER C. and DONES R. (2007) Kohle. In: Sachbilanzen von Energiesystemen: Grundlagen für den ökologischen Vergleich von Energiesystemen und den Einbezug von Energiesystemen in Ökobilanzen für die Schweiz (ed. Dones R.). Swiss Centre for Life Cycle Inventories, Dübendorf, CH. [Ecoinvent Report No. 6, part VII - coal-fired thermal].
28. RULE, B.M., WORTH, Z.J. and BOYLE, C.A. (2009). Comparison of life cycle carbon dioxide emissions and embodied energy in four renewable electricity generation technologies in New Zealand. Environmental Science & Technology, 43(16), 6406–6413.
29. TREMEAC, B. and MEUNIER, F. (2009). Life cycle analysis of 4.5MW and 250W wind turbines. Renewable and Sustainable Energy Reviews, 13(8), 2104-2110.
30. WAGNER, H.-J., BAACK, C., EICKELKAMP, T., EPE, A., LOHMANN, J. and TROY, S. (2011). Life cycle assessment of the offshore wind farm alpha ventus. Energy, 36(5), 2459-2464.
31. WHITAKER, M.B., HEATH, G.A., BURKHARDT, J.J. and TURCHI, C.S. (2013). Life Cycle Assessment of a Power Tower Concentrating Solar Plant and the Impacts of Key Design Alternatives. Environmental Science & Technology, 47(11), 5896-5903.
6.8 Comparative datasheet ― Photochemical Oxidation (Smog)
1. ARDENTE, F., BECCALI, M., CELLURA, M. and LO BRANO, V. (2008). Energy performances and life cycle assessment of an Italian wind farm. Renewable and Sustainable Energy Reviews, 12(1), 200–217.

© ILC Chair
Page 44 COMPARING POWER GENERATION OPTIONS AND ELECTRICITY MIXES November 2014
2. ARNØY, S. and MODAHL, I.S. (2013). Life Cycle Data for Hydroelectric Generation at Embretsfoss 4 (E4) Power Station. Background Data for Life Cycle Assessment (LCA) and Environmental Product Declaration (EPD). 39 pages. Retrieved from http://ostfoldforskning.no/uploads/dokumenter/publikasjoner/703.pdf on 9 April 2014.
3. AXPO (2010). Environmental Product Declaration: Löntsch high head storage power plant, 26 pages. Retrieved from http://gryphon.environdec.com/data/files/6/8611/epd332.pdf on 9 April 2014.
4. AXPO (2011). Environmental Product Declaration: Otelfingen Kompogas Facility, 21 pages Retrieved from http://gryphon.environdec.com/data/files/6/8789/epd176_Axpo_Otelfingen_Kompogas_Facility_2012.pdf on 9 April 2014.
5. AXPO (2012). Environmental Product Declaration: Wildegg-Brugg Run-of-River Power Plant, 21 pages. Retrieved from http://gryphon.environdec.com/data/files/6/9037/epd205_Axpo_Wildegg_Brugg.pdf on 9 April 2014.
6. AXPO NEW ENERGIES (2008). Environmental Product Declaration: Genesys Plant Busslingen, 24 pages. Retrieved from http://gryphon.environdec.com/data/files/6/8319/epd263en.pdf on 9 April 2014.
7. AXPO NUCLEAR ENERGY (2011). Environmental Product Declaration: Beznau Nuclear Power Plant - Update 2011, 40 pages. Retrieved from http://gryphon.environdec.com/data/files/6/7562/epd144en_v2.pdf on 9 April 2014.
8. BADEA, A.A., VODA, I. and DINCA, C.F. (2010). Comparative Analysis Of Coal, Natural Gas and Nuclear Fuel Life Cycles By Chains of Electrical Energy Production. U.P.B. Sci. Bull., Series C 72(2), 221-238.
9. BAUER, C. (2007) Holzenergie. In: Sachbilanzen von Energiesystemen: Grundlagen für den ökologischen Vergleich von Energiesystemen und den Einbezug von Energiesystemen in Ökobilanzen für die Schweiz (ed. Dones R.). Swiss Centre for Life Cycle Inventories, Dübendorf, CH. [Ecoinvent Report No. 6 - wood-based cogeneration].
10. BOLLIGER R. and BAUER C. (2007) Wasserkraft. In: Sachbilanzen von Energiesystemen: Grundlagen für den ökologischen Vergleich von Energiesystemen und den Einbezug von Energiesystemen in Ökobilanzen für die Schweiz (ed. Dones R.). Swiss Centre for Life Cycle Inventories, Dübendorf, CH. [Ecoinvent Report No. 6, part VIII - hydropower].
11. BURGER B. and BAUER C. (2007) Windkraft. In: Sachbilanzen von Energiesystemen: Grundlagen für den ökologischen Vergleich von Energiesystemen und den Einbezug von Energiesystemen in Ökobilanzen für die Schweiz (ed. Dones R.). Swiss Centre for Life Cycle Inventories, Dübendorf, CH. [Ecoinvent Report No. 6, part XIII - wind energy].
12. BUTNAR, I., RODRIGO, J., GASOL, C.M. and CASTELLS, F. (2010). Life-cycle assessment of electricity from biomass: Case studies of two biocrops in Spain. Biomass & Bioenergy, 34(12), 1780-1788.
13. DONES R., BAUER C. and DOKA G. (2009) Kernkraft. Data v2.1 In: Sachbilanzen von Energiesystemen: Grundlagen für den ökologischen Vergleich von Energiesystemen und den Einbezug von Energiesystemen in Ökobilanzen für die Schweiz (ed. Dones R.). Swiss Centre for Life Cycle Inventories, Dübendorf, CH. [Ecoinvent Report No. 6, partie VII – nuclear].
14. ELAQUA AG (2009). Environmental Product Declaration. Au-Schönenberg Small-Scale Hydro Power Plant, 24 pages. Retrieved from http://gryphon.environdec.com/data/files/6/7871/epd262.pdf on 9 April 2014.
15. FAIST EMMENEGGER M., HECK T. and JUNGBLUTH N. (2007) Erdgas. In: Sachbilanzen von Energiesystemen: Grundlagen für den ökologischen Vergleich von Energiesystemen und den Einbezug von Energiesystemen in Ökobilanzen für die Schweiz (ed. Dones R.). Swiss Centre for Life Cycle Inventories, Dübendorf, CH. [Ecoinvent Report No. 6 - gas-fired thermal].
16. FAIX, A., SCHWEINLE, J., SCHÖLL, S., BECKER, G. and MEIER, D. (2010). (GTI-tcbiomass) Life-cycle assessment of the BTO® process (biomass-to-oil) with combined heat and power generation. Environmental Progress & Sustainable Energy, 29(2), 193-202.

Hydro-Québec Technical Report
November 2014 COMPARING POWER GENERATION OPTIONS AND ELECTRICITY MIXES Page 45
17. GARRETT, P. and RØNDE, K. (2012). Life cycle assessment of wind power: comprehensive results from a state-of-the-art approach. International Journal of Life Cycle Assessment, 1-12.
18. GUEST, G., BRIGHT, R.M., CHERUBINI, F., MICHELSEN, O. and ANDERS HAMMER, S. (2011). Life Cycle Assessment of Biomass-based Combined Heat and Power Plants. Journal of Industrial Ecology, 15(6), 908-921.
19. JESWANI, H.K., GUJBA, H. and AZAPAGIC, A. (2011). Assessing Options for Electricity Generation from Biomass on a Life Cycle Basis: Environmental and Economic Evaluation. Waste and Biomass Valorization, 2(1), 33-42.
20. JUNGBLUTH N. (2007) Erdöl. In: Sachbilanzen von Energiesystemen: Grundlagen für den ökologischen Vergleich von Energiesystemen und den Einbezug von Energiesystemen in Ökobilanzen für die Schweiz (ed. Dones R.). Swiss Centre for Life Cycle Inventories, Dübendorf, CH. [Ecoinvent Report No. 6 - oil-fired thermal].
21. JUNGBLUTH N., STUCKI M. and FRISCHKNECHT R. (2009) Photovoltaics. Data v2.1 In: Sachbilanzen von Energiesystemen: Grundlagen für den ökologischen Vergleich von Energiesystemen und den Einbezug von Energiesystemen in Ökobilanzen für die Schweiz (ed. Dones R.). Swiss Centre for Life Cycle Inventories, Dübendorf, CH. [Ecoinvent Report No. 6 - photovoltaic solar].
22. KOORNNEEF, J., VAN KEULEN, T., FAAIJ, A. and TURKENBURG, W. (2008). Life cycle assessment of a pulverized coal power plant with post-combustion capture, transport and storage of CO2. International Journal of Greenhouse Gas Control, 2(4), 448-467.
23. KORONEOS, C.J., PIPERIDIS, S.A., TATATZIKIDIS, C.A. and ROVAS, D.C. (2008). Life Cycle Assessment of a Solar Thermal Concentrating System, WSEAS Conferences in Spain. September 2008, 209-217
24. LECHÓN, Y., DE LA RÚA, C. and SÁEZ, R. (2008). Life cycle environmental impacts of electricity production by solarthermal power plants in Spain. Journal of Solar Energy Engineering, Transactions of the ASME, 130(2) 0210121-0210127.
25. MARTÍNEZ, E., SANZ, F., PELLEGRINI, S., JIMÉNEZ, E. and BLANCO, J. (2009). Life-cycle assessment of a 2-MW rated power wind turbine: CML method. International Journal of Life Cycle Assessment, 14(1), 52-63.
26. PEHNT, M. and HENKEL, J. (2009). Life cycle assessment of carbon dioxide capture and storage from lignite power plants. International Journal of Greenhouse Gas Control, 3(1), 49-66.
27. RÖDER A., BAUER C. and DONES R. (2007) Kohle. In: Sachbilanzen von Energiesystemen: Grundlagen für den ökologischen Vergleich von Energiesystemen und den Einbezug von Energiesystemen in Ökobilanzen für die Schweiz (ed. Dones R.). Swiss Centre for Life Cycle Inventories, Dübendorf, CH. [Ecoinvent Report No. 6, part VII - coal-fired thermal].
28. ROEDL, A. (2010). Production and energetic utilization of wood from short rotation coppice—a life cycle assessment. The International Journal of Life Cycle Assessment, 15(6), 567-578.
29. SINGH, B., STROMMAN, A.H. and HERTWICH, E. (2011). Life cycle assessment of natural gas combined cycle power plant with post-combustion carbon capture, transport and storage. International Journal of Greenhouse Gas Control, 5(3), 457-466.
30. VATTENFALL (2011). Certified Environmental Product Declaration EPD® of Electricity from Vattenfall’s Nordic Hydropower, S-P-00088, 2011-12-31, Vattenfall AB, Sweden, 63 pages. Retrieved from http://gryphon.environdec.com/data/files/6/7470/epd88_v2011.pdf on 26 June 2014.
31. VATTENFALL (2013a). Certified Environmental Product Declaration EPD® of Electricity from Forsmark Nuclear Power Plant. Version 1.2 S-P 0021 2013-03-27. Vattenfall AB Nuclear Power, Sweden, 52 pages. Retrieved from http://gryphon.environdec.com/data/files/6/9914/epd21_Vattenfall_Forsmark_Nuclear_Power_Plant_2014-03-27.pdf on 26 June 2014.
32. VATTENFALL (2013b) Certified Environmental Product Declaration EPD® of Electricity from Vattenfall’s Nordic Wind Farms. S-P-00183, 2013-02-01, Vattenfall AB, Sweden, 46 pages. Retrieved from http://gryphon.environdec.com/data/files/6/9018/epd183_Vattenfall_Nordic_Wind_2013.pdf on 26 June 2014.

© ILC Chair
Page 46 COMPARING POWER GENERATION OPTIONS AND ELECTRICITY MIXES November 2014
33. VATTENFALL (2013c) Certified Environmental Product Declaration EPD® of Electricity from Vattenfall’s Wind Farms in the UK. S-P-00515, 2013-12-31, Vattenfall AB, Sweden, 42 pages. Retrieved from http://gryphon.environdec.com/data/files/6/9781/epd517_Vattenfall_Wind_UK.pdf on 26 June 2014.
34. VATTENFALL (2014) Certified Environmental Product Declaration EPD® of Electricity from Rinhals Nuclear Power Plant, version 1.2 S-P-00026, 2014-03-27, Vattenfall AB, Sweden, 52 pages. Retrieved from http://gryphon.environdec.com/data/files/6/7470/epd88_v2011.pdf on 26 June 2014.
35. WAGNER, H.-J., BAACK, C., EICKELKAMP, T., EPE, A., LOHMANN, J. and TROY, S. (2011). Life cycle assessment of the offshore wind farm alpha ventus. Energy, 36(5), 2459-2464.

Hydro-Québec Technical Report
November 2014 COMPARING POWER GENERATION OPTIONS AND ELECTRICITY MIXES Page 47
Appendix A: COMPARATIVE DATASHEETS

© ILC Chair
Page 48 COMPARING POWER GENERATION OPTIONS AND ELECTRICITY MIXES November 2014
Datasheet Comparison of power generation
options Comparison of electricity mixes
LCI Database ecoinvent 2.2 ecoinvent 3.01
LCIA Method CML V3.01 IMPACT WORLD+
Climate Change X X
Ozone Layer Depletion X
Acidification X
Eutrophication X
Human Toxicity X
Photochemical Oxidation (smog) X
Resource Depletion X X
Human Health X
Ecosystem Quality X
The following pages contain the datasheets comparing generation options
and electricity mixes according to environmental indicators.
Page numbering will be suspended in this section so that the datasheets can stand
on their own.

Comparing Generation Options and Electricity Mixes 1 Indicator: Climate Change
HYDRO-QUÉBEC COMPARING GENERATION OPTIONS AND ELECTRICITY MIXES
Prepared by CIRAIG – International Reference Centre for the Life Cycle of Products, Processes and
Services Date November 2014
To facilitate life-cycle-based comparison of the electric power generated or distributed by Hydro-Québec with that generated by other means or distributed in other parts of the world, a series of nine datasheets has been produced. Each presents the results for one of the following environmental indicators: Climate Change, Ozone Layer Depletion, Acidification, Eutrophication, Human Toxicity, Resource Depletion, Photochemical Oxidation, Human Health and Ecosystem Quality. This datasheet deals with the indicator "Climate Change".
CLIMATE CHANGE
The Climate Change (or Global Warming Potential) indicator measures the impacts of atmospheric greenhouse gas (GHG) emissions. Generally speaking, the impacts of GHG emissions are assessed using the method developed by the Intergovernmental Panel on Climate Change (IPCC). In this method the global warming potential (GWP) of each GHG, in relation to that of CO2, is calculated on the basis of its radiative forcing capacity, and the GWP, which is a type of characterization factor, is used to convert the emissions into kilograms of carbon dioxide equivalent (kg CO2 eq.).
Because we are dealing with comparisons, it is important to note that certain methodological choices can cause the results to vary from one study to the next.
The IPCC periodically updates the list of GHGs and their GWP values in light of recent advances in climate science; for example, 1 kg of methane went from 21 kg CO2 eq. in 1996 (IPCC, 1996) to 36 kg CO2 eq. in the latest version (IPCC, 2013). The studies consulted for this datasheet may have used either of these values without stating which.
Another factor has to do with the timespan over which the GWP is calculated. A 100-year horizon is common, but some impact assessment methods use a 500-year horizon, which will change the GWP for a given substance. A substance with a high GWP but a short atmospheric lifetime will have a greater relative impact if a shorter timespan is chosen. For example, the CO2 equivalency of 1 kg of methane (which decays after less than 10 years in the atmosphere) is 25 kg over a 100-year horizon but 7.6 kg over a 500-year horizon and 72 kg over a 20-year horizon (IPCC, 2007). The studies consulted may have used any of these values without stating which.
Yet another choice is whether or not to take into account the eventual transformation of certain GHGs into CO2. Methane (CH4), for instance, has an atmospheric life of about 10 years, during which it has a warming effect according to its GWP as explained above. It then decays to CO2, which in turn will contribute to global warming but to a lesser extent. Most of the studies published to date do not take this transformation into account, even though the IPCC, in its most recent update, recommends including it.
The Climate Change indicator applies on a global scale, since some of the substances emitted persist long enough in the atmosphere to spread around the planet.
Comparison of generation options
In this datasheet, the comparison of options has to do with power generation only; it excludes all aspects of power transmission and distribution.
To produce this comparative analysis, all data available in the literature, in environmental product declarations and in the ecoinvent v2.2 database (www.ecoinvent.org/database/) were compiled and compared with data for Hydro-Québec's hydroelectric generating fleet (specific data for 2012).

Comparing Generation Options and Electricity Mixes 2 Indicator: Climate Change
For this indicator, the options for which environmental data were compiled include renewables like hydropower, wind, biogas, biomass, thermal solar, photovoltaic solar, tidal energy, wave energy and geothermal energy, as well as non-renewables such as nuclear, coal, oil and natural gas.
Given the importance of reservoir emissions, the two main types of hydropower—reservoir and run-of-river—were dealt with separately.
Figure 1 shows the life cycle GHG emissions of a kWh of electricity generated by the different options. The median values and standard deviations indicate the variability calculated on the basis of the studies consulted. Some of the variability is due to the methodological choices explained earlier.
Figure 1: Comparison of results for a kWh generated by different options, based on the indicator Climate
Change The histograms show the median values for the results inventoried.
"Number of points" means the number of observations for each option.
The main substances impacting this indicator are CO2 and CH4, both of which come primarily from combustion—not only of fossil fuels such as coal, oil and natural gas but also of renewables (biomass and biogas). CO2 and CH4 emissions are also caused by changes in land use (land clearing, carbon sequestration or carbon loss from soil) and hydropower reservoirs. Reservoirs are in fact the leading source of emissions for hydropower, although emissions are not always measured in the studies. In boreal regions, most of the emissions are produced in the first decade after impoundment, then they decrease to a level similar to that of surrounding natural lakes.
The following highlights can be noted:
The options can be grouped into three main ranges of values: fossil fuels (coal, oil and natural gas), with emissions produced through combustion; renewables, which emit low levels of GHGs but have a greater impact in the manufacturing stage (biogas, solar, geothermal); and lastly, wind, nuclear and hydroelectric power, which have a very low impact since they emit practically no GHGs during power generation.

Comparing Generation Options and Electricity Mixes 3 Indicator: Climate Change
The wide range of technologies used in thermal options introduces a high level of variability into the results, especially in the case of natural gas and coal, for which some generating stations have carbon capture systems that significantly reduce CO2 emissions. The natural gas option also has the possibility of combined cycle technology; such plants have lower impacts than conventional plants, mainly due to greater efficiency.
The Hydro-Québec kWh generated in reservoir and run-of-river power stations has a Climate Change indicator that is slightly higher (17 and 6 g CO2 eq. respectively) than the reservoir and run-of-river hydropower found in the literature (5 and 3 g CO2 eq. respectively). This is because the Hydro-Québec study took into account additional emissions, including the GHGs emitted by reservoirs in the first 10 years after impoundment. Hydro-Québec's approach is conservative, since it considers gross reservoir emissions in the first 10 years as recommended by the IPCC (IPCC, 2006). It should be emphasized that reservoir GHG emissions vary widely according to geographical region and how they are calculated. Moreover, the level of emissions depends largely on the size of the reservoir and the capacity of its generating station.
Comparison of electricity mixes
The electricity mix is what is delivered to the customer. In Québec, the mix includes power generated by Hydro-Québec, electricity purchased from private producers, and imports. More generally, the electricity mix in a given region includes, proportionately, all the options used to generate the electricity distributed to the consumer. Power transmission and distribution are also included.
Figure 2 shows the GHG emissions of the electricity mixes in several regions (Canadian provinces, NERC regions in the U.S.,1 or countries) compared to that of Québec in 2012. The environmental data were taken from the ecoinvent v 3.0 life cycle inventory database (www.ecoinvent.org/database/) and compared with the specific Hydro-Québec data for 2012.
Figure 3 shows the GHG emissions of generating facilities in the U.S. Northeast as well as those of Hydro-Québec Production in 2012. This figure does not include emissions from facilities located outside the states in question or, in the case of Hydro-Québec Production, from power generation by off-grid systems and private producers in Québec. The mixes for states in the U.S. Northeast were provided by the U.S. Energy Information Administration, while the mix for Hydro-Québec Production was obtained from Hydro-Québec. Power transmission is also taken into account.
1 The regions in the North American electrical grid correspond to the eight regional entities overseen by the North American Electric Reliability Corporation (NERC), and encompass Canada, the U.S. and part of Mexico. However, the electricity mixes considered in this study are based solely on electricity generated in the U.S. FRCC: Florida Reliability Coordinating Council; MRO: Midwest Reliability Organization; NPCC: Northeast Power Coordinating Council; RFC: Reliability First Corporation; SERC: SERC Reliability Corporation; SPP: Southwest Power Pool; TRE: Texas Reliability Entity (or ERCOT) ; WECC: Western Electricity Coordinating Council.

Comparing Generation Options and Electricity Mixes 4 Indicator: Climate Change
Figure 2: Comparison of results for a kWh distributed in different regions, based on the Climate Change indicator (IPCC 2007 GWP values, 100 years)
It can be seen that a kWh distributed in Québec is among those with the lowest Climate Change indicator, at 22 g CO2 eq./kWh based on 2012 data. It is comparable to that of other regions where the electricity mix contains a large hydropower component, including Manitoba (31 g CO2 eq./kWh) and Norway (25 g CO2 eq./kWh).
These are followed by regions where the mix includes a large proportion of renewables and nuclear energy, such as Sweden, British Columbia, Ontario, France and Brazil.
Finally, in regions where the electricity mix is largely based on fossil fuels, such as China, India and the U.S. Midwest (MRO), the potential Climate Change impacts are 50 times those of the Québec electricity mix.

Comparing Generation Options and Electricity Mixes 5 Indicator: Climate Change
Figure 3: Comparison of results for a kWh generated in northeastern states and by Hydro-Québec Production, based on the indicator Climate Change (IPCC 2007 GWP values, 100 years)
As was the case for the kWh distributed in Québec (Figure 2), emissions for each kWh generated by Hydro-Québec Production in 2012 (19 g CO2 eq./kWh) compare favorably with the emissions from generating facilities in the U.S. Northeast. Vermont, too, with its large proportion of nuclear energy, has a very low Climate Change indicator (34 g CO2 eq./kWh); however, it is highly dependent on imports to meet its electricity needs.
Details on the data used in these analyses can be found in the accompanying report, Comparing Power Generation Options and Electricity Mixes (November 2014). The report includes a summary of the life cycle assessment (LCA) of Québec electricity, a description of each generation option, and the compositions of the electricity mixes compared. It also explains the LCA method and lists the most common environmental indicators, as well as the bibliographic references used in the comparison of generation options.

Comparing Generation Options 1 Indicator: Ozone Layer Depletion
HYDRO-QUÉBEC COMPARING GENERATION OPTIONS
Prepared by CIRAIG – International Reference Centre for the Life Cycle of Products, Processes and
Services Date November 2014
To facilitate life-cycle-based comparison of the electric power generated or distributed by Hydro-Québec with that generated by other means or distributed in other parts of the world, a series of nine datasheets has been produced. Each presents the results for one of the following environmental indicators: Climate Change, Ozone Layer Depletion, Acidification, Eutrophication, Human Toxicity, Resource Depletion, Photochemical Oxidation, Human Health and Ecosystem Quality. This datasheet deals with the indicator "Ozone Layer Depletion".
OZONE LAYER DEPLETION
The Ozone Layer Depletion indicator measures the emission of substances that destroy stratospheric ozone, which results in more ultraviolet (UV) rays reaching the earth. This has several impacts on human health, such as cataracts and skin cancer, and may also affect animals as well as terrestrial and aquatic ecosystems. Ozone-depleting substances (ODS) generally contain chlorine, fluorine, bromine, carbon, and hydrogen in varying proportions and are often described by the general term halocarbons. Chlorofluorocarbons (CFCs), carbon tetrachloride and methyl chloroform are major human-produced ozone-depleting gases that have been used in many applications including refrigeration, air conditioning, foam blowing, cleaning of electronics components, and as solvents.1
This indicator is usually quantified using the model developed by the World Meteorological Organization (WMO), in which the ozone depleting potential (ODP) of a substance is calculated and, based on characterization factors, converted into kilograms of trichlorofluoromethane equivalent (kg CFC-11 eq.).
Because we are dealing with comparisons, it is important to note that certain methodological choices can cause the results to vary from one study to the next.
The Ozone Layer Depletion indicator applies on a global scale, since some of the substances emitted persist long enough in the atmosphere to spread across the planet.
Comparison of generation options
In this datasheet, the comparison of options has to do with power generation only; it excludes all aspects of power transmission and distribution.
To produce this comparative analysis, all data available in the literature, in environmental product declarations and in the ecoinvent v2.2 database (www.ecoinvent.org/database/) were compiled and compared with data for Hydro-Québec's hydroelectric generating fleet (specific data for 2012).
For this indicator, the options for which environmental data were compiled include renewables like hydropower, wind, biogas, biomass, concentrated solar, photovoltaic solar, tidal energy, wave energy and geothermal energy, as well as non-renewables such as nuclear, coal, oil and natural gas.
1 Environment Canada (2013). Ozone-Depleting Substances. Retrieved from https://www.ec.gc.ca/ozone/default.asp?lang=En&n=D57A0006-1 in June 2014.

Comparing Generation Options and Electricity Mixes 2 Indicator: Ozone Layer Depletion
Figure 1 shows the life cycle ODS emissions for one kilowatthour of electricity generated by the different options. The median values and standard deviations indicate the variability calculated on the basis of the studies consulted. The high variability of nuclear and natural gas is attributable to the following factors:
Differences between nuclear technologies: the lowest value is for a technology based on natural uranium, since the uranium enrichment process emits large quantities of CFC-114, a gas with a high ODP.
The origin of the natural gas and the distance over which it is transported: technologies using gas from Russia have higher emissions than those using gas from other regions.
Figure 1: Comparison of results for a kWh generated by different options, based on the indicator Ozone
Layer Depletion The histograms show the median values for the results inventoried.
"Number of points" means the number of observations for each option.
The primary sources of ODSs are the production of certain fossil fuels (especially oil), uranium enrichment processes, coke gas production and natural gas transportation.
The following highlights can be noted:
The options can be grouped into three main value ranges: the first, comprising nuclear, oil and natural gas, has the highest emissions, due to the extraction, production and transportation of fuel. The second, consisting of coal, photovoltaic solar, concentrated solar, biomass and biogas, has impacts that are only one tenth those of the first group. ODS emissions in this group are caused by equipment manufacture (this is the case for solar power) or by fossil fuel combustion during secondary activities (biomass and coal). The third group is made up of hydropower and wind power, with very low indicators (500 times less than that of oil); their potential impacts are attributable to the combustion of oil and natural gas during secondary activities.

Comparing Generation Options and Electricity Mixes 3 Indicator: Ozone Layer Depletion
The kWh generated by Hydro-Québec hydropower has an Ozone Layer Depletion indicator (0.23 µg CFC-11 eq./kWh on average) similar to that found in the literature for hydropower (0.21 µg CFC-11 eq./kWh on average).
Details on the data used in these analyses can be found in the accompanying report, Comparing Power Generation Options and Electricity Mixes (November 2014). The report includes a summary of the life cycle assessment (LCA) of Québec electricity, a description of each generation option, and the compositions of the electricity mixes compared. It also explains the LCA method and lists the most common environmental indicators, as well as the bibliographic references used in the comparison of generation options.

Comparing Generation Options 1 Indicator: Acidification
HYDRO-QUÉBEC COMPARING GENERATION OPTIONS
Prepared by CIRAIG – International Reference Centre for the Life Cycle of Products, Processes and
Services Date November 2014
To facilitate life-cycle-based comparison of the electric power generated or distributed by Hydro-Québec with that generated by other means or distributed in other parts of the world, a series of nine datasheets has been produced. Each presents the results for one of the following environmental indicators: Climate Change, Ozone Layer Depletion, Acidification, Eutrophication, Human Toxicity, Resource Depletion, Photochemical Oxidation, Human Health and Ecosystem Quality. This datasheet deals with the indicator "Acidification".
ACIDIFICATION
Acidifying substances can have impacts on soil, underground and surface water, organisms, ecosystems and property. The acidifying potential of an atmospheric emission is calculated and, based on characterization factors, converted into kilograms of sulphur dioxide equivalent (kg SO2 eq.).
The Acidification indicator applies on a regional scale, since the substances do not travel from one continent to another.
There is some variation in how the acidification of terrestrial and aquatic environments is modeled. Some methods consider only the acidifying potential of a substance (i.e., the production of hydrogen ions, H+). Others use more sophisticated models that take into account the substance's atmospheric behavior—by modeling its molecular dispersion and reactions—as well as its effect on the environment.
In this datasheet, the data used in the comparison were taken from the literature. All published data were compiled with no attention to the method used to calculate the indicator, since this information is rarely available.
Comparison of generation options
In this datasheet, the comparison of options has to do with power generation only; it excludes all aspects of power transmission and distribution.
To produce this comparative analysis, all data available in the literature, in environmental product declarations and in the ecoinvent v2.2 database (www.ecoinvent.org/database/) were compiled and compared with data for Hydro-Québec's hydroelectric generating fleet (specific data for 2012).
For this indicator, the options for which environmental data were compiled include renewables like hydropower, wind, biogas, biomass, concentrated solar, photovoltaic solar, tidal energy, wave energy and geothermal energy, as well as non-renewables such as nuclear, coal, oil and natural gas.
Figure 1 shows the life cycle acidifying potential of one kilowatthour of electricity generated by the different options. The median values and standard deviations indicate the variability calculated on the basis of the studies consulted. Some of the variability is due to the amalgamation of indicators modeled very differently, as explained above. The different technologies, too, introduce considerable variability, especially for natural gas and coal. The standard deviation for biogas is influenced by the raw material and technology used to produce the biogas. Similarly, the type of gas (natural vs. coke gas) and the type of biomass (wood, crops) contribute to the variability of those generation options. Boiler capacity in power plants also has a significant impact on the results for biomass.

Comparing Generation Options 2 Indicator: Acidification
Figure 1: Comparison of results for a kWh generated by different options, based on the indicator
Acidification The histograms show the median values for the results inventoried.
"Number of points" means the number of observations for each option
The primary sources of acidifying substances are the combustion of coal and oil (SO2 emissions), natural gas and, to a lesser extent, biomass (nitrous oxide emissions) (NOx).
The following highlights can be noted:
The options can be grouped into four main ranges of values: the first, comprising oil, coal, biogas and natural gas, has the highest potential impacts (1 to 6 g SO2 eq./kWh) and the widest variability due to the different technologies used to process stack emissions and the different fuel sources). The second is biomass, which has indicator values around 1 g SO2 eq./kWh. The third group has indicator values between 0.1 and 0.4 g SO2 eq./kWh, and is made up of renewables (solar and geothermal). Lastly, the fourth group, with less than 0.1 g SO2 eq./kWh, is made up of wind, nuclear and hydropower.
These last two groups are characterized by the absence of combustion for power generation. As explained above, most acidifying emissions are attributable to combustion, which accounts for the low impacts not only of renewables—hydropower, wind, solar, geothermal—but also of nuclear power.
The kWh generated by Hydro-Québec hydropower has the same Acidification indicator (0.013 g SO2 eq./kWh on average) as the hydropower in the literature (0.013 g SO2 eq./kWh on average).
In generation options with a low Acidification indicator (hydropower, solar, etc.), the potential impacts stem from the use of energy in secondary processes.
Details on the data used in these analyses can be found in the accompanying report, Comparing Power Generation Options and Electricity Mixes (November 2014). The report includes a summary of the life cycle assessment (LCA) of Québec electricity, a description of each generation option, and the compositions of the electricity mixes compared. It also explains the LCA method and lists the most common environmental indicators, as well as the bibliographic references used in the comparison of generation options.

Comparing Generation Options 1 Indicator: Eutrophication
HYDRO-QUÉBEC COMPARING GENERATION OPTIONS
Prepared by CIRAIG – International Reference Centre for the Life Cycle of Products, Processes and
Services Date November 2014
To facilitate life-cycle-based comparison of the electric power generated or distributed by Hydro-Québec with that generated by other means or distributed in other parts of the world, a series of nine datasheets has been produced. Each presents the results for one of the following environmental indicators: Climate Change, Ozone Layer Depletion, Acidification, Eutrophication, Human Toxicity, Resource Depletion, Photochemical Oxidation, Human Health and Ecosystem Quality. This datasheet deals with the indicator "Eutrophication".
EUTROPHICATION
Eutrophication means the alteration and degradation of an aquatic environment through the addition of excessive nutrients. Although very slow eutrophication can occur naturally, the indicator discussed here refers to substances capable of artificially accelerating the process. The main nutrients at cause are nitrogen (mostly from fertilizers and wastewater) and phosphorus (mostly derived from phosphates in wastewater), both of which, when present in high concentrations, encourage the growth of algae and other aquatic plants. This leads to overcrowding, oxygen depletion and reduced biodiversity.
The eutrophication potential of a substance is calculated and, based on characterization factors, converted into kilograms of phosphate equivalent (kg PO4 eq.).1
This indicator applies on a regional or local scale since eutrophying substances do not travel from one continent to another.
Comparison of generation options
In this datasheet, the comparison of options has to do with power generation only; it excludes all aspects of power transmission and distribution.
To produce this comparative analysis, all data available in the literature, in environmental product declarations and in the ecoinvent v2.2 database (www.ecoinvent.org/database/) were compiled and compared with data for Hydro-Québec's hydroelectric generating fleet (specific data for 2012).
For this indicator, the options for which environmental data were compiled include renewables like hydropower, wind, biogas, biomass, concentrated solar, photovoltaic solar, tidal energy, wave energy and geothermal energy, as well as non-renewables such as nuclear, coal, oil and natural gas.
Figure 1 shows the life cycle shows the Eutrophication indicator for one kilowatthour of electricity generated by the different options. The median values and standard deviations indicate the variability calculated on the basis of the studies consulted. The high variability of coal, natural gas and biogas is attributable to differences between the technologies and fuels used (lignite or anthracite coal, in particular).
1 The CML 2001 method (Leiden Universiteit, CML-IA Characterisation Factors, retrieved from http://cml.leiden.edu/software/data-cmlia.html#downloads), very widely used in LCA studies, does not take into account the behavior of eutrophying substances (modeling of molecular dispersion and reactions in the environment) or their effects (exposure levels of host environments).

Comparing Generation Options 2 Indicator: Eutrophication
Figure 1: Comparison of results for a kWh generated by different options, based on the indicator
Eutrophication The histograms show the median values for the results inventoried.
"Number of points" means the number of observations for each option.
The main sources of eutrophying substances are phosphate and nitrogen emissions. In power generation, phosphates are emitted mainly during coal extraction, whereas nitrogen emissions are linked to the combustion of natural gas and, to a lesser extent, biomass (NOx emissions).
The following highlights can be noted:
Options involving combustion (coal, oil, biogas, biomass and natural gas) and photovoltaic solar have the highest values due to the emission of nitrogen during fuel production and combustion, as well as in the manufacture of photovoltaic panels. Most of the renewables (geothermal, concentrated solar, wind and hydropower), along with nuclear, have values at the low end of the scale, since eutrophying substances occur only marginally during secondary processes.
The kWh generated by Hydro-Québec hydropower has a Eutrophication indicator (3.7 mg PO4 eq./kWh on average) that is only about one fourth the indicator for hydropower found in the literature (17 mg PO4 eq./kWh on average). The difference is due to the fact that some studies take into account the decaying of organic matter following reservoir impoundment, which significantly raises the indicator. The median value for Hydro-Québec hydropower is similar to that found in the literature (3.7 and 6 mg PO4 eq./kWh respectively).
Details on the data used in these analyses can be found in the accompanying report, Comparing Power Generation Options and Electricity Mixes (November 2014). The report includes a summary of the life cycle assessment (LCA) of Québec electricity, a description of each generation option, and the compositions of the electricity mixes compared. It also explains the LCA method and lists the most common environmental indicators, as well as the bibliographic references used in the comparison of generation options.

Comparing Generation Options 1 Indicator: Human Toxicity
HYDRO-QUÉBEC COMPARING GENERATION OPTIONS
Prepared by CIRAIG – International Reference Centre for the Life Cycle of Products, Processes and
Services Date November 2014
To facilitate life-cycle-based comparison of the electric power generated or distributed by Hydro-Québec with that generated by other means or distributed in other parts of the world, a series of nine datasheets has been produced. Each presents the results for one of the following environmental indicators: Climate Change, Ozone Layer Depletion, Acidification, Eutrophication, Human Toxicity, Resource Depletion, Photochemical Oxidation, Human Health and Ecosystem Quality. This datasheet deals with the indicator "Human Toxicity".
HUMAN TOXICITY
The Human Toxicity indicator measures the emission of substances with toxic effects on the human environment. Risks associated with workplace exposure are not included in the effects modeled.
The human toxicity potential of a substance is calculated and, based on characterization factors, converted into kilograms of 1,4-dichlorobenzene equivalent (kg 1,4-DB eq.).
This indicator applies on a scale ranging from local to global, depending on the behavior of the substance. Some substances have only a local effect because do not persist very long or travel very far, while others remain in the atmosphere longer and can spread across the planet.
Comparison of generation options
In this datasheet, the comparison of options has to do with power generation only; it excludes all aspects of power transmission and distribution.
To produce this comparative analysis, all data available in the literature, in environmental product declarations and in the ecoinvent v2.2 database (www.ecoinvent.org/database/) were compiled and compared with data for Hydro-Québec's hydroelectric generating fleet (specific data for 2012).
For this indicator, the options for which environmental data were compiled include renewables like hydropower, wind, biogas, biomass, concentrated solar, photovoltaic solar, tidal energy, wave energy and geothermal energy, as well as non-renewables such as nuclear, coal, oil and natural gas.
Figure 1 shows the life cycle Human Toxicity indicator for one kilowatthour of electricity generated by the different options. The median values and standard deviations indicate the variability calculated on the basis of the studies consulted. The high variability of coal and natural gas is attributable to differences between the technologies modeled and the fuels used (type and origin).

Comparing Generation Options 2 Indicator: Human Toxicity
Figure 1: Comparison of results for a kWh generated by different options, based on the Human Toxicity indicator
The histograms show the median values for the results inventoried. "Number of points" means the number of observations for each option.
The main substances having a toxic effect on humans are metals and compounds such as benzene. Benzene is involved in certain production activities (natural gas) while metals are emitted during the extraction and use of fuels and other materials (coal, uranium, iron, copper, etc.).
The following highlights can be noted:
The options can be grouped into three ranges of values: the first group contains only coal, with the highest human toxicity potential (median of over 100 g 1,4-DB eq./kWh) as well as the highest variability in indicator values. The second, consisting of oil, nuclear, solar, wind, biomass and biogas, has indicators ranging from 25 to 100 g 1,4-DB eq./kWh. The third group is made up of hydropower and natural gas, with very low indicators (less than 10 g 1,4-DB eq./kWh), although natural gas does have a very high variability.
The kWh generated by Hydro-Québec hydropower has a Human Toxicity indicator (2 g 1,4-DB eq./kWh on average) in the same range as that found in the literature (7 g 1,4-DB eq./kWh on average).
Details on the data used in these analyses can be found in the accompanying report, Comparing Power Generation Options and Electricity Mixes (November 2014). The report includes a summary of the life cycle assessment (LCA) of Québec electricity, a description of each generation option, and the compositions of the electricity mixes compared. It also explains the LCA method and lists the most common environmental indicators, as well as the bibliographic references used in the comparison of generation options.

Comparing Generation Options 1 Indicator: Photochemical Oxidation
HYDRO-QUÉBEC COMPARING GENERATION OPTIONS
Prepared by CIRAIG – International Reference Centre for the Life Cycle of Products, Processes and
Services Date November 2014
To facilitate life-cycle-based comparison of the electric power generated or distributed by Hydro-Québec with that generated by other means or distributed in other parts of the world, a series of nine datasheets has been produced. Each presents the results for one of the following environmental indicators: Climate Change, Ozone Layer Depletion, Acidification, Eutrophication, Human Toxicity, Resource Depletion, Photochemical Oxidation, Human Health and Ecosystem Quality. This datasheet deals with the indicator "Photochemical Oxidation".
PHOTOCHEMICAL OXIDATION (SMOG)
Photochemical Oxidation, or summer smog,1 is the formation of reactive substances—primarily ozone—that are harmful to human health, ecosystems and crops. The photochemical oxidation potential of a substance emitted into the atmosphere is calculated and, based on characterization factors, converted into kilograms of ethylene equivalent (kg C2H4 eq.).
This indicator applies on a scale ranging from local to global, depending on the behavior of the substance. Some substances have only a local effect because do not persist very long or travel very far, while others remain in the atmosphere longer and can spread across the planet.
Comparison of generation options
In this datasheet, the comparison of options has to do with power generation only; it excludes all aspects of power transmission and distribution.
To produce this comparative analysis, all data available in the literature, in environmental product declarations and in the ecoinvent v2.2 database (www.ecoinvent.org/database/) were compiled and compared with data for Hydro-Québec's hydroelectric generating fleet (specific data for 2012).
For this indicator, the options for which environmental data were compiled include renewables like hydropower, wind, biogas, biomass, concentrated solar, photovoltaic solar, tidal energy, wave energy and geothermal energy, as well as non-renewables such as nuclear, coal, oil and natural gas.
Figure 1 shows the Photochemical Oxidation indicator for one kilowatthour of electricity generated by the different options. The median values and standard deviations indicate the variability calculated on the basis of the studies consulted. The high variability of natural gas, oil, coal and biogas is attributable to differences between the technologies modeled and the fuels used.
1 Winter smog is not taken into account in this indicator.

Comparing Generation Options 2 Indicator: Photochemical Oxidation
Figure 1: Comparison of results for a kWh generated by different options, based on the Photochemical Oxidation (smog) indicator
The histograms show the median values for the results inventoried. "Number of points" means the number of observations for each option.
The main substances causing photochemical oxidation are sulphur dioxide (SO2), carbon monoxide (CO) and methane (CH4). In power generation, SO2 and CO emissions occur essentially during combustion. In the case of methane, natural gas extraction and transportation are major sources of emissions.
The following highlights can be noted:
The options can be grouped into three value ranges: the highest is made up of combustion-based options—coal, oil, natural gas and biogas. In the second-highest range, which includes biomass, solar and wind, the indicators are only a tenth of the values in the first group, and emissions are essentially attributable to energy consumption for secondary activities. In the third and lowest range are hydropower and nuclear, with indicators that are 100 times less than those in the first group.
The indicator for the kWh generated by Hydro-Québec hydropower (0.8 mg C2H4 eq./kWh on average) is only half the value of the indicator found in the literature for hydropower (2 mg C2H4 eq./kWh on average). This is due to the difference in life cycle methane emissions between the Hydro-Québec generation option and those surveyed in the literature.
Details on the data used in these analyses can be found in the accompanying report, Comparing Power Generation Options and Electricity Mixes (November 2014). The report includes a summary of the life cycle assessment (LCA) of Québec electricity, a description of each generation option, and the compositions of the electricity mixes compared. It also explains the LCA method and lists the most common environmental indicators, as well as the bibliographic references used in the comparison of generation options.

Comparing Generation Options and Electricity Mixes 1 Indicator: Resource Depletion
HYDRO-QUÉBEC COMPARING GENERATION OPTIONS AND ELECTRICITY MIXES
Prepared by CIRAIG – International Reference Centre for the Life Cycle of Products, Processes and
Services Date November 2014
To facilitate life-cycle-based comparison of the electric power generated or distributed by Hydro-Québec with that generated by other means or distributed in other parts of the world, a series of nine datasheets has been produced. Each presents the results for one of the following environmental indicators: Climate Change, Ozone Layer Depletion, Acidification, Eutrophication, Human Toxicity, Resource Depletion, Photochemical Oxidation, Human Health and Ecosystem Quality. This datasheet deals with the indicator "Resource Depletion".
RESOURCE DEPLETION
Depletion of non-renewable resources is a major issue in power generation around the world.
This datasheet deals with two environmental sub-indicators related to this issue: the first is Mineral Extraction from the earth's crust (metals, ore, etc.) and the second is Fossil Fuel Use (oil, natural gas and coal). Unlike the other environmental indicators, which focus on emissions, the Resource Depletion indicators measure life cycle consumption of materials.
Following is a detailed description of the impact assessment methods used to compare generation options and electricity mixes. Note that the methods employed for generation options (CML) and for electricity mixes (IMPACT World+) do not use the same units of measure.
These indicators apply on a global scale, since resource depletion has consequences for the entire planet regardless of geographical location.
Comparison of generation options
The comparison of options in this section has to do with power generation only; it excludes all aspects of power transmission and distribution.
To produce this comparative analysis, all recent data available in the literature, in environmental product declarations and in the ecoinvent v2.2 database (www.ecoinvent.org/database/) were compiled and compared with data for Hydro-Québec's hydroelectric generating fleet (specific data for 2012). Only studies using the most recent version of CML were considered for the comparative graphing of mineral extraction. Those using earlier versions were excluded, since they grouped the two sub-indicators into one indicator called Resource Extraction, making the results non-comparable. Moreover, IMPACT 2002+, which has also been used in some published studies, quantifies mineral extraction in megajoules (MJ) of additional energy needed to extract an additional quantity of ore, which again makes the results incompatible with those of CML.
The Mineral Extraction indicator1 is expressed in kilograms of antimony equivalent (kg Sb eq.) per kilogram extracted. It takes into account the existing reserves, the extraction rate and the depletion of each mineral. The Fossil Fuel Use indicator (consumption of non-renewable energy) is based on the energy content, or calorific value, of the extracted fossil fuel and is expressed in megajoules (MJ) per unit of volume or mass.2
1 Referred to as "abiotic resource depletion" in the CML method (Leiden Universiteit, CML-IA Characterisation Factors. Retrieved from http://cml.leiden.edu/software/data-cmlia.html#downloads). 2 Depending on the assessment method, the lower or higher calorific value will be used.
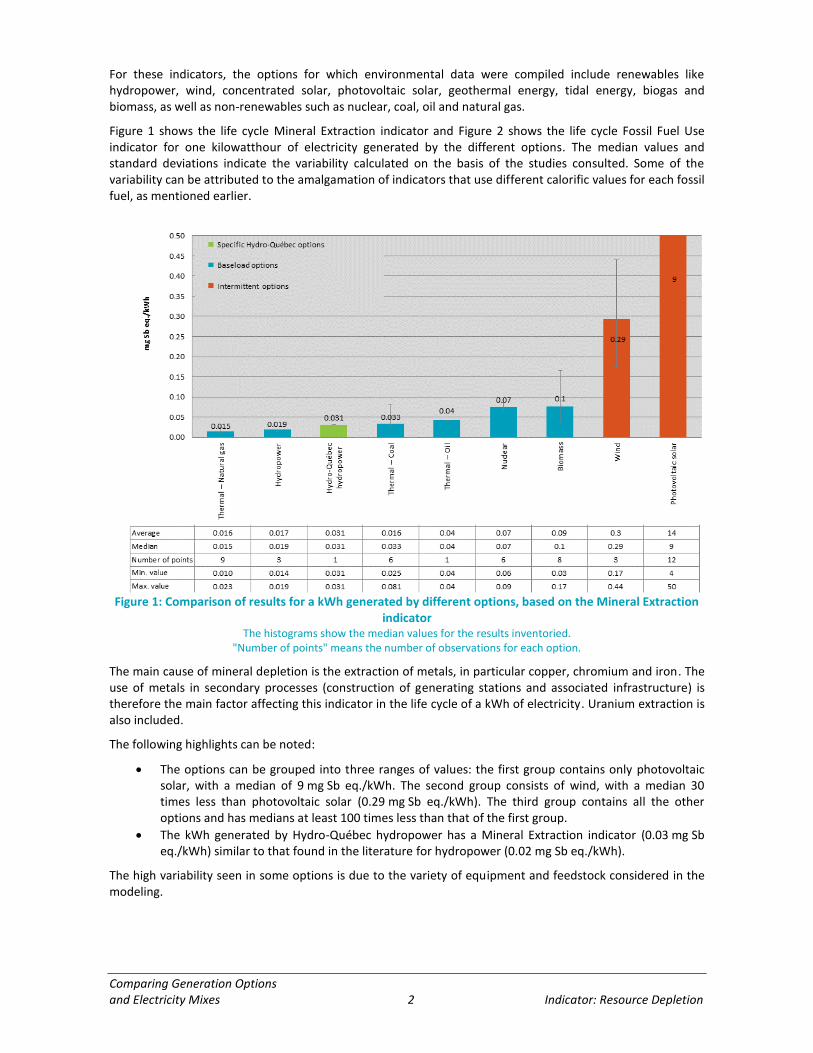
Comparing Generation Options and Electricity Mixes 2 Indicator: Resource Depletion
For these indicators, the options for which environmental data were compiled include renewables like hydropower, wind, concentrated solar, photovoltaic solar, geothermal energy, tidal energy, biogas and biomass, as well as non-renewables such as nuclear, coal, oil and natural gas.
Figure 1 shows the life cycle Mineral Extraction indicator and Figure 2 shows the life cycle Fossil Fuel Use indicator for one kilowatthour of electricity generated by the different options. The median values and standard deviations indicate the variability calculated on the basis of the studies consulted. Some of the variability can be attributed to the amalgamation of indicators that use different calorific values for each fossil fuel, as mentioned earlier.
Figure 1: Comparison of results for a kWh generated by different options, based on the Mineral Extraction
indicator The histograms show the median values for the results inventoried.
"Number of points" means the number of observations for each option.
The main cause of mineral depletion is the extraction of metals, in particular copper, chromium and iron. The use of metals in secondary processes (construction of generating stations and associated infrastructure) is therefore the main factor affecting this indicator in the life cycle of a kWh of electricity. Uranium extraction is also included.
The following highlights can be noted:
The options can be grouped into three ranges of values: the first group contains only photovoltaic solar, with a median of 9 mg Sb eq./kWh. The second group consists of wind, with a median 30 times less than photovoltaic solar (0.29 mg Sb eq./kWh). The third group contains all the other options and has medians at least 100 times less than that of the first group.
The kWh generated by Hydro-Québec hydropower has a Mineral Extraction indicator (0.03 mg Sb eq./kWh) similar to that found in the literature for hydropower (0.02 mg Sb eq./kWh).
The high variability seen in some options is due to the variety of equipment and feedstock considered in the modeling.

Comparing Generation Options and Electricity Mixes 3 Indicator: Resource Depletion
Figure 2: Comparison of results for a kWh generated by different options, based on the Fossil Fuel Use
indicator The histograms show the median values for the results inventoried.
"Number of points" means the number of observations for each option.
It can be seen from Figure 2 that the Fossil Fuel Use indicator is directly influenced by fuel extraction (coal, oil and natural gas). Uranium extraction is not included in this indicator but in Mineral Extraction. Fossil-fuel-based options therefore have higher Fossil Fuel Use indicators than any other options apart from nuclear.
The following highlights can be noted:
The options can be grouped into three ranges of values: the first comprises the fossil-fuel-based options other than nuclear (coal, oil and natural gas). The second consists of solar, biomass, geothermal and wind, with indicators only a tenth those of the first group. The third group, which has indicators 100 times less than those of the first group, includes hydropower, nuclear, tidal power and biogas.
The kWh generated by Hydro-Québec hydropower has the same Fossil Fuel Use indicator as that found in the literature for hydropower (0.03 MJ of non-renewable energy/kWh).
Note that the values for this indicator can vary widely depending on the impact assessment model used. In particular, the fact that uranium extraction is considered a fossil fuel use according to IMPACT World+ raises the indicator value for nuclear power in Figure 4. Moreover, because the electricity mixes were assessed using IMPACT World+, those with a large nuclear component have higher indicator values.
Comparison of electricity mixes
The electricity mix is what is delivered to the customer. In Québec, the mix includes power generated by Hydro-Québec, electricity purchased from private producers, and imports. More generally, the electricity mix in a given region includes, proportionately, all the options used to generate the electricity distributed to the consumer. Power transmission and distribution are also included.
To compare electricity mixes in terms of resource consumption, the most recent life cycle impact assessment method, IMPACT World+ (www.impactworldplus.org), was used. As in the case of generation options, two indicators (Mineral Extraction and Fossil Fuel Use) were applied.

Comparing Generation Options and Electricity Mixes 4 Indicator: Resource Depletion
Figure 3 shows Mineral Extraction and Figure 4 shows Fossil Fuel Use for the electricity mixes of several regions (Canadian provinces, U.S. NERC regions,3 or countries) compared to that of Québec. The environmental data, including specific Hydro-Québec data for 2012, were taken from the ecoinvent v 3.0 life cycle inventory database (www.ecoinvent.org/database/).
Figure 3: Comparison of results for a kWh distributed in different regions, based on the Mineral Extraction indicator (IMPACT World+ method)
It can be seen that the kilowatthour distributed in Québec is among those with the lowest Mineral Extraction indicators, at 0.6 kg extracted/kWh.
Although this indicator is based on a different assessment method than that used for generation options, it too is strongly influenced by the extraction of metals used in secondary activities during construction of generating facilities and infrastructure. Unlike in the generation option comparison, uranium is not included under Mineral Extraction but under Fossil Fuel Use (Figure 4). The main contributor to this indicator is power generation from blast furnace gases, in which some of the ore extracted for steel production is diverted to a generating facility. As a result, mixes that include electricity generated by this option have higher indicators for Mineral Extraction. The region with the highest indicator is Germany, where blast furnace gases account for only 1% of all the electricity generated.
3 There are eight regions in the North American electrical grid, encompassing Canada, the U.S. and part of Mexico. However, the electricity mixes considered in this study are based solely on electricity generated in the U.S. FRCC: Florida Reliability Coordinating Council; MRO: Midwest Reliability Organization; NPCC: Northeast Power Coordinating Council; RFC: Reliability First Corporation; SERC: SERC Reliability Corporation; SPP: Southwest Power Pool; TRE: Texas Reliability Entity (or ERCOT); WECC: Western Electricity Coordinating Council.

Comparing Generation Options and Electricity Mixes 5 Indicator: Resource Depletion
Figure 4: Comparison of results for a kWh distributed in different regions, based on the Fossil Fuel Use indicator (IMPACT World+ method)
Although this indicator is based on a different assessment method and unit of measurement than those used for generation options, it too assesses fossil fuel consumption. But, unlike the CML-based indicator, this one includes uranium.
It can be seen that the kilowatthour distributed in Québec is among those with the lowest fossil fuel use, at 0.5 MJ extracted/kWh. This is comparable to other regions where the mix has a large hydropower component, such as Manitoba (0.3 MJ extracted/kWh) and Norway (0.3 MJ kg extracted/kWh); however, the presence of Gentilly-2 nuclear generating station slightly raises the indicator for Québec. Regions where the mix includes a large portion of renewables, such as British Columbia, Newfoundland and Labrador, and Brazil, have lower indicators.
Conversely, regions making extensive use of fossil fuels (e.g., China, India and the U.S. Midwest (MRO)) or nuclear (France, Ontario), or both (FRCC, New Brunswick), have impacts that are 20 times greater than Québec.
Figures 5 and 6 show Mineral Extraction and Fossil Fuel Use for power generation by facilities in the U.S. Northeast and by Hydro-Québec Production in 2012. These figures do not include resource depletion for generation outside these states or, in the case of Hydro-Québec Production, generation by off-grid systems and independent producers in Québec. The mixes for states in the U.S. Northeast were provided by the U.S. Energy Information Administration, while the mix for Hydro-Québec Production was obtained from Hydro-Québec. Power transmission is also taken into account.

Comparing Generation Options and Electricity Mixes 6 Indicator: Resource Depletion
Figure 5: Comparison of results for a kWh generated in different northeastern states and by Hydro-Québec Production, based on the Mineral Extraction indicator (IMPACT World+ method)
Figure 6: Comparison of results for a kWh generated in different northeastern states and by Hydro-Québec Production, based on the Fossil Fuel Use indicator (IMPACT World+ method)

Comparing Generation Options and Electricity Mixes 7 Indicator: Resource Depletion
For both indicators, power generation by Hydro-Québec has less severe impacts than power generation in the U.S. Northeast. However, in the case of Mineral Extraction, all the values are more or less in the same range, whereas in the case of Fossil Fuel Use, the indicator value for Québec is 10 to 30 times lower.
Details on the data used in these analyses can be found in the accompanying report, Comparing Power Generation Options and Electricity Mixes (November 2014). The report includes a summary of the life cycle assessment (LCA) of Québec electricity, a description of each generation option, and the compositions of the electricity mixes compared. It also explains the LCA method and lists the most common environmental indicators, as well as the bibliographic references used in the comparison of generation options.

Comparing Electricity Mixes 1 Indicator: Human Health
HYDRO-QUÉBEC COMPARING ELECTRICITY MIXES
Prepared by CIRAIG – International Reference Centre for the Life Cycle of Products, Processes and
Services Date November 2014
To facilitate life-cycle-based comparison of the electric power generated or distributed by Hydro-Québec with that generated by other means or distributed in other parts of the world, a series of nine datasheets has been produced. Each presents the results for one of the following environmental indicators: Climate Change, Ozone Layer Depletion, Acidification, Eutrophication, Human Toxicity, Resource Depletion, Photochemical Oxidation, Human Health and Ecosystem Quality. This datasheet deals with the indicator "Human Health".
HUMAN HEALTH
The Human Health indicator, as its name indicates, measures emissions of substances directly or indirectly affecting health. For the purposes of this datasheet, indicator calculations are based on the most recent life cycle impact assessment method, IMPACT World+ (www.impactworldplus.org).
With this method, numerous sources of impacts on human health are considered, taking into account the complete chain of cause and effect. The Human Health indicator includes, in particular, substances that have toxic effects (carcinogenic and non-carcinogenic) or respiratory effects, produce ionizing radiation, or contribute to ozone layer depletion, global warming or photochemical oxidation (smog). Water use is also taken into account, due to its possible indirect effects on health.
These impacts are reduced to a common unit of measure representing the severity of illnesses potentially caused by such substances or their indirect effects, namely Disabled Adjusted Life Years (DALY).1 Characterization factors produced through environmental modeling are used to convert quantities of substances into DALY.
Comparison of electricity mixes
The electricity mix is what is delivered to the customer. In Québec, the mix includes power generated by Hydro-Québec, electricity purchased from private producers, and imports. More generally, the electricity mix in a given region includes, proportionately, all the options used to generate the electricity distributed to the consumer. Power transmission and distribution are also included.
Figure 1 shows the Human Health indicators for the electricity mixes of several regions (Canadian provinces, NERC regions in the U.S.,2 or countries) compared to that of Québec. The environmental data were taken from the ecoinvent v 3.0 life cycle inventory database (www.ecoinvent.org/database/) and compared with specific Hydro-Québec data for 2012.
1 The Institut national de santé publique du Québec (INSPQ) describes this concept in a document entitled "Les années de vie corrigées de
l’incapacité: un indicateur pour évaluer le fardeau de la maladie au Québec", (Martel and Steensma, 2012), retrieved from http://www.inspq.qc.ca/pdf/publications/1474_AnneesVieCorrigeesIncapacite_IndicEvalFardeauMal.pdf 2 The regions in the North American electrical grid correspond to the eight regional entities overseen by the North American Electric Reliability Corporation (NERC), and encompass Canada, the U.S. and part of Mexico. However, the electricity mixes considered in this study are based solely on electricity generated in the U.S. FRCC: Florida Reliability Coordinating Council; MRO: Midwest Reliability Organization; NPCC: Northeast Power Coordinating Council; RFC: Reliability First Corporation; SERC: SERC Reliability Corporation; SPP: Southwest Power Pool; TRE: Texas Reliability Entity (or ERCOT) ; WECC: Western Electricity Coordinating Council.

Comparing Electricity Mixes 2 Indicator: Human Health
Figure 1: Comparison of results for a kWh distributed in different regions, based on the Human Health indicator (IMPACT World+ method)
For most of the mixes assessed, the Human Health indicator is primarily dominated by the effects of climate change (short- and long-term impacts) followed by carcinogenic and non-carcinogenic substances. The main substances underlying climate change are carbon dioxide (CO2) and methane (CH4), emitted mainly through fossil fuel combustion. The substances with toxic effects (carcinogenic and non-carcinogenic) are metals—especially chromium—and arsenic, emitted mainly during raw material extraction (coal, lignite and uranium).
It can be seen that the kilowatthour distributed in Québec is among those with the lowest potential impacts on human health, at 1.4x10⁻⁷ DALY/kWh. This is comparable to other regions where the mix has a large hydropower component, such as Manitoba (3x10⁻⁷ DALY/kWh) and Norway (2x10⁻⁷ DALY/kWh). Regions where the mix includes a large portion of renewables, for example British Columbia, Newfoundland and Labrador, and Brazil, or a significant nuclear presence, such as Ontario and France, also have favorable profiles.
Considering the main sources and substances influencing the Human Health indicator, it is reasonable to conclude that regions where the electricity mix contains a significant fossil fuel component (coal, natural gas) have the least favorable environmental profiles. This can be observed in Figure 1: India, with nearly 70% coal, China, with more than 75% coal, and the U.S. Midwest (MRO), with 70% coal, all have Human Health indicators more than 30 times that of Québec. It should be noted that the indicator is affected by the efficiency of the generating facilities in a given region. China, for example, whose mix contains more coal than India's, nevertheless has a lower indicator because its coal-fired plants are more efficient (emitting less than 1 kg CO2/kWh) than India's (1.4 kg CO2/kWh).
Figure 2 shows the human health impacts of power generation by facilities in the U.S. Northeast and by Hydro-Québec Production in 2012. This figure does not include generation outside these states or, in the case of Hydro-Québec Production, generation by off-grid systems and independent producers in Québec. The mixes for states in the U.S. Northeast were provided by the U.S. Energy Information Administration, while the mix for Hydro-Québec Production was obtained from Hydro-Québec. Power transmission is also taken into account.

Comparing Electricity Mixes 3 Indicator: Human Health
Figure 2: Comparison of results for a kWh generated in different northeastern states and by Hydro-Québec Production, based on the Human Health indicator (IMPACT World+ method)
As in the case of the kWh distributed in Québec (Figure 1), the potential human health impacts of a kWh generated by Hydro-Québec Production in 2012 (1.1 x10⁻⁷ DALY/kWh) are 5 to 25 times less than those of the U.S. Northeast.
Details on the data used in these analyses can be found in the accompanying report, Comparing Power Generation Options and Electricity Mixes (November 2014). The report includes a summary of the life cycle assessment (LCA) of Québec electricity, a description of each generation option, and the compositions of the electricity mixes compared. It also explains the LCA method and lists the most common environmental indicators, as well as the bibliographic references used in the comparison of generation options.

Comparing Electricity Mixes 1 Indicator: Ecosystem Quality
HYDRO-QUÉBEC COMPARING ELECTRICITY MIXES
Prepared by CIRAIG – International Reference Centre for the Life Cycle of Products, Processes and
Services Date November 2014
To facilitate life-cycle-based comparison of the electric power generated or distributed by Hydro-Québec with that generated by other means or distributed in other parts of the world, a series of nine datasheets has been produced. Each presents the results for one of the following environmental indicators: Climate Change, Ozone Layer Depletion, Acidification, Eutrophication, Human Toxicity, Resource Depletion, Photochemical Oxidation, Human Health and Ecosystem Quality. This datasheet deals with the indicator "Ecosystem Quality".
ECOSYSTEM QUALITY
The Ecosystem Quality indicator measures emissions of substances directly or indirectly affecting biodiversity. For the purposes of this datasheet, indicator calculations are based on the most recent life cycle impact assessment method, IMPACT World+ (www.impactworldplus.org).
With this method, numerous sources of impacts on ecosystems are considered, taking into account the complete chain of cause and effect. The Ecosystem Quality indicator includes, in particular, substances that have toxic effects on aquatic life, produce ionizing radiation, or contribute to terrestrial and aquatic acidification, water eutrophication or global warming. Land use and water use are also factored in, since they can impact animal and plant biodiversity. However, the impacts of dam building and reservoir impoundment are not taken into account, for lack of characterization factors representative of their potential impacts.
These impacts are reduced to a common unit of measure representing the Potentially Disappeared Fraction of species over a given area and a given timespan (PDF*m²*yr). Characterization factors produced through environmental modeling are used to convert quantities of substances into PDF*m²*yr.
Comparison of electricity mixes
The electricity mix is what is delivered to the customer. In Québec, the mix includes power generated by Hydro-Québec, electricity purchased from private producers, and imports. More generally, the electricity mix in a given region includes, proportionately, all the options used to generate the electricity distributed to the consumer. Power transmission and distribution are also included.
Figure 1 shows the Ecosystem Quality indicators for the electricity mixes of several regions (Canadian provinces, NERC regions in the U.S.,1 or countries), compared to that of Québec. The environmental data were taken from the ecoinvent v 3.0 life cycle inventory database (www.ecoinvent.org/database/) and compared with specific Hydro-Québec data for 2012.
1 There are eight regions in the North American electrical grid, encompassing Canada, the U.S. and part of Mexico. However, the electricity mixes considered in this study are based solely on electricity generated in the U.S. FRCC: Florida Reliability Coordinating Council; MRO: Midwest Reliability Organization; NPCC: Northeast Power Coordinating Council; RFC: Reliability First Corporation; SERC: SERC Reliability Corporation; SPP: Southwest Power Pool; TRE: Texas Reliability Entity (or ERCOT) ; WECC: Western Electricity Coordinating Council.

Comparing Electricity Mixes 2 Indicator: Ecosystem Quality
Figure 1: Comparison of results for a kWh distributed in different regions, based on the Ecosystem Quality indicator (IMPACT World+ method)
For most of the mixes assessed, the Ecosystem Quality indicator is primarily dominated by the effects of climate change (short- and long-term impacts) followed by aquatic and terrestrial acidification. The main substances underlying climate change are carbon dioxide (CO2) and methane (CH4), emitted mainly through fossil fuel combustion. The substances with acidifying effects CO2 in the case of marine ecosystems, and sulphur dioxide (SO2) and nitrous oxides (NOx) in the case of terrestrial ecosystems. These are emitted through coal and oil combustion (SO2), natural gas combustion and, to a lesser extent, biomass combustion (NOx).
It can be seen that the kilowatthour distributed in Québec is among those with the lowest potential impacts on ecosystem quality, at 22x10-3 PDF*m²*yr/kWh. This is comparable to other regions where the mix has a large hydropower component, such as Manitoba (35x10-3 PDF*m²*yr/kWh) and Norway (28x10-3 PDF*m²*yr/kWh). Regions where the mix includes a large portion of renewables, for example British Columbia, Newfoundland and Labrador, and Brazil, or a significant nuclear presence, such as Ontario and France, also have favorable profiles.
Conversely, regions where the electricity mix contains a significant fossil fuel component—including India, with nearly 70% coal, China, with more than 75% coal, and the U.S. Midwest (MRO), with 70% coal—all have Ecosystem Quality indicators more than 500 times that of Québec. Of the regions dependent on fossil fuels, those using mostly natural gas have an advantage over those using mainly coal. This is the case for Russia, with 65% fossil fuels but nearly 50% natural gas, and Florida (FRCC), with 84% fossil fuels but more than 55% natural gas.
Figure 2 shows the Ecosystem Quality indicators for power generation by facilities in the U.S. Northeast and by Hydro-Québec Production in 2012. This figure does not include generation outside these states or, in the case of Hydro-Québec Production, generation by off-grid systems and independent producers in Québec. The mixes for states in the U.S. Northeast were provided by the U.S. Energy Information Administration, while the mix for Hydro-Québec Production was obtained from Hydro-Québec. Power transmission is also taken into account.

Comparing Electricity Mixes 3 Indicator: Ecosystem Quality
Figure 2: Comparison of results for a kWh generated in different northeastern states and by Hydro-Québec Production, based on the Ecosystem Quality indicator (IMPACT World+ method)
As in the case of the kWh distributed in Québec (Figure 1), the potential ecosystem quality impacts of a kWh generated by Hydro-Québec Production in 2012 (17 x10-3 PDF*m²*yr/kWh) compare favorably with those of the U.S. Northeast. Vermont, with a significant nuclear component, also has a very low indicator (37 x10-
3 PDF*m²*yr/kWh), but depends largely on imports to meet its electricity needs. The other states have indicators 20 to 40 times greater than that of Québec.
Details on the data used in these analyses can be found in the accompanying report, Comparing Power Generation Options and Electricity Mixes (November 2014). The report includes a summary of the life cycle assessment (LCA) of Québec electricity, a description of each generation option, and the compositions of the electricity mixes compared. It also explains the LCA method and lists the most common environmental indicators, as well as the bibliographic references used in the comparison of generation options.

Hydro-Québec Technical Report
November 2014 COMPARING POWER GENERATION OPTIONS AND ELECTRICITY MIXES Page 49
Appendix B: Glossary
In addition to the definitions given here, others can be found online:
Generation options: IPCC Special Report on Renewable Energy Sources, Annex I
Electricity and electrical infrastructure: www.hydroquebec.com/learning
Life cycle analysis: www.empreintecarbonequebec.org/en/lexique.php
Life cycle analysis (in French): http://pedagotech.inp-toulouse.fr/131010/co/ACV_CS_web_1.html

© Chaire ICV
Page 50 COMPARING POWER GENERATION OPTIONS AND ELECTRICITY MIXES November
2014
attributional LCA
An attributional LCA describes the physical flows (matter and energy) between a system and the environment over the system's life cycle. This is opposed to the consequential LCA, which estimates how those flows will change in response to possible decisions.
reservoir generating station
A generating station fed by water stored in an artificial lake created by a dam.
gas turbine generating station
A generating station using one or more combustion engines (burning natural gas or fuel oil) to drive turbines which in turn drive one or more generators. N.B.: Hydro-Québec's gas turbine generating stations operate only during peak hours.
run-of-river generating station
A generating station that is fed directly by a river and has practically no storage. Its capacity therefore varies according to the river flow.
diesel generating station
A generating station that uses one or more diesel engines burning a fossil fuel to drive a generator.
wind farm
A generating station that uses the kinetic energy of the wind to generate electricity. * The generator is driven by a turbine turning under the force of the wind.
hydroelectric generating station/hydropower plant
A generating station in which the kinetic energy of water is converted to mechanical energy and then to electricity. * There are two types of these facilities: reservoir generating stations and run-of-river generating stations.
thermal generating station
A generating station that uses thermal energy to generate electricity. * These include conventional thermal, nuclear, diesel and gas turbine generating stations.
conventional thermal generating station
A generating station in which a fossil fuel is combusted in a boiler to produce steam, which is used to drive turbines connected to generators.
nuclear generating station (thermal)
A generating station in which a nuclear reactor produces steam, which is used to drive a turbine connected to a generator.
renewable energy
An energy source that is replenished by natural processes at a rate that equals or exceeds its rate of use. This includes resources such as biomass, solar energy, geothermal heat, hydropower, tides, waves, and wind (IPCC, 2011).
fossil energy
Energy from non-renewable sources such as coal, oil and natural gas.
wind turbine
A machine used to convert the kinetic energy of wind into electricity.

Hydro-Québec Technical Report
November 2014 COMPARING POWER GENERATION OPTIONS AND ELECTRICITY MIXES Page 51
greenhouse gases (GHGs)
Gases that absorb infrared radiation emitted by the earth and reflect it back into the atmosphere, thus causing global warming. * The primary greenhouse gases are water vapor, carbon dioxide and methane.
kilowatt (kW)
Multiple of the watt (1,000 times), which is a unit of electric power.
kilowatthour (kWh)
Multiple of the watthour, which is a unit of electric energy and electricity consumption. One kWh is the amount of energy consumed by a 1,000-W electrical appliance operating for one hour. It is equal to 3.6 megajoules (MJ).
distribution line
An overhead or underground line bringing electricity from a distribution substation to customers.
transmission or subtransmission line
An overhead or underground line used to transmit electricity at a voltage ranging from 44 to 765 kilovolts.
megawatt (MW)
Multiple of the watt (1,000,000 times), which is a unit of electric power.
power
The rate of doing work, generally expressed in watts (W), kilowatts (kW) and megawatts (MW). Electric power is the rate, per unit time, at which electrical energy is transferred by an electric circuit.
power system
An organized set of facilities that may include power generation, transmission, subtransmission and distribution equipment.
Hydro-Québec main system
The Hydro-Québec power system, excluding the off-grid systems serving remote communities in Québec.
neighboring system
A power system outside Québec, or located within Québec but not belonging to Hydro-Québec.

© Chaire ICV
Page 52 COMPARING POWER GENERATION OPTIONS AND ELECTRICITY MIXES November
2014
Appendix C: Bibliographic Review
The purpose of the bibliographic review was to extract the results of LCAs focusing on any type of power generation and published since 2007. The approach used is described below.
Note that Moomaw et al. (2011) conducted a similar review for the IPCC, but solely on the GWP indicator, compiling the information published on GHG emissions for all generation options. Their cited references have been incorporated into the list of studies surveyed for our review.
C.1 Survey of bibliographic references
The literature review was conducted according to the research methods recognized and used at CIRAIG. Table C-1 lists the principal databases and search platforms used to find bibliographic references. Other sources consulted are not listed here since they yielded no results, or only results already obtained elsewhere.
Table C-1: Databases and search platforms used
Database/ Search platform
Link
Academic
ABI/Inform trade and Industry http://www.proquest.com/products-services/abi_inform_trade.html
Google Scholar http://scholar.google.ca
Web of Science http://wokinfo.com
Compendex www.engineeringvillage.com
Envirodec- EPD Database http://www.environdec.com
LCA-oriented journals
International Journal of LCA www.springer.com/environment/journal/11367
Journal of Industrial Ecology http://onlinelibrary.wiley.com/journal/10.1111/%28ISSN%291530-9290
Journal of Cleaner Production http://www.journals.elsevier.com/journal-of-cleaner-production/
Further searches were done to obtain access to reports published by industry, government bodies or non-government organizations.
More specifically, to identify LCA studies on generation options, we surveyed the corpus of peer-reviewed scientific journals as well as the "gray literature" of scientific reports, dissertations and non-peer-reviewed journal articles published since 2007.
Our search strategy consisted in three operations:
1. Define the search query and select the keywords; 2. Search the literature and gather information; 3. Eliminate duplicates and false positives.

Hydro-Québec Technical Report
November 2014 COMPARING POWER GENERATION OPTIONS AND ELECTRICITY MIXES Page 53
The search query was worded as follows:
LCA (+ equivalents including “life cycle assessment” or “ISO 14044”) AND (“electricity” or “power generation” or “power plant” or “electric power plant”).
All queries were entered in the search box, or in the “Title/abstract/keywords" field in the case of Engineering Village. Only references dating from 2007 or later were collected, in order to restrict our review to studies using the most recent LCA tools.
Duplicates were removed and the articles were then screened manually to eliminate off-topic articles containing the following terms:
“fuel” or “biofuel” or “medical” or “pharmaceutical” or “lumber” or “paper”.
This first step in our review yielded 212 references.
C.2 Sorting
Next, the articles selected were screened according to the following criteria:
Attributional LCA;
Study model covers all stages in the life cycle;
Geographical context is North America or a region with a similar climate;
Ideally, study covers several environmental indicators (complete LCA allowing a perspective on GHG impacts in relation to other impacts);
Generation options operated on a large scale or well characterized (no pilot projects, no emerging or rare technologies).
Reviews summarizing previously published studies were retained if they presented impact assessment results.
Although these are not measurable criteria, the reliability and completeness of the LCAs retained were also taken into account; i.e., whether or not they are peer-reviewed articles or EPDs, or whether they were published by a government body or recognized organization. In all cases, the sources were deemed reliable by the CIRAIG analyst.
Following this second step in our review, 87 references were retained.
C.3 Compilation of existing results
This last step consisted in reading and synthesizing the results presented in the studies in order to allow comparisons of generation options on the basis of their potential environmental impacts. A total of 66 references were used to compile over 1,000 results covering a dozen generation options and more than 20 environmental indicators of various kinds.