california department of transportation district 4 … · maria l. castro, report coordinator ......
TRANSCRIPT

Volumes, occupancies and violation rates for freeway High Occupancy Vehicle Lanes in the San Francisco Bay Area
California Department of TransportationDistrict 4 Oakland
Office of Highway Operations

District 4, Year 2006 Annual HOV Lane Report
TABLE OF CONTENTS
INTRODUCTION
Acknowledgements..............................................................................................1Map of Existing HOV Lanes...................................................................................3
HOV FACILITIES SUMMARIES
Comparison of HOV Lanes vs. Mixed Flow Lanes....................................................7Existing Mainline HOV Lanes ................................................................................9Metered On-Ramps with HOV Bypass Lane..........................................................10Non-Metered HOV Lane On-Ramp ......................................................................12Mainline HOV Lanes Under Construction .............................................................13Programmed HOV Lane Projects ….....................................................................14Proposed HOV Lane Projects (not programmed)..................................................15
DATA SUMMARIES
HOV Lane Peak Hour Volumes............................................................................19HOV & Non-HOV Lane Peak Hour Comparisons...................................................21HOV Lane Peak Period Violation Rates................................................................23HOV Lane Peak Hour Time Savings and Average Speeds.....................................25
GENERAL FACILITY INFORMATION
Mainline HOV Lanes ...........................................................................................29Toll Bridge HOV Bypass Lanes ...........................................................................40
MAINLINE HOV LANE
VOLUME/PERSON DATA & VIOLATION HISTORY
ALA-80 San Francisco-Oakland Bay Bridge Toll Plaza................................45ALA-80 HOV Ramp Flyover [Powell Street to SFOBB]...............................48ALA-80 Contra Costa Co. Line to I-880 Viaduct. ........................................51ALA-84 Dumbarton Bridge Toll Plaza .......................................................55ALA-92 San Mateo-Hayward Bridge Toll Plaza...........................................58ALA-680 Route 84 to Route 237 Calaveras Blvd.........................................61ALA-880 Marina Blvd. to Whipple Rd..........................................................64ALA-880 Whipple Rd. to Mission Blvd ........................................................70ALA-880 16th Street to SFOBB Toll Plaza..................................................76CC-4 Loveridge Ave. to Port Chicago Highway.....................................78CC-80 Rte. 4 to Alameda Co. Line..........................................................82CC-680 Marina vista to N/O North Main St.…………………………………….86CC-680 Livorna Road to Alcosta Blvd .......................................................92MRN-101 Richardson Bay Bridge to Anderson Dr. .......................................98MRN-101 N. San Pedro to Route 37 .........................................................102SCL-85 Route 101 [Mountain View] to Route 280 .................................106SCL-85 Route 280 to Almaden Expressway ...........................................110SCL-85 Almaden Expressway to Route 101[So. San Jose] .....................114SCL-87 Route 101 I/C to Taylor Avenue ................................................118SCL-101 SM/SCl Co. Line to Ellis St.........................................................120SCL-101 Ellis St. to Guadalupe Parkway...................................................126SCL-101 Guadalupe Parkway to Route 280/680 I/C ..................................130SCL-101 Route 280/680 I/C to Bernal Rd. ...............................................134SCL-101 Bernal Rd. to Cochrane Rd........................................................138

District 4, Year 2006 Annual HOV Lane Report
TABLE OF CONTENTS
SCL-237 Mathilda Avenue to Route 880/237 Jct ......................................142SCL-280 Magdalena Ave. to Leland Ave ..................................................148S F - 8 0 HOV-only on-ramp (Sterling Street on-ramp)……………………….152S M - 1 0 1 Whipple Avenue to SM/SCl Co. Line .........................................154S O L - 8 0 Carquinez Bridge Toll Plaza.......................................................160SON-101 Rte.12 to Wilfred Ave................................................................162
HOV TOLL GATES
VOLUME/PERSON DATA
Richmond-San Rafael Bridge Toll Plaza........................................................171 Antioch Bridge Toll Plaza ….........................................................................173 Benicia-Martinez Bridge Toll Plaza................................................................175

I N T R O D U C T I O N
he ANNUAL HOV LANE REPORT is prepared by the California Department ofTransportation (Caltrans) District 4 Office of Highway Operations. This reportcontains information concerning High Occupancy Vehicle (HOV) lanes on the
San Francisco Bay Area freeway system. Traffic performance data for mainline HOVlanes and HOV toll gates are provided for calendar year 2006. This data includes, trafficvolumes, vehicle occupancies, HOV lane time savings, and HOV lane violation rates.Data for this report is collected twice annually — once in the spring and once in the fall— when normal commute traffic patterns and conditions generally occur. Volumes andoccupancy data for HOV bypass lanes at metered freeway on-ramps are not included inthis annual report; however, general information on these ramps is included. The intentof this HOV lane monitoring report is to compile statistics and measurements of collecteddata. This report should not be construed to be a conclusion on the performance of HOVlanes.
Major changes in 2006:• A new section of HOV Lane on U.S. 101, in Marin County, opened to traffic in the
southbound direction on July 17, 2006 and in the northbound direction on July 20,2006. The limits of the HOV lane in the southbound direction are now from AndersonDrive to south of the Strawberry pedestrian overcrossing, a distance of 5.2 miles. Thelimits of the HOV lane in the northbound direction are now from south of RichardsonBay Bridge to Nellen Avenue undercrossing, a distance of 4.3 miles.
• HOV lane direct connectors at the U.S. 101/SR 85 interchange, in Mountain View, inSanta Clara County, opened to traffic on May 26, 2006.
• A new section of HOV lane on State Route 4, in Contra Costa County, opened totraffic on July 24, 2006. The limits of the HOV lane are now from Port ChicagoHighway to west of Loveridge Road, a distance of 8.5 miles.
HOV Report Website: This report is available for download at www.dot.ca.gov/dist4/by clicking on the Commute Help Link.
ACKNOWLEDGMENTS:
The following Caltrans personnelcontributed to the preparation of thisreport:
Maria L. Castro, Report Coordinator
Adolfo ZepedaIndra BhattacharyaRoberto FuertesJun MagbitangMarvin MaltezJoseline Morales
LANCE HALLDistrict 4 HOV Lane Coordinator
For more information, contact:
Mr. H. DAVID SERIANIDistrict Office ChiefCalifornia Department of TransportationDistrict 4, Office of Highway OperationsP.O. Box 23660Oakland, CA, 94623-0660e-mail: [email protected]
T

Department of Transportation
District 4
Office of Highway Operations
Miles

District 4, Year 2006 Annual HOV Lane Report Page 5
HOV FACILITIES SUMMARIES
• Comparison of HOV Lanes vs. Mixed Flow Lanes
• Existing Mainline HOV Lanes
• Metered On-Ramps with HOV Bypasses
• Non-Metered HOV Lane On-Ramp
• Mainline HOV Lanes Under Construction
• Programmed HOV Lane Projects
• Proposed HOV Lane Projects (Not Programmed)

COMPARISON OF HOV LANES VS. MIXED FLOW LANES
(Peak-Hour)
VEHICLES
83%
17%
Mixed Flow Lanes
HOV Lanes
(61,100- vehicles per hour)
(308,900 - vehicles per hour)
PEOPLE
70%
30%
Mixed Flow Lanes
HOV Lanes
(341,000 - persons per hour)
NOTE: Data shown is the relative proportion of vehicles or people in the mixed flow and carpool lanes averaged over all count locations.
(149,300 - persons per hour)
District 4, Year 2006 Annual HOV Lane Report Page 7

EXISTING MAINLINE HOV LANES
Route Dir Limits Lane-miles
Min. occ.
Period of operation*
ALA-80 W/B Bay Bridge Toll Plaza 1.1 3+ 5-10 AM 3-7 PM
ALA-80 W/B Contra Costa Co Line to I-880 Viaduct 4.2 3+ 5-10 AM 3-7 PM
E/B I 880 Viaduct to Contra Costa Co Line 5.8 3+ 5-10 AM 3-7 PM
ALA-84 W/B Newark Blvd. to Dumbarton Bridge Toll Plaza 1.8 2+ 5-10 AM 3-6 PM
ALA-92 W/B Hesperian Blvd to San Mateo Bridge Toll Plaza 2.8 2+ 5-10 AM 3-6 PM
ALA-680 S/B Route 84 to Route 237 Calaveras Blvd. 14.0 2+ 5- 9 AM 3-7 PM
ALA-880 S/B Marina Blvd to Mission Blvd 20.5 2+ 5- 9 AM 3-7 PM
N/B Mission Blvd to South of Rte 238 I/C 16.7 2+ 5- 9 AM 3-7 PM
ALA-880 N/B West Grand Ave to Rte 80 1.1 3+ 5-10 AM 3-7 PM
ALA-880 N/B 16th Street to SFOBB Toll Plaza 1.8 3+ 5-10 AM 3-7 PM
CC-04 W/B Loveridge Road to Port Chicago Hwy 8.7 2+ 6- 9 AM
E/B Port Chicago Hwy to Railroad Ave. 7.3 2+ 3-7 PM
CC-80 W/B Rte 4 to Alameda County Line 10.1 3+ 5-10 AM 3-7 PM
E/B Alameda County Line to Rte 4 9.5 3+ 5-10 AM 3-7 PM
CC-680 S/B Marina Vista to N/O N. Main St. 7.8 2+ 6- 9 AM 3-7 PM
N/B Route 242 to Marina Vista I/C 4.4 2+ 6- 9 AM 3-7 PM
CC-680 S/B Livorna Rd to Alcosta Blvd 11.9 2+ 6- 9 AM 3-6 PM
N/B Alcosta Blvd to Livorna Rd 12.9 2+ 6- 9 AM 3-6 PM
MRN-101 S/B Anderson Dr. to Strawberry ped o/c 5.2 2+ 6:30-8:30 AM
N/B S/O Richardson Bay Br to Nellen Ave. UC 4.3 2+ 4:30-7:00 PM
S/B Rte 37 to San Pedro Rd 6.1 2+ 6:30-8:30 AM
N/B San Pedro Rd to Rte 37 6.1 2+ 4:30-7:00 PM
SCL-85 S/B Rte 101 (Mountain View) to Rte 101 (So. San Jose) 23.8 2+ 5- 9 AM 3-7 PM
N/B Rte 101 (So. San Jose) to Rte 101 (Mt. View) 24.2 2+ 5- 9 AM 3-7 PM
SCL-87 SB Route 101 I/C to Taylor Avenue 2.4 2+ 5 - 9 AM 3-7 PM
NB Taylor Avenue to Route 101 I/C 2.4 2+ 5 - 9 AM 3-7 PM
SCL-101 S/B San Mateo Co. Line to Cochrane Rd 34.2 2+ 5- 9 AM 3-7 PM
N/B Cochrane Rd to San Mateo Co. Line 34.8 2+ 5- 9 AM 3-7 PM
SCL-237 W/B Jct. Rte 880/237 to Mathilda Ave 6.1 2+ 5- 9 AM 3-7 PM
E/B Mathilda Ave to Rte 880/237 Jct. 6.5 2+ 5- 9 AM 3-7 PM
SCL-280 S/B Magdalena Ave to Meridian Ave 10.5 2+ 5- 9 AM 3-7 PM
N/B Leland Ave to Magdalena Ave 10.8 2+ 5- 9 AM 3-7 PM
SCL-880 S/B Dixon Landing Road to I/880/SR237 Junction 2.0 2+ 5- 9 AM 3-7 PM
N/B I 880/SR 237 Junction to Dixon Landing Road 1.3 2+ 5- 9 AM 3-7 PM
SM-101 S/B Whipple Ave to Santa Clara Co. Line 6.7 2+ 5- 9 AM 3-7 PM
N/B Santa Clara Co. Line to Whipple Ave 6.9 2+ 5- 9 AM 3-7 PM
SOL-80 E/B Carquinez Bridge Toll Plaza 0.1 3+ 5-10 AM 3-7 PM
SON-101 S/B Route 12 to Wilfred Avenue 4.0 2+ 7 - 9 AM 3-6:30 PM
N/B Wilfred Avenue to Route 12 4.0 2+ 7 - 9 AM 3-6:30 PM
TOTAL EXISTING LANE-MILES 344.8
* NOTE: All HOV lanes currently operate Monday thru Friday.
District 4, Year 2006 Annual HOV Lane Report Page 9

METERED ON-RAMPS with HOV BYPASS LANES
Route Dir Ramp HoursHOVL
metered?HOVL Date
opened Notes
ALA-580 EB Hopyard loop 2:30-7:30 pm Yes Jun 30, 2003ALA-580 EB Hopyard diagonal 2:30-7:30 pm Yes Jun 30, 2003ALA-580 EB Hacienda Loop 2:30-7:30 pm Yes Jun 30, 2003ALA-580 EB Hacienda diagonal 2:30-7:30 pm Yes Jun 30, 2003ALA-580 EB Santa Rita loop 2:30-7:30 pm Yes Jun 30, 2003ALA-580 EB Santa Rita diagonal 2:30-7:30 pm Yes Jun 30, 2003
ALA-880 NB Dixon Landing diagonal 24 hrs Yes Mar 30, 2004ALA-880 NB Fremont Blvd loop 24 hrs Yes Oct 20, 1999ALA-880 NB Auto Mall Pkwy(Durham) loop 24 hrs Yes Oct 20, 1999ALA-880 NB Auto Mall Pkwy(Durham)diag 24 hrs Yes Oct 20, 1999ALA-880 NB Stevenson Blvd. diagonal 24 hrs Yes Oct 20, 1999ALA-880 NB E/B Mowry Ave loop 24 hrs Yes Oct 20, 1999ALA-880 NB Thornton Ave loop 24 hrs Yes Oct 20, 1999ALA-880 NB Thornton Ave diagonal 24 hrs Yes Oct 20, 1999ALA-880 NB Alvarado-Fremont Blvd diag 24 hrs Yes Oct 20, 1999ALA-880 NB Alvarado-Niles Rd diagonal 24 hrs Yes Oct 20, 1999ALA-880 NB Industrial Parkway diagonal 24 hrs Yes Dec 3, 1996ALA-880 NB Tennyson Rd diag 24 hrs Yes Dec 3, 1996ALA-880 NB West A-Street diag 24 hrs Yes Dec 3, 1996ALA-880 NB Lewelling Blvd diagonal 24 hrs Yes Apr 28, 1999ALA-880 NB 98th Ave loop 24 hrs Yes Apr 28, 1999ALA-880 NB E/B 23rd Ave. diag 24 hrs Yes Apr 28, 1999ALA-880 SB Dixon Landing Loop 24hrs Yes Mar 30, 2004ALA-880 SB Fremont Blvd. diag 24 hrs Yes Oct 19, 1999ALA-880 SB Fremont Blvd. loop 24 hrs Yes Oct 19, 1999
ALA-880 SB Auto Mall Pkwy(Durham)Diag 24 hrs Yes Oct 19, 1999
ALA-880 SB Auto Mall Pkwy(Durham)loop 24 hrs Yes Oct 19, 1999
ALA-880 SB W/B Mowry Ave loop 24 hrs Yes Oct 19, 1999
ALA-880 SB Thornton Ave. diagonal 24 hrs Yes Oct 19, 1999
ALA-880 SB Thornton Ave. loop 24 hrs Yes Oct 19, 1999
ALA-880 SB Alvarado-Fremont Blvd diag 24 hrs Yes Oct 19, 1999
ALA-880 SB Alvarado-Niles Rd diagonal 24 hrs Yes Oct 19, 1999
ALA-880 SB Alvarado-Niles Rd loop 24 hrs Yes Oct 19, 1999
ALA-880 SB Whipple Rd diag 24 hrs Yes Oct 29, 1996
ALA-880 SB Tennyson Rd diag 24 hrs Yes Oct 29, 1996ALA-880 SB Winton Ave diag 24 hrs Yes Oct 29, 1996ALA-880 SB West A-Street diag 24 hrs Yes Oct 29, 1996ALA-880 SB E/B Davis St(Route 112) diag 24 hrs Yes Apr 27, 1999ALA-880 SB W/B Davis St(Route 112)loop 24 hrs Yes Apr 27, 1999ALA-880 SB 98th Ave diagonal 24 hrs Yes Apr 27, 1999ALA-880 SB Hegenberger diagonal 24 hrs Yes Apr 27, 1999ALA-880 SB Oak St. diagonal 24 hrs Yes Apr 27, 1999
NOTES: (a) Minimum occupancy requirement for all HOV bypass lanes is two persons per vehicle.(b) Motorcycles and inherently low-emission vehicles (ILEVs) with DMV issued decal are permitted.(c) Bypass lane restrictions are in effect 7 days a week unless noted otherwise.
District 4, Year 2006 Annual HOV Lane Report Page 10

METERED ON-RAMPS with HOV BYPASS LANES
Route Dir Ramp HoursHOVL
metered?HOVL Date
opened Notes
SCL-85 NB SB Rte 101 connector 5-9am & 3-7pm Yes Sep 20, 2004 Monday - Friday
SCL-85 NB SB Rte 87 connector 5-9am & 3-7pm Yes Jul 8, 2003 Monday - Friday
SCL-85 NB Bernal Rd Loop 24 hrs Yes Sep 20, 2004 7 days/week
SCL-85 NB Bernal Rd diag 24 hrs Yes Aug 26, 1994 7 days/week
SCL-85 NB SB Rte 101 connector 5-9am & 3-7pm Yes Sep 20, 2004 Monday - Friday
SCL-85 NB Great Oaks Blvd diag 24 hrs Yes Aug 19, 1994 7 days/week
SCL-85 NB Cottle Rd diag 24 hrs Yes Aug 19, 1994 7 days/week
SCL-85 NB Blossom Hill Rd loop 24 hrs Yes Aug 19, 1994 7 days/week
SCL-85 NB Santa Teresa Blvd loop 24 hrs Yes Oct 19, 1994 7 days/week
SCL-87 NB SB Rte 87 connector 5-9am & 3-7pm Yes Jul 8, 2003 Monday - Friday
SCL-85 NB Almaden Expwy (nb) loop 24 hrs Yes Mar 19, 1999 7 days/week
SCL-85 NB Bascom Ave diag 24 hrs Yes Oct 19, 1994 7 days/week
SCL-85 NB Winchester Blvd diag 24 hrs Yes Nov 14, 1994 7 days/week
SCL-85 NB Saratoga Ave diag 24 hrs Yes Oct 20, 1994 7 days/week
SCL-85 SB Almaden Expwy diag 24 hrs Yes Oct. 19, 1994 7 days/week
SCL-85 SB Bascom Ave diag 24 hrs Yes Oct 19, 1994 7 days/week
SCL-85 SB Camden Ave diag 24 hrs Yes Apr 4, 1995 7 days/week
SCL-85 SB Stevens Creek diag 24 hrs Yes Oct 19, 1994 7 days/week
SCL-101 NB Bernal Rd diagonal 24 hrs Yes Aug 18, 2005 7 days/week
SCL-101 NB Blossom Hill diag 24 hrs Yes Jun 23, 1992 7 days/week
SCL-101 NB Capitol Expwy diag 24 hrs Yes Jul 11, 1997 7 days/week
SCL-101 NB SB Rte 680 connector 5:30-9am No Sep 2, 1982 Monday - Friday
SCL-101 NB Guadalupe Pkwy connector 5:30-9am Yes Feb 12, 1980 Monday - Friday
SCL-101 NB Trimble Rd diag 24 hrs Yes Nov 1, 1991 7 days/week
SCL-101 NB San Tomas Expwy loop 5:30-9am No Feb 12, 1980 Monday - Friday
SCL-101 NB Montague Expwy diag 24 hrs Yes Feb 12, 1980 7 days/week
SCL-101 NB Lawrence Expwy (nb) loop 24 hrs Yes Mar 8, 1999 7 days/week
SCL-101 NB Lawrence Expwy (sb)diag 24 hrs Yes Mar 8, 1999 7 days/week
SCL-101 NB San Tomas Expwy loop 5:30-9 am No Feb 12, 1980 Monday - Friday
SCL-237 EB Lawrence Expwy diag 24 hrs Yes Aug. 14, 1998 7 days/week
SCL-237 EB Great America Pkwy diag 24 hrs Yes Sep 24, 1996 7 days/week
SCL-237 EB N. First Street diag 24 hrs Yes Sep 24, 1996 7 days/week
SCL-237 EB Zanker Rd diag 24 hrs Yes Sep 24, 1996 7 days/week
SCL-280 NB Wolfe Rd loop 6-9 am Yes Jun 8, 1976 Monday - Friday
SCL-280 SB Wolfe Rd loop 24 hrs Yes Apr 27, 1993 7 days/week
SCL-280 SB Wolfe Rd diag 24 hrs Yes Apr 27, 1993 7 days/week
SCL-280 SB De Anza Blvd diag 24 hrs Yes Apr 27, 1993 7 days/week
SCL-880 NB Calaveras Blv (wb) (diag) 24 hrs Yes Sep 9, 2003 7 days/week
SCL-880 SB Dixon Landing diagonal 24hrs Yes Mar 30, 2004 7 days/week
District 4, Year 2006 Annual HOV Lane Report Page 11

NON-METERED HOV LANE ON-RAMP
Route Dir Ramp HoursHOVL
metered?HOVL Date
opened Notes
SF-80 EB Sterling St on-ramp to SFOBB 3:30-7:00 PM No Aug 30, 1982
NOTES(a) Minimum occupancy requirement is 3 or more persons per vehicle.(b) 2 - seater vehicles with 2 persons, motorcycles and inherently low-emission vehicles (ILEVs)
with DMV issued decal are permitted.
District 4, Year 2006 Annual HOV Lane Report Page 12

MAINLINE HOV LANES UNDER CONSTRUCTION
Estimated County Location Lane Min.Opening Route Miles Occ.2009 SON-101 Rte 12 to Steele Lane 2.8 2+
May-07 SCL-87 Julian St to Rte 280 I/C (NB, SB) 2.4 2+
Mar-07 SCL-87 Rte 280 I/C to Santa Teresa Blvd. (NB,SB) 9.8 2+
2009 ALA-880 Dixon Landing Road to Mission Blvd (Rte 262) 8.6 2+
Sep-07 CC-80 Carquinez Bridge to Rte 4 - WB 2.7 3+
TOTAL LANE-MILES UNDER CONSTRUCTION 26.3
District 4, Year 2006 Annual HOV Lane Report Page 13

PROGRAMMED HOVL PROJECTS (From STIP)
County EA Location Construct Cost Est. LaneRoute year (Prog. year) MilesALA-84 444001 Newark Ave to I-880/SR 84 I/C 2008 $6,800,000 1.6
ALA-580 290810 Hacienda to E. of Greenville Rd. (EB) 2007 $56,200,000 11.3
ALA-580 290820 W of Hacienda to Greenville Rd. (WB) 2009 $84,000,000 11.3
SCL/ALA-680 286000 Rte 237 to Rte 84 - NB 2010 $80,000,000 13.0
CC-4 228500 Loveridge to Somersville 2008 $77,400,000 4.2
MRN/SON-101 264000 Route 37 to Old Redwood Highway 2016 $169,400,000 32.9
MRN-101 2261V1 580/101 Separation to Coleman School POC 2008 $42,900,000 3
SON-101 0A1800 Old Redwood Highway to Rohnert Park Expwy 2010 $120,400,000 12.8
SON-101 129650 Rohnert Park Expwy to Wilfred Ave 2010 $36,100,000 2.6
SON-101 263900 Steel Lane to Bicentennial Way 2008 $14,500,000 1.2
SON-101 0A100K Bicentennial Way to Windsor 2010 $68,900,000 14.2
ALA-880 3A920K Marina Blvd. to Hegenberger Rd. $86,500,000 2.9
TOTAL $843,100,000 111
PROGRAMMED HOVL PROJECTS (Locally Funded)
County EA Location Construct Cost LaneRoute year (Prog. Year) MilesSOL-80 0A5310 Red Top Road to North Texas Street $51,500,000 17.4
MRN-101 226141 Coleman School POC to N. San Pedro Rd. 2008 $51,730,000 3.2
CC-80 26372K West of Rte 4 to Carquinez Bridge $45,300,000 4.7
ALA-84 443901 Westbound HOV On-ramp at Newark Ave 2009 $8,600,000 1.0
TOTAL $157,130,000 26.3
District 4, Year 2006 Annual HOV Lane Report Page 14

PROPOSED HOVL PROJECTS (Not Programmed)
County EA Location Post-Mile Cost LaneRoute (Prog. year) MilesCC-4 2285XK Somersville to SR 160 26.0/31.0 $300,000 7.2
CC-680 0A610K NB from North Main to Route 242 15.0/18.8 $137,000 3.8
CC-680 3A580K SB fron North Main St to Livorna Rd 11.2/15.7 $40,000 3.5
TOTAL $477,000 14.5
District 4, Year 2006 Annual HOV Lane Report Page 15

District 4, Year 2006 Annual HOV Lane Report Page 17
DATA SUMMARIES
• HOV Lane Peak Hour Volumes
• HOV & Non-HOV Lane Peak Hour Comparisons
• HOV Lane Peak Period Violation Rates
• HOV Lane Peak Hour Time Savings and
Average Speeds

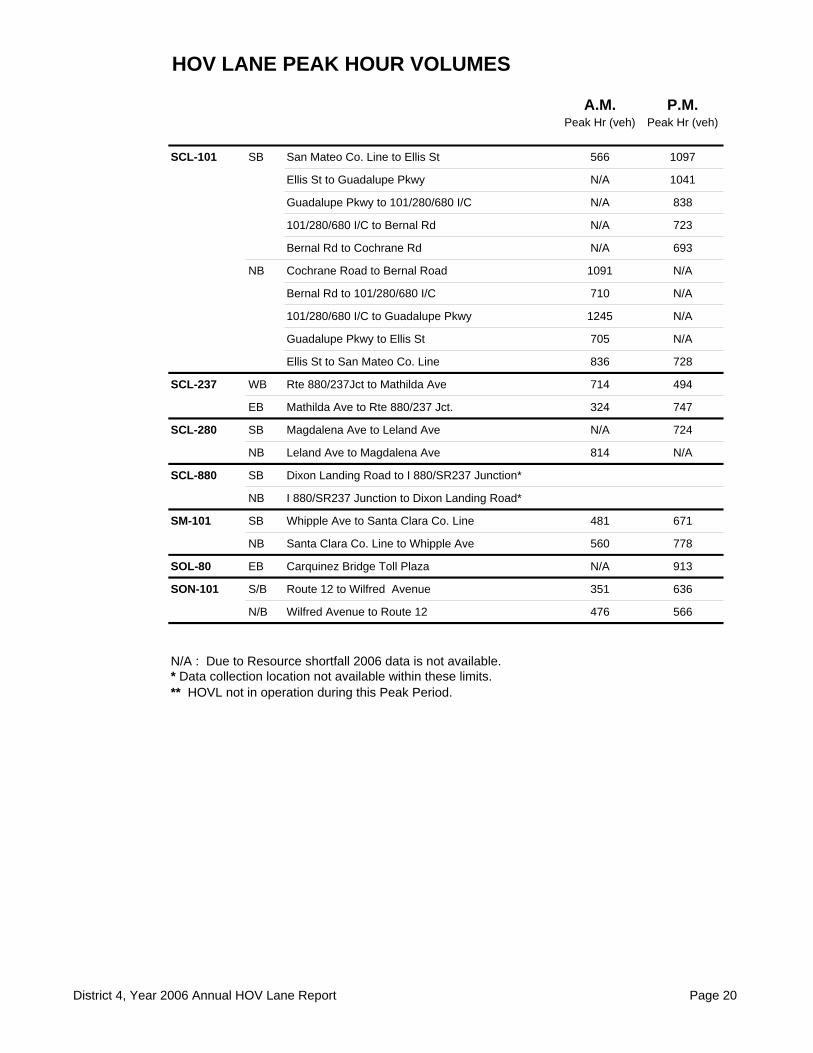
HOV LANE PEAK HOUR VOLUMES
A.M. P.M.Peak Hr (veh) Peak Hr (veh)
ALA-80 WB Bay Bridge Toll Plaza 3661 1017
ALA-80 WB Contra Costa County Line to Powell St 1650 N/A
EB I 880 Viaduct to Contra Costa Co. Line N/A 1553
ALA-80 WB HOV FLYOVER 1467 322
ALA-84 WB Newark Blvd to Dumbarton Bridge Toll Plaza 1420 370
ALA-92 WB Hesperian Blvd to San Mateo Bridge Toll Plaza 1011 553
ALA-680 SB Route 84 to Route 237 Calaveras Blvd. 832 589
ALA-880 SB Marina Blvd to Whipple Road 922 1071
Whipple Road to Mission Blvd. 1005 923
NB Mission Blvd to Whipple Road 417 842
Whipple Road to South of Rte 238 I/C 965 1243
ALA-880 NB 16th St to SFOBB Toll Plaza 634 N/A
CC-04 WB Loveridge Road to Port Chicago Hwy 882 **
EB Port Chicago Hwy to Railroad Ave. ** 1064
CC-80 WB Route 4 to Alameda County Line 1493 N/A
EB Alameda County Line to Route 4 N/A 1444
CC-680 SB Marina Vista I/C to N/O North Main St 1005 458
NB Route 242 to Marina Vista I/C 195 598
CC-680 SB Livorna Rd. to Alcosta Blvd. 1157 1173
NB Alcosta Blvd. to Livorna Rd. 978 1398
MRN-101 SB Rte 37 to N. San Pedro Rd 1199 **
Anderson Dr. to Strawberry ped o/c 618 **
NB S/O Richardson Bay Br to Nellen Ave UC ** 717
N. San Pedro Rd to Rte 37 ** 802
SCL-85 SB Rte 101 (Mountain View) to Rte 280 N/A 931
Rte 280 to Almaden Expwy N/A 854
Almaden Expwy to Rte 101 (So. San Jose) N/A 625
NB Rte 101 (So. San Jose) to Almaden Expwy 607 N/A
Almaden Expwy to Rte 280 1351 N/A
Rte 280 to Rte 101 (Mountain View) 1169 N/A
SCL-87 SB Route 101 I/C to Taylor Avenue*
NB Taylor Avenue to Route 101 I/C 164 N/A
District 4, Year 2006 Annual HOV Lane Report Page 19
HOV LANE PEAK HOUR VOLUMES
A.M. P.M.Peak Hr (veh) Peak Hr (veh)
SCL-101 SB San Mateo Co. Line to Ellis St 566 1097
Ellis St to Guadalupe Pkwy N/A 1041
Guadalupe Pkwy to 101/280/680 I/C N/A 838
101/280/680 I/C to Bernal Rd N/A 723
Bernal Rd to Cochrane Rd N/A 693
NB Cochrane Road to Bernal Road 1091 N/A
Bernal Rd to 101/280/680 I/C 710 N/A
101/280/680 I/C to Guadalupe Pkwy 1245 N/A
Guadalupe Pkwy to Ellis St 705 N/A
Ellis St to San Mateo Co. Line 836 728
SCL-237 WB Rte 880/237Jct to Mathilda Ave 714 494
EB Mathilda Ave to Rte 880/237 Jct. 324 747
SCL-280 SB Magdalena Ave to Leland Ave N/A 724
NB Leland Ave to Magdalena Ave 814 N/A
SCL-880 SB Dixon Landing Road to I 880/SR237 Junction*
NB I 880/SR237 Junction to Dixon Landing Road*
SM-101 SB Whipple Ave to Santa Clara Co. Line 481 671
NB Santa Clara Co. Line to Whipple Ave 560 778
SOL-80 EB Carquinez Bridge Toll Plaza N/A 913
SON-101 S/B Route 12 to Wilfred Avenue 351 636
N/B Wilfred Avenue to Route 12 476 566
N/A : Due to Resource shortfall 2006 data is not available.* Data collection location not available within these limits.** HOVL not in operation during this Peak Period.
District 4, Year 2006 Annual HOV Lane Report Page 20

PEAK HOUR HOV & non-HOV LANE COMPARISONS
% of all vehicles % of all Persons
in HOVLin Non-HOVL in HOVL
in Non-HOVL
Number of Non-HOV
Lanes
in Non-HOVL (Avg per Lane)
ALA-80 WB Bay Bridge Toll Plaza AM 41% 59% 67% 33% 18 2%PM 13% 87% 29% 71% 18 4%
ALA-80 WB Contra Costa County Line to Powell Street AM 19% 81% 40% 60% 4 15%PM N/A N/A N/A N/A 4 N/A
EB I 880 Viaduct to Contra Costa Co. Line AM N/A N/A N/A N/A 4 N/APM 18% 82% 38% 62% 4 15%
ALA-84 WB Newark Blvd to Dumbarton Bridge Toll Plaza AM 30% 70% 48% 52% 3 17%PM N/A N/A N/A N/A 3 N/A
ALA-92 WB Hesperian Blvd to San Mateo Bridge Toll Plaza AM 20% 80% 35% 65% 3 22%PM N/A N/A N/A N/A 3 N/A
ALA-680 SB Route 84 to Route 237 Calaveras Blvd AM 13% 87% 22% 78% 3 26%PM 13% 87% 22% 78% 3 26%
ALA-880 SB Marina Blvd to Whipple Rd AM 17% 83% 28% 72% 3 24%PM 18% 82% 30% 70% 3 23%
Whipple Rd to Mission Blvd AM 17% 83% 25% 75% 3 25%PM 18% 82% 29% 71% 3 24%
NB Mission Blvd to Whipple Rd AM 10% 90% 17% 83% 3 28%PM 15% 85% 27% 73% 3 24%
Whipple Rd to South of Rte 238 I/C AM 19% 81% 35% 65% 3 22%PM 21% 79% 34% 66% 3 22%
ALA-880 NB 16th Street to SFOBB AM 39% 61% 61% 39% 2 19%PM N/A N/A N/A N/A 2 N/A
CC-04 WB Loveridge Road to Port Chicago Hwy AM 14% 86% 26% 74% 3 25%EB Port Chicago to Railroad Avenue PM 16% 84% 27% 73% 3 24%
CC-80 WB Route 4 to Alameda County Line AM 22% 78% 47% 53% 3 18%PM N/A N/A N/A N/A 3 N/A
EB Alameda County Line to Route 4 AM N/A N/A N/A N/A 3 N/APM 22% 78% 46% 54% 3 18%
CC-680 SB Marina Vista I/C to N/O North Main St AM 18% 82% 28% 72% 5 14%PM 8% 92% 15% 85% 5 17%
NB Route 242 to Marina Vista I/C AM 7% 93% 14% 86% 4 21%PM 16% 84% 29% 71% 4 18%
CC-680 SB Livorna Rd to Alcosta Blvd AM 19% 81% 32% 68% 3 23%PM 18% 82% 32% 68% 3 23%
SB Alcosta Blvd to Livorna Rd AM 16% 84% 31% 69% 3 23%PM 22% 78% 39% 61% 3 20%
MRN-101 SB Rte 37 to N. San Pedro Rd AM 22% 78% 35% 65% 3 22%Anderson Dr. to Strawberry ped o/c AM 12% 88% 28% 72% 3 24%
NB S/O Richardson Bay Br to Nellen Avenue PM 11% 89% 25% 75% 3 25%N. San Pedro Rd to Rte 37 PM 11% 89% 23% 77% 3 26%
SCL-85 SB Rte 101 (Mtn View) to Rte 280 AM N/A N/A N/A N/A 2 N/APM 21% 79% 34% 66% 2 33%
Rte 280 to Almaden Expwy AM N/A N/A N/A N/A 2 N/APM 19% 81% 32% 68% 2 34%
Almaden Expwy to Rte 101 (So. San Jose) AM N/A N/A N/A N/A 2 N/APM 14% 86% 23% 77% 2 38%
NB Rte 101 (So. San Jose) to Almaden Expwy AM 16% 84% 24% 76% 2 38%PM N/A N/A N/A N/A 2 N/A
Almaden Expwy to Rte 280 AM 28% 72% 43% 57% 2 28%PM N/A N/A N/A N/A 2 N/A
Rte 280 to Rte 101 (Mtn View) AM 23% 77% 36% 64% 2 32%PM N/A N/A N/A N/A 2 N/A
SCL-87 SB Route 101 I/C to Taylor Avenue *** AMPM
NB Taylor Avenue to Route 101 I/C AM 5% 95% 9% 91% 4 46%PM N/A N/A N/A N/A 2 0%
****
****
**
**
District 4, Year 2006 Annual HOV Lane Report Page 21

PEAK HOUR HOV & non-HOV LANE COMPARISONS
% of all vehicles % of all Persons
in HOVLin Non-HOVL in HOVL
in Non-HOVL
Number of Non-HOV
Lanes
in Non-HOVL (Avg per Lane)
SCL-101 SB San Mateo Co. Line to Ellis St AM 10% 90% 20% 80% 3 27%PM 19% 81% 32% 68% 3 23%
Ellis St to Guadalupe Pkwy AM N/A N/A N/A N/A 3 N/APM 18% 82% 30% 70% 3 23%
Guadalupe Pkwy to 101/280/680 I/C AM N/A N/A N/A N/A 3 N/APM 16% 84% 28% 72% 3 24%
101/280/680 I/C to Bernal Rd AM N/A N/A N/A N/A 3 N/APM 14% 86% 23% 77% 3 26%
Bernal Rd to Cochrane Rd AM N/A N/A N/A N/A 3 N/APM 14% 86% 24% 76% 3 25%
NB Cochrane Rd to Bernal Road AM 21% 79% 34% 66% 3 22%PM N/A N/A N/A N/A 3 N/A
Bernal Rd to 101/280/680 I/C AM 13% 87% 22% 78% 3 26%PM N/A N/A N/A N/A 3 N/A
101/280/680 I/C to Guadalupe Pkwy AM 18% 82% 29% 71% 3 24%PM N/A N/A N/A N/A 3 N/A
Guadalupe Pkwy to Ellis St AM 12% 88% 22% 78% 3 26%PM N/A N/A N/A N/A 3 N/A
Ellis St to San Mateo Co. Line AM 14% 86% 22% 78% 3 26%PM 13% 87% 21% 79% 3 26%
SCL-237 WB 880/237 Jct to Mathilda Ave AM 14% 86% 24% 76% 2 38%PM 11% 89% 20% 80% 2 40%
EB Mathilda Ave to Rte 880/237 Jct AM 8% 92% 14% 86% 2 43%PM 15% 85% 25% 75% 2 37%
SCL-280 SB Magdalena Ave to Leland Ave AM N/A N/A N/A N/A 3 N/APM 12% 88% 21% 79% 3 26%
NB Leland Ave to Magdalena Ave AM 13% 87% 22% 78% 3 26%PM N/A N/A N/A N/A 3 N/A
SCL-880 SB Dixon Landing Rd to I 880/SR237 Jct*** AMPM
NB I 880/SR237 Jct to Dixon Landing Rd*** AMPM
SM-101 SB Whipple Ave to Santa Clara Co. Line AM 9% 91% 18% 82% 3 27%PM 10% 90% 17% 83% 3 28%
NB Santa Clara Co. Line to Whipple Ave AM 12% 88% 20% 80% 3 27%PM 15% 85% 27% 73% 3 24%
SOL-80 EB Carquinez Bridge AM N/A N/A N/A N/A 11 N/APM 18% 82% 41% 59% 11 5%
SON-101 SB Route 12 to wilfred Avenue AM 9% 91% 18% 82% 2 41%PM 14% 86% 23% 77% 2 39%
NB Wilfred Avenue to Route 12 AM 14% 86% 25% 75% 2 38%PM 14% 86% 26% 74% 2 37%
* Total in all 4 HOVL's combined.
** Total in all 18 Non HOVL's combined.
*** Data collection location not avaliable within these limits.
N/A : Due to Resource shortfall 2006 data is not available.
District 4, Year 2006 Annual HOV Lane Report Page 22

HOV LANE PEAK PERIOD VIOLATION RATE SUMMARY
A.M. P.M.ALA-80 WB Bay Bridge Toll Plaza 9.7% 14.9%
ALA-80 WB Contra Costa County Line to Powell St 9.2% N/A
EB I 880 Viaduct to Contra Costa Co. Line N/A 10.3%
ALA-80 WB HOV FLYOVER RAMP 16.3% 16.2%
ALA-84 WB Newark Blvd to Dumbarton Bridge Toll Plaza 0.6% 1.0%
ALA-92 WB Hesperian Blvd to San Mateo Bridge Toll Plaza 1.3% 2.0%
ALA-680 SB Route 84 to Route 237 Calaveras Blvd 3.0% 1.1%
ALA-880 SB Marina Blvd to Whipple Road 3.2% 1.5%
Whipple Road to Mission Blvd. 12.0% 0.7%
NB Mission Blvd to Whipple Road 0.7% 1.0%
Whipple Road to South of Rte 238 I/C 2.2% 1.1%
ALA-880 NB 16th St to SFOBB Toll Plaza 8.5% N/A
CC-04 WB Loveridge Road to Port Chicago Hwy. 3.0% **
EB Port Chicago Hwy to Railroad Ave ** 1.7%
CC-80 WB Rte 4 to Alameda County Line 10.9% N/A
EB Alameda County Line to Rte 4 N/A 6.7%
CC-680 SB Marina Vista to N/O North Main St. 1.0% 1.4%
NB Route 242 to Marina Vista I/C 13.7% 2.3%
CC-680 SB Livorna Rd. to Alcosta Blvd. 7.6% 1.3%
NB Alcosta Blvd. to Livorna Rd. 2.1% 0.9%
MRN-101 SB Rte 37 to N. San Pedro Rd 1.4% **
Anderson Dr. to Strawberry ped o/c 1.4% **
NB S/O Richardson Bay Br to Nellen Ave UC ** 1.4%
N. San Pedro Rd to Rte 37 ** 2.2%
SCL-85 SB Rte 101 (Mountain View) to Rte 280 N/A 0.5%
Rte 280 to Almaden Expwy N/A 0.2%
Almaden Expwy to Rte 101 (So. San Jose) N/A 3.4%
NB Rte 101 (So. San Jose) to Almaden Expwy 3.8% N/A
Almaden Expwy to Rte 280 1.2% N/A
Rte 280 to Rte 101 (Mountain View) 0.7% N/A
SCL-87 SB Route 101 I/C to Taylor Avenue*
NB Taylor Avenue to Route 101 I/C 1.7% N/A
SCL-101 SB San Mateo Co. Line to Ellis St 0.7% 3.1%
Ellis St to Guadalupe Pkwy N/A 0.3%
Guadalupe Pkwy to 101/280/680 I/C N/A 0.1%
101/280/680 I/C to Bernal Rd N/A 3.3%
Bernal Rd to Cochrane Road N/A 1.2%
District 4, Year 2006 Annual HOV Lane Report Page 23

HOV LANE PEAK PERIOD VIOLATION RATE SUMMARY
A.M. P.M.NB Cochrane Rd to Bernal Rd 1.0% N/A
Bernal Rd to 101/280/680 I/C 2.2% N/A
101/280/680 I/C to Guadalupe Pkwy 3.8% N/A
Guadalupe Pkwy to Ellis St 0.7% N/A
Ellis St to San Mateo Co. Line 12.1% 0.1%
SCL-237 WB 880/237 Jct to Mathilda Ave 0.3% 4.3%
EB Mathilda Ave to Rte 880/237 Jct. 11.1% 4.2%
SCL-280 SB Magdalena Ave to Leland Ave N/A 3.5%
NB Leland Ave to Magdalena Ave 0.1% N/A
SCL-880 SB Dixon Landing Road to I 880/SR237 Jct*
NB I 880/SR237 Jct to Dixon Landing Road*
SM-101 SB Whipple Ave to Santa Clara Co. Line 0.8% 0.5%
NB Santa Clara Co. Line to Whipple Ave 0.2% 0.0%
SOL-80 EB Carquinez Bridge Toll Plaza N/A 11.0%
SON-101 SB Route 12 to Wilfred Avenue 4.7% 3.6%
NB Wilfred Avenue to Route 12 3.5% 3.7%
N/A: Due to Resource shortfall 2006 data is not available.* Data collection location not available within these limits.** HOV not in operation during this Peak Period
District 4, Year 2006 Annual HOV Lane Report Page 24

HOV LANE PEAK HOUR TIME SAVINGS AND AVERAGE SPEEDS
Travel Time Travel Time HOVL Avg. Speed Avg. Speed(minutes) (minutes) Time Saving (mph) (mph)
Non-HOVL HOVL (minutes) Non-HOVL HOVL
ALA-80 WB Bay Bridge Toll Plaza AM 20 5 15 3 13
PM 5 1 4 13 50
ALA-80 WB Contra Costa County Line to Powell St AM 9 7 2 28 36
PM 12 8 4 21 32
EB I 880 Viaduct to Contra Costa Co. Line AM 5 5 0 65 65
PM 22 10 12 16 35
ALA-80 WB HOV FLYOVER RAMP AM 9 7 2 6 8
PM 1 1 0 55 55
ALA-84 WB Newark Blvd to Dumbarton Bridge Toll Plaza AM 5 2 3 24 62
PM 2 2 0 62 62
ALA-92 WB Hesperian Blvd to San Mateo Bridge Toll Plaza AM 3 3 0 59 65
PM 3 3 0 56 65
ALA-680 SB Route 84 to Route 237 Calaveras Blvd. AM 20 13 7 41 65
PM 14 13 1 61 65
ALA-880 SB Marina Blvd. to Whipple Road AM 22 8 14 24 65
PM 16 8 8 33 65
Whipple Road to Mission Blvd AM 29 11 18 24 65
PM 17 11 6 40 65
NB Mission Blvd. to Whipple Road AM 16 11 5 44 65
PM 17 11 6 41 65
Whipple Road to South of Rte 238 I/C AM 10 5 5 33 65
PM 11 5 6 29 65
ALA-880 NB 16th St to SFOBB Toll Plaza AM 20 2 18 5 50
PM 3 2 1 36 50
CC-04 WB Loveridge Rd. to Port Chicago Hwy AM 23 8 15 22 65
EB Port Chicago Hwy to West of Railroad Ave. PM 11 7 4 39 65
CC-80 WB Rte 4 to Alameda County Line AM 21 18 3 29 34
PM 9 9 0 65 65
EB Alameda County Line to Rte 4 AM 9 9 0 65 65
PM 22 14 8 26 41
CC-680 SB Marina Vista I/C to N/O North Main St AM 22 7 15 21 65
PM 8 7 1 61 65
NB Route 242 to Marina Vista AM 5 4 1 54 65
PM 6 4 2 47 65
CC-680 SB Livorna Rd to Alcosta Blvd AM 20 11 9 36 65
PM 15 11 4 48 65
NB Alcosta Blvd to Livorna Rd AM 19 12 7 41 65
PM 27 12 15 29 65
MRN-101 SB Rte 37 to N. San Pedro Rd AM 31 23 8 12 16
Anderson Drive to Richardson Bay Brdg AM 6 6 0 55 55
NB Richardson Bay Brdg to Nellen Ave. UC PM 15 8 7 17 32
N. San Pedro Rd to Rte 37 PM 6 6 0 65 65
SCL-85 SB Rte 101 (Mtn View) to Rte 280 AM 5 5 0 64 65
PM 16 5 11 22 65
Rte 280 to Almaden Expwy AM 11 11 0 65 65
PM 30 11 19 24 65
Almaden Expwy to Rte 101 (So. San Jose) AM 6 6 0 65 65
PM 7 6 1 55 65
NB Rte 101 (So. San Jose) to Almaden Expwy AM 14 6 8 28 65
PM 7 6 1 58 65
Almaden Expwy to Rte 280 AM 24 12 12 31 65
PM 12 12 0 65 65
Rte 280 to Rte 101 (Mtn View) AM 14 5 9 23 65
PM 5 5 0 64 65
District 4, Year 2006 Annual HOV Lane Report Page 25

HOV LANE PEAK HOUR TIME SAVINGS AND AVERAGE SPEEDS
Travel Time Travel Time HOVL Avg. Speed Avg. Speed(minutes) (minutes) Time Saving (mph) (mph)
Non-HOVL HOVL (minutes) Non-HOVL HOVL
SCL-87 SB Route 101 I/C to Taylor Avenue AM 3 3 0 55 55
PM 9 3 6 16 55
NB Taylor Avenue to Route 101 I/C AM 11 3 9 12 55
PM 3 3 0 55 55
SCL-101 SB San Mateo Co. Line to Ellis St AM 7 5 2 47 65
PM 10 5 5 30 65
Ellis St to Guadalupe Pkwy AM 7 6 1 61 65
PM 19 6 13 22 65
Guadalupe Pkwy to 101/280/680 I/C AM 5 5 0 65 65
PM 21 11 10 17 32
101/280/680 I/C to Bernal Rd AM 7 7 0 65 65
PM 10 7 3 46 65
Bernal Rd to Cochrane Road AM 8 8 0 65 65
PM 9 8 1 60 65
NB Cochrane Road to Bernal Road AM 9 9 0 65 65
PM 9 9 0 65 65
Bernal Rd to 101/280/680 I/C AM 16 8 8 31 65
PM 8 8 0 63 65
101/280/680 I/C to Guadalupe Pkwy AM 15 9 6 20 32
PM 5 5 0 65 65
Guadalupe Pkwy to Ellis Street AM 13 7 6 33 65
PM 11 7 4 40 65
Ellis to San Mateo Co. Line AM 11 5 6 27 65
PM 12 5 7 25 65
SCL-237 WB McCarthy Blvd to Mathilda Ave AM 13 6 7 29 65
PM 8 6 2 46 65
EB Mathilda Ave to Rte 880/237 Jct. AM 8 6 2 47 65
PM 12 6 6 32 65
SCL-280 SB Magdalena Ave to Leland Ave AM 11 10 1 60 65
PM 16 10 6 40 65
NB Leland Ave to Magdalena Ave AM 27 10 17 24 65
PM 13 10 3 51 65
SCL-880 NB Route 237 to Dixon Landing Road AM 2 2 0 65 65
PM 12 2 10 10 65
SB Dixon Landing Road to Route 237 AM 2 2 0 65 65
PM 2 2 0 65 65
SM-101 SB Whipple Ave to Santa Clara Co. Line AM 21 6 15 19 65
PM 15 6 9 27 65
NB Santa Clara Co. Line to Whipple Ave AM 8 6 2 52 65
PM 9 6 3 46 65
SOL-80 EB Carquinez Bridge Toll Plaza AM 1 1 0 65 65
PM 1 1 0 65 65
SON-101 SB Rte 12 to Wilfred Avenue AM 4 4 0 65 65
PM 5 4 1 48 65
NB Wilfred Ave to Rte 12 AM 8 4 4 30 65
PM 5 4 1 48 65
Overall Average Speed 41.6 60.0
District 4, Year 2006 Annual HOV Lane Report Page 26

District 4, Year 2006 Annual HOV Lane Report Page 27
GENERAL FACILITYINFORMATION
• Mainline HOV Lanes
• Toll Bridge HOV Bypass Lanes

MAINLINE HOV LANES
ALA-80: San Francisco-Oakland Bay Bridge Toll Plaza
OCCUPANCY Three or more persons per vehicle, motorcycles, 2-seat vehicles with 2 persons,inherently low-emission vehicles (ILEVs) with DMV issued decal.
WESTBOUND HOURS: 5:00 - 10:00 AM, 3:00 - 7:00 PM, Monday thru Friday
LIMITS: Lane 1: Route 880 left side HOV ramp to metering signalsLength = 0.4 mile
Lane 2: Route 580 connector to metering signalsLength = 1.1 miles
Lane 21: Route 880 right side HOV ramp to metering signalsLength = 0.6 mile
Lane 22: HOV slip ramp to metering signalsLength = 0.8 miles
DATES: Apr 17, 1970 Opened; Buses onlyDec 8, 1971 Carpools permitted; min. occ. three persons per vehicleFeb 2, 1979 Buses only in lane 17; 6:30-8:30, Mon-Fri-only lane on
W. Grand Ave, approached from Maritime on-ramp to toll plaza;temporary measure in response to BART tube closure
Apr 17, 1979 Bus-only in lane 17 & W. Grand Ave approach made permanent;W. Grand Ave slip ramp designated for buses only; hours ofoperation changed to 6:00-9:00 AM, Mon-Fri; lane 8 reverted to mixed flow; carpools permitted to use lane 10 during AM peak
Oct 12, 1981 Opened; lanes 18 & 19; buses only, 24 hours/day, 7 days/week;carpools permitted, 6:00-9:00 AM, Mon-Fri; lane 17 reverted to mixed flow
Jul 18, 1983 Lanes 8 & 9 reverted to mixed flow; lane 1 converted to HOV;lanes 18/19 merge moved from downstream of toll plaza to downstream of metering signals
Apr 22, 1986 Mini toll plaza (lane 18, 19, 20) opened; right side HOV lanesdesignated as lanes 21 & 22
Sep 7, 1988 Hours of Operation were extended from 6-9 AM to 5-10 AMon September 7, 1988.
Sep 7, 1988 The HOVL violation fine increased in early 1989.Nov 3, 1989 Lane 2 converted to HOV; left HOVL extended upstream to 32nd
St on-ramp; AM HOV hours changed to 5:00- 10:00 AM, Mon-FriMar 1, 1992 Motorcycles permittedOct 1, 1995 Two-seat vehicles with two occupants permittedApr 8, 1997 HOV slip ramp approaching right side of toll plaza opened;
buses only, 24 hours/day, 7 days/week; carpools/motorcyclesOK, 5:00-10:00 AM, 3:00-6:00 PM, Mon-Fri
Jul 23, 1997 Route 880 right side HOV ramp opened; buses only, 24 hours/day,7 days/week; carpools/motorcycles OK, 5:00-10:00 AM;3:00-6:00 PM, Mon-Fri
Feb. 2, 1998 PM Hours of operation changed to 3:00-7:00 PMMay 16, 1998 Route 880 left side HOV ramp opened; buses/carpools/
motorcycles only, 5:00-10:00 AM, 3:00-7:00 PM, Mon-Fri
Jul 1, 2000 Inherently low-emission vehicles with DMV issued decals permitted.
District 4, Year 2006 Annual HOV Lane Report Page 29

ALA-80: HOV FLYOVER
OCCUPANCY Three or more persons per vehicle, motorcycles, 2 seaters vehicles with 2 persons,inherently low-emission vehicles (ILEVs) with DMV issued decal.
WESTBOUND HOURS: 5:00 - 10:00 AM, 3:00 - 7:00 PM, Monday thru Friday
LIMITS: Powell St (MP 3.8) to HOV Slip Ramp(MP. 4.8)Length = 1.0 miles
Feb 2, 1998 Opened; HOV flyover. Hours of operation 5:00 AM-7:00 PM,Monday thru Friday
Aug 3, 1998 Hours of operation changed to 5-10 AM, 3-7 PM, Mon-Fri
ALA-80: Contra Costa County Line to I-880 Viaduct
OCCUPANCY Three or more persons per vehicle, motorcycles, 2 seaters vehicles with 2 persons,inherently low-emission vehicles (ILEVs) with DMV issued decal.
WESTBOUND HOURS: 5:00 - 10:00 AM, 3:00 - 7:00 PM, Monday thru Friday
LIMITS: Contra Costa County Line (MP 8.0) to Powell St (MP 3.8)Length = 4.2 miles
DATES: Feb. 2, 1998 Opened; Contra Costa County Line to Powell St;HOV flyover opened; hours of operation 5:00 AM-7:00 PM,Monday thru Friday
Aug 3, 1998 Hours of operation changed to 5-10 AM, 3-7 PM, Mon-Fri
EASTBOUND HOURS: 5:00 - 10:00 AM, 3:00 - 7:00 PM, Monday thru Friday
LIMITS: I-880 Viaduct(MP 2.2) to Contra Costa County Line (MP 8.0)Length = 5.8 miles
DATES: Jul 31, 1998 Opened; Gilman St to Contra Costa County LineAug 3, 1998 Hours of operation changed to 5-10 AM, 3-7 PM, Mon-FriNov 20, 1998 Extended; Powell St to Gilman St.Nov 12, 2003 Extended; I 880 Viaduct to Powell St.
ALA-84: Newark Blvd to Dumbarton Bridge Toll Plaza
OCCUPANCY Two or more persons per vehicle, motorcycles, inherently low-emission vehicles (ILEVs) with DMV issued decal.
WESTBOUND HOURS: 5:00 - 10:00 AM, 3:00 - 6:00 PM, Monday thru Friday
LIMITS: Newark Blvd U/C (MP 4.9) to west of Toll Plaza (MP 3.1)Length = 1.8 miles
DATES: Oct 6, 1982 Opened with new bridge; 1000-ft long bypass lane at boothsNov 22, 1989 Extended due to Loma Prieta quake; Newark Blvd to
University AveNov 17, 1990 Shortened; Newark Blvd to west of Toll PlazaJan 1, 1992 Minimum occupancy reduced from three to two persons per vehicle
District 4, Year 2006 Annual HOV Lane Report Page 30

ALA-92: Hesperian Blvd to San Mateo Bridge Toll Plaza
OCCUPANCY Two or more persons per vehicle, motorcycles, inherently low-emission vehicles (ILEVs)with DMV issued decal.
WESTBOUND HOURS: 5:00 - 10:00 AM, 3:00 - 6:00 PM, Monday thru Friday
LIMITS: Hesperian on-ramp (MP 5.6) to Toll Plaza (MP 2.8)Length = 2.8 miles
DATES: Oct 23, 1989 Opened; Clawiter Rd on-ramp to east of Toll PlazaJan 1, 1992 Minimum occupancy reduced from three to two persons per vehicleJan 15, 1992 Extended; Clawiter Rd on-ramp to west of Toll PlazaJul 2, 2001 Extended and relocated; Hesperian Blvd. To West of Toll PlazaJun 3, 2003 Speed changed from 55mph to 65 mph
ALA/SCL-680: Route 84 to Route 237 Calaveras Blvd.
OCCUPANCY Two or more persons per vehicle, motorcycles, inherently low-emission vehicles (ILEVs)with DMV issued decal.
SOUTHBOUND HOURS: 5:00 - 9:00 AM, 3:00 - 7:00 PM, Monday thru Friday
LIMITS: Route 84 on-ramp (MP R11.5) to Route 237 Calaveras Blvd. On-ramp (MP M7.6)Length = 14.0 miles
DATES: Nov 26, 2002 Opened; Washington Blvd. On-ramp to Route 237 Calaveras Blvd. On-rampDec 5, 2002 Extended; Route 84 on-ramp to Route 237 Calaveras Blvd. On-ramp
ALA 880: Marina Blvd to Mission Blvd (Rte 262)
OCCUPANCY Two or more persons per vehicle, motorcycles, inherently low-emission vehicles (ILEVs)with DMV issued decal.
SOUTHBOUND HOURS: 5:00 - 9:00 AM, 3:00 - 7:00 PM, Monday thru Friday
LIMITS: Marina Blvd. (MP 22.7) to Mission Blvd. (Rte 262) (MP 2.4)Length = 20.5 miles
DATES: Sep 22, 1991 Opened; A-Street to north of TennysonNov 6, 1991 Extended; Tennyson to Industrial PkwyJun 26, 1992 Extended; Rte 238 to A-StreetNov 18, 1993 Extended; Industrial Pkwy to Whipple RdDec 1994 Hours of operation changed from 5-10 AM and 3-6 PM to
5-9 AM, 3-7 PM respectivelyMar 17, 1995 Extended; Marina Blvd to Rte 238Jun 15, 1998 Extended; Whipple Rd. to Alvarado/ Fremont Blvd.Oct 23, 1998 Extended; Alvarado/Fremont Blvd. to Mowry Ave.Dec 11, 1998 Extended; Mowry Ave. to Mission Blvd. (Rte 262)
District 4, Year 2006 Annual HOV Lane Report Page 31

NORTHBOUND HOURS: 5:00 - 9:00 AM, 3:00 - 7:00 PM, Monday thru Friday
LIMITS: Mission Blvd. (MP 2.4) to one mile south of Rte 238 (MP 19.3)Length = 16.7 miles
DATES: Sep 19, 1991 Opened; north of Tennyson to A-StreetNov 8, 1991 Extended; Industrial Pkwy to TennysonJun 26, 1992 Extended; A-Street to Rte 238Dec 3, 1993 Extended; Whipple Rd to Industrial PkwyDec 1994 Hours of operation changed from 5-10 AM and 3-6 PM to
5-9 AM, 3-7 PM respectivelySep 23, 1996 Shortened; Whipple Rd to one mile south of Rte 238Jun 15, 1998 Extended; Alvarado/Fremont Blvd. to Whipple Rd.Oct 30, 1998 Extended; Mowry Ave. to Alvarado/Fremont Blvd.Nov 30, 1998 Extended; Mission Blvd. (Rte 262) to Mowry Ave.
ALA-880: 16th Street to SFOBB Toll Plaza
OCCUPANCY Three or more persons per vehicle, motorcycles, 2-seat vehicles with 2 persons, inherently low-emission vehicles (ILEVs) with DMV issued decal.
NORTHBOUND HOURS: 5:00 - 10:00 AM, 3:00 - 7:00 PM, Monday thru Friday
LIMITS: 16th Street to NB Rte 880/WB Rte 80 JctLength = 1.4 miles
DATES: May 16, 1998 Opened; 16th Street to left HOV ramp at SFOBB Toll Plaza
ALA-880: West Grand Ave. to EB Rte 80 HOV Lane Merge
OCCUPANCY Three or more persons per vehicle, motorcycles, 2-seat vehicles with 2 persons, inherently low-emission vehicles (ILEVs) with DMV issued decal.
NORTHBOUND HOURS: 5:00 - 10:00 AM, 3:00 - 7:00 PM, Monday thru Friday
LIMITS: West Grand Ave.(MP R34.7) to EB Rte 80 HOV Lane Merge (MP R35.8)Length = 1.1 miles
DATES: Nov 12, 2003 Opened; West Grand Ave to EB Rte 80 HOV Lane Merge
District 4, Year 2006 Annual HOV Lane Report Page 32

CC-4: Loveridge Rd. to Port Chicago Highway
OCCUPANCY Two or more persons per vehicle, motorcycles, inherently low-emission vehicles (ILEVs)with DMV issued decal.
WESTBOUND HOURS: 6:00 - 9:00 AM, Monday thru Friday
LIMITS: Loveridge Rd. (MP 24.4) to Port Chicago Highway (MPR 15.7)Length = 8.7 miles
DATES: May 1, 2000 Opened; Bay Point to Port Chicago Highway; 6-9 AM, Mon-FriMay 5, 2000 Extended: Bailey Road to Port Chicago HighwayJul 23, 2001 Extended: West of Railroad Ave. to Port Chicago HighwayJul 24, 2006 Extended: Loveridge Rd. to Port Chicago Highway
EASTBOUND HOURS: 3:00 - 7:00 PM, Monday thru Friday
LIMITS: Port Chicago Highway (MPR 16.2) to Railroad Ave. (MPR23.5)Length = 7.3 miles
DATES: Aug 6, 2001 Opened; Port Chicago Highway to West of Railroad Ave.Jul 24, 2006 Extended: Port Chicago Highway to Railroad Ave.
CC-80 Route 4 to Alameda County Line
OCCUPANCY Three or more persons per vehicle, motorcycles, 2-seat vehicles with 2 persons,inherently low-emission vehicles (ILEVs) with DMV issued decal.
WESTBOUND HOURS: 5:00 - 10:00 AM, 3:00 - 7:00 PM, Monday thru Friday
LIMITS: Route 4 (MP 10.1) to Alameda County Line (MP 0.0)Length = 10.1 miles
DATES: Mar 5, 1997 Opened; Pinole Valley Rd to Cutting Blvd; 5-10 AM, Mon-FriApr 18, 1997 2-seat vehicles with 2 persons permitted to use HOVLMay 3, 1997 Extended: Cutting Blvd to Central AveSep 20, 1997 Extended; Route 4 to Pinole Valley RdFeb 2, 1998 Extended; Central Ave to Alameda County Line;
Hours of operation changed to 5:00 AM-7:00 PM, Mon-FriAug 3, 1998 Hours of operation changed to 5-10 AM, 3-7 PM, Mon-Fri
EASTBOUND HOURS: 5:00 - 10:00 AM, 3:00 - 7:00 PM, Monday thru Friday
LIMITS: Alameda County Line (MP 0.0) to West of Route 4 off-ramp (MP 9.5)Length = 9.5 miles
DATES: Feb 12, 1997 Opened; San Pablo Dam Rd to Pinole Valley Rd; 3-7 PM, Mon-FriFeb 13, 1997 Extended; Cutting Blvd to San Pablo Dam RdApr 18, 1997 2-seat vehicles with 2 persons permitted to use HOVLMay 3, 1997 Extended; Central Ave to Cutting BlvdAug 30, 1997 Extended; Pinole Valley Rd to Route 4Feb 2, 1998 Hours of operation changed to 5:00 AM-7:00 PM, Mon-FriAug 3, 1998 Hours of operation changed to 5-10 AM, 3-7 PM, Mon-Fri
Extended; Central Ave to Alameda County Line
District 4, Year 2006 Annual HOV Lane Report Page 33

CC-680: Marina Vista to N/O North Main St.
OCCUPANCY Two or more persons per vehicle, motorcycles, inherently low-emission vehicles (ILEVs)with DMV issued decal.
SOUTHBOUND HOURS: 6:00 - 9:00 AM, 3:00 - 7:00 PM, Monday thru Friday
LIMITS: South of Marina Vista(MP 24.1) to 0.7 miles N/O North Main St. off-ramp (MP R16.3)Length = 7.8 miles
DATES: Sep 11, 2004 Opened; S/O Route 4 to N/O North Main St. Jun 14, 2005 Extended S/O Marina Vista to North Main St.
NORTHBOUND HOURS: 6:00 - 9:00 AM, 3:00 - 7:00 PM, Monday thru Friday
LIMITS: Route 242 I/C (R018.707) to South of Marina Vista(24.1)Length = 4.4 miles
DATES: Apr 28, 2005 Opened; Route 242 to South of Marina Vista.
CC-680: Livorna Rd to Alcosta Blvd.
OCCUPANCY Two or more persons per vehicle, motorcycles, inherently low-emission vehicles (ILEVs)with DMV issued decal.
SOUTHBOUND HOURS: 6:00 - 9:00 AM, 3:00 - 6:00 PM, Monday thru Friday
LIMITS: 0.5 miles north of Livorna Rd off-ramp (MP R11.9) to north ofAlcosta Blvd on-ramp (MP R21.6)Length = 11.9 miles
DATES: Oct 3, 1994 Opened; Stone Valley Rd on-ramp to Alcosta Blvd on-rampFeb 6, 1995 Extended; Livorna Rd on-ramp to Alcosta BlvdMay 5, 1999 Shortened; Livorna Rd on-ramp to north of Alcosta Blvd off-ramp
NORTHBOUND HOURS: 6:00 - 9:00 AM, 3:00 - 6:00 PM, Monday thru Friday
LIMITS: 0.4 miles south of Alcosta on-ramp (MP R21.6) to Livorna on-ramp (MP R11.9)Length = 12.9 miles
DATES: Oct 3, 1994 Opened; Alcosta Blvd on-ramp to Stone Valley Rd on-rampFeb 6, 1995 Extended; Alcosta Blvd to Livorna Rd on-ramp
District 4, Year 2006 Annual HOV Lane Report Page 34

MRN-101: Richardson Bay Bridge to Anderson Dr.
OCCUPANCY Two or more persons per vehicle, motorcycles permitted, inherently low-emission vehicles (ILEVs)with DMV issued decal.
SOUTHBOUND HOURS: 6:30 - 8:30 AM, Monday thru Friday
LIMITS: Anderson Dr. (MP 9.9) to south of Strawberry ped OC (MP 4.7)Length = 5.2 miles
DATES: Dec 23, 1974 Opened; buses onlyJun 16, 1976 Carpools permitted; min. occ. three persons per vehicleOct 1, 1988 Minimum occupancy reduced from three to two persons per vehicleSep 23, 1990 Motorcycles permittedJul 13, 1998 HOV hours extended to 5:00-9:00 AMDec 14, 1998 Extended hours cancelledJul 17, 2006 Extended: Anderson Dr. to North of Greenbrae ped OC
NORTHBOUND HOURS: 4:30 - 7:00 PM, Monday thru Friday
LIMITS: South of Richardson Bay Bridge (MP 4.0) to Nellen Ave. UC Length = 4.3 miles
DATES: Dec 20, 1974 Opened; buses onlyJun 15, 1976 Carpools permitted; min. occ. three persons per vehicleOct 1, 1988 Minimum occupancy reduced from three to two persons per vehicleSep 23, 1990 Motorcycles permittedJul 13, 1998 HOV hours extended to 3:00-7:00 PMDec 14, 1998 Extended hours cancelledJul 20, 2006 Extended: North of Corte Madera to Nellen Ave. UC
MRN-101: North San Pedro Rd to Rte 37
OCCUPANCY Two or more persons per vehicle, motorcycles, inherently low-emission vehicles (ILEVs)with DMV issued decal.
SOUTHBOUND HOURS: 6:30 - 8:30 AM, Monday thru Friday
LIMITS: Route 37/S. Novato Blvd (MP 18.9) to north of San Pedro U/C (MP 12.8)Length = 6.1 miles
DATES: Jul 24, 1987 Opened; Marinwood to North San Pedro RdOct 1, 1988 Minimum occupancy reduced from three to two persons per vehicleSep 23, 1990 Motorcycles permittedFeb 8, 1991 Extended; Marinwood to Rte 37Jul 13, 1998 HOV hours extended to 5:00-9:00 AMDec 14, 1998 Extended hours cancelled
NORTHBOUND HOURS: 4:30 - 7:00 PM, Monday thru Friday
LIMITS: North of San Pedro U/C (MP 12.8) to Route 37/S. Novato Blvd (MP 18.9)Length = 6.1 miles
District 4, Year 2006 Annual HOV Lane Report Page 35

DATES: Aug 12, 1986 Opened; North San Pedro to MarinwoodOct 1, 1988 Minimum occupancy reduced from three to two persons per vehicleSep 23, 1990 Motorcycles permittedFeb 21, 1991 Extended; Marinwood to Rte 37Jul 13, 1998 HOV hours extended to 3:00-7:00 PMDec 14, 1998 Extended hours cancelled
SCL-85: Rte 101 (Mountain View) to Rte 101 (So. San Jose)
OCCUPANCY Two or more persons per vehicle, motorcycles, inherently low-emission vehicles (ILEVs)with DMV issued decal.
SOUTHBOUND HOURS: 5:00 - 9:00 AM, 3:00 - 7:00 PM, Monday thru Friday
LIMITS: Rte 85/101 connector ramp in So. San Jose (MP 23.8) to Rte 101 in Mountain View (MP 0.5)Length = 23.8 miles
DATES: Apr 25, 1990 Opened; Rte 237 to Rte 280Aug 12, 1994 New section; Almaden Expwy to Bernal RdOct 19, 1994 Extended; Rte 280 to Almaden ExpwyNov 13, 1998 Extended; Rte 101 (Mountain View) to Rte 237Oct 22, 2004 Opened direct HOV Connector from SB 85 to SB 101(San Jose)May 26,2006 Opened direct HOV Connector from SB 101 to SB 85 (Mountain View)
NORTHBOUND HOURS: 5:00 - 9:00 AM, 3:00 - 7:00 PM, Monday thru Friday
LIMITS: Rte 85/101 connector ramp in So. San Jose (MP 0.0) to Rte 101 in Mountain View (MP 23.8)Length = 24.2 miles
DATES: Feb 22, 1990 Opened; Rte 280 to Rte 237Aug 12, 1994 New section; Rte 101 (So. San Jose) to Almaden ExpwyOct 19, 1994 Extended; Almaden Expwy to Rte 280Nov 6, 1998 Extended; Rte 237 to Rte 101 (Mountain View)Sep 20, 2004 Opened direct HOV Connector from NB 101 to NB 85(San Jose)May 26, 2006 Opened direct HOV Connector from NB 85 to NB 101(Mountain View)
SCL-87: Route 101 I/C to Taylor Avenue
OCCUPANCY Two or more persons per vehicle, motorcycles, inherently low-emission vehicles (ILEVs)with DMV issued decal.
SOUTHBOUND HOURS: 5:00 - 9:00 AM, 3:00 - 7:00 PM, Monday thru Friday
LIMITS: Route 101 I/C to Taylor AvenueLength = 2.4 miles
DATES: Dec 23, 2004 Opened
NORTHBOUND HOURS: 5:00 - 9:00 AM, 3:00 - 7:00 PM, Monday thru Friday
LIMITS: Taylor Avenue to Route 101 I/CLength = 2.4 miles
DATES: Apr 18, 2005 Opened
District 4, Year 2006 Annual HOV Lane Report Page 36

SCL-101: San Mateo County Line to Cochrane Rd
OCCUPANCY Two or more persons per vehicle, motorcycles, inherently low-emission vehicles (ILEVs)with DMV issued decal.
SOUTHBOUND HOURS: 5:00 - 9:00 AM, 3:00 - 7:00 PM, Monday thru Friday
LIMITS: San Mateo County Line (MP 52.6) to 0.5 mile north of Cochrane Rdoff-ramp (MP 18.7)Length = 34.2 miles
DATES: Nov 10, 1986 Opened; Lawrence Expwy to De La Cruz BlvdAug 8, 1988 Extended; Ellis St to Lawrence ExpwyOct 10, 1988 Extended; N. Rengstorff Ave to Ellis StDec 12, 1988 Extended; San Mateo Co. Line to N. Rengstorff AveJun 15, 1990 New section; Rte 101/280/680 I/C to north of Bernal RdJan 29, 1993 Extended; Rte 880 to Rte 101/280/680 I/CApr 5, 1993 Extended; De La Cruz Blvd to Rte 880Mar 19, 2003 Opened; Bernal Road to Cochrane Road
NORTHBOUND HOURS: 5:00 - 9:00 AM, 3:00 - 7:00 PM, Monday thru Friday
LIMITS: Cochrane Rd on-ramp (MP 17.9) to San Mateo County Line (MP 51.2)Length = 34.9 miles
DATES: Nov 7, 1986 Opened; Guadalupe Pkwy to Great America PkwyOct 10, 1988 Extended; Great America Pkwy to N. Rengstorff AveDec 12, 1988 Extended; N. Rengstorff Ave to San Mateo Co. LineJun 7, 1990 New section; Bernal Rd to Rte 101/280/680 I/CFeb 1, 1993 Extended; Rte 101/280/680 I/C to Old Oakland RdApr 5, 1993 Extended; Old Oakland Rd to Guadalupe Pkwy
May 19, 2003 Opened; Cochrane Rd to Bernal Road
SCL-237: Rte 880 to Mathilda Ave
OCCUPANCY Two or more persons per vehicle, motorcycles, inherently low-emission vehicles(ILEVs) with DMV issued decal.
WESTBOUND HOURS: 5:00 - 9:00 AM, 3:00 - 7:00 PM, Monday thru Friday
LIMITS: Jct. Rte 880/237 (MP 9.3) to east of Mathilda Ave (MP 3.2)Length = 6.1 miles
DATES: Oct 31, 1984 Opened; Rte 880 to Lawrence Expwy; right side HOVLNov/Dec 1991 Extended; Lawrence Expwy to east of Mathilda Ave; right side HOVLMay 1, 1995 Rte 237 upgraded to fwy; HOVL relocated to left lane;
hours expanded to include the PM peak (3-7 PM)May 1, 2005 Opened direct HOV connectors SB 880/WB 237
EASTBOUND HOURS: 5:00 - 9:00 AM, 3:00 - 7:00 PM, Monday thru Friday
LIMITS: Mathilda Ave (MP 2.8) to Jct Rte 880/237 (MP 9.3)Length = 6.5 miles
DATES: Oct 31, 1984 Opened; Lawrence Expwy to Rte 880; right side HOVLNov/Dec 1991 Extended; Mathilda Ave to Rte 880May 1, 1995 Rte 237 upgraded to fwy; HOVL relocated to left lane;
hours expanded to include the AM peak (5-9 AM)
District 4, Year 2006 Annual HOV Lane Report Page 37

Oct 2, 1996 Shortened; Mathilda Ave to 1.1 miles west of Rte 880Apr. 29, 2005 Opened; Route 880/237 HOVL Direct Connector
SCL-280: Magdalena Ave to Leland Ave
OCCUPANCY Two or more persons per vehicle, motorcycles, inherently low-emission vehicles (ILEVs)with DMV issued decal.
SOUTHBOUND HOURS: 5:00 - 9:00 AM, 3:00 - 7:00 PM, Monday thru Friday
LIMITS: Magdalena Ave on-ramp (MP 14.0) to north of Meridian Ave (MP R4.2)Length = 10.5 miles
DATES: Dec 1, 1990 Opened; Magdalena Ave to north of Meridian Ave
NORTHBOUND HOURS: 5:00 - 9:00 AM, 3:00 - 7:00 PM, Monday thru Friday
LIMITS: South of Leland Ave (MP L4.7) to Magdalena Ave off-ramp (MP 14.0)Length = 10.8 miles
DATES: Nov 21, 1990 Opened; south of Leland Ave to Magdalena Ave
SCL-880: I-880/ 237 Junction to Dixon Landing Road
OCCUPANCY Two or more persons per vehicle, motorcycles, inherently low-emission vehicles (ILEVs)with DMV issued decal.
SOUTHBOUND HOURS: 5:00 - 9:00 AM, 3:00 - 7:00 PM, Monday thru Friday
LIMITS: Dixon Landing Road to Jct I-880/237Length = 1.2 miles
DATES: May 1, 2005 Opened
NORTHBOUND HOURS: 5:00 - 9:00 AM, 3:00 - 7:00 PM, Monday thru Friday
LIMITS: I-880/237 Jct to Dixon Landing RoadLength = 2.0 miles
DATES: Apr 22, 2005 Opened
SM-101: Whipple Ave to Santa Clara County Line
OCCUPANCY Two or more persons per vehicle, motorcycles, inherently low-emission vehicles (ILEVs)with DMV issued decal.
SOUTHBOUND HOURS: 5:00 - 9:00 AM, 3:00 - 7:00 PM, Monday thru Friday
LIMITS: Whipple Ave (MP 6.6) to Santa Clara Co. Line (MP 0.0)Length = 6.7 miles
DATES: Jul 18, 1991 Opened
District 4, Year 2006 Annual HOV Lane Report Page 38

NORTHBOUND HOURS: 5:00 - 9:00 AM, 3:00 - 7:00 PM, Monday thru Friday
LIMITS: Santa Clara Co. Line (MP 0.0) to Whipple Ave (MP 6.6)Length = 6.9 miles
DATES: Jul 16, 1991 Opened
SOL-80: Carquinez Bridge Toll Plaza
OCCUPANCY Three or more persons per vehicle, motorcycles, 2-seat vehicles with 2 persons,inherently low-emission vehicles (ILEVs) with DMV issued decals.
EASTBOUND HOURS: 5:00 - 10:00 AM, 3:00 - 7:00 PM, Monday thru Friday
LIMITS: 0.1 miles West of Toll Plaza (MP 0.5) to east of Toll Plaza (MP 0.6)Length = 0.1 mile
DATES: Jul 1, 1991 Reduced 10c toll tickets for HOVs (with purchase of 50-ticket book)Oct 1, 1995 Toll-free passage in designated booth only;
Two-seat vehicles with two occupants permittedJul 30, 1997 Opened; West of Toll Plaza to east of Toll Plaza
NOTE: HOV lane is located in toll booth #6
SON-101: Rte 12 to Wilfred Avenue
OCCUPANCY Two or more persons per vehicle, motorcycles, inherently low-emission vehicles (ILEVs)with DMV issued decal.
SOUTHBOUND HOURS: 7:00 - 9:00 AM, 3:00 - 6:30 PM, Monday thru Friday
LIMITS: Route 12 to North of Wilfred AvenueLength = 4 miles
DATES: Nov 4, 2002 Opened.Dec 11, 2003 Hours of Operation changed to 7-9 AM, 3-6:30 PM, MON - FRI
NORTHBOUND HOURS: 7:00 - 9:00 AM, 3:00 - 6:30 PM, Monday thru Friday
LIMITS: Wilfred Avenue to South of Route 12Length = 4 miles
DATES: Nov 4, 2002 Opened.Dec 11, 2003 Hours of Operation changed to 7-9 AM, 3-6:30 PM, MON - FRI
District 4, Year 2006 Annual HOV Lane Report Page 39

TOLL BRIDGE HOV BYPASS LANES
Benicia-Martinez, Antioch Bridges
OCCUPANCY Three or more persons per vehicle, motorcycles, two-seat vehicleswith two occupants, inherently low-emission vehicles (ILEVs) with DMV issued decals.
HOURS 5:00 - 10:00 AM, 3:00 - 7:00 PM, Monday thru Friday
TOLL-FREE Benicia #4, #5BOOTHS Antioch #2, #3
DATES Jul 1, 1991 Reduced 10¢ toll tickets for HOVs (with purchase of 50-ticket book)Oct 1, 1995 Toll-free passage in designated booth only;
Two-seat vehicles with two occupants permitted
Richmond-San Rafael Bridge
OCCUPANCY Three or more persons per vehicle, motorcycles, two-seat vehicleswith two occupants, inherently low-emission vehicles (ILEVs) with DMV issued decals.
HOURS 5:00 - 10:00 AM, 3:00 - 6:00 PM, Monday thru Friday
TOLL-FREE #4BOOTH
DATES Oct. 23, 1989 Toll-free passage in designated booth only;Oct 1, 1995 Two-seat vehicles with two occupants permitted
San Mateo-Hayward, Dumbarton Bridges
OCCUPANCY Two or more persons per vehicle, motorcycles, inherently low-emissionvehicles (ILEVs) with DMV issued decal.
HOURS 5:00 - 10:00 AM, 3:00 - 6:00 PM, Monday thru Friday
TOLL-FREE San Mateo #1BOOTHS Dumbarton Left side bypass lane
DATES See information in Mainline HOV Lane section
District 4, Year 2006 Annual HOV Lane Report Page 40

TOLL BRIDGE HOV BYPASS LANES
San Francisco-Oakland Bay Bridge
OCCUPANCY Three or more persons per vehicle, motorcycles, two-seat vehicleswith two occupants, inherently low-emissions vehicles (ILEVs)with DMV issued decal.
HOURS 5:00 - 10:00 AM, 3:00 - 7:00 PM, Monday thru Friday
TOLL-FREE #1, #2, Lanes 21 & 22BOOTHS
DATES See information in Ala-80 Mainline HOV Lane section
Carquinez Bridge
OCCUPANCY Three or more persons per vehicle, motorcycles, two-seat vehicleswith two occupants, inherently low-emissions vehicles (ILEVs)with DMV issued decal.
HOURS 5:00 - 10:00 AM, 3:00 - 7:00 PM, Monday thru Friday
TOLL-FREE # 6BOOTHS
DATES See information in Sol-80 Mainline HOV lane section
District 4, Year 2006 Annual HOV Lane Report Page 41

District 4, Year 2006 Annual HOV Lane Report Page 43
MAINLINE HOV LANES
VOLUME/PERSON DATA and
VIOLATION HISTORY

ALAMEDA-80 Westbound - A.M.San Francisco-Oakland Bay Bridge Toll Plaza Typical data for 2006
PEAK PERIOD PEAK HOUR6:00 - 10:00 AM 7:00 - 8:00 AM
VEHICLES HOV LanesMixed Flow
Lanes HOV LanesMixed Flow
Lanes
Motorcycles 575 — 164 —
Buses (4) 257 — 70 —
Carpools (1) 6265 — 2461 —
2 - seaters (2) 2192 — 693 —
Vanpools 101 — 24 —Violators 1004 — 249 —
TOTAL 10394 29567 3661 5180
PERSONS HOV LanesMixed Flow
Lanes HOV LanesMixed Flow
Lanes
Motorcycles 575 — 164 —
Buses (4) 8995 — 2450 —
Carpools (1) 19422 — 7629 —
2 - seaters (2) 4384 — 1386 —
Vanpools 1010 — 240 —Violators 1405 — 370 —
TOTAL 35791 34002 12239 5957
RATES
HOV Lane Occupancy Rate
3.4 persons/veh 3.3 persons/veh
Mixed FlowOccupancy Rate
(7)
1.1 persons/veh 1.1 persons/veh
Violation rate(HOV Lane)
(3)
9.7 % 6.8 %
NOTES: (1) 3 or more persons per vehicle.
(2) 2 - seater vehicles with 2 persons.
(3) Violation rate = no. of violators in HOV lane x 100%
Total no. of vehicles in HOV lane
(4) Assumed AM bus occupancy = 35 persons/vehicle.
(5) HOV lanes in operation from 5:00 to 10:00 AM.
(6) Observations conducted 5/31/06 at the SFOBB Toll Plaza.
(7) Data from Toll Plaza Vehicle Registration Report.
(5)
(6)
(7)
(7)
District 4, Year 2006 Annual HOV Lane Report Page 45

ALAMEDA-80 Westbound - P.M.San Francisco-Oakland Bay Bridge Toll Plaza Typical data for 2006
PEAK PERIOD PEAK HOUR3:00 - 7:00 PM 5:00 - 6:00 P.M.
VEHICLES HOV LanesMixed Flow
Lanes HOV LanesMixed Flow
Lanes
Motorcycles 294 — 67 —
Buses (4) 312 — 77 —
Carpools (1) 1514 — 431 —
2 - seaters (2) 476 — 151 —
Hybrid 398 113
Vanpools 107 — 33 —Violators 544 — 145 —
TOTAL 3645 26863 (7) 1017 7105
PERSONS HOV LanesMixed Flow
Lanes HOV LanesMixed Flow
Lanes
Motorcycles 294 — 67 —
Buses (4) 4992 — 1232 —
Carpools (1) 4693 — 1336 —
2 - seaters (2) 952 — 302 —
Hybrid 398 113
Vanpools 856 — 264 —Violators 908 — 231 —
TOTAL 13093 32236 (7) 3545 8526
RATES
HOV Lane Occupancy Rate
3.6 persons/veh 3.5 persons/veh
Mixed FlowOccupancy Rate
(7)
1.1 persons/veh 1.1 persons/veh
Violation rate(HOV Lane)
(3)
14.9 % 14.3 %
NOTES: (1) 3 or more persons per vehicle.
(2) 2 - seater vehicles with 2 persons.
(3) Violation rate = no. of violators in HOV lane x 100%
Total no. of vehicles in HOV lane
(4) Assumed PM bus occupancy = 16 persons/vehicle.
(5) HOV lanes in operation from 3:00 to 7:00 P.M.
(6) Observations conducted 10/19/06 at the SFOBB Toll Plaza.
(7) Data from Toll Plaza Hourly Vehicle Registration Report.
(5)
(6)
District 4, Year 2006 Annual HOV Lane Report Page 46

ALAMEDA-80 Violation HistorySan Francisco-Oakland Bay Bridge Westbound
By Lane By Time
DATE
TOTAL HOVL
VOLUMEVIOLATION
RATELanes 1 & 2
Lanes 21&22
5 - 6 AM
6 - 7 AM
7 - 8 AM
8 - 9 AM
9 - 10 AM
A.M. Wed May 31, 2006 10394 9.7% 10.3% 9.1% --- 18.4% 6.8% 6.0% 5.9%
PEAK Tue Nov 15, 2005 10261 9.9% 8.7% 11.2% --- 13.3% 8.1% 5.8% 16.1%
Wed Nov 3, 2004 10917 10.0% 8.2% 11.7% 21.4% 12.5% 7.9% 6.3% 9.0%
Wed May 28, 2003 10803 8.2% 7.4% 9.0% 15.5% 8.4% 7.0% 6.1% 9.6%
Thu May 9, 2002 11481 9.5% 4.9% 13.8% 22.4% 12.0% 7.5% 3.8% 10.5%
Wed May 23, 2001 13100 10.0% 7.2% 12.8% 22.3% 12.2% 5.8% 6.9% 10.4%
Thu Nov 9, 2000 12991 14.7% 8.9% 19.9% 37.8% 16.9% 10.4% 6.4% 14.3%
Thu Oct 14, 1999 11644 19.5% 9.8% 29.7% 60.1% 32.6% 7.7% 6.9% 11.5%
Tue Apr 21, 1998 9696 10.6% 7.6% 12.5% 14.2% 22.7% 6.4% 4.1% 9.2%
Wed Jun 11, 1997 7655 10.9% 1.0% 12.4% 20.9% 10.6% 8.1% 6.0% 21.5%
Tue Apr 23, 1996 7258 10.6% 10.9% 9.6% 17.1% 12.5% 8.2% 7.5% 16.9%
3 - 4 PM
4 - 5 PM
5 - 6 PM
6 - 7 PM
P.M. Thu Oct 19, 2006 3645 14.9% 11.0% 19.0% 15.2% 14.8% 14.3% 15.5%
PEAK Tue Oct 25, 2005 3106 16.3% 18.5% 13.5% 20.2% 13.5% 13.9% 18.5%
Thu Oct 28, 2004 3290 9.1% 10.6% 7.0% 10.9% 7.9% 8.1% 9.6%
Tue May 27, 2003 3891 14.7% 17.2% 11.8% 24.4% 11.7% 9.3% 15.7%
Wed Sep 18, 2002 3327 11.7% 12.7% 15.0% 16.5% 11.6% 10.9% 15.8%
Wed Oct 3, 2001 3602 9.8% 10.6% 8.8% 12.6% 7.6% 9.3% 10.1%
Thu Oct 19, 2000 3673 25.6% 17.0% 33.3% 32.0% 24.4% 21.1% 25.3%
Thu Oct 14, 1999 3193 10.6% 12.0% 9.0% 15.6% 10.4% 7.6% 0.097
Tue Oct 20, 1998 2335 19.1% 15.6% 21.6% 26.6% 24.9% 10.1% 0.17
Wed Jun 11, 1997 1905 17.0% 19.2% 12.5% 23.0% 14.3% 13.7% —
Tue Apr 23, 1996 1737 14.7% 17.2% 7.7% 16.1% 12.5% 15.7% —
NOTES: (a) Two-seater vehicles with 2 persons allowed in HOVL effective October 1, 1995.(b) Hours of operation were extended from 3-6 PM to 3-7 PM on February 2, 1998.(c) Hours of operation from 5:00 to 10:00 AM and 3:00 to 7:00 PM.
District 4, Year 2006 Annual HOV Lane Report Page 47

ALAMEDA-80 Westbound - A.M. HOV FLYOVER RAMP Typical data for 2006 Powell Street to SFOBB
PEAK PERIOD PEAK HOUR5:00 - 10:00 AM 6:00 - 7:00 AM
VEHICLES HOV Lane SOV Lane HOV Lane SOV Lane
Motorcycles 211 — 39 —
Buses 92 — 20 —
Carpool (1) 3001 — 749 —
2 - seaters (2) 1185 — 392 —
Vanpools 83 — 41 —Violators 890 — 226 —
TOTAL 5462 N/A 1467 N/A
PERSONS HOV Lane SOV Lane HOV Lane SOV Lane
Motorcycles 211 — 39 —
Buses 3220 — 700 —
Carpool (1) 9303 — 2322 —
2 - seaters (2) 2370 — 784 —
Vanpools 830 — 410 —Violators 1407 — 381 —
TOTAL 17341 N/A 4636 N/A
RATES
HOV Lane occupancy rate
3.2 persons/veh 3.2 persons/veh
Violation rate(HOV Lane)
(3)
16.3 % 15.4 %
NOTES: (1) 3 or more persons per vehicle.
(2) 2 - seater vehicles with 2 persons.
(3) Violation rate = no. of violators in HOV lane x 100%
Total no. of vehicles in HOV lane
(4) HOV lane in operation from 5:00 to 10:00 AM.
(5) Observations conducted 6/8/06 at the downstream touchdown of the flyover
(4)
(5)
District 4, Year 2006 Annual HOV Lane Report Page 48

ALAMEDA-80 Westbound - P.M.HOV FLYOVER RAMP Typical data for 2006 Powell Street to SFOBB
PEAK PERIOD PEAK HOUR3:00 - 7:00 PM 5:00 - 6:00 PM
VEHICLES HOV Lane SOV Lane HOV Lane SOV Lane
Motorcycles 63 — 22 —
Buses 97 — 24 —
Carpool (1) 640 — 172 —
2 - seaters (2) 116 — 22 —
Hybrid 94 27
Vanpools 18 — 4 —Violators 199 — 51 —
TOTAL 1227 N/A 322 N/A
PERSONS HOV Lane SOV Lane HOV Lane SOV Lane
Motorcycles 63 — 22 —
Buses 1552 — 384 —
Carpool (1) 1984 — 533 —
2 - seaters (2) 232 — 44 —
Hybrid 94 27
Vanpools 144 — 32 —Violators 291 — 75 —
TOTAL 4360 N/A 1117 N/A
RATES
HOV Lane occupancy rate
3.6 persons/veh 3.5 persons/veh
Violation rate(HOV Lane)
(3)
16.2 % 15.8 %
NOTES: (1) 3 or more persons per vehicle.
(2) 2 - seater vehicles with 2 persons.
(3) Violation rate = no. of violators in HOV lane x 100%
Total no. of vehicles in HOV lane
(4) HOV lane in operation from 3:00 to 7:00 PM.
(5) Observations conducted 10/25/06 at the downstream touchdown
of the flyover.
(4)
(5)
District 4, Year 2006 Annual HOV Lane Report Page 49

ALAMEDA-80 Violation History HOV FLYOVER RAMP Westbound Powell Street to SFOBB
DATEPERIOD
MONITOREDTOTAL HOVL
VOLUMEVIOLATION
RATE
A.M. PEAK Thu Jun 8, 2006 5:00 - 10:00 AM 5462 16.3%
Thu Jun 2, 2005 6:00 - 10:00 AM 4848 13.3%
Tue Dec 14, 2004 6:00 - 10:00 AM 2937 16.3%
Wed Nov 5, 2003 6:00 - 10:00 AM 4286 13.9%
Wed May 29, 2002 6:00 - 10:00 AM 4644 2.9%
Wed Mar 28, 2001 5:00 - 10:00 AM 5108 18.6%
Wed May 17, 2000 5:00 - 10:00 AM 5274 16.5%
Wed Apr 21, 1999 7:00 - 10:00 AM 3900 5.6%
Tue Oct 20, 1998 5:00 - 10:00 AM 4575 20.4%
P.M. PEAK Wed Oct 25, 2006 3:00 - 7:00 PM 1227 16.2%
Wed May 18, 2005 3:00 - 7:00 PM 1209 20.6%
Wed Nov 3, 2004 3:00 - 6:00 PM 953 17.5%
Tue Nov 4, 2003 3:00 - 6:00 PM 839 26.8%
Tue Sep 17, 2002 3:00 - 7:00 PM 1123 20.4%
Wed Oct 3, 2001 3:00 - 7:00 PM 1045 26.1%
Tue Dec 12, 2000 3:00 - 5:00 PM 490 16.1%
Wed Feb 3, 1999 3:00 - 7:00 PM 946 30.7%
Wed Oct 7, 1998 3:00 - 7:00 PM 1055 22.7%
NOTES: (a) Morning period of operation from 5:00 to 10:00 AM
(b) Evening period of operation from 3:00 to 7:00 PM.
District 4, Year 2006 Annual HOV Lane Report Page 50

ALAMEDA-80 Westbound - A.M.Contra Costa County Line to Powell Street Typical data for 2006
PEAK PERIOD PEAK HOUR6:00 - 10:00 AM 6:00 - 7:00 AM
VEHICLES HOV LaneMixed Flow
Lanes HOV LaneMixed Flow
Lanes
Motorcycles 249 73 85 19
Buses 95 33 28 8
Carpools (1) 4220 939 1390 256
Vanpools 81 11 49 8
Single Occ. (2) — 26056 — 6740Violators 469 — 98 —
TOTAL 5114 27112 1650 7031
PERSONS HOV LaneMixed Flow
Lanes HOV LaneMixed Flow
Lanes
Motorcycles 249 73 85 19
Buses 3325 1155 980 280
Carpools (1) 11898 2262 3887 590
Vanpools 810 110 490 80
Single Occ. (2) — 28741 — 7325Violators 622 — 131 —
TOTAL 16904 32341 5573 8294
RATES
HOV Lane occupancy rate
3.3 persons/veh 3.4 persons/veh
Mixed Flow occupancy rate
1.2 persons/veh 1.2 persons/veh
Overall occupancy (incl. buses)
1.5 persons/veh 1.6 persons/veh
Violation rate(HOV Lane)
(3)
9.2 % 5.9 %
NOTES: (1) 3 or more persons per vehicle & 2 - seater vehicles with 2 persons.
(2) Mixed flow lanes only.
(3) Violation rate = no. of violators in HOV lane x 100%
Total no. of vehicles in HOV lane
(4) HOV lane in operation from 5:00 to 10:00 A.M.
(5) Observations conducted 5/25/06 at Ashby Avenue Interchange.
(4)
(5)
District 4, Year 2006 Annual HOV Lane Report Page 51

ALAMEDA-80 Eastbound - P.M.I-880 Viaduct to Contra Costa County Line Typical data for 2006
PEAK PERIOD PEAK HOUR3:00 - 7:00 PM 5:00 - 6:00 PM
VEHICLES HOV LaneMixed Flow
Lanes HOV LaneMixed Flow
Lanes
Motorcycles 348 64 108 11
Buses 87 11 28 3
Carpools (1) 4233 1144 1266 267
Vanpools 187 25 33 5
1 and 2 Occ. (2) — 26623 — 6585Violators 560 — 118 —
TOTAL 5415 27867 1553 6871
PERSONS HOV LaneMixed Flow
Lanes HOV LaneMixed Flow
Lanes
Motorcycles 348 64 108 11
Buses 3045 385 980 105
Carpools (1) 11813 3040 3544 702
Vanpools 1870 250 330 50
1 and 2 Occ. (2) — 30177 — 7371Violators 842 — 185 —
TOTAL 17918 33916 5147 8239
RATES
HOV Lane occupancy rate
3.3 persons/veh 3.3 persons/veh
Mixed Flow occupancy rate
1.2 persons/veh 1.2 persons/veh
Overall occupancy (incl. buses)
1.6 persons/veh 1.6 persons/veh
Violation rate(HOV Lane)
(3)
10.3 % 7.6 %
NOTES: (1) 3 or more persons per vehicle & 2 - seater vehicles with 2 persons.
(2) Mixed flow lanes only.
(3) Violation rate = no. of violators in HOV lane x 100%
Total no. of vehicles in HOV lane
(4) HOV lane in operation from 3:00 to 7:00 P.M.
(5) Observations conducted 5/10/06 at Ashby Avenue Interchange.
(4)
(5)
District 4, Year 2006 Annual HOV Lane Report Page 52

ALAMEDA-80 Violation HistoryContra Costa County Line to Powell Street Westbound
DATEPERIOD
MONITOREDTOTAL HOVL
VOLUMEVIOLATION
RATE
A.M. PEAK Thu May 25, 2006 6:00 - 10:00 AM 5114 9.2%
Wed Nov 16, 2005 7:00 - 10:00 AM 3907 9.0%
Wed Nov 17, 2004 7:00 - 10:00 AM 3734 7.9%
Tue Jun 10, 2003 6:00 - 10:00 AM 5181 4.4%
Wed May 8, 2002 6:00 - 10:00 AM 5414 8.7%
Wed May 16, 2001 6:00 - 10:00 AM 5289 13.8%
Thu Oct 5, 2000 7:00 - 10:00 AM 3184 18.5%
Thu Apr 15, 1999 7:00 - 10:00 AM 3156 11.0%
Thu Oct 8, 1998 7:00 - 10:00 AM 3019 8.8%
P.M. PEAK Year 2006 - - -Year 2005 - - -Year 2004 - - -Year 2003 - - -Thu May 9, 2002 3:00 - 7:00 PM 3102 18.9%
Thu May 10, 2001 3:00 - 7:00 PM 1936 24.4%
Thu Jun 1, 2000 3:00 - 7:00 PM 2593 25.9%
Thu Apr 15, 1999 3:00 - 7:00 PM 2710 21.4%
Thu Oct 8, 1998 3:00 - 7:00 PM 1943 20.5%
NOTES: (a) Morning period of operation from 5:00 to 10:00 AM
(b) Evening period of operation from 3:00 to 7:00 PM.
(c) Data was not collected in 2006 for off-peak directions.
District 4, Year 2006 Annual HOV Lane Report Page 53

ALAMEDA-80 Violation HistoryI-880 Viaduct to Contra Costa County Line Eastbound
DATEPERIOD
MONITOREDTOTAL HOVL
VOLUMEVIOLATION
RATE
A.M. PEAK Year 2006 - - -Year 2005 - - -Year 2004 - - -Year 2003 - - -Wed Jun 5, 2002 6:00 - 10:00 PM 677 17.6%
Wed May 30, 2001 6:00 - 10:00 PM 606 21.5%
Tue Dec 19, 2000 7:00 - 10:00 PM 221 7.7%
Tue Apr 20, 1999 7:00 - 10:00 PM 531 20.9%
Thu Dec 17, 1998 7:00 - 10:00 PM 311 16.7%
P.M. PEAK Wed May 10, 2006 3:00 - 7:00 PM 5415 10.3%
Tue May 17, 2005 3:00 - 7:00 PM 5048 14.7%
Wed Nov 17, 2004 3:00 - 5:00 PM 1995 21.5%
Thu May 29, 2003 3:00 - 7:00 PM 4225 9.3%
Thu May 16, 2002 3:00 - 7:00 PM 4535 2.7%
Thu Sep 27, 2001 3:00 - 7:00 PM 4655 6.5%
Thu Sep 14, 2000 3:00 - 7:00 PM 4415 3.4%
Wed Oct 20, 1999 3:00 - 7:00 PM 4287 1.3%
Tue Dec 15, 1998 3:00 - 5:00 PM 1415 7.1%
NOTES: (a) Morning period of operation from 5:00 to 10:00 AM
(b) Evening period of operation from 3:00 to 7:00 PM
(c) Data was not collected in 2006 for off- peak direction
District 4, Year 2006 Annual HOV Lane Report Page 54

ALAMEDA-84 Westbound - A.M.Newark Boulevard to Dumbarton Bridge Toll Plaza Typical data for 2006
PEAK PERIOD PEAK HOUR6:00 - 9:00 AM 7:00 - 8:00 AM
VEHICLES HOV LaneMixed Flow
Lanes HOV LaneMixed Flow
Lanes
Motorcycles 102 1 44 1
Buses 20 2 7 1
Carpools (1) 2748 40 1308 10
Vanpools 24 0 9 0
Hybrid / Single Occ. (2) 132 8863 49 3309Violators 19 — 3 —
TOTAL 3045 8906 1420 3321
PERSONS HOV LaneMixed Flow
Lanes HOV LaneMixed Flow
Lanes
Motorcycles 102 1 44 1
Buses 700 70 245 35
Carpools (1) 5590 84 2673 21
Vanpools 240 0 90 0
Hybrid / Single Occ. (2) 132 8863 49 3309Violators 19 — 3 —
TOTAL 6783 9018 3104 3366
RATES
HOV Lane occupancy rate
2.2 persons/veh 2.2 persons/veh
Mixed Flow occupancy rate
1.0 persons/veh 1.0 persons/veh
Overall occupancy (incl. buses)
1.3 persons/veh 1.4 persons/veh
Violation rate(HOV Lane)
(3)
0.6 % 0.2 %
NOTES: (1) Two or more persons per vehicle.
(2) Hybrid HOV lane only/Single Occupancy mixed flow lanes only.
(3) Violation rate = no. of violators in HOV lane x 100%
Total no. of vehicles in HOV lane
(4) HOV lane in operation from 5:00 to10:00 A.M.
(5) Observations conducted 09/27/06 at Dumbarton Bridge Toll Plaza.
(4)
(5)
District 4, Year 2006 Annual HOV Lane Report Page 55

ALAMEDA-84 Westbound - P.M.Newark Boulevard to Dumbarton Bridge Toll Plaza Typical data for 2006
PEAK PERIOD PEAK HOUR3:00 - 6:00 PM 5:00 - 6:00 PM
VEHICLES HOV LaneMixed Flow
Lanes HOV LaneMixed Flow
Lanes
Motorcycles 22 2 10 0
Buses 20 8 8 1
Carpools (1) 960 143 334 49
Vanpools 5 2 0 0
Hybrid / Single Occ. (2) 18 4421 9 1641Violators 10 — 9 —
TOTAL 1035 4576 370 1691
PERSONS HOV LaneMixed Flow
Lanes HOV LaneMixed Flow
Lanes
Motorcycles 22 2 10 0
Buses 700 280 280 35
Carpools (1) 2000 297 707 107
Vanpools 50 20 0 0
Hybrid / Single Occ. (2) 18 4421 9 1641Violators 10 — 9 —
TOTAL 2800 5020 1015 1783
RATES
HOV Lane occupancy rate
2.7 persons/veh 2.7 persons/veh
Mixed Flow occupancy rate
1.1 persons/veh 1.1 persons/veh
Overall occupancy (incl. buses)
1.4 persons/veh 1.4 persons/veh
Violation rate(HOV Lane)
(3)
1.0 % 2.4 %
NOTES: (1) Two or more persons per vehicle.
(2) Hybrid HOV lane only/Single Occupancy mixed flow lanes only.
(3) Violation rate = no. of violators in HOV lane x 100%
Total no. of vehicles in HOV lane
(4) HOV lane in operation from 3:00 to 6:00 P.M.
(5) Observations conducted 09/26/06 at Dumbarton Bridge Toll Plaza.
(4)
(5)
District 4, Year 2006 Annual HOV Lane Report Page 56

ALAMEDA-84 Violation HistoryNewark Boulevard to Dumbarton Bridge Toll Plaza Westbound
DATEPERIOD
MONITOREDTOTAL HOVL
VOLUMEVIOLATION
RATE
A.M. PEAK Wed Sep 27, 2006 6:00 - 9:00 AM 3045 0.6%
Thu Oct 20, 2005 6:00 - 9:00 AM 2769 1.4%
Thu Oct 14, 2004 6:00 - 9:00 AM 2495 0.6%
Thu Jun 5, 2003 6:00 - 9:00 AM 2496 0.9%
Tue May 14, 2002 6:00 - 9:00 AM 3044 3.5%
Tue Apr 10, 2001 6:00 - 10:00 AM 4480 3.1%
Thu Oct 19, 2000 6:00 - 9:00 AM 4106 3.5%
Tue Mar 16, 1999 6:00 - 9:00 AM 3906 5.7%
Thu Apr 2, 1998 6:00 - 9:00 AM 3601 0.4%
Tue Apr 29, 1997 6:00 - 9:00 AM 2900 16.9%
Tue May 14, 1996 6:00 - 10:00 AM 3095 15.0%
Thu Mar 30, 1995 6:00 - 9:00 AM 2248 13.0%
P.M. PEAK Tue Sep 26, 2006 3:00 - 6:00 PM 1035 1.0%
Tue May 10, 2005 3:00 - 6:00 PM 1032 1.1%
Year 2004 - - -Thu May 8, 2003 3:00 - 6:00 PM 995 1.1%
Wed Jun 12, 2002 3:00 - 6:00 PM 959 1.8%
Tue Mar 20, 2001 3:00 - 6:00 PM 919 2.2%
Thu Oct 19, 2000 3:00 - 6:00 PM 849 3.1%
Wed Sep 22, 1999 3:00 - 6:00 PM 949 2.0%
Wed Apr 15, 1998 3:00 - 6:00 PM 981 1.6%
Thu Oct 2, 1997 3:00 - 6:00 PM 819 6.6%Tue May 14, 1996 3:00 - 6:00 PM 605 2.8%Thu Mar 30, 1995 3:00 - 6:00 PM 709 3.8%Tue Sep 27, 1994 3:00 - 6:00 PM 701 7.8%
NOTES: (a) Morning period of operation from 5:00 to 10:00 AM.
(b) Evening period of operation from 3:00 to 6:00 PM.
(c) Data was not collected in 2004 for off-peak direction
District 4, Year 2006 Annual HOV Lane Report Page 57

ALAMEDA-92 Westbound - A.M.Hesperian Boulevard to San Mateo Bridge Toll Plaza Typical data for 2006
PEAK PERIOD PEAK HOUR6:00 - 9:00 AM 7:00 - 8:00 AM
VEHICLES HOV LaneMixed Flow
Lanes HOV LaneMixed Flow
Lanes
Motorcycles 30 10 12 7
Buses 6 1 2 1
Carpools (1) 2310 129 959 49
Vanpools 28 2 13 1
Hybrid / Single Occ. (2) 45 11447 22 4061Violators 33 — 3 —
TOTAL 2452 11589 1011 4119
PERSONS HOV LaneMixed Flow
Lanes HOV LaneMixed Flow
Lanes
Motorcycles 30 10 12 7
Buses 210 35 70 35
Carpools (1) 4804 284 2012 109
Vanpools 280 20 130 10
Hybrid / Single Occ. (2) 45 11447 22 4061Violators 33 — 3 —
TOTAL 5402 11796 2249 4222
RATES
HOV Lane occupancy rate
2.2 persons/veh 2.2 persons/veh
Mixed Flow occupancy rate
1.0 persons/veh 1.0 persons/veh
Overall occupancy (incl. buses)
1.2 persons/veh 1.3 persons/veh
Violation rate(HOV Lane)
(3)
1.3 % 0.3 %
NOTES: (1) Two or more persons per vehicle.
(2) Hybrid HOV lane only/Single Occupancy mixed flow lanes only.
(3) Violation rate = no. of violators in HOV lane x 100%
Total no. of vehicles in HOV lane
(4) HOV lane in operation from 5:00 to 10:00 A.M.
(5) Observations conducted 03/08/06 at San Mateo Bridge Toll Plaza.
(4)
(5)
District 4, Year 2006 Annual HOV Lane Report Page 58

ALAMEDA-92 Westbound - P.M.Hesperian Boulevard to San Mateo Bridge Toll Plaza Typical data for 2006
PEAK PERIOD PEAK HOUR3:00 - 6:00 PM 5:00 - 6:00 PM
VEHICLES HOV LaneMixed Flow
Lanes HOV LaneMixed Flow
Lanes
Motorcycles 25 15 8 2
Buses 16 1 4 0
Carpools (1) 1395 519 514 162
Vanpools 17 15 6 6
Hybrid / Single Occ. (2) 34 6444 12 2409Violators 31 — 9 —
TOTAL 1518 6994 553 2579
PERSONS HOV LaneMixed Flow
Lanes HOV LaneMixed Flow
Lanes
Motorcycles 25 15 8 2
Buses 560 35 140 0
Carpools (1) 2936 1106 1076 349
Vanpools 170 150 60 60
Hybrid / Single Occ. (2) 34 6444 12 2409Violators 31 — 9 —
TOTAL 3756 7750 1305 2820
RATES
HOV Lane occupancy rate
2.5 persons/veh 2.4 persons/veh
Mixed Flow occupancy rate
1.1 persons/veh 1.1 persons/veh
Overall occupancy (incl. buses)
1.4 persons/veh 1.3 persons/veh
Violation rate(HOV Lane)
(3)
2.0 % 1.6 %
NOTES: (1) Two or more persons per vehicle.
(2) Hybrid HOV lane only/Single Occupancy mixed flow lanes only.
(3) Violation rate = no. of violators in HOV lane x 100%
Total no. of vehicles in HOV lane
(4) HOV lane in operation from 3:00 to 6:00 P.M.
(5) Observations conducted 09/21/06 at San Mateo Bridge Toll Plaza.
(4)
(5)
District 4, Year 2006 Annual HOV Lane Report Page 59

ALAMEDA-92 Violation HistoryHesperian Blvd. to West of San Mateo - Hayward Bridge Toll Plaza Westbound
DATEPERIOD
MONITOREDTOTAL HOVL
VOLUMEVIOLATION
RATE
A.M. PEAK Wed Mar 8, 2006 6:00 - 9:00 AM 2452 1.3%
Tue May 24, 2005 6:00 - 9:00 AM 2448 1.1%
Wed Oct 13, 2004 6:00 - 9:00 AM 2218 2.3%
Thu May 29, 2003 6:00 - 9:00 AM 2449 1.3%
Tue Apr 30, 2002 6:00 - 9:00 AM 1834 3.9%
Thu Sep 20, 2001 6:00 - 9:00 AM 2075 8.1%
Tue Oct 24, 2000 6:00 - 9:00 AM 2480 8.2%
Wed Mar 17, 1999 6:00 - 9:00 AM 2534 9.4%
Tue Mar 17, 1998 6:00 - 9:00 AM 2255 8.2%
Tue Oct 7, 1997 6:00 - 9:00 AM 2111 14.9%
Tue Apr 30, 1996 6:00 - 10:00 AM 1899 11.2%
Tue Apr 4, 1995 6:00 - 9:00 AM 1344 21.1%
P.M. PEAK Thu Sep 21, 2006 3:00 - 6:00 PM 1518 2.0%
Tue Sep 13, 2005 3:00 - 6:00 PM 1318 0.5%
Year 2004 - - -Tue Jun 11, 2002 3:00 - 6:00 PM 1275 4.4%
Wed Oct 3, 2001 3:00 - 6:00 PM 1177 5.4%
Thu Apr 13, 2000 3:00 - 6:00 PM 1243 1.4%
Thu Mar 4, 1999 3:00 - 6:00 PM 1128 3.2%
Thu Mar 26, 1998 3:00 - 6:00 PM 1210 3.8%
Wed Oct 8, 1997 3:00 - 6:00 PM 1138 6.8%
Tue Apr 30, 1996 3:00 - 6:00 PM 973 7.9%
Tue Apr 4, 1995 3:00 - 6:00 PM 944 10.3%
Wed Oct 5, 1994 3:00 - 6:00 PM 1003 14.1%
NOTES: (a) Morning period of operation from 5:00 to 10:00 AM.
(b) Evening period of operation from 3:00 to 6:00 PM.
(c) Data was not collected in 2004 for off-peak direction
District 4, Year 2006 Annual HOV Lane Report Page 60

ALAMEDA-680 Southbound - A.M.Route 84 to Route 237 Calaveras Blvd. Typical data for 2006
PEAK PERIOD PEAK HOUR6:00 - 9:00 AM 8:00 - 9:00 AM
VEHICLES HOV LaneMixed Flow
Lanes HOV LaneMixed Flow
Lanes
Motorcycles 102 8 39 2
Buses 0 5 0 5
Carpools (1) 1860 204 699 41
Vanpools 2 11 2 0
Hybrid / Single Occ. (2) 93 15455 49 5313Violators 64 — 43 —
TOTAL 2121 15683 832 5361
PERSONS HOV LaneMixed Flow
Lanes HOV LaneMixed Flow
Lanes
Motorcycles 102 8 39 2
Buses 0 175 0 175
Carpools (1) 3811 438 1441 86
Vanpools 20 110 20 0
Hybrid / Single Occ. (2) 93 15455 49 5313Violators 64 — 43 —
TOTAL 4090 16186 1592 5576
RATES
HOV Lane occupancy rate
1.9 persons/veh 1.9 persons/veh
Mixed Flow occupancy rate
1.0 persons/veh 1.0 persons/veh
Overall occupancy (incl. buses)
1.1 persons/veh 1.2 persons/veh
Violation rate(HOV Lane)
(3)
3.0 % 5.2 %
NOTES: (1) Two or more persons per vehicle.
(2) Hybrid HOV lane only/Single occupancy mixed flow lanes only.
(3) Violation rate = no. of violators in HOV lane x 100%
Total no. of vehicles in HOV lane
(4) HOV lane in operation from 5:00 to 9:00 A.M.
(5) Observations conducted 06/13/06 at Vargas Rd. I/C.
(4)
(5)
District 4, Year 2006 Annual HOV Lane Report Page 61

ALAMEDA-680 Southbound - P.M.Route 84 to Route 237 Calaveras Blvd. Typical data for 2006
PEAK PERIOD PEAK HOUR3:00 - 6:00 PM 4:00 - 5:00 PM
VEHICLES HOV LaneMixed Flow
Lanes HOV LaneMixed Flow
Lanes
Motorcycles 43 26 15 11
Buses 2 14 1 5
Carpools (1) 1565 1572 559 571
Vanpools 9 78 5 27
Hybrid / Single Occ. (2) 32 11095 8 3798Violators 18 — 1 —
TOTAL 1669 12785 589 4412
PERSONS HOV LaneMixed Flow
Lanes HOV LaneMixed Flow
Lanes
Motorcycles 43 26 15 11
Buses 70 490 35 175
Carpools (1) 3277 3450 1173 1272
Vanpools 90 780 50 270
Hybrid / Single Occ. (2) 32 11095 8 3798Violators 18 — 1 —
TOTAL 3530 15841 1282 5526
RATES
HOV Lane occupancy rate
2.1 persons/veh 2.2 persons/veh
Mixed Flow occupancy rate
1.2 persons/veh 1.3 persons/veh
Overall occupancy (incl. buses)
1.3 persons/veh 1.4 persons/veh
Violation rate(HOV Lane)
(3)
1.1 % 0.2 %
NOTES: (1) Two or more persons per vehicle.
(2) Hybrid HOV lane only/Single occupancy mixed flow lanes only.
(3) Violation rate = no. of violators in HOV lane x 100%
Total no. of vehicles in HOV lane
(4) HOV lane in operation from 3:00 to 7:00 P.M.
(5) Observations conducted 09/19/06 at Vargas Rd. I/C.
(4)
(5)
District 4, Year 2006 Annual HOV Lane Report Page 62

ALAMEDA - 680 Violation HistoryRoute 84 to Route 237 Calaveras Blvd. Southtbound
DATEPERIOD
MONITOREDTOTAL HOVL
VOLUMEVIOLATION
RATE
A.M. PEAK Tue Jun 13, 2006 6:00 - 9:00 AM 2121 3.0%
Tue Oct 4, 2005 6:00 - 9:00 AM 2133 3.6%
Thu Dec 2, 2004 6:00 - 9:00 AM 1970 9.8%
Thu Oct 9, 2003 6:00 - 9:00 AM 2138 0.2%
Thu Dec 5, 2002 6:00 - 9:00 AM 1098 4.4%
P.M. PEAK Tue Sep 19, 2006 3:00 - 6:00 PM 1669 1.1%
Thu Nov 3, 2005 3:00 - 6:00 PM 1752 1.0%
Year 2004 - - -Tue Jun 3, 2003 3:00 - 6:00 PM 1149 4.4%
NOTES: (a) Morning period of operation from 5:00 to 9:00 AM.
(b) Evening period of operation from 3:00 to 7:00 PM.
(c) Data was not collected in 2004 for off-peak direction
District 4, Year 2006 Annual HOV Lane Report Page 63

ALAMEDA-880 Southbound - A.M.Marina Boulevard to Whipple Road Typical data for 2006
PEAK PERIOD PEAK HOUR6:00 - 9:00 AM 7:00 - 8:00 AM
VEHICLES HOV LaneMixed Flow
Lanes HOV LaneMixed Flow
Lanes
Motorcycles 54 5 20 1
Buses 7 22 2 9
Carpools (1) 1927 300 754 133
Vanpools 51 5 19 0
Hybrid / Single Occ. (2) 247 13192 101 4331Violators 75 — 26 —
TOTAL 2361 13524 922 4474
PERSONS HOV LaneMixed Flow
Lanes HOV LaneMixed Flow
Lanes
Motorcycles 54 5 20 1
Buses 245 770 70 315
Carpools (1) 3934 642 1547 287
Vanpools 510 50 190 0
Hybrid / Single Occ. (2) 247 13192 101 4331Violators 75 — 26 —
TOTAL 5065 14659 1954 4934
RATES
HOV Lane occupancy rate
2.1 persons/veh 2.1 persons/veh
Mixed Flow occupancy rate
1.1 persons/veh 1.1 persons/veh
Overall occupancy (incl. buses)
1.2 persons/veh 1.3 persons/veh
Violation rate(HOV Lane)
(3)
3.2 % 2.8 %
NOTES: (1) Two or more persons per vehicle.
(2) Hybrid HOV lane only/Single occupancy mixed flow lanes only.
(3) Violation rate = no. of violators in HOV lane x 100%
Total no. of vehicles in HOV lane
(4) HOV lane in operation from 5:00 to 9:00 A.M.
(5) Observations conducted 10/04/06 at Tennyson Road I/C.
(4)
(5)
District 4, Year 2006 Annual HOV Lane Report Page 64

ALAMEDA-880 Southbound - P.M.Marina Boulevard to Whipple Road Typical data for 2006
PEAK PERIOD PEAK HOUR3:00 - 6:00 PM 4:00 - 5:00 PM
VEHICLES HOV LaneMixed Flow
Lanes HOV LaneMixed Flow
Lanes
Motorcycles 76 8 20 2
Buses 9 18 2 4
Carpools (1) 3286 515 1023 165
Vanpools 9 45 2 14
Hybrid / Single Occ. (2) 63 13153 22 4567Violators 51 — 2 —
TOTAL 3494 13739 1071 4752
PERSONS HOV LaneMixed Flow
Lanes HOV LaneMixed Flow
Lanes
Motorcycles 76 8 20 2
Buses 315 630 70 140
Carpools (1) 6796 1130 2122 360
Vanpools 90 450 20 140
Hybrid / Single Occ. (2) 63 13153 22 4567Violators 51 — 2 —
TOTAL 7391 15371 2256 5209
RATES
HOV Lane occupancy rate
2.1 persons/veh 2.1 persons/veh
Mixed Flow occupancy rate
1.1 persons/veh 1.1 persons/veh
Overall occupancy (incl. buses)
1.3 persons/veh 1.3 persons/veh
Violation rate(HOV Lane)
(3)
1.5 % 0.2 %
NOTES: (1) Two or more persons per vehicle.
(2) Hybrid HOV lane only/Single occupancy mixed flow lanes only.
(3) Violation rate = no. of violators in HOV lane x 100%
Total no. of vehicles in HOV lane
(4) HOV lane in operation from 3:00 to 7:00 P.M.
(5) Observations conducted 09/28/06 at Tennyson Road I/C.
(4)
(5)
District 4, Year 2006 Annual HOV Lane Report Page 65

ALAMEDA-880 Northbound - A.M.Whipple Road to South of Route 238 Typical data for 2006
PEAK PERIOD PEAK HOUR6:00 - 9:00 AM 7:00 - 8:00 AM
VEHICLES HOV LaneMixed Flow
Lanes HOV LaneMixed Flow
Lanes
Motorcycles 44 3 27 2
Buses 22 2 9 0
Carpools (1) 2231 156 865 56
Vanpools 29 0 11 0
Hybrid / Single Occ. (2) 69 11822 29 4152Violators 54 — 24 —
TOTAL 2449 11983 965 4210
PERSONS HOV LaneMixed Flow
Lanes HOV LaneMixed Flow
Lanes
Motorcycles 44 3 27 2
Buses 770 70 315 0
Carpools (1) 4583 332 1786 118
Vanpools 290 0 110 0
Hybrid / Single Occ. (2) 69 11822 29 4152Violators 54 — 24 —
TOTAL 5810 12227 2291 4272
RATES
HOV Lane occupancy rate
2.4 persons/veh 2.4 persons/veh
Mixed Flow occupancy rate
1.0 persons/veh 1.0 persons/veh
Overall occupancy (incl. buses)
1.2 persons/veh 1.3 persons/veh
Violation rate(HOV Lane)
(3)
2.2 % 2.5 %
NOTES: (1) Two or more persons per vehicle.
(2) Hybrid HOV lane only/Single occupancy mixed flow lanes only.
(3) Violation rate = no. of violators in HOV lane x 100%
Total no. of vehicles in HOV lane
(4) HOV lane in operation from 5:00 to 9:00 A.M.
(5) Observations conducted 12/07/06 at Tennyson Road I/C.
(4)
(5)
District 4, Year 2006 Annual HOV Lane Report Page 66

ALAMEDA-880 Northbound - P.M.Whipple Road to South of Route 238 Typical data for 2006
PEAK PERIOD PEAK HOUR3:00 - 6:00 PM 4:00 - 5:00 PM
VEHICLES HOV LaneMixed Flow
Lanes HOV LaneMixed Flow
Lanes
Motorcycles 64 11 23 3
Buses 15 16 4 5
Carpools (1) 3003 639 1191 217
Vanpools 21 16 5 3
Hybrid / Single Occ. (2) 65 13358 20 4581Violators 35 — 0 —
TOTAL 3203 14040 1243 4809
PERSONS HOV LaneMixed Flow
Lanes HOV LaneMixed Flow
Lanes
Motorcycles 64 11 23 3
Buses 525 560 140 175
Carpools (1) 6245 1381 2479 459
Vanpools 210 160 50 30
Hybrid / Single Occ. (2) 65 13358 20 4581Violators 35 — 0 —
TOTAL 7144 15470 2712 5248
RATES
HOV Lane occupancy rate
2.2 persons/veh 2.2 persons/veh
Mixed Flow occupancy rate
1.1 persons/veh 1.1 persons/veh
Overall occupancy (incl. buses)
1.3 persons/veh 1.3 persons/veh
Violation rate(HOV Lane)
(3)
1.1 % 0.0 %
NOTES: (1) Two or more persons per vehicle.
(2) Hybrid HOV lane only/Single occupancy mixed flow lanes only.
(3) Violation rate = no. of violators in HOV lane x 100%
Total no. of vehicles in HOV lane
(4) HOV lane in operation from 3:00 to 7:00 P.M.
(5) Observations conducted 10/24/06 at Tennyson Road I/C.
(4)
(5)
District 4, Year 2006 Annual HOV Lane Report Page 67

ALAMEDA-880 Violation HistoryMarina Boulevard to Whipple Road Southbound
DATEPERIOD
MONITOREDTOTAL HOVL
VOLUMEVIOLATION
RATE
A.M. PEAK Wed Oct 4, 2006 6:00 - 9:00 AM 2361 3.2%
Wed Mar 30, 2005 6:00 - 9:00 AM 2278 2.9%
Wed Nov 3, 2004 6:00 - 9:00 AM 2723 3.6%
Tue Oct 7, 2003 6:00 - 9:00 AM 3049 3.7%
Tue Jun 11, 2002 6:00 - 9:00 AM 3638 7.5%
Wed Mar 21, 2001 6:00 - 9:00 AM 3971 5.2%
Tue May 9, 2000 6:00 - 9:00 AM 3661 4.6%
Thu Mar 4, 1999 6:00 - 9:00 AM 3012 5.7%
Tue Oct 27, 1998 6:00 - 9:00 AM 2958 10.1%
Thu May 8, 1997 6:00 - 9:00 AM 2257 16.0%
Tue May 21, 1996 6:00 - 9:00 AM 1926 13.7%
Wed Mar 29, 1995 6:00 - 9:00 AM 1088 2.8%
P.M. PEAK Thu Sep 28, 2006 3:00 - 6:00 PM 2494 1.5%
Tue Nov 8, 2005 3:00 - 6:00 PM 3053 2.0%
Wed Dec 1, 2004 3:00 - 6:00 PM 3036 2.6%
Wed Jun 4, 2003 3:00 - 6:00 PM 3708 6.0%
Wed Jun 5, 2002 3:00 - 6:00 PM 3401 5.2%
Thu Apr 26, 2001 3:00 - 6:00 PM 3134 3.9%
Tue May 9, 2000 3:00 - 6:00 PM 2484 5.6%
Tue Mar 2, 1999 3:00 - 6:00 PM 2307 4.3%
Tue Oct 27, 1998 3:00 - 6:00 PM 2218 6.0%
Wed May 7, 1997 3:00 - 7:00 PM 2665 8.0%
Tue May 7, 1996 3:00 - 7:00 PM 2609 4.2%
Wed Apr 5, 1995 3:00 - 7:00 PM 3238 3.1%
NOTES: (a) Morning period of operation from 5:00 to 9:00 AM.
(b) Evening period of operation from 3:00 to 7:00 PM.
District 4, Year 2006 Annual HOV Lane Report Page 68

ALAMEDA-880 Violation HistoryWhipple Road to South of Route 238 Northbound
DATEPERIOD
MONITOREDTOTAL HOVL
VOLUMEVIOLATION
RATE
A.M. PEAK Thu Dec 7, 2006 6:00 - 9:00 AM 2449 2.2%
Thu Oct 6, 2005 6:00 - 9:00 AM 2735 2.0%
Tue Nov 2, 2004 6:00 - 9:00 AM 2954 5.3%
Thu May 22, 2003 6:00 - 9:00 AM 2920 1.4%
Thu Sep 12, 2002 6:00 - 9:00 AM 2560 8.8%
Thu Oct 11, 2001 6:00 - 9:00 AM 2212 5.2%
Tue Nov 7, 2000 6:00 - 9:00 AM 1648 7.6%
Tue Nov 2, 1999 6:00 - 9:00 AM 1845 8.1%
Wed Oct 28, 1998 6:00 - 9:00 AM 1582 17.2%
Wed Oct 8, 1997 6:00 - 9:00 AM 1147 12.7%
Tue Nov 5, 1996 6:00 - 9:00 AM 2291 8.1%
Wed Mar 29, 1995 6:00 - 9:00 AM 1158 17.8%
P.M. PEAK Tue Oct 24, 2006 3:00 - 6:00 PM 3203 1.1%
Tue Apr 5, 2005 3:00 - 6:00 PM 3780 2.8%
Tue Nov 30, 2004 3:00 - 6:00 PM 3422 1.6%
Thu Oct 9, 2003 3:00 - 6:00 PM 3657 3.0%
Wed May 8, 2002 3:00 - 6:00 PM 3878 8.4%
Wed May 2, 2001 3:00 - 6:00 PM 4069 4.8%
Thu Oct 5, 2000 3:00 - 6:00 PM 4433 6.4%
Tue Nov 2, 1999 3:00 - 6:00 PM 2238 26.5%
Wed Oct 28, 1998 3:00 - 6:00 PM 2515 8.3%
Tue May 6, 1997 3:00 - 7:00 PM 3788 11.1%
Thu Oct 10, 1996 3:00 - 7:00 PM 4098 6.0%
Wed Mar 29, 1995 3:00 - 7:00 PM 3869 11.0%
NOTES: (a) Morning period of operation from 5:00 to 9:00 AM.
(b) Evening period of operation from 3:00 to 7:00 PM.
District 4, Year 2006 Annual HOV Lane Report Page 69

ALAMEDA-880 Southbound - A.M.Whipple Road to Mission Boulevard Typical data for 2006
PEAK PERIOD PEAK HOUR6:00 - 9:00 AM 8:00 - 9:00 AM
VEHICLES HOV LaneMixed Flow
Lanes HOV LaneMixed Flow
Lanes
Motorcycles 55 4 24 1
Buses 1 21 0 6
Carpools (1) 1937 339 692 150
Vanpools 15 8 6 5
Hybrid / Single Occ. (2) 200 13814 108 4865Violators 301 — 175 —
TOTAL 2509 14186 1005 5027
PERSONS HOV LaneMixed Flow
Lanes HOV LaneMixed Flow
Lanes
Motorcycles 55 4 24 1
Buses 35 735 0 210
Carpools (1) 4089 698 1470 309
Vanpools 150 80 60 50
Hybrid / Single Occ. (2) 200 13814 108 4865Violators 301 — 175 —
TOTAL 4830 15331 1837 5435
RATES
HOV Lane occupancy rate
1.9 persons/veh 1.8 persons/veh
Mixed Flow occupancy rate
1.1 persons/veh 1.1 persons/veh
Overall occupancy (incl. buses)
1.2 persons/veh 1.2 persons/veh
Violation rate(HOV Lane)
(3)
12.0 % 17.4 %
NOTES: (1) Two or more persons per vehicle.
(2) Hybrid HOV lane only/Single Occupancy mixed flow lanes only.
(3) Violation rate = no. of violators in HOV lane x 100%
Total no. of vehicles in HOV lane
(4) HOV lane in operation from 5:00 to 9:00 A.M.
(5) Observations conducted 12/05/06 at Mowry I/C.
(4)
(5)
District 4, Year 2006 Annual HOV Lane Report Page 70

ALAMEDA-880 Southbound - P.M.Whipple Road to Mission Boulevard Typical data for 2006
PEAK PERIOD PEAK HOUR3:00 - 6:00 PM 5:00 - 6:00 PM
VEHICLES HOV LaneMixed Flow
Lanes HOV LaneMixed Flow
Lanes
Motorcycles 21 3 5 0
Buses 0 12 0 5
Carpools (1) 2532 515 907 101
Vanpools 66 24 5 4
Hybrid / Single Occ. (2) 32 11654 6 4106Violators 18 — 0 —
TOTAL 2669 12208 923 4216
PERSONS HOV LaneMixed Flow
Lanes HOV LaneMixed Flow
Lanes
Motorcycles 21 3 5 0
Buses 0 420 0 175
Carpools (1) 5158 1095 1817 214
Vanpools 660 240 50 40
Hybrid / Single Occ. (2) 32 11654 6 4106Violators 18 — 0 —
TOTAL 5889 13412 1878 4535
RATES
HOV Lane occupancy rate
2.2 persons/veh 2.0 persons/veh
Mixed Flow occupancy rate
1.1 persons/veh 1.1 persons/veh
Overall occupancy (incl. buses)
1.3 persons/veh 1.2 persons/veh
Violation rate(HOV Lane)
(3)
0.7 % 0.0 %
NOTES: (1) Two or more persons per vehicle.
(2) Hybrid HOV lane only/Single occupancy mixed flow lanes only.
(3) Violation rate = no. of violators in HOV lane x 100%
Total no. of vehicles in HOV lane
(4) HOV lane in operation from 3:00 to 7:00 P.M.
(5) Observations conducted 11/08/06 at Mowry I/C.
(4)
(5)
District 4, Year 2006 Annual HOV Lane Report Page 71

ALAMEDA-880 Northbound - A.M.Mission Boulevard to Whipple Road Typical data for 2006
PEAK PERIOD PEAK HOUR6:00 - 9:00 AM 7:00 - 8:00 AM
VEHICLES HOV LaneMixed Flow
Lanes HOV LaneMixed Flow
Lanes
Motorcycles 17 11 7 7
Buses 1 15 1 8
Carpools (1) 1316 452 383 187
Vanpools 0 5 0 2
Hybrid / Single Occ. (2) 39 9479 22 3435Violators 10 — 4 —
TOTAL 1383 9962 417 3639
PERSONS HOV LaneMixed Flow
Lanes HOV LaneMixed Flow
Lanes
Motorcycles 17 11 7 7
Buses 35 525 35 280
Carpools (1) 2700 952 799 388
Vanpools 0 50 0 20
Hybrid / Single Occ. (2) 39 9479 22 3435Violators 10 — 4 —
TOTAL 2801 11017 867 4130
RATES
HOV Lane occupancy rate
2.0 persons/veh 2.1 persons/veh
Mixed Flow occupancy rate
1.1 persons/veh 1.1 persons/veh
Overall occupancy (incl. buses)
1.2 persons/veh 1.2 persons/veh
Violation rate(HOV Lane)
(3)
0.7 % 1.0 %
NOTES: (1) Two or more persons per vehicle.
(2) Hybrid HOV lane only/Single occupancy mixed flow lanes only.
(3) Violation rate = no. of violators in HOV lane x 100%
Total no. of vehicles in HOV lane
(4) HOV lane in operation from 5:00 to 9:00 A.M.
(5) Observations conducted 11/15/06 at Mowry I/C.
(4)
(5)
District 4, Year 2006 Annual HOV Lane Report Page 72

ALAMEDA-880 Northbound - P.M.Mission Boulevard to Whipple Road Typical data for 2006
PEAK PERIOD PEAK HOUR3:00 - 6:00 PM 5:00 - 6:00 PM
VEHICLES HOV LaneMixed Flow
Lanes HOV LaneMixed Flow
Lanes
Motorcycles 85 11 43 3
Buses 10 12 4 1
Carpools (1) 1875 645 774 83
Vanpools 4 23 0 4
Hybrid / Single Occ. (2) 60 12015 20 4623Violators 20 — 1 —
TOTAL 2054 12706 842 4714
PERSONS HOV LaneMixed Flow
Lanes HOV LaneMixed Flow
Lanes
Motorcycles 85 11 43 3
Buses 350 420 140 35
Carpools (1) 3870 1393 1558 173
Vanpools 40 230 0 40
Hybrid / Single Occ. (2) 60 12015 20 4623Violators 20 — 1 —
TOTAL 4425 14069 1762 4874
RATES
HOV Lane occupancy rate
2.2 persons/veh 2.1 persons/veh
Mixed Flow occupancy rate
1.1 persons/veh 1.0 persons/veh
Overall occupancy (incl. buses)
1.3 persons/veh 1.2 persons/veh
Violation rate(HOV Lane)
(3)
1.0 % 0.1 %
NOTES: (1) Two or more persons per vehicle.
(2) Hybrid HOV lane only/Single occupancy mixed flow lanes only.
(3) Violation rate = no. of violators in HOV lane x 100%
Total no. of vehicles in HOV lane
(4) HOV lane in operation from 3:00 to 7:00 P.M.
(5) Observations conducted 11/07/06 at Mowry I/C.
(4)
(5)
District 4, Year 2006 Annual HOV Lane Report Page 73

ALAMEDA-880 Violation HistoryWhipple Road to Mission Boulevard Southbound
DATEPERIOD
MONITOREDTOTAL HOVL
VOLUMEVIOLATION
RATE
A.M. PEAK Tue Dec 5, 2006 6:00 - 9:00 AM 2509 12.0%
Wed Oct 26, 2005 6:00 - 9:00 AM 1948 3.0%
Tue Nov 9, 2004 6:00 - 9:00 AM 2355 2.7%
Tue Jun 3, 2003 6:00 - 9:00 AM 2418 3.5%
Tue Sep 24, 2002 6:00 - 9:00 AM 2525 3.2%
Tue Mar 27, 2001 6:00 - 9:00 AM 3423 4.8%
Tue Mar 28, 2000 6:00 - 9:00 AM 2438 6.2%
Wed May 19, 1999 6:00 - 9:00 AM 2118 3.7%
P.M. PEAK Wed Nov 8, 2006 3:00 - 6:00 PM 2669 0.7%
Wed Nov 9, 2005 3:00 - 6:00 PM 2539 1.7%
Tue Dec 14, 2004 3:00 - 6:00 PM 2639 6.8%
Wed May 7, 2003 3:00 - 6:00 PM 2227 4.2%
Tue May 7, 2002 3:00 - 6:00 PM 2114 5.8%
Wed Oct 17, 2001 3:00 - 6:00 PM 2157 3.8%
Thu Nov 9, 2000 3:00 - 6:00 PM 2060 5.9%
Tue Mar 9, 1999 3:00 - 6:00 PM 1966 20.7%
NOTES: (a) Morning period of operation from 5:00 to 9:00 AM.
(b) Evening period of operation from 3:00 to 7:00 PM.
District 4, Year 2006 Annual HOV Lane Report Page 74

ALAMEDA-880 Violation HistoryMission Boulevard to Whipple Road Northbound
DATEPERIOD
MONITOREDTOTAL HOVL
VOLUMEVIOLATION
RATE
A.M. PEAK Wed Nov 15, 2006 6:00 - 9:00 AM 1383 0.7%
Thu Apr 14, 2005 6:00 - 9:00 AM 1327 4.7%
Thu Nov 4, 2004 6:00 - 9:00 AM 1160 3.8%
Wed Oct 15, 2003 6:00 - 9:00 AM 1413 2.5%
Tue Apr 16, 2002 6:00 - 9:00 AM 925 2.9%
Thu Nov 1, 2001 6:00 - 9:00 AM 856 9.7%
Wed Mar 29, 2000 6:00 - 9:00 AM 956 5.6%
Wed Mar 10, 1999 6:00 - 9:00 AM 833 13.2%
P.M. PEAK Tue Nov 7, 2006 3:00 - 6:00 PM 2054 1.0%
Tue Oct 18, 2005 3:00 - 6:00 PM 2695 3.7%
Tue Nov 23, 2004 3:00 - 6:00 PM 2150 0.2%
Wed Oct 15, 2003 3:00 - 6:00 PM 2366 3.1%
Wed May 15, 2002 3:00 - 6:00 PM 2663 6.0%
Thu Jun 7, 2001 3:00 - 6:00 PM 2755 3.9%
Wed Nov 1, 2000 3:00 - 6:00 PM 3263 3.6%
Thu Mar 18, 1999 3:00 - 6:00 PM 2657 4.6%
NOTES: (a) Morning period of operation from 5:00 to 9:00 AM.
(b) Evening period of operation from 3:00 to 7:00 PM.
District 4, Year 2006 Annual HOV Lane Report Page 75

ALAMEDA-880 Northbound - A.M.16th Street to SFOBB Toll Plaza Typical data for 2006
PEAK PERIOD PEAK HOUR6:00 - 10:00 AM 7:00 - 8:00 AM
VEHICLES HOV LaneMixed Flow
Lanes HOV LaneMixed Flow
Lanes
Motorcycles 98 3 27 0
Buses 55 6 12 3
Carpools (1) 1449 0 547 0
Vanpools 12 27 1 0
1 and 2 Occ. (2) — 4174 — 989Violators 149 — 47 —
TOTAL 1763 4210 634 992
PERSONS HOV LaneMixed Flow
Lanes HOV LaneMixed Flow
Lanes
Motorcycles 98 3 34 2
Buses 1925 210 420 105
Carpools (1) 3985 0 1536 0
Vanpools 120 270 10 0
1 and 2 Occ. (2) — 4915 — 1210Violators 234 — 81 —
TOTAL 6362 5398 2081 1317
RATES
HOV Lane occupancy rate
3.6 persons/veh 3.3 persons/veh
Mixed Flow occupancy rate
1.3 persons/veh 1.3 persons/veh
Overall occupancy (incl. buses)
2.0 persons/veh 2.1 persons/veh
Violation rate(HOV Lane)
(3)
8.5 % 7.4 %
NOTES: (1) 3 or more persons per vehicle & 2 - seater vehicles with 2 persons.
(2) Mixed flow lanes only.
(3) Violation rate = no. of violators in HOV lane x 100%
Total no. of vehicles in HOV lane
(4) HOV lane in operation from 5:00 to 10:00 A.M.
(5) Observations conducted 5/10/06 north of 7th Street Interchange.
(4)
(5)
District 4, Year 2006 Annual HOV Lane Report Page 76

ALAMEDA-880 Violation History16th Street to SFOBB Toll Plaza Northbound
DATEPERIOD
MONITOREDTOTAL HOVL
VOLUMEVIOLATION
RATE
A.M. PEAK Wed May 10, 2006 6:00 - 10:00 AM 1763 8.5%
Wed Mar 16, 2005 6:00 - 10:00 AM 1483 10.5%
Thu Oct 28, 2004 7:00 - 10:00 AM 1647 15.5%
Wed May 21, 2003 5:00 - 10:00 AM 1451 5.6%
Wed Apr 17, 2002 6:00 - 10:00 AM 1613 4.8%
Thu Mar 22, 2001 6:00 - 10:00 AM 2402 15.5%
Wed Sep 27, 2000 7:00 - 10:00 AM 2983 16.4%
Tue May 18, 1999 6:00 - 10:00 AM 3471 3.1%
Thu Sep 10, 1998 6:00 - 10:00 AM 1937 11.7%
P.M. PEAK Year 2006 - - -Year 2005 - - -Year 2004 - - -Tue May 20, 2003 3:00 - 7:00 PM 457 3.5%
Wed Apr 17, 2002 3:00 - 7:00 PM 486 6.8%
Thu Oct 11, 2001 3:00 - 7:00 PM 397 14.6%
Wed Oct 18, 2000 3:00 - 7:00 PM 513 43.3%
Thu Sep 30, 1999 3:00 - 7:00 PM 587 16.5%
Thu Sep 10, 1998 3:00 - 7:00 PM 343 14.9%
NOTES: (a) Morning period of operation from 5:00 to 10:00 AM
(b) Evening period of operation from 3:00 to 7:00 PM.
(c) Data was not collected in 2006 off-peak direction
District 4, Year 2006 Annual HOV Lane Report Page 77

CONTRA COSTA-4 Westbound - A.M.Loveridge Road to Port Chicago Highway Typical data for 2006
PEAK PERIOD PEAK HOUR6:00 - 9:00 AM 6:00 - 7:00 AM
VEHICLES HOV LaneMixed Flow
Lanes HOV LaneMixed Flow
Lanes
Motorcycles 119 18 59 5
Buses 7 16 6 7
Carpools (1) 2170 581 769 168
Vanpools 12 10 10 3
Hybrid / Single Occ. (2) 56 14394 14 5107Violators 73 — 24 —
TOTAL 2437 15019 882 5290
PERSONS HOV LaneMixed Flow
Lanes HOV LaneMixed Flow
Lanes
Motorcycles 119 18 59 5
Buses 245 560 210 245
Carpools (1) 4504 1272 1599 368
Vanpools 120 100 100 30
Hybrid / Single Occ. (2) 56 14394 14 5107Violators 73 — 24 —
TOTAL 5117 16344 2006 5755
RATES
HOV Lane occupancy rate
2.1 persons/veh 2.3 persons/veh
Mixed Flow occupancy rate
1.1 persons/veh 1.1 persons/veh
Overall occupancy (incl. buses)
1.2 persons/veh 1.3 persons/veh
Violation rate(HOV Lane)
(3)
3.0 % 2.7 %
NOTES: (1) Two or more persons per vehicle.
(2) Hybrid HOV lane only/Single occupancy mixed flow lanes only.
(3) Violation rate = no. of violators in HOV lane x 100%
Total no. of vehicles in HOV lane
(4) HOV lane in operation from 6:00 to 9:00 A.M.
(5) Observations conducted 09/07/06 at Bailey Road I/C.
(4)
(5)
District 4, Year 2006 Annual HOV Lane Report Page 78

CONTRA COSTA-4 Eastbound - P.M.Port Chicago Highway to Railroad Avenue Typical data for 2006
PEAK PERIOD PEAK HOUR3:00 - 6:00 PM 5:00 - 6:00 PM
VEHICLES HOV LaneMixed Flow
Lanes HOV LaneMixed Flow
Lanes
Motorcycles 105 38 36 13
Buses 1 14 0 2
Carpools (1) 2686 1623 990 533
Vanpools 61 9 19 2
Hybrid / Single Occ. (2) 38 14966 16 5008Violators 51 — 3 —
TOTAL 2942 16650 1064 5558
PERSONS HOV LaneMixed Flow
Lanes HOV LaneMixed Flow
Lanes
Motorcycles 105 38 36 13
Buses 35 490 0 70
Carpools (1) 5486 3477 2013 1139
Vanpools 610 90 190 20
Hybrid / Single Occ. (2) 38 14966 16 5008Violators 51 — 3 —
TOTAL 6325 19061 2258 6250
RATES
HOV Lane occupancy rate
2.2 persons/veh 2.1 persons/veh
Mixed Flow occupancy rate
1.1 persons/veh 1.1 persons/veh
Overall occupancy (incl. buses)
1.3 persons/veh 1.3 persons/veh
Violation rate(HOV Lane)
(3)
1.7 % 0.3 %
NOTES: (1) Two or more persons per vehicle.
(2) Hybrid HOV lane only/Single Occupancy mixed flow lanes only.
(3) Violation rate = no. of violators in HOV lane x 100%
Total no. of vehicles in HOV lane
(4) HOV lane in operation from 3:00 to 7:00 P.M.
(5) Observations conducted 09/06/06 at San Marcos I/C.
(4)
(5)
District 4, Year 2006 Annual HOV Lane Report Page 79

CONTRA COSTA-4 Violation HistoryLoveridge Road to Port Chicago Highway Westbound
DATEPERIOD
MONITOREDTOTAL HOVL
VOLUMEVIOLATION
RATE
A.M. PEAK Thu Sep 7, 2006 6:00 - 9:00 AM 2437 3.0%
Tue Jun 7, 2005 6:00 - 9:00 AM 2634 3.3%
Thu Oct 21, 2004 6:00 - 9:00 AM 2436 2.0%
Thu Oct 16, 2003 6:00 - 9:00 AM 2657 3.6%
Thu May 23, 2002 6:00 - 9:00 AM 2225 4.5%
Wed Sep 19, 2001 6:00 - 9:00 AM 1174 7.0%
Wed May 10, 2000 6:00 - 9:00 AM 861 5.6%
NOTES: (a) Morning period of operation from 6:00 to 9:00 AM.
District 4, Year 2006 Annual HOV Lane Report Page 80

CONTRA COSTA-4 Violation HistoryPort Chicago Highway to Railroad Ave. Eastbound
DATEPERIOD
MONITOREDTOTAL HOVL
VOLUMEVIOLATION
RATE
P.M. PEAK Wed Sep 6, 2006 3:00 - 6:00 PM 2942 1.7%
Thu Oct 20, 2005 3:00 - 6:00 PM 2524 3.8%
Tue Dec 7, 2004 3:00 - 6:00 PM 2289 1.7%
Wed May 14, 2003 3:00 - 6:00 PM 2292 1.9%
Tue Mar 19, 2002 3:00 - 6:00 PM 2248 4.4%
Tue Oct 30, 2001 3:00 - 6:00 PM 2011 4.0%
NOTES: (a) Evening period of operation from 3:00 to 7:00 PM.
District 4, Year 2006 Annual HOV Lane Report Page 81

CONTRA COSTA-80 Westbound - A.M.Route 4 to Alameda County Line Typical data for 2006
PEAK PERIOD PEAK HOUR6:00 - 10:00 AM 6:00 - 7:00 AM
VEHICLES HOV LaneMixed Flow
Lanes HOV LaneMixed Flow
Lanes
Motorcycles 125 38 41 11
Buses 124 24 39 8
Carpools (1) 3337 773 1265 227
Vanpools 63 11 50 3
1 and 2 Occ. (2) — 18978 — 4958Violators 446 — 98 —
TOTAL 4095 19824 1493 5207
PERSONS HOV LaneMixed Flow
Lanes HOV LaneMixed Flow
Lanes
Motorcycles 125 38 41 11
Buses 4340 840 1365 280
Carpools (1) 9367 1893 3516 510
Vanpools 630 110 500 30
1 and 2 Occ. (2) — 21092 — 5402Violators 587 — 151 —
TOTAL 15049 23973 5573 6233
RATES
HOV Lane occupancy rate
3.7 persons/veh 3.7 persons/veh
Mixed Flow occupancy rate
1.2 persons/veh 1.2 persons/veh
Overall occupancy (incl. buses)
1.6 persons/veh 1.8 persons/veh
Violation rate(HOV Lane)
(3)
10.9 % 6.6 %
NOTES: (1) 3 or more persons per vehicle & 2 - seater vehicles with 2 persons.
(2) Mixed flow lanes only.
(3) Violation rate = no. of violators in HOV lane x 100%
Total no. of vehicles in HOV lane
(4) HOV lane in operation from 5:00 to 10:00 A.M.
(5) Observations conducted 5/24/06 east of Hilltop Drive Interchange.
(4)
(5)
District 4, Year 2006 Annual HOV Lane Report Page 82

CONTRA COSTA-80 Eastbound - P.M.Alameda County Line to Route 4 Typical data for 2006
PEAK PERIOD PEAK HOUR3:00 - 7:00 PM 5:00 - 6:00 PM
VEHICLES HOV LaneMixed Flow
Lanes HOV LaneMixed Flow
Lanes
Motorcycles 211 84 66 18
Buses 122 15 38 5
Carpools (1) 3819 576 1229 94
Vanpools 119 13 28 4
1 and 2 Occ. (2) — 20481 — 5023Violators 309 — 83 —
TOTAL 4580 21169 1444 5144
PERSONS HOV LaneMixed Flow
Lanes HOV LaneMixed Flow
Lanes
Motorcycles 211 84 66 18
Buses 4270 525 1330 175
Carpools (1) 10891 1658 3507 275
Vanpools 1190 130 280 40
1 and 2 Occ. (2) — 23195 — 5656Violators 432 — 116 —
TOTAL 16994 25592 5299 6164
RATES
HOV Lane occupancy rate
3.7 persons/veh 3.7 persons/veh
Mixed Flow occupancy rate
1.2 persons/veh 1.2 persons/veh
Overall occupancy (incl. buses)
1.7 persons/veh 1.7 persons/veh
Violation rate(HOV Lane)
(3)
6.7 % 5.7 %
NOTES: (1) 3 or more persons per vehicle & 2 - seater vehicles with 2 persons.
(2) Mixed flow lanes only.
(3) Violation rate = no. of violators in HOV lane x 100%
Total no. of vehicles in HOV lane
(4) HOV lane in operation from 3:00 to 7:00 P.M.
(5) Observations conducted 5/2/06 east of Hilltop Drive Interchange.
(4)
(5)
District 4, Year 2006 Annual HOV Lane Report Page 83

CONTRA COSTA-80 Violation HistoryRoute 4 to Alameda County Line Westbound
DATEPERIOD
MONITOREDTOTAL HOVL
VOLUMEVIOLATION
RATE
A.M. PEAK Wed May 24, 2006 6:00 - 10:00 AM 4095 10.9%
Thu Nov 10, 2005 7:00 - 10:00 AM 2635 12.5%
Tue Nov 9, 2004 7:00 - 10:00 AM 2507 9.2%
Fri May 9, 2003 6:00 - 10:00 AM 4509 27.2%
Tue Apr 16, 2002 7:00 - 10:00 AM 2656 6.4%
Tue Mar 27, 2001 6:00 - 10:00 AM 3640 8.7%
Tue Oct 3, 2000 7:00 - 10:00 AM 2643 9.5%
Tue Nov 9, 1999 7:00 - 10:00 AM 2186 11.1%
Tue Oct 6, 1998 7:00 - 10:00 AM 1743 10.0%
P.M. PEAK Year 2006 - - -Year 2005 - - -Year 2004 - - -Year 2003 - - -Tue May 7, 2002 3:00 - 7:00 PM 1401 25.7%
Thu Oct 4, 2001 3:00 - 7:00 PM 1432 24.2%
Thu Apr 13, 2000 3:00 - 7:00 PM 1167 37.3%
Wed Apr 21, 1999 3:00 - 7:00 PM 1068 18.5%
Tue Oct 6, 1998 3:00 - 7:00 PM 802 31.9%
NOTES: (a) Morning period of operation from 5:00 to 10:00 AM.
(b) Evening period of operation from 3:00 to 7:00 PM.
(c) Data was not collected in 2006 for off-peak direction
District 4, Year 2006 Annual HOV Lane Report Page 84

CONTRA COSTA-80 Violation HistoryAlameda County Line to Route 4 Eastbound
DATEPERIOD
MONITOREDTOTAL HOVL
VOLUMEVIOLATION
RATE
A.M. PEAK Year 2006 - - -Year 2005 - - -Year 2004 - - -Year 2003 - - -Tue Apr 23, 2002 6:00 - 10:00 AM 632 19.8%
Tue May 15, 2001 6:00 - 10:00 AM 553 18.3%
Thu Dec 14, 2000 7:00 - 10:00 AM 483 26.3%
Wed Apr 7, 1999 7:00 - 10:00 AM 498 26.9%
Thu Oct 1, 1998 6:00 - 10:00 AM 386 43.0%
P.M. PEAK Tue May 2, 2006 3:00 - 7:00 PM 4580 6.7%
Tue Apr 19, 2005 3:00 - 7:00 PM 3897 6.4%
Thu Oct 21, 2004 3:00 - 6:00 PM 3214 9.3%
Wed May 28, 2003 3:00 - 7:00 PM 4256 11.5%
Tue Apr 16, 2002 3:00 - 7:00 PM 3921 9.0%
Thu Sep 20, 2001 3:00 - 7:00 PM 4649 4.4%
Tue Sep 26, 2000 3:00 - 7:00 PM 3780 18.0%
Tue Apr 13, 1999 3:00 - 7:00 PM 2956 9.5%
Thu Oct 22, 1998 3:00 - 6:00 PM 2422 17.8%
NOTES: (a) Morning period of operation from 5:00 to 10:00 AM.
(b) Evening period of operation from 3:00 to 7:00 PM.
(c) Data was not collected in 2006 off-peak direction
District 4, Year 2006 Annual HOV Lane Report Page 85

CONTRA COSTA-680 Southbound - A.M.Marina Vista I/C. to N/O North Main St. Typical data for 2006
PEAK PERIOD PEAK HOUR6:00 - 9:00 AM 8:00 - 9:00 AM
VEHICLES HOV LaneMixed Flow
Lanes HOV LaneMixed Flow
Lanes
Motorcycles 88 10 33 2
Buses 5 5 0 4
Carpools (1) 2554 526 918 273
Vanpools 1 3 0 0
Hybrid / Single Occ. (2) 52 13530 27 4432Violators 27 — 27 —
TOTAL 2727 14074 1005 4711
PERSONS HOV LaneMixed Flow
Lanes HOV LaneMixed Flow
Lanes
Motorcycles 88 10 33 2
Buses 175 175 0 140
Carpools (1) 5247 1139 1899 591
Vanpools 10 30 0 0
Hybrid / Single Occ. (2) 52 13530 27 4432Violators 27 — 27 —
TOTAL 5599 14884 1986 5165
RATES
HOV Lane occupancy rate
2.1 persons/veh 2.0 persons/veh
Mixed Flow occupancy rate
1.1 persons/veh 1.1 persons/veh
Overall occupancy (incl. buses)
1.2 persons/veh 1.3 persons/veh
Violation rate(HOV Lane)
(3)
1.0 % 2.7 %
NOTES: (1) Two or more persons per vehicle.
(2) Hybrid HOV lane only/Single occupancy mixed flow lanes only.
(3) Violation rate = no. of violators in HOV lane x 100%
Total no. of vehicles in HOV lane
(4) HOV lane in operation from 6:00 to 9:00 A.M.
(5) Observations conducted 10/11/06 at Truck Scale.
(4)
(5)
District 4, Year 2006 Annual HOV Lane Report Page 86

CONTRA COSTA-680 Southbound - P.M.Marina Vista I/C. to N/O North Main St. Typical data for 2006
PEAK PERIOD PEAK HOUR3:00 - 6:00 PM 4:00 - 5:00 PM
VEHICLES HOV LaneMixed Flow
Lanes HOV LaneMixed Flow
Lanes
Motorcycles 26 35 7 14
Buses 3 8 1 6
Carpools (1) 1184 856 432 278
Vanpools 5 40 4 16
Hybrid / Single Occ. (2) 34 13249 12 4680Violators 18 — 2 —
TOTAL 1270 14188 458 4994
PERSONS HOV LaneMixed Flow
Lanes HOV LaneMixed Flow
Lanes
Motorcycles 26 35 7 14
Buses 105 280 35 210
Carpools (1) 2451 1867 885 615
Vanpools 50 400 40 160
Hybrid / Single Occ. (2) 34 13249 12 4680Violators 18 — 2 —
TOTAL 2684 15831 981 5679
RATES
HOV Lane occupancy rate
2.1 persons/veh 2.1 persons/veh
Mixed Flow occupancy rate
1.1 persons/veh 1.1 persons/veh
Overall occupancy (incl. buses)
1.2 persons/veh 1.2 persons/veh
Violation rate(HOV Lane)
(3)
1.4 % 0.4 %
NOTES: (1) Two or more persons per vehicle.
(2) Hybrid HOV lane only/Single Occupancy mixed flow lanes only.
(3) Violation rate = no. of violators in HOV lane x 100%
Total no. of vehicles in HOV lane
(4) HOV lane in operation from 3:00 to 7:00 P.M.
(5) Observations conducted 10/25/06 at Truck Scale.
(4)
(5)
District 4, Year 2006 Annual HOV Lane Report Page 87

CONTRA COSTA-680 Northbound - A.M.Route 242 to Marina Vista I/C. Typical data for 2006
PEAK PERIOD PEAK HOUR6:00 - 9:00 AM 8:00 - 9:00 AM
VEHICLES HOV LaneMixed Flow
Lanes HOV LaneMixed Flow
Lanes
Motorcycles 19 16 7 5
Buses 5 7 1 1
Carpools (1) 395 506 168 190
Vanpools 6 1 3 1
Hybrid / Single Occ. (2) 16 6314 9 2302Violators 70 — 7 —
TOTAL 511 6844 195 2499
PERSONS HOV LaneMixed Flow
Lanes HOV LaneMixed Flow
Lanes
Motorcycles 19 16 7 5
Buses 175 245 35 35
Carpools (1) 886 1108 365 403
Vanpools 60 10 30 10
Hybrid / Single Occ. (2) 16 6314 9 2302Violators 70 — 7 —
TOTAL 1226 7693 453 2755
RATES
HOV Lane occupancy rate
2.4 persons/veh 2.3 persons/veh
Mixed Flow occupancy rate
1.1 persons/veh 1.1 persons/veh
Overall occupancy (incl. buses)
1.2 persons/veh 1.2 persons/veh
Violation rate(HOV Lane)
(3)
13.7 % 3.6 %
NOTES: (1) Two or more persons per vehicle.
(2) Hybrid HOV lane only/Single Occupancy mixed flow lanes only.
(3) Violation rate = no. of violators in HOV lane x 100%
Total no. of vehicles in HOV lane
(4) HOV lane in operation from 6:00 to 9:00 A.M.
(5) Observations conducted 04/26/06 at Pacheco Boulevard.
(4)
(5)
District 4, Year 2006 Annual HOV Lane Report Page 88

CONTRA COSTA-680 Northbound - P.M.Route 242 to Marina Vista I/C. Typical data for 2006
PEAK PERIOD PEAK HOUR3:00 - 6:00 PM 5:00 - 6:00 PM
VEHICLES HOV LaneMixed Flow
Lanes HOV LaneMixed Flow
Lanes
Motorcycles 41 17 10 5
Buses 6 20 4 3
Carpools (1) 1541 738 522 214
Vanpools 54 18 21 6
Hybrid / Single Occ. (2) 51 8543 21 2907Violators 39 — 20 —
TOTAL 1732 9336 598 3135
PERSONS HOV LaneMixed Flow
Lanes HOV LaneMixed Flow
Lanes
Motorcycles 41 17 10 5
Buses 210 700 140 105
Carpools (1) 3180 1578 1079 469
Vanpools 540 180 210 60
Hybrid / Single Occ. (2) 51 8543 21 2907Violators 39 — 20 —
TOTAL 4061 11018 1480 3546
RATES
HOV Lane occupancy rate
2.3 persons/veh 2.5 persons/veh
Mixed Flow occupancy rate
1.2 persons/veh 1.1 persons/veh
Overall occupancy (incl. buses)
1.4 persons/veh 1.3 persons/veh
Violation rate(HOV Lane)
(3)
2.3 % 3.3 %
NOTES: (1) Two or more persons per vehicle.
(2) Hybrid HOV lane only/Single Occupancy mixed flow lanes only.
(3) Violation rate = no. of violators in HOV lane x 100%
Total no. of vehicles in HOV lane
(4) HOV lane in operation from 3:00 to 7:00 P.M.
(5) Observations conducted 10/26/06 at Pacheco Boulevard.
(4)
(5)
District 4, Year 2006 Annual HOV Lane Report Page 89

CONTRA COSTA - 680 Violation HistoryMarina Vista I/C. to N/O North Main St Southtbound
DATEPERIOD
MONITOREDTOTAL HOVL
VOLUMEVIOLATION
RATE
A.M. PEAK Wed Oct 11, 2006 6:00 - 9:00 AM 2727 1.0%
Tue May 3, 2005 6:00 - 9:00 AM 2387 0.9%
Wed Oct 6, 2004 6:00 - 9:00 AM 2068 2.0%
P.M. PEAK Wed Oct 25, 2006 3:00 - 6:00 PM 1270 1.4%
Tue Sep 27, 2005 3:00 - 6:00 PM 1095 2.1%
Tue Oct 5, 2004 3:00 - 6:00 PM 1083 4.2%
NOTES: (a) Morning period of operation from 6:00 to 9:00 AM.
(b) Evening period of operation from 3:00 to 7:00 PM.
District 4, Year 2006 Annual HOV Lane Report Page 90

CONTRA COSTA - 680 Violation HistoryRoute 242 to Marina Vista I/C. Northtbound
DATEPERIOD
MONITOREDTOTAL HOVL
VOLUMEVIOLATION
RATE
A.M. PEAK Wed Apr 26, 2006 6:00 - 9:00 AM 511 13.7%
Thu Sep 22, 2005 6:00 - 9:00 AM 560 5.5%
P.M. PEAK Thu Oct 26, 2006 3:00 - 6:00 PM 1732 2.3%
Thu Oct 6, 2005 3:00 - 6:00 PM 1910 8.8%
NOTES: (a) Morning period of operation from 6:00 to 9:00 AM.
(b) Evening period of operation from 3:00 to 7:00 PM.
District 4, Year 2006 Annual HOV Lane Report Page 91

CONTRA COSTA-680 Southbound - A.M.Livorna Road to Alcosta Boulevard Typical data for 2006
PEAK PERIOD PEAK HOUR6:00 - 9:00 AM 7:00 - 8:00 AM
VEHICLES HOV LaneMixed Flow
Lanes HOV LaneMixed Flow
Lanes
Motorcycles 117 16 53 4
Buses 11 15 6 4
Carpools (1) 2502 511 962 132
Vanpools 36 2 8 0
Hybrid / Single Occ. (2) 150 14043 57 4886Violators 231 — 71 —
TOTAL 3047 14587 1157 5026
PERSONS HOV LaneMixed Flow
Lanes HOV LaneMixed Flow
Lanes
Motorcycles 117 16 53 4
Buses 385 525 210 140
Carpools (1) 5386 1106 2063 296
Vanpools 360 20 80 0
Hybrid / Single Occ. (2) 150 14043 57 4886Violators 231 — 71 —
TOTAL 6629 15710 2534 5326
RATES
HOV Lane occupancy rate
2.2 persons/veh 2.2 persons/veh
Mixed Flow occupancy rate
1.1 persons/veh 1.1 persons/veh
Overall occupancy (incl. buses)
1.3 persons/veh 1.3 persons/veh
Violation rate(HOV Lane)
(3)
7.6 % 6.1 %
NOTES: (1) Two or more persons per vehicle.
(2) Hybrid HOV lane only/Single Occupancy mixed flow lanes only.
(3) Violation rate = no. of violators in HOV lane x 100%
Total no. of vehicles in HOV lane
(4) HOV lane in operation from 6:00 to 9:00 A.M.
(5) Observations conducted 06/08/06 at Stone Valley Road.
(4)
(5)
District 4, Year 2006 Annual HOV Lane Report Page 92

CONTRA COSTA-680 Southbound - P.M.Livorna Road to Alcosta Boulevard Typical data for 2006
PEAK PERIOD PEAK HOUR3:00 - 6:00 PM 5:00 - 6:00 PM
VEHICLES HOV LaneMixed Flow
Lanes HOV LaneMixed Flow
Lanes
Motorcycles 33 7 13 0
Buses 5 4 0 1
Carpools (1) 2932 939 1107 254
Vanpools 88 1 31 0
Hybrid / Single Occ. (2) 43 13561 8 4929Violators 42 — 14 —
TOTAL 3143 14512 1173 5184
PERSONS HOV LaneMixed Flow
Lanes HOV LaneMixed Flow
Lanes
Motorcycles 33 7 13 0
Buses 175 140 0 35
Carpools (1) 6051 2046 2272 562
Vanpools 880 10 310 0
Hybrid / Single Occ. (2) 43 13561 8 4929Violators 42 — 14 —
TOTAL 7224 15764 2617 5526
RATES
HOV Lane occupancy rate
2.3 persons/veh 2.2 persons/veh
Mixed Flow occupancy rate
1.1 persons/veh 1.1 persons/veh
Overall occupancy (incl. buses)
1.3 persons/veh 1.3 persons/veh
Violation rate(HOV Lane)
(3)
1.3 % 1.2 %
NOTES: (1) Two or more persons per vehicle.
(2) Hybrid HOV lane only/Single Occupancy mixed flow lanes only.
(3) Violation rate = no. of violators in HOV lane x 100%
Total no. of vehicles in HOV lane
(4) HOV lane in operation from 3:00 to 6:00 P.M.
(5) Observations conducted 09/20/06 at Stone Valley Road.
(4)
(5)
District 4, Year 2006 Annual HOV Lane Report Page 93

CONTRA COSTA-680 Northbound - A.M.Alcosta Boulevard to Livorna Road Typical data for 2006
PEAK PERIOD PEAK HOUR6:00 - 9:00 AM 8:00 - 9:00 AM
VEHICLES HOV LaneMixed Flow
Lanes HOV LaneMixed Flow
Lanes
Motorcycles 59 14 23 9
Buses 24 0 13 0
Carpools (1) 1952 339 854 115
Vanpools 8 0 4 0
Hybrid / Single Occ. (2) 106 12797 54 4911Violators 45 — 30 —
TOTAL 2194 13150 978 5035
PERSONS HOV LaneMixed Flow
Lanes HOV LaneMixed Flow
Lanes
Motorcycles 59 14 23 9
Buses 840 0 455 0
Carpools (1) 4010 785 1758 264
Vanpools 80 0 40 0
Hybrid / Single Occ. (2) 106 12797 54 4911Violators 45 — 30 —
TOTAL 5140 13596 2360 5184
RATES
HOV Lane occupancy rate
2.3 persons/veh 2.4 persons/veh
Mixed Flow occupancy rate
1.0 persons/veh 1.0 persons/veh
Overall occupancy (incl. buses)
1.2 persons/veh 1.3 persons/veh
Violation rate(HOV Lane)
(3)
2.1 % 3.1 %
NOTES: (1) Two or more persons per vehicle.
(2) Hybrid HOV lane only/Single Occupancy mixed flow lanes only.
(3) Violation rate = no. of violators in HOV lane x 100%
Total no. of vehicles in HOV lane
(4) HOV lane in operation from 6:00 to 9:00 A.M.
(5) Observations conducted 09/13/06 at Stone Valley Road.
(4)
(5)
District 4, Year 2006 Annual HOV Lane Report Page 94

CONTRA COSTA-680 Northbound - P.M.Alcosta Boulevard to Livorna Road Typical data for 2006
PEAK PERIOD PEAK HOUR3:00 - 6:00 PM 4:00 - 5:00 PM
VEHICLES HOV LaneMixed Flow
Lanes HOV LaneMixed Flow
Lanes
Motorcycles 34 2 11 1
Buses 29 2 13 0
Carpools (1) 3485 519 1275 189
Vanpools 30 19 18 6
Hybrid / Single Occ. (2) 146 13423 72 4724Violators 33 — 9 —
TOTAL 3757 13965 1398 4920
PERSONS HOV LaneMixed Flow
Lanes HOV LaneMixed Flow
Lanes
Motorcycles 34 2 11 1
Buses 1015 70 455 0
Carpools (1) 7149 1122 2633 397
Vanpools 300 190 180 60
Hybrid / Single Occ. (2) 146 13423 72 4724Violators 33 — 9 —
TOTAL 8677 14807 3360 5182
RATES
HOV Lane occupancy rate
2.3 persons/veh 2.4 persons/veh
Mixed Flow occupancy rate
1.1 persons/veh 1.1 persons/veh
Overall occupancy (incl. buses)
1.3 persons/veh 1.4 persons/veh
Violation rate(HOV Lane)
(3)
0.9 % 0.6 %
NOTES: (1) Two or more persons per vehicle.
(2) Hybrid HOV lane only/Single Occupancy mixed flow lanes only.
(3) Violation rate = no. of violators in HOV lane x 100%
Total no. of vehicles in HOV lane
(4) HOV lane in operation from 3:00 to 6:00 P.M.
(5) Observations conducted 11/29/06 at Stone Valley Road.
(4)
(5)
District 4, Year 2006 Annual HOV Lane Report Page 95

CONTRA COSTA-680 Violation HistoryLivorna Road to Alcosta Boulevard Southbound
DATEPERIOD
MONITOREDTOTAL HOVL
VOLUMEVIOLATION
RATE
A.M. PEAK Thu Jun 8, 2006 6:00 - 9:00 AM 3047 7.6%
Wed Nov 16, 2005 6:00 - 9:00 AM 2793 4.4%
Tue Oct 5, 2004 6:00 - 9:00 AM 2118 4.5%
Thu Apr 3, 2003 6:00 - 9:00 AM 2114 0.6%
Thu Jun 13, 2002 6:00 - 9:00 AM 2480 1.7%
Thu Mar 15, 2001 6:00 - 9:00 AM 2609 5.3%
Thu Apr 6, 2000 6:00 - 9:00 AM 2258 2.8%
Wed Sep 29, 1999 6:00 - 9:00 AM 1974 3.1%
Tues Mar 10, 1998 6:00 - 9:00 AM 1545 9.0%
Wed Oct 29, 1997 6:00 - 9:00 AM 1791 3.9%
Thu Oct 10, 1996 6:00 - 9:00 AM 1359 2.6%
Tue Nov 7, 1995 6:00 - 9:00 AM 1179 1.2%
P.M. PEAK Wed Sep 20, 2006 3:00 - 6:00 PM 3143 1.3%
Tue Nov 15, 2005 3:00 - 6:00 PM 2640 3.0%
Thu Oct 28, 2004 3:00 - 6:00 PM 2527 2.6%
Tue Apr 8, 2003 3:00 - 6:00 PM 2109 2.4%
Wed Mar 13, 2002 3:00 - 6:00 PM 2009 7.8%
Wed May 9, 2001 3:00 - 6:00 PM 1831 8.5%
Tue Dec 12, 2000 3:00 - 6:00 PM 1337 4.3%
Wed Sep 29, 1999 3:00 - 6:00 PM 1604 7.2%
Tue Sep 22, 1998 3:00 - 6:00 PM 2004 8.4%
Thu Apr 17, 1997 3:00 - 6:00 PM 1344 2.0%
Wed Oct 9, 1996 3:00 - 6:00 PM 1182 4.1%
Tue Nov 7, 1995 3:00 - 6:00 PM 645 7.0%
NOTES: (a) Morning period of operation from 6:00 to 9:00 AM.
(b) Evening period of operation from 3:00 to 6:00 PM.
District 4, Year 2006 Annual HOV Lane Report Page 96

CONTRA COSTA-680 Violation HistoryAlcosta Boulevard to Livorna Road Northbound
DATEPERIOD
MONITOREDTOTAL HOVL
VOLUMEVIOLATION
RATE
A.M. PEAK Wed Sep 13, 2006 6:00 - 9:00 AM 2194 2.1%
Wed Apr 27, 2005 6:00 - 9:00 AM 1891 3.5%
Thu Oct 7, 2004 6:00 - 9:00 AM 1899 3.0%
Tue Oct 21, 2003 6:00 - 9:00 AM 1920 5.0%
Thu Apr 25, 2002 6:00 - 9:00 AM 1746 6.9%
Tue Sep 25, 2001 6:00 - 9:00 AM 1681 3.0%
Thu Nov 2, 2000 6:00 - 9:00 AM 1263 7.0%
Tue Sep 28, 1999 6:00 - 9:00 AM 621 7.1%
Thu Nov 5, 1998 6:00 - 9:00 AM 1213 4.6%
Tue Oct 28, 1997 6:00 - 9:00 AM 1139 4.1%
Wed Oct 9, 1996 6:00 - 9:00 AM 958 6.6%
Thu Nov 2, 1995 6:00 - 9:00 AM 1064 4.4%
P.M. PEAK Wed Nov 29, 2006 3:00 - 6:00 PM 3757 0.9%
Tue Apr 26, 2005 3:00 - 6:00 PM 3727 3.2%
Thu Dec 2, 2004 3:00 - 6:00 PM 3842 2.4%
Tue Oct 21, 2003 3:00 - 6:00 PM 3677 3.4%
Wed Nov 20, 2002 3:00 - 6:00 PM 3989 4.5%
Tue May 8, 2001 3:00 - 6:00 PM 3742 5.0%
Wed Oct 4, 2000 3:00 - 6:00 PM 4165 3.6%
Tue Oct 26, 1999 3:00 - 6:00 PM 3224 4.9%
Tue Oct 6, 1998 3:00 - 6:00 PM 2819 3.1%
Wed Oct 15, 1997 3:00 - 6:00 PM 2755 4.9%
Thu Oct 3, 1996 3:00 - 6:00 PM 2523 6.1%
Thu Nov 2, 1995 3:00 - 6:00 PM 1902 1.2%
NOTES: (a) Morning period of operation from 6:00 to 9:00 AM.
(b) Evening period of operation from 3:00 to 6:00 PM.
District 4, Year 2006 Annual HOV Lane Report Page 97

MARIN-101 Southbound - A.M.Anderson Dr. to Richardson Bridge Typical data for 2006
PEAK PERIOD PEAK HOUR6:30 - 8:30 AM 7:30 - 8:30 AM
VEHICLES HOV LaneMixed Flow
Lanes HOV LaneMixed Flow
Lanes
Motorcycles 26 10 13 6
Buses 42 47 28 22
Carpools (1) 871 798 526 432
Vanpools 6 8 5 3
Hybrid/Single Occ. (2) 89 7760 40 4030Violators 15 — 6 —
TOTAL 1049 8623 618 4493
PERSONS HOV LaneMixed Flow
Lanes HOV LaneMixed Flow
Lanes
Motorcycles 26 10 13 6
Buses 1470 1645 980 770
Carpools (1) 1843 1692 1133 926
Vanpools 60 80 50 30
Hybrid/Single Occ. (2) 89 7760 40 4030Violators 15 — 6 —
TOTAL 3503 11187 2222 5762
RATES
HOV Lane occupancy rate
3.3 persons/veh 3.6 persons/veh
Mixed Flow occupancy rate
1.3 persons/veh 1.3 persons/veh
Overall occupancy (incl. buses)
1.5 persons/veh 1.6 persons/veh
Violation rate(HOV Lane)
(3)
1.4 % 1.0 %
NOTES: (1) Two or more occupants per vehicle.
(2) Hybrid HOV lane only/Single Occupancy mixed flow lane only.
(3) Violation rate = no. of violators in HOV lane x 100%
Total no. of vehicles in HOV lane
(4) HOV lane in operation from 6:30 to 8:30 A.M.
(5) Observations conducted 04/13/06 at Route 131, East Blithdale Ave. I/C.
(4)
(5)
District 4, Year 2006 Annual HOV Lane Report Page 98

MARIN-101 Northbound - P.M.Richardson Bridge to Nellen Ave UC Typical data for 2006
PEAK PERIOD PEAK HOUR4:30 - 7:00 PM 5:30 - 6:30 PM
VEHICLES HOV LaneMixed Flow
Lanes HOV LaneMixed Flow
Lanes
Motorcycles 57 41 24 19
Buses 70 29 27 12
Carpools (1) 1528 1846 628 744
Vanpools 14 4 2 1
Hybrid/Single Occ. (2) 87 11413 33 4864Violators 25 — 3 —
TOTAL 1781 13333 717 5640
PERSONS HOV LaneMixed Flow
Lanes HOV LaneMixed Flow
Lanes
Motorcycles 57 41 24 19
Buses 2450 1015 945 420
Carpools (1) 3156 3934 1296 1587
Vanpools 140 40 20 10
Hybrid/Single Occ. (2) 87 11413 33 4864Violators 25 — 3 —
TOTAL 5915 16443 2321 6900
RATES
HOV Lane occupancy rate
3.3 persons/veh 3.2 persons/veh
Mixed Flow occupancy rate
1.2 persons/veh 1.2 persons/veh
Overall occupancy (incl. buses)
1.5 persons/veh 1.4 persons/veh
Violation rate(HOV Lane)
(3)
1.4 % 0.4 %
NOTES: (1) Two or more occupants per vehicle.
(2) Hybrid HOV lane only/Single Occupancy mixed flow lane only.
(3) Violation rate = no. of violators in HOV lane x 100%
Total no. of vehicles in HOV lane
(4) HOV lane in operation from 4:30 to 7:00 P.M.
(5) Observations conducted 04/06/06 at Route 131, E. Blithdale Ave. I/C.
(4)
(5)
District 4, Year 2006 Annual HOV Lane Report Page 99

MARIN-101 Violation HistoryAnderson Dr. to Richardson Bay Bridge Southbound
DATEPERIOD MONITORED
TOTAL HOVL VOLUME
VIOLATION RATE
A.M. PEAK Thu Apr 13, 2006 6:30 - 8:30 AM 1049 1.4%
Thu Mar 3, 2005 6:30 - 8:30 AM 1099 3.0%
Thu Nov 4, 2004 6:30 - 8:30 AM 1015 4.4%
Tue Apr 8, 2003 6:30 - 8:30 AM 1118 3.4%
Wed Mar 20, 2002 6:30 - 8:30 AM 1591 1.9%
Wed Mar 28, 2001 6:30 - 8:30 AM 1495 2.3%
Thu Mar 23, 2000 6:30 - 8:30 AM 1538 2.8%
Wed Mar 17, 1999 6:30 - 8:30 AM 1394 2.3%
Tue Mar 3, 1998 6:30 - 8:30 AM 1106 1.6%
Tue Mar 11, 1997 6:30 - 8:30 AM 1367 2.4%
Thu Oct 17, 1996 6:30 - 8:30 AM 1446 1.2%
Tue Oct 31, 1995 6:30 - 8:30 AM 1389 3.7%
Thu Oct 13, 1994 6:30 - 8:30 AM 1135 6.4%
Wed Apr 21, 1993 6:30 - 8:30 AM 1325 7.2%
NOTES: (a) Minimum occupancy requirement was reduced to 2 persons per vehicle on October 1, 1988
(b) Morning period of operation from 6:30 to 8:30 AM.
District 4, Year 2006 Annual HOV Lane Report Page 100

MARIN-101 Violation HistoryRichardson Bay Bridge to Nellen Ave UC Northbound
DATEPERIOD MONITORED
TOTAL HOVL VOLUME
VIOLATION RATE
P.M. PEAK Thu Apr 6, 2006 4:30 - 7:00 PM 1781 1.4%
Thu Sep 29, 2005 4:30 - 7:00 PM 1953 1.6%
Wed Oct 13, 2004 4:30 - 7:00 PM 1529 1.9%
Wed Apr 16, 2003 4:30 - 7:00 PM 1370 2.4%
Tue Sep 17, 2002 4:30 - 7:00 PM 1365 1.5%
Tue Apr 3, 2001 4:30 - 7:00 PM 1544 3.9%
Tue Oct 3, 2000 4:30 - 7:00 PM 1771 1.6%
Tue Mar 16, 1999 4:30 - 7:00 PM 1719 1.9%
Wed Apr 22, 1998 4:30 - 7:00 PM 1838 4.8%
Wed Oct 1, 1997 4:30 - 7:00 PM 2217 5.4%
Thu Oct 24, 1996 4:30 - 7:00 PM 1820 3.4%
Tue Oct 24, 1995 4:30 - 7:00 PM 1779 3.9%
Tue Apr 5, 1994 4:30 - 7:00 PM 2031 0.2%
Tue Apr 20, 1993 4:30 - 7:00 PM 1516 13.5%
NOTES: (a) Minimum occupancy requirement was reduced to 2 persons per vehicle on October 1, 1988
(b) Evening period of operation from 4:30 to 7:00 PM.
District 4, Year 2006 Annual HOV Lane Report Page 101

MARIN-101 Southbound - A.M.Route 37 to N. San Pedro Road Typical data for 2006
PEAK PERIOD PEAK HOUR6:30 - 8:30 AM 6:30 - 7:30 AM
VEHICLES HOV LaneMixed Flow
Lanes HOV LaneMixed Flow
Lanes
Motorcycles 52 25 29 12
Buses 23 39 13 23
Carpools (1) 1964 332 1082 165
Vanpools 15 4 7 0
Hybrid/Single Occ. (2) 90 8456 52 4006Violators 30 — 16 —
TOTAL 2174 8856 1199 4206
PERSONS HOV LaneMixed Flow
Lanes HOV LaneMixed Flow
Lanes
Motorcycles 52 25 29 12
Buses 805 1365 455 805
Carpools (1) 4022 723 2230 359
Vanpools 150 40 70 0
Hybrid/Single Occ. (2) 90 8456 52 4006Violators 30 — 16 —
TOTAL 5149 10609 2852 5182
RATES
HOV Lane occupancy rate
2.4 persons/veh 2.4 persons/veh
Mixed Flow occupancy rate
1.2 persons/veh 1.2 persons/veh
Overall occupancy (incl. buses)
1.4 persons/veh 1.5 persons/veh
Violation rate(HOV Lane)
(3)
1.4 % 1.3 %
NOTES: (1) Two or more occupants per vehicle.
(2) Hybrid HOV Lane only/Single Occupancy mixed flow lane only.
(3) Violation rate = no. of violators in HOV lane x 100%
Total no. of vehicles in HOV lane
(4) HOV lane in operation from 6:30 to 8:30 A.M.
(5) Observations conducted 10/03/06 at Alameda Del Prado Dr. I/C.
(4)
(5)
District 4, Year 2006 Annual HOV Lane Report Page 102

MARIN-101 Northbound - P.M.N. San Pedro Road to Route 37 Typical data for 2006
PEAK PERIOD PEAK HOUR4:30 - 7:00 PM 4:30 - 5:30 PM
VEHICLES HOV LaneMixed Flow
Lanes HOV LaneMixed Flow
Lanes
Motorcycles 21 13 10 4
Buses 43 27 22 6
Carpools (1) 1365 1712 706 618
Vanpools 15 13 5 6
Hybrid/Single Occ. (2) 81 14125 43 6102Violators 34 — 16 —
TOTAL 1559 15890 802 6736
PERSONS HOV LaneMixed Flow
Lanes HOV LaneMixed Flow
Lanes
Motorcycles 21 13 10 4
Buses 1505 945 770 210
Carpools (1) 2831 3628 1465 1313
Vanpools 150 130 50 60
Hybrid/Single Occ. (2) 81 14125 43 6102Violators 34 — 16 —
TOTAL 4622 18841 2354 7689
RATES
HOV Lane occupancy rate
3.0 persons/veh 3.0 persons/veh
Mixed Flow occupancy rate
1.2 persons/veh 1.1 persons/veh
Overall occupancy (incl. buses)
1.3 persons/veh 1.3 persons/veh
Violation rate(HOV Lane)
(3)
2.2 % 2.0 %
NOTES: (1) Two or more occupants per vehicle.
(2) Hybrid HOV lane only/Single Occupancy mixed flow lane only.
(3) Violation rate = no. of violators in HOV lane x 100%
Total no. of vehicles in HOV lane
(4) HOV lane in operation from 4:30 to 7:00 P.M.
(5) Observations conducted 04/05/06 at the Manuel Freitas Truck Scale.
(4)
(5)
District 4, Year 2006 Annual HOV Lane Report Page 103

MARIN-101 Violation HistoryRoute 37 to N. San Pedro Road Southbound
DATEPERIOD MONITORED
TOTAL HOVL VOLUME
VIOLATION RATE
A.M. PEAK Tue Oct 3, 2006 6:30 - 8:30 AM 2174 1.4%
Wed Nov 2, 2005 6:30 - 8:30 AM 2276 1.3%
Wed Nov 3, 2004 6:30 - 8:30 AM 2343 1.9%
Thu Apr 3, 2003 6:30 - 8:30 AM 2335 2.2%
Tue Mar 19, 2002 6:30 - 8:30 AM 2564 1.2%
Wed Oct 31, 2001 6:30 - 8:30 AM 2520 1.4%
Wed Mar 22, 2000 6:30 - 8:30 AM 2610 1.1%
Thu Mar 18, 1999 6:30 - 8:30 AM 2256 1.8%
Wed Mar 4, 1998 6:30 - 8:30 AM 2047 3.3%
Wed Nov 5, 1997 6:30 - 8:30 AM 2690 5.1%
Tue Nov 19, 1996 6:30 - 8:30 AM 2507 2.6%
Wed Oct 25, 1995 6:30 - 8:30 AM 2609 4.3%
Wed Mar 30, 1994 6:30 - 8:30 AM 1702 1.8%
Tue Apr 27, 1993 6:30 - 8:30 AM 2042 4.8%
NOTES: (a) Minimum occupancy requirement was reduced to 2 persons per vehicle on October 1, 1988
(b) Morning period of operation from 6:30 to 8:30 AM.
District 4, Year 2006 Annual HOV Lane Report Page104

MARIN-101 Violation HistoryN. San Pedro Road to Route 37 Northbound
DATEPERIOD MONITORED
TOTAL HOVL VOLUME
VIOLATION RATE
P.M. PEAK Wed Apr 5, 2006 4:30 - 7:00 PM 1559 2.2%
Thu Apr 21, 2005 4:30 - 7:00 PM 1545 4.0%
Thu Oct 7, 2004 4:30 - 7:00 PM 1577 2.5%
Wed Apr 9, 2003 4:30 - 7:00 PM 1851 3.2%
Thu Sep 19, 2002 4:30 - 7:00 PM 1552 2.6%
Tue Sep 18, 2001 4:30 - 7:00 PM 1580 1.1%
Tue Mar 21, 2000 4:30 - 7:00 PM 1921 2.7%
Thu Sep 16, 1999 4:30 - 7:00 PM 1841 4.0%
Tue Apr 7, 1998 4:30 - 7:00 PM 2147 2.4%
Thu Oct 2, 1997 4:30 - 7:00 PM 1867 3.2%
Thu Oct 17, 1996 4:30 - 7:00 PM 1983 3.9%
Wed Apr 19, 1995 4:30 - 7:00 PM 1817 0.3%
Thu Apr 7, 1994 4:30 - 7:00 PM 1233 0.9%
Wed Apr 21, 1993 4:30 - 7:00 PM 1599 7.9%
NOTES: (a) Minimum occupancy requirement was reduced to 2 persons per vehicle on October 1, 1988
(b) Evening period of operation from 4:30 to 7:00 PM.
District 4, Year 2006 Annual HOV Lane Report Page105

SANTA CLARA-85 Southbound - P.M.Route 101 (Mountain View) to Route 280 Typical data for 2006
PEAK PERIOD PEAK HOUR3:00 - 6:00 PM 5:00 - 6:00 PM
VEHICLES HOV LaneMixed Flow
Lanes HOV LaneMixed Flow
Lanes
Motorcycles 141 3 61 1
Buses 10 1 5 0
Carpools (1) 1791 354 729 95
Vanpools 5 2 4 1
Hybrid/Single Occ. (2) 207 10321 130 3496Violators 10 — 2 —
TOTAL 2164 10681 931 3593
PERSONS HOV LaneMixed Flow
Lanes HOV LaneMixed Flow
Lanes
Motorcycles 141 3 61 1
Buses 350 35 175 0
Carpools (1) 3689 797 1477 223
Vanpools 50 20 40 10
Hybrid/Single Occ. (2) 207 10321 130 3496Violators 10 — 2 —
TOTAL 4447 11176 1885 3730
RATES
HOV Lane occupancy rate
2.1 persons/veh 2.0 persons/veh
Mixed Flow occupancy rate
1.0 persons/veh 1.0 persons/veh
Overall occupancy (incl. buses)
1.2 persons/veh 1.2 persons/veh
Violation rate(HOV Lane)
(3)
0.5 % 0.2 %
NOTES: (1) Two or more occupants per vehicle.
(2) Hybrid HOV lane only/Single Occupancy mixed flow lanes only.
(3) Violation rate = no. of violators in HOV lane x 100%
Total no. of vehicles in HOV lane
(4) HOV lane in operation from 3:00 to 7:00 P.M.
(5) Observations conducted 10/24/06 at Fremont avenue I/C
(4)
(5)
District 4, Year 2006 Annual HOV Lane Report Page 106

SANTA CLARA-85 Northbound - A.M.Route 280 to Route 101 (Mountain View) Typical data for 2006
PEAK PERIOD PEAK HOUR6:00 - 9:00 AM 8:00 - 9:00 AM
VEHICLES HOV LaneMixed Flow
Lanes HOV LaneMixed Flow
Lanes
Motorcycles 129 11 53 0
Buses 5 0 3 0
Carpools (1) 1995 80 882 35
Vanpools 7 0 6 0
Hybrid/Single Occ. (2) 348 11379 219 3947Violators 17 — 5 —
TOTAL 2501 11470 1168 3982
PERSONS HOV LaneMixed Flow
Lanes HOV LaneMixed Flow
Lanes
Motorcycles 129 11 53 0
Buses 175 0 105 0
Carpools (1) 4044 169 1785 74
Vanpools 70 0 60 0
Hybrid/Single Occ. (2) 348 11379 219 3947Violators 17 — 5 —
TOTAL 4783 11559 2227 4021
RATES
HOV Lane occupancy rate
1.9 persons/veh 1.9 persons/veh
Mixed Flow occupancy rate
1.0 persons/veh 1.0 persons/veh
Overall occupancy (incl. buses)
1.2 persons/veh 1.2 persons/veh
Violation rate(HOV Lane)
(3)
0.7 % 0.4 %
NOTES: (1) Two or more occupants per vehicle.
(2) Hybrid HOV lane only/Single Occupancy mixed flow lanes only.
(3) Violation rate = no. of violators in HOV lane x 100%
Total no. of vehicles in HOV lane
(4) HOV lane in operation from 5:00 to 9:00 A.M.
(5) Observations conducted 10/11/06 at Fremont Avenue I/C
(4)
(5)
District 4, Year 2006 Annual HOV Lane Report Page 107

SANTA CLARA-85 Violation HistoryRoute 101 (Mountain View) to Route 280 Southbound
DATEPERIOD
MONITOREDTOTAL HOVL
VOLUMEVIOLATION
RATE
A.M. PEAK Year 2006 - - -Year 2005 - - -Year 2004 - - -Year 2003 - - -Wed Oct 23, 2002 7:00 - 9:00 AM 540 10.0%
Thu Jun 7, 2001 6:00 - 9:00 AM 560 4.1%
Wed Sep 27, 2000 6:00 - 9:00 AM 604 13.2%
Tue Jun 8, 1999 6:00 - 9:00 AM 597 9.4%
Wed Mar 04, 1998 6:00 - 9:00 AM 551 0.5%
Tue Feb 25, 1997 6:45 - 9:00 AM 397 5.3%
Wed Apr 3, 1996 6:00 - 9:00 AM 359 5.0%
Wed Sept 20, 1995 7:00 - 9:00 AM 345 6.4%
Thu Dec 1, 1994 7:00 - 9:00 AM 618 2.1%
Wed Jun 9, 1993 6:00 - 9:00 AM 286 26.6%
P.M. PEAK Tue Oct 24, 2006 3:00 - 6:00 PM 2164 0.5%
Wed Oct 12, 2005 3:00 - 6:00 PM 2265 0.7%
Tue Nov 30, 2004 3:00 - 5:15 PM 1510 0.7%
Wed Jun 4, 2003 3:00 - 6:00 PM 2323 1.6%
Wed May 29, 2002 3:00 - 6:00 PM 2647 4.4%
Tue Sep 25, 2001 3:00 - 6:00 PM 2656 6.4%
Thu Jun 1, 2000 3:00 - 6:00 PM 2792 0.9%
Thu May 13, 1999 3:00 - 6:00 PM 3121 1.4%
Thu Apr 9, 1998 4:00 - 6:00 PM 2058 0.2%
Tue Sept 30, 1997 3:00 - 6:00 PM 2277 1.2%
Thu May 16, 1996 3:00 - 6:00 PM 2165 3.0%
Thu Sept 21, 1995 3:00 - 6:00 PM 3671 2.4%
Tue Nov 29, 1994 3:00 - 5:00 PM 970 2.1%
Tue May 18, 1993 3:00 - 6:00 PM 1279 7.8%
NOTES: (a) Morning period of operation from 5:00 to 9:00 AM.
(b) Evening period of operation from 3:00 to 7:00 PM.
(c) Data was not collected in 2006 off-peak direction
District 4, Year 2006 Annual HOV Lane Report Page 108

SANTA CLARA-85 Violation HistoryRoute 280 to Route 101 (Mountain View) Northbound
DATEPERIOD
MONITOREDTOTAL HOVL
VOLUMEVIOLATION
RATE
A.M. PEAK Wed Oct 11, 2006 6:00 - 9:00 AM 2501 0.7%
Tue Oct 18, 2005 6:00 - 9:00 AM 1703 3.0%
Wed Nov 3, 2004 6:00 - 9:00 AM 2132 0.7%
Wed Oct 29, 2003 6:00 - 9:00 AM 1151 0.8%
Tue Oct 8, 2002 7:00 - 9:00 AM 1435 1.5%
Tue Apr 10, 2001 6:00 - 9:00 AM 2471 1.8%
Tue Oct 17, 2000 7:00 - 9:00 AM 2188 10.1%
Wed Oct 6, 1999 6:00 - 9:00 AM 2402 4.9%
Tue Dec 1, 1998 6:00 - 9:00 AM 2473 4.7%
Thu Dec 4, 1997 7:00 - 9:00 AM 1584 0.1%
Wed Nov 20, 1996 6:45 - 9:00 AM 1840 0.2%
Tue Sept 12, 1995 7:00 - 9:00 AM 1896 1.4%
Tue Nov 29, 1994 7:00 - 9:00 AM 1073 1.8%
Tue Nov 16, 1993 6:30 - 9:00 AM 1031 11.1%
P.M. PEAK Year 2006 - - -Year 2005 - - -Year 2004 - - -Year 2003 - - -Thu Oct 31, 2002 3:00 - 5:30 PM 761 2.2%
Wed Oct 10, 2001 3:00 - 6:00 PM 1124 0.4%
Thu May 4, 2000 3:00 - 6:00 PM 940 2.1%
Thu Oct 28, 1999 3:00 - 6:00 PM 845 1.2%
Wed Mar 4, 1998 3:00 - 6:00 PM 852 3.5%
Tue Feb 25, 1997 3:00 - 6:00 PM 1051 2.7%
Tue Jun 4, 1996 3:00 - 6:00 PM 1008 8.2%
Tue Sept 12, 1995 3:00 - 6:00 PM 652 9.8%
Thu Dec 1, 1994 3:00 - 5:00 PM 569 4.4%
Thu Apr 29, 1993 3:00 - 6:00 PM 382 31.4%
NOTES: (a) Morning period of operation from 5:00 to 9:00 AM.
(b) Evening period of operation from 3:00 to 7:00 PM.
(c) Data was not collected in 2006 for off-peak direction
District 4, Year 2006 Annual HOV Lane Report Page 109

SANTA CLARA-85 Southbound - P.M.Route 280 to Almaden Expressway Typical data for 2006
PEAK PERIOD PEAK HOUR3:00 - 6:00 PM 4:00 - 5:00 PM
VEHICLES HOV LaneMixed Flow
Lanes HOV LaneMixed Flow
Lanes
Motorcycles 154 9 60 1
Buses 7 4 5 1
Carpools (1) 2115 668 729 143
Vanpools 3 1 2 0
Hybrid/Single Occ. (2) 146 10539 56 3614Violators 4 — 2 —
TOTAL 2429 11221 854 3759
PERSONS HOV LaneMixed Flow
Lanes HOV LaneMixed Flow
Lanes
Motorcycles 154 9 60 1
Buses 245 140 175 35
Carpools (1) 4413 1405 1535 307
Vanpools 30 10 20 0
Hybrid/Single Occ. (2) 146 10539 56 3614Violators 4 — 2 —
TOTAL 4992 12103 1848 3957
RATES
HOV Lane occupancy rate
2.1 persons/veh 2.2 persons/veh
Mixed Flow occupancy rate
1.1 persons/veh 1.1 persons/veh
Overall occupancy (incl. buses)
1.3 persons/veh 1.3 persons/veh
Violation rate(HOV Lane)
(3)
0.2 % 0.2 %
NOTES: (1) Two or more occupants per vehicle.
(2) Hybrid HOV lane only/Single Occupancy mixed flow lanes only.
(3) Violation rate = no. of violators in HOV lane x 100%
Total no. of vehicles in HOV lane
(4) HOV lane in operation from 3:00 to 7:00 P.M.
(5) Observations conducted 05/16/06 at Winchester Boulevard I/C
(4)
(5)
District 4, Year 2006 Annual HOV Lane Report Page 110

SANTA CLARA-85 Northbound - A.M.Almaden Expressway to Route 280 Typical data for 2006
PEAK PERIOD PEAK HOUR6:00 - 9:00 AM 7:00 - 8:00 AM
VEHICLES HOV LaneMixed Flow
Lanes HOV LaneMixed Flow
Lanes
Motorcycles 119 11 49 6
Buses 8 0 3 0
Carpools (1) 2900 216 1178 70
Vanpools 5 0 3 0
Hybrid/Single Occ. (2) 226 10158 89 3414Violators 40 — 29 —
TOTAL 3298 10385 1351 3490
PERSONS HOV LaneMixed Flow
Lanes HOV LaneMixed Flow
Lanes
Motorcycles 119 11 49 6
Buses 280 0 105 0
Carpools (1) 5890 462 2420 152
Vanpools 50 0 30 0
Hybrid/Single Occ. (2) 226 10158 89 3414Violators 40 — 29 —
TOTAL 6605 10631 2722 3572
RATES
HOV Lane occupancy rate
2.0 persons/veh 2.0 persons/veh
Mixed Flow occupancy rate
1.0 persons/veh 1.0 persons/veh
Overall occupancy (incl. buses)
1.3 persons/veh 1.3 persons/veh
Violation rate(HOV Lane)
(3)
1.2 % 2.1 %
NOTES: (1) Two or more occupants per vehicle.
(2) Hybrid HOV lane only/Single Occupancy mixed flow lanes only.
(3) Violation rate = no. of violators in HOV lane x 100%
Total no. of vehicles in HOV lane
(4) HOV lane in operation from 5:00 to 9:00 A.M.
(5) Observations conducted 09/27/06 at Union Avenue I/C
(4)
(5)
District 4, Year 2006 Annual HOV Lane Report Page 111

SANTA CLARA-85 Violation HistoryRoute 280 to Almaden Expressway Southbound
DATEPERIOD
MONITOREDTOTAL HOVL
VOLUMEVIOLATION
RATE
A.M. PEAK Year 2006 - - -Year 2005 - - -Year 2004 - - -Year 2003 - - -Wed May 1, 2002 6:00 - 9:00 AM 256 9.0%
Tue Apr 17, 2001 6:00 - 9:00 AM 341 5.9%
Tue May 2, 2000 6:00 - 9:00 AM 363 1.7%
Thu Mar 11, 1999 6:30 - 9:00 AM 371 0.3%
Tue Mar 3, 1998 6:00 - 9:00 AM 416 2.4%
Thu Nov 6, 1997 6:00 - 9:00 AM 456 8.6%
Wed May 01, 1996 6:30 - 9:00 AM 328 9.1%
Thu Sept 14, 1995 7:00 - 9:00 AM 514 5.6%
Wed Dec 7, 1994 7:00 - 9:00 AM 179 20.1%
P.M. PEAK Tue May 16, 2006 3:00 - 6:00 PM 2429 0.2%
Thu Oct 13, 2005 3:00 - 6:00 PM 2311 0.9%
Wed Oct 6, 2004 3:00 - 6:00 PM 2288 0.5%
Wed Oct 22, 2003 3:00 - 6:00 PM 2151 2.3%
Wed Mar 13, 2002 3:00 - 6:00 PM 2866 3.4%
Thu Apr 5, 2001 3:00 - 6:00 PM 2798 0.5%
Tue Apr 18, 2000 3:00 - 6:00 PM 3056 0.5%
Thu Mar 11, 1999 3:00 - 6:00 PM 2963 0.1%
Thu Jun 4, 1998 3:00 - 6:00 PM 3004 0.1%
Thu Feb 27, 1997 3:00 - 6:00 PM 2460 1.3%
Tue Apr 30, 1996 3:00 - 6:00 PM 3167 7.0%
Wed Sept 13, 1995 3:00 - 6:00 PM 2774 1.9%
Thu Dec 15, 1994 3:00 - 5:00 PM 1856 1.3%
NOTES: (a) Morning period of operation from 5:00 to 9:00 AM.
(b) Evening period of operation from 3:00 to 7:00 PM.
(c) Data was not collected in 2006 for off-peak direction
District 4, Year 2006 Annual HOV Lane Report Page 112

SANTA CLARA-85 Violation HistoryAlmaden Expressway to Route 280 Northbound
DATEPERIOD
MONITOREDTOTAL HOVL
VOLUMEVIOLATION
RATE
A.M. PEAK Wed Sep 27, 2006 6:00 - 9:00 AM 3298 1.2%
Thu Oct 6, 2005 6:00 - 9:00 AM 2418 0.4%
Thu Oct 28, 2004 7:00 - 9:00 AM 1813 0.4%
Wed Oct 22, 2003 7:00 - 9:00 AM 2012 0.0%
Wed Mar 27, 2002 6:00 - 9:00 AM 2572 4.6%
Tues Oct 16, 2001 6:00 - 9:00 AM 3298 6.4%
Wed Jun 7, 2000 6:00 - 9:00 AM 3555 9.9%
Tue Oct 26, 1999 7:00 - 9:00 AM 2350 3.0%
Wed May 13, 1998 6:00 - 9:00 AM 2801 12.2%
Wed Nov 5, 1997 6:00 - 9:00 AM 3036 0.4%
Wed Nov 20,1996 6:45 - 9:00 AM 1840 0.2%
Tue Apr 18, 1995 6:30 - 9:00 AM 2145 2.0%
Tue Dec 6, 1994 7:00 - 9:00 AM 1927 1.9%
P.M. PEAK Year 2006 - - -Year 2005 - - -Year 2004 - - -Year 2003 - - -Thu Apr 4, 2002 3:00 - 6:00 PM 1068 7.5%
Tue Jun 12, 2001 3:00 - 6:00 PM 985 8.9%
Tue Oct 17, 2000 3:00 - 6:00 PM 642 3.6%
Tue Feb 23, 1999 3:00 - 6:00 PM 866 8.7%
Wed Apr 8, 1998 3:00 - 6:00 PM 1097 4.4%
Wed Oct 8, 1997 3:00 - 6:00 PM 895 0.3%
Wed Sep 25, 1996 3:00 - 6:00 PM 1417 0.6%
Tue Oct 3, 1995 3:00 - 6:00 PM 748 6.1%
Thu Dec 8, 1994 3:00 - 5:00 PM 339 7.4%
NOTES: (a) Morning period of operation from 5:00 to 9:00 AM.
(b) Evening period of operation from 3:00 to 7:00 PM.
(c) Data was not collected in 2006 for off-peak direction
District 4, Year 2006 Annual HOV Lane Report Page 113

SANTA CLARA-85 Southbound - P.M.Almaden Expressway to Route 101 (So. San Jose) Typical data for 2006
PEAK PERIOD PEAK HOUR3:00 - 6:00 PM 5:00 - 6:00 PM
VEHICLES HOV LaneMixed Flow
Lanes HOV LaneMixed Flow
Lanes
Motorcycles 57 32 24 9
Buses 8 2 0 1
Carpools (1) 1424 1155 576 291
Vanpools 6 0 3 0
Single Occ. (2) — 9714 — 3402Violators 52 — 22 —
TOTAL 1547 10903 625 3703
PERSONS HOV LaneMixed Flow
Lanes HOV LaneMixed Flow
Lanes
Motorcycles 57 32 24 9
Buses 280 70 0 35
Carpools (1) 2910 2613 1175 666
Vanpools 60 0 30 0
Single Occ. (2) — 9714 — 3402Violators 52 — 22 —
TOTAL 3359 12429 1251 4112
RATES
HOV Lane occupancy rate
2.2 persons/veh 2.0 persons/veh
Mixed Flow occupancy rate
1.1 persons/veh 1.1 persons/veh
Overall occupancy (incl. buses)
1.3 persons/veh 1.2 persons/veh
Violation rate(HOV Lane)
(3)
3.4 % 3.5 %
NOTES: (1) Two or more occupants per vehicle.
(2) Mixed flow lanes only.
(3) Violation rate = no. of violators in HOV lane x 100%
Total no. of vehicles in HOV lane
(4) HOV lane in operation from 3:00 to 7:00 P.M.
(5) Observations conducted 04/20/06 at Blossom Hill Road Train Station
(4)
(5)
District 4, Year 2006 Annual HOV Lane Report Page 114

SANTA CLARA-85 Northbound - A.M.Route 101 (So. San Jose) to Almaden Expressway Typical data for 2006
PEAK PERIOD PEAK HOUR6:00 - 9:00 AM 7:00 - 8:00 AM
VEHICLES HOV LaneMixed Flow
Lanes HOV LaneMixed Flow
Lanes
Motorcycles 36 15 12 8
Buses 0 20 0 12
Carpools (1) 1050 696 576 310
Vanpools 2 3 1 2
Single Occ. (2) — 8113 — 2803Violators 43 — 18 —
TOTAL 1131 8847 607 3135
PERSONS HOV LaneMixed Flow
Lanes HOV LaneMixed Flow
Lanes
Motorcycles 36 15 12 8
Buses 0 700 0 420
Carpools (1) 2147 1456 1176 652
Vanpools 20 30 10 20
Single Occ. (2) — 8113 — 2803Violators 43 — 18 —
TOTAL 2246 10314 1216 3903
RATES
HOV Lane occupancy rate
2.0 persons/veh 2.0 persons/veh
Mixed Flow occupancy rate
1.2 persons/veh 1.2 persons/veh
Overall occupancy (incl. buses)
1.3 persons/veh 1.4 persons/veh
Violation rate(HOV Lane)
(3)
3.8 % 3.0 %
NOTES: (1) Two or more occupants per vehicle.
(2) Mixed flow lanes only.
(3) Violation rate = no. of violators in HOV lane x 100%
Total no. of vehicles in HOV lane
(4) HOV lane in operation from 5:00 to 9:00 A.M.
(5) Observations conducted 05/23/06 at Blossom Hill Road train Station
(4)
(5)
District 4, Year 2006 Annual HOV Lane Report Page 115

SANTA CLARA-85 Violation HistoryAlmaden Expressway to Route 101 (So. San Jose) Southbound
DATEPERIOD
MONITOREDTOTAL HOVL
VOLUMEVIOLATION
RATE
A.M. PEAK Year 2006 - - -Year 2005 - - -Year 2004 - - -Year 2003 - - -Wed Apr 24, 2002 6:00 - 9:00 AM 675 0.3%
Wed May 2, 2001 6:00 - 9:00 AM 595 1.7%
Wed May 3, 2000 6:00 - 9:00 AM 635 7.1%
Wed Feb 3, 1999 6:00 - 9:00 AM 739 0.0%
Tue May 19, 1998 6:00 - 9:00 AM 602 0.0%
Thu Dec 4, 1997 6:00 - 9:00 AM 282 12.8%
Tue May 21, 1996 6:00 - 9:00 AM 324 13.0%
Tue Sept 26, 1995 7:00 - 9:00 AM 240 8.8%
P.M. PEAK Thu Apr 20, 2006 3:00 - 6:00 PM 1547 3.4%
Thu Sep 29, 2005 3:00 - 6:00 PM 1601 0.9%
Thu Oct 14, 2004 3:00 - 6:00 PM 2050 0.2%
Thu Jun 5, 2003 3:00 - 6:00 PM 1652 0.6%
Thu May 2, 2002 3:00 - 6:00 PM 1981 3.8%
Wed Oct 3, 2001 3:00 - 6:00 PM 2418 0.2%
Wed Oct 18, 2000 3:00 - 6:00 PM 2354 0.6%
Tue May 18, 1999 3:00 - 6:00 PM 2112 2.5%
Thu Dec 3, 1998 3:00 - 6:00 PM 4447 0.0%
Thu Oct 16, 1997 3:00 - 6:00 PM 1754 3.6%
Thu Sep 19, 1996 3:00 - 6:00 PM 960 5.4%
Thu Oct 5, 1995 3:00 - 6:00 PM 960 5.4%
NOTES: (a) Morning period of operation from 5:00 to 9:00 AM.
(b) Evening period of operation from 3:00 to 7:00 PM.
(c) Data was not collected in 2006 for off-peak direction
District 4, Year 2006 Annual HOV Lane Report Page 116

SANTA CLARA-85 Violation HistoryRoute 101 (So. San Jose) to Almaden Expressway Northbound
DATEPERIOD
MONITOREDTOTAL HOVL
VOLUMEVIOLATION
RATE
A.M. PEAK Tue May 23, 2006 6:00 - 9:00 AM 1131 3.8%
Thu Oct 13, 2005 6:00 - 9:00 AM 960 2.4%
Tue Nov 30, 2004 6:00 - 9:00 AM 1044 0.0%
Thu Oct 23, 2003 7:00 - 9:00 AM 1035 0.0%
Tue Mar 12, 2002 6:00 - 9:00 AM 939 2.6%
Thu Apr 12, 2001 6:00 - 9:00 AM 1678 7.3%
Thu Oct 5, 2000 7:00 - 9:00 AM 1222 5.2%
Tue Oct 5, 1999 6:00 - 9:00 AM 1669 1.1%
Wed Mar 25, 1998 6:00 - 9:00 AM 1482 0.4%
Thu Mar 6, 1997 6:30 - 9:00 AM 1019 7.7%
Thu Jun 13, 1996 6:00 - 9:00 AM 1151 8.4%
Thu Sept 21, 1995 7:00 - 9:00 AM 981 2.5%
Thu Dec 8, 1994 7:00 - 9:00 AM 618 3.7%
P.M. PEAK Year 2006 - - -Year 2005 - - -Year 2004 - - -Year 2003 - - -Wed Apr 24, 2002 3:00 - 6:00 PM 976 5.0%
Tue Oct 9, 2001 3:00 - 6:00 PM 814 8.6%
Wed May 3, 2000 3:00 - 6:00 PM 784 5.6%
Thu Nov 17, 1999 3:00 - 5:30 PM 826 6.5%
Thu May 7, 1998 3:00 - 6:00 PM 1062 10.1%
Tue Oct 30, 1997 3:00 - 6:00 PM 1245 0.2%
Wed Mar 20, 1996 3:00 - 6:00 PM 907 9.0%
Tue Sept 19, 1995 3:00 - 6:00 PM 717 8.9%
Tue Dec 20, 1994 3:00 - 5:00 PM 557 16.5%
NOTES: (a) Morning period of operation from 5:00 to 9:00 AM.
(b) Evening period of operation from 3:00 to 7:00 PM.
(c) Data was not collected in 2006 for off-peak direction
District 4, Year 2006 Annual HOV Lane Report Page 117

SANTA CLARA-87 Northbound - A.M.S/O Taylor Ave to Route 101 I/C Typical data for 2006
PEAK PERIOD PEAK HOUR6:00 - 9:00 AM 8:00 - 9:00 AM
VEHICLES HOV LaneMixed Flow
Lanes HOV LaneMixed Flow
Lanes
Motorcycles 62 15 26 8
Buses 3 10 1 1
Carpools (1) 438 187 128 59
Vanpools 0 2 0 1
Hybrid/Single Occ. (2) 20 8446 7 3276Violators 9 — 2 —
TOTAL 532 8660 164 3345
PERSONS HOV LaneMixed Flow
Lanes HOV LaneMixed Flow
Lanes
Motorcycles 62 15 26 8
Buses 105 350 35 35
Carpools (1) 900 389 265 122
Vanpools 0 20 0 10
Hybrid/Single Occ. (2) 20 8446 7 3276Violators 9 — 2 —
TOTAL 1096 9220 335 3451
RATES
HOV Lane occupancy rate
2.1 persons/veh 2.0 persons/veh
Mixed Flow occupancy rate
1.1 persons/veh 1.0 persons/veh
Overall occupancy (incl. buses)
1.1 persons/veh 1.1 persons/veh
Violation rate(HOV Lane)
(3)
1.7 % 1.2 %
NOTES: (1) Two or more occupants per vehicle.
(2) Hybrid HOV lane only/Single Occupancy mixed flow lanes only.
(3) Violation rate = no. of violators in HOV lane x 100%
Total no. of vehicles in HOV lane
(4) HOV lane in operation from 5:00 to 9:00 A.M.
(5) Observations conducted 09/21/06 at Taylor Avenue I/C
(4)
(5)
District 4, Year 2006 Annual HOV Lane Report Page 118

SANTA CLARA-87 Violation HistoryS/O of Taylor Avenue to Route 101 I/C Northbound
DATEPERIOD
MONITOREDTOTAL HOVL
VOLUMEVIOLATION
RATE
A.M. PEAK Thu Sep 21, 2006 6:00 - 9:00 AM 532 1.7%
Tue Nov 8, 2005 6:00 - 9:00 AM 494 3.2%
P.M. PEAK Year 2006 - - -Year 2005 - - -
NOTES: (a) Morning period of operation from 5:00 to 9:00 AM.
(b) Evening period of operation from 3:00 to 7:00 PM.
(c) Data was not collected in 2006 for off-peak direction
District 4, Year 2006 Annual HOV Lane Report Page 119

SANTA CLARA-101 Southbound - A.M.SM/SCL County Line to Ellis Street Typical data for 2006
PEAK PERIOD PEAK HOUR6:00 - 9:00 AM 8:00 - 9:00 AM
VEHICLES HOV LaneMixed Flow
Lanes HOV LaneMixed Flow
Lanes
Motorcycles 42 7 21 3
Buses 16 5 10 3
Carpools (1) 1180 436 460 189
Vanpools 2 6 2 4
Hybrid/Single Occ. (2) 102 13262 63 5020Violators 10 — 10 —
TOTAL 1352 13716 566 5219
PERSONS HOV LaneMixed Flow
Lanes HOV LaneMixed Flow
Lanes
Motorcycles 42 7 21 3
Buses 560 175 350 105
Carpools (1) 2424 922 945 392
Vanpools 20 60 20 40
Hybrid/Single Occ. (2) 102 13262 63 5020Violators 10 — 10 —
TOTAL 3158 14426 1409 5560
RATES
HOV Lane occupancy rate
2.3 persons/veh 2.5 persons/veh
Mixed Flow occupancy rate
1.1 persons/veh 1.1 persons/veh
Overall occupancy (incl. buses)
1.2 persons/veh 1.2 persons/veh
Violation rate(HOV Lane)
(3)
0.7 % 1.8 %
NOTES: (1) Two or more occupants per vehicle.
(2) Hybrid HOV lane only/Single Occupancy mixed flow lanes only.
(3) Violation rate = no. of violators in HOV lane x 100%
Total no. of vehicles in HOV lane
(4) HOV lane in operation from 5:00 to 9:00 A.M.
(5) Observations conducted 12/05/06 at the San Antonio Road
(4)
(5)
District 4, Year 2006 Annual HOV Lane Report Page 120

SANTA CLARA-101 Southbound - P.M.SM/SCL County Line to Ellis Street Typical data for 2006
PEAK PERIOD PEAK HOUR3:00 - 6:00 PM 5:00 - 6:00 PM
VEHICLES HOV LaneMixed Flow
Lanes HOV LaneMixed Flow
Lanes
Motorcycles 52 9 22 3
Buses 6 4 3 0
Carpools (1) 2359 955 1036 206
Vanpools 15 5 4 0
Single Occ. (2) — 12915 — 4610Violators 77 — 32 —
TOTAL 2509 13888 1097 4819
PERSONS HOV LaneMixed Flow
Lanes HOV LaneMixed Flow
Lanes
Motorcycles 52 9 22 3
Buses 210 140 105 0
Carpools (1) 4874 2050 2141 451
Vanpools 150 50 40 0
Single Occ. (2) — 12915 — 4610Violators 77 — 32 —
TOTAL 5363 15164 2340 5064
RATES
HOV Lane occupancy rate
2.1 persons/veh 2.1 persons/veh
Mixed Flow occupancy rate
1.1 persons/veh 1.1 persons/veh
Overall occupancy (incl. buses)
1.3 persons/veh 1.3 persons/veh
Violation rate(HOV Lane)
(3)
3.1 % 2.9 %
NOTES: (1) Two or more occupants per vehicle.
(2) Mixed flow lanes only.
(3) Violation rate = no. of violators in HOV lane x 100%
Total no. of vehicles in HOV lane
(4) HOV lane in operation from 3:00 to 7:00 P.M.
(5) Observations conducted 04/26/06 at the San Antonio Road
(4)
(5)
District 4, Year 2006 Annual HOV Lane Report Page 121

SANTA CLARA-101 Northbound - A.M.Ellis Street to SM/SCL County Line Typical data for 2006
PEAK PERIOD PEAK HOUR6:00 - 9:00 AM 7:00 - 8:00 AM
VEHICLES HOV LaneMixed Flow
Lanes HOV LaneMixed Flow
Lanes
Motorcycles 89 28 25 10
Buses 0 6 0 2
Carpools (1) 2018 335 683 141
Vanpools 4 9 1 4
Hybrid/Single Occ. (2) 158 14218 47 5127Violators 312 — 80 —
TOTAL 2581 14596 836 5284
PERSONS HOV LaneMixed Flow
Lanes HOV LaneMixed Flow
Lanes
Motorcycles 89 28 25 10
Buses 0 210 0 70
Carpools (1) 4253 709 1440 293
Vanpools 40 90 10 40
Hybrid/Single Occ. (2) 158 14218 47 5127Violators 312 — 80 —
TOTAL 4852 15255 1602 5540
RATES
HOV Lane occupancy rate
1.9 persons/veh 1.9 persons/veh
Mixed Flow occupancy rate
1.0 persons/veh 1.0 persons/veh
Overall occupancy (incl. buses)
1.2 persons/veh 1.2 persons/veh
Violation rate(HOV Lane)
(3)
12.1 % 9.6 %
NOTES: (1) Two or more occupants per vehicle.
(2) Hybrid HOV Lane only/Single Occupancy mixed flow lanes only.
(3) Violation rate = no. of violators in HOV lane x 100%
Total no. of vehicles in HOV lane
(4) HOV lane in operation from 5:00 to 9:00 A.M.
(5) Observations conducted 06/01/06 at the San Antonio Road I/C
(4)
(5)
District 4, Year 2006 Annual HOV Lane Report Page 122

SANTA CLARA-101 Northbound - P.M.Ellis Street to SM/SCL County Line Typical data for 2006
PEAK PERIOD PEAK HOUR3:00 - 6:00 PM 4:00 - 5:00 PM
VEHICLES HOV LaneMixed Flow
Lanes HOV LaneMixed Flow
Lanes
Motorcycles 43 6 18 3
Buses 2 9 0 2
Carpools (1) 1938 680 660 246
Vanpools 8 6 2 2
Hybrid/Single Occ. (2) 96 14148 45 4710Violators 3 — 3 —
TOTAL 2090 14849 728 4963
PERSONS HOV LaneMixed Flow
Lanes HOV LaneMixed Flow
Lanes
Motorcycles 43 6 18 3
Buses 70 315 0 70
Carpools (1) 3957 1468 1352 533
Vanpools 80 60 20 20
Hybrid/Single Occ. (2) 96 14148 45 4710Violators 3 — 3 —
TOTAL 4249 15997 1438 5336
RATES
HOV Lane occupancy rate
2.0 persons/veh 2.0 persons/veh
Mixed Flow occupancy rate
1.1 persons/veh 1.1 persons/veh
Overall occupancy (incl. buses)
1.2 persons/veh 1.2 persons/veh
Violation rate(HOV Lane)
(3)
0.1 % 0.4 %
NOTES: (1) Two or more occupants per vehicle.
(2) Hybrid HOV lane only/Single Occupancy mixed flow lanes only.
(3) Violation rate = no. of violators in HOV lane x 100%
Total no. of vehicles in HOV lane
(4) HOV lane in operation from 3:00 to 7:00 P.M.
(5) Observations conducted 12/05/06 at the San Antonio Road I/C
(4)
(5)
District 4, Year 2006 Annual HOV Lane Report Page 123

SANTA CLARA-101 Violation HistorySM/SCL County Line to Ellis Street Southbound
DATEPERIOD
MONITOREDTOTAL HOVL
VOLUMEVIOLATION
RATE
A.M. PEAK Tue Dec 5, 2006 6:00 - 9:00 AM 1352 0.7%
Thu Sep 15, 2005 6:00 - 9:00 AM 1654 0.5%
Wed Nov 17, 2004 6:00 - 9:00 AM 1762 0.3%
Thu Oct 30, 2003 6:00 - 9:00 AM 1970 6.6%
Wed May 15, 2002 6:00 - 9:00 AM 1949 6.6%
Wed Mar 21, 2001 6:00 - 9:00 AM 2710 0.8%
Wed Sep 13, 2000 6:00 - 9:00 AM 2823 10.5%
Wed Apr 28, 1999 6:00 - 9:00 AM 2817 3.3%
Thu Mar 12, 1998 6:00 - 9:00 AM 2885 0.6%
Tue Dec 2, 1997 6:00 - 9:00 AM 2773 2.1%
Thu Apr 25, 1996 6:30 - 9:00 AM 3742 1.5%
Thu Jun 8, 1995 6:00 - 9:00 AM 2973 1.6%
Thu May 5, 1994 6:00 - 9:00 AM 2684 4.8%
Thu Jun 24, 1993 6:00 - 9:00 AM 1629 8.0%
P.M. PEAK Wed Apr 26, 2006 3:00 - 6:00 PM 2509 3.1%
Wed Mar 30, 2005 3:00 - 6:00 PM 3001 3.6%
Wed Oct 27, 2004 3:00 - 6:00 PM 2420 0.3%
Tue Oct 28, 2003 3:00 - 5:45 PM 2608 1.4%
Tue May 14, 2002 3:00 - 6:00 PM 2119 0.7%
Wed Oct 24, 2001 3:00 - 6:00 PM 2935 4.4%
Thu Mar 25, 1999 3:00 - 6:00 PM 3037 1.2%
Thu Mar 25, 1999 3:00 - 6:00 PM 3037 1.2%
Tue Mar 17, 1998 3:00 - 6:00 PM 2406 0.7%
Wed Oct 29, 1997 3:00 - 6:00 PM 2666 0.0%
Wed Oct 2 1996 3:00 - 6:00 PM 2836 0.6%
Wed Oct 4 1995 3:00 - 6:00 PM 2591 3.9%
Thu Apr 21, 1994 3:00 - 7:00 PM 4979 14.7%
Wed May 12, 1993 3:00 - 6:00 PM 1995 13.4%
NOTES: (a) Morning period of operation from 5:00 to 9:00 AM.
(b) Evening period of operation from 3:00 to 7:00 PM.
District 4, Year 2006 Annual HOV Lane Report Page 124

SANTA CLARA-101 Violation HistoryEllis Street to SM/SCL County Line Northbound
DATEPERIOD
MONITOREDTOTAL HOVL
VOLUMEVIOLATION
RATE
A.M. PEAK Thu Jun 1, 2006 6:00 - 9:00 AM 2581 12.1%
Thu Sep 22, 2005 6:00 - 9:00 AM 2494 4.5%
Tue Nov 2, 2004 6:00 - 9:00 AM 1641 0.3%
Thu May 22, 2003 6:00 - 9:00 AM 2132 5.8%
Wed Sept 25, 2002 6:45 - 9:00 AM 1479 2.4%
Thu Oct 4, 2001 6:00 - 9:00 AM 1942 6.0%
Thu May 18, 2000 6:00 - 9:00 AM 2047 5.1%
Thu Nov 18, 1999 6:30 - 9:00 AM 1745 2.5%
Thu Mar 26, 1998 6:00 - 9:00 AM 1986 0.1%
Tue Dec 2, 1997 7:00 - 9:00 AM 1720 3.8%
Wed Jun 12, 1996 6:00 - 9:00 AM 3249 0.7%
Thu May 4, 1995 6:00 - 9:00 AM 2070 5.9%
Thu Apr 21, 1994 6:00 - 9:00 AM 3114 3.5%
Wed May 12, 1993 6:00 - 9:00 AM 1509 7.7%
P.M. PEAK Tue Dec 5, 2006 3:00 - 6:00 PM 2090 0.1%
Wed Oct 5, 2005 3:00 - 6:00 PM 1656 0.8%
Thu Dec 2, 2004 3:00 - 5:00 PM 1369 2.8%
Tue Jun 3, 2003 3:00 - 6:00 PM 2635 7.2%
Thu Jun 6, 2002 3:00 - 6:00 PM 3064 2.1%
Wed Oct 17, 2001 3:00 - 6:00 PM 2523 3.2%
Tue Nov 7, 2000 3:00 - 6:00 PM 3032 4.6%
Tue Apr 27, 1999 3:00 - 6:00 PM 3034 1.5%
Wed Mar 11, 1998 3:00 - 6:00 PM 2464 1.3%
Thu Apr 24, 1997 3:00 - 6:00 PM 3693 0.2%
Tue Nov 12, 1996 3:00 - 6:00 PM 3151 0.1%
Wed Mar 15, 1995 3:00 - 6:00 PM 4260 3.4%
Wed Sep 28, 1994 3:00 - 6:00 PM 4122 2.4%
Thu Jun 3, 1993 3:00 - 6:00 PM 2831 7.5%
NOTES: (a) Morning period of operation from 5:00 to 9:00 AM.(b) Evening period of operation from 3:00 to 7:00 PM.
District 4, Year 2006 Annual HOV Lane Report Page 125
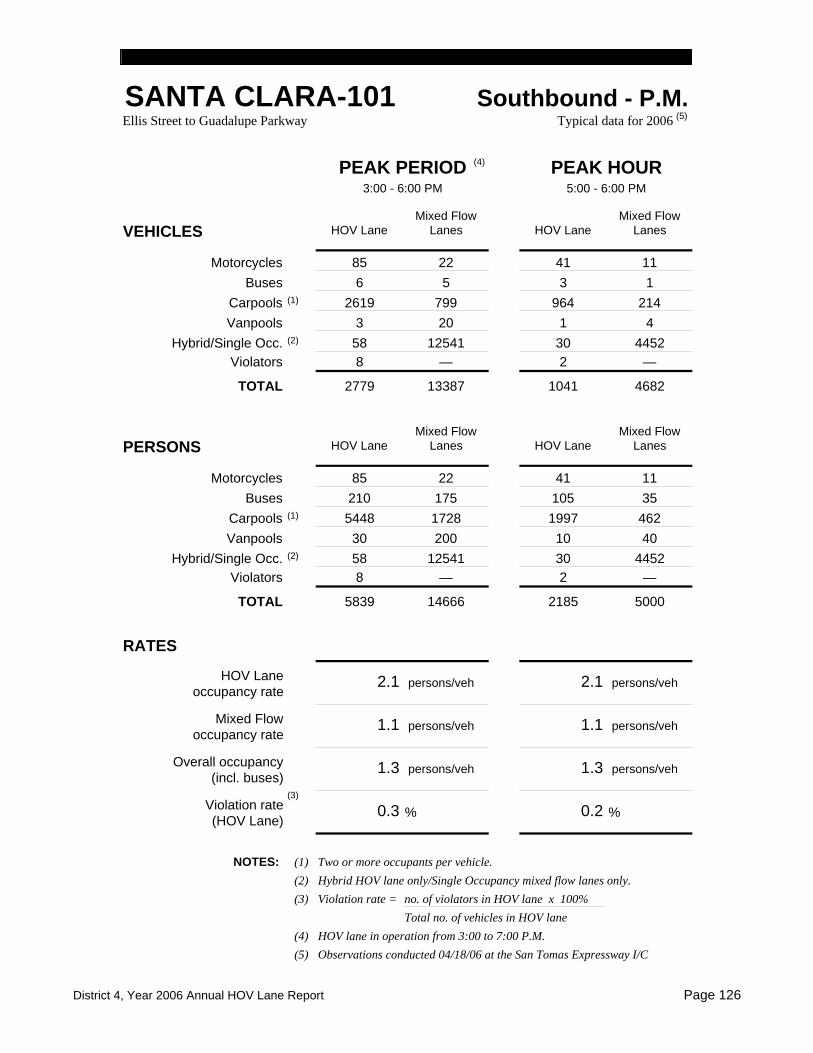
SANTA CLARA-101 Southbound - P.M.Ellis Street to Guadalupe Parkway Typical data for 2006
PEAK PERIOD PEAK HOUR3:00 - 6:00 PM 5:00 - 6:00 PM
VEHICLES HOV LaneMixed Flow
Lanes HOV LaneMixed Flow
Lanes
Motorcycles 85 22 41 11
Buses 6 5 3 1
Carpools (1) 2619 799 964 214
Vanpools 3 20 1 4
Hybrid/Single Occ. (2) 58 12541 30 4452Violators 8 — 2 —
TOTAL 2779 13387 1041 4682
PERSONS HOV LaneMixed Flow
Lanes HOV LaneMixed Flow
Lanes
Motorcycles 85 22 41 11
Buses 210 175 105 35
Carpools (1) 5448 1728 1997 462
Vanpools 30 200 10 40
Hybrid/Single Occ. (2) 58 12541 30 4452Violators 8 — 2 —
TOTAL 5839 14666 2185 5000
RATES
HOV Lane occupancy rate
2.1 persons/veh 2.1 persons/veh
Mixed Flow occupancy rate
1.1 persons/veh 1.1 persons/veh
Overall occupancy (incl. buses)
1.3 persons/veh 1.3 persons/veh
Violation rate(HOV Lane)
(3)
0.3 % 0.2 %
NOTES: (1) Two or more occupants per vehicle.
(2) Hybrid HOV lane only/Single Occupancy mixed flow lanes only.
(3) Violation rate = no. of violators in HOV lane x 100%
Total no. of vehicles in HOV lane
(4) HOV lane in operation from 3:00 to 7:00 P.M.
(5) Observations conducted 04/18/06 at the San Tomas Expressway I/C
(4)
(5)
District 4, Year 2006 Annual HOV Lane Report Page 126

SANTA CLARA-101 Northbound - A.M.Guadalupe Parkway to Ellis Street Typical data for 2006
PEAK PERIOD PEAK HOUR6:00 - 9:00 AM 7:00 - 8:00 AM
VEHICLES HOV LaneMixed Flow
Lanes HOV LaneMixed Flow
Lanes
Motorcycles 26 19 11 8
Buses 5 3 3 1
Carpools (1) 1686 477 662 262
Vanpools 9 1 3 0
Hybrid/Single Occ. (2) 73 12983 26 4798Violators 12 — — —
TOTAL 1811 13483 705 5069
PERSONS HOV LaneMixed Flow
Lanes HOV LaneMixed Flow
Lanes
Motorcycles 26 19 11 8
Buses 175 105 105 35
Carpools (1) 3457 1031 1363 563
Vanpools 90 10 30 0
Hybrid/Single Occ. (2) 73 12983 26 4798Violators 12 — — —
TOTAL 3833 14148 1535 5404
RATES
HOV Lane occupancy rate
2.1 persons/veh 2.2 persons/veh
Mixed Flow occupancy rate
1.0 persons/veh 1.1 persons/veh
Overall occupancy (incl. buses)
1.2 persons/veh 1.2 persons/veh
Violation rate(HOV Lane)
(3)
0.7 % 0.0 %
NOTES: (1) Two or more occupants per vehicle.
(2) Hybrid HOV lane only/Single Occupancy mixed flow lanes only.
(3) Violation rate = no. of violators in HOV lane x 100%
Total no. of vehicles in HOV lane
(4) HOV lane in operation from 5:00 to 9:00 A.M.
(5) Observations conducted 11/14/06 at the Fair Oaks Avenue I/C
(4)
(5)
District 4, Year 2006 Annual HOV Lane Report Page 127

SANTA CLARA-101 Violation HistoryEllis Street to Guadalupe Parkway Southbound
DATEPERIOD
MONITOREDTOTAL HOVL
VOLUMEVIOLATION
RATE
A.M. PEAK Year 2006 - - -Year 2005 - - -Year 2004 - - -Year 2003 - - -Tue Dec 3, 2002 6:00 - 9:00 AM 668 2.2%
Tue Jun 5, 2001 6:00 - 9:00 AM 765 2.1%
Thu Apr 20, 2000 6:00 - 9:00 AM 916 3.8%
Thur Oct 21, 1999 7:00 - 9:00 AM 739 1.8%
Thu Apr 9, 1998 6:00 - 9:00 AM 1163 4.3%
Wed Dec 3, 1997 6:00 - 9:00 AM 1272 8.6%
Thu Nov 7, 1996 6:45 - 9:00 AM 2212 1.1%
Wed Oct 4, 1995 7:00 - 9:00 AM 1057 4.5%
Wed Nov 2, 1994 6:30 - 9:00 AM 1124 20.7%
Tue Jun 15, 1993 6:00 - 9:00 AM 664 2.9%
P.M. PEAK Tue Apr 18, 2006 3:00 - 6:00 PM 2779 0.3%
Wed Apr 27, 2005 3:00 - 6:00 PM 2964 0.3%
Tue Nov 16, 2004 3:00 - 5:30 PM 2190 0.4%
Thu May 29, 2003 3:00 - 6:00 PM 3454 3.6%
Thu Apr 11, 2002 3:00 - 6:00 PM 2912 1.2%
Thu Mar 29, 2001 3:00 - 6:00 PM 3903 3.1%
Wed Nov 15, 2000 3:00 - 5:30 PM 3077 2.7%
Wed Oct 20, 1999 3:00 - 6:00 PM 3954 2.3%
Thu May 14, 1998 4:00 - 6:30 PM 3124 0.2%
Tue Apr 22, 1997 3:00 - 6:00 PM 3268 1.0%
Wed May 22, 1996 3:00 - 6:00 PM 3832 1.3%
Thu Apr 20, 1995 3:00 - 7:00 PM 5831 1.5%
Wed Nov 2, 1994 3:00 - 5:15 PM 2698 9.5%
Wed Oct 6, 1993 3:00 - 6:00 PM 3056 7.0%
NOTES: (a) Morning period of operation from 5:00 to 9:00 AM.
(b) Evening period of operation from 3:00 to 7:00 PM.
(c) Data was not collected in 2006 for off-peak direction
District 4, Year 2006 Annual HOV Lane Report Page 128

SANTA CLARA-101 Violation HistoryGuadalupe Parkway to Ellis Street Northbound
DATEPERIOD
MONITOREDTOTAL HOVL
VOLUMEVIOLATION
RATE
A.M. PEAK Tue Nov 14, 2006 6:00 - 9:00 AM 1811 0.7%
Wed Oct 26, 2005 7:00 - 9:00 AM 1221 0.4%
Tue Nov 16, 2004 6:00 - 9:00 AM 1799 0.7%
Wed May 7, 2003 6:00 - 9:00 AM 2142 0.6%
Thu Apr 4, 2002 6:00 - 9:00 AM 1646 7.5%
Wed Sep 26, 2001 6:00 - 9:00 AM 1607 0.8%
Tue Apr 4, 2000 6:00 - 9:00 AM 1527 2.8%
Wed Oct 20, 1999 7:00 - 9:00 AM 1299 0.5%
Thu Oct 1, 1998 7:00 - 9:00 AM 1268 1.6%
Thu Nov 20, 1997 6:00 - 9:00 AM 1700 0.0%
Thu Sep 26, 1996 7:00 - 9:00 AM 1765 0.7%
Thu Oct 5, 1995 7:00 - 9:00 AM 1594 3.8%
Tue Nov 1, 1994 6:30 - 9:00 AM 1861 4.8%
Wed Oct 6, 1993 7:00 - 9:00 AM 977 14.4%
P.M. PEAK Year 2006 - - -Year 2005 - - -Year 2004 - - -Year 2003 - - -Wed May 22, 2002 3:00 - 6:00 PM 1487 3.8%
Wed May 10, 2000 3:00 - 6:00 PM 1684 0.3%
Tue Jun 8, 1999 3:00 - 6:00 PM 1765 2.2%
Thu May 21, 1998 3:00 - 6:00 PM 2066 4.5%
Thu Apr 10, 1997 3:00 - 6:00 PM 1563 1.5%
Tue May 21, 1996 3:00 - 6:00 PM 2126 4.2%
Tue Oct 17, 1995 3:00 - 6:00 PM 1910 6.0%
Tue Dec 6, 1994 3:00 - 5:00 PM 708 9.3%
Tue Jun 8, 1993 3:00 - 6:00 PM 1765 2.2%
NOTES: (a) Morning period of operation from 5:00 to 9:00 AM.
(b) Evening period of operation from 3:00 to 7:00 PM.
(c) Data was not collected in 2006 for off-peak direction
District 4, Year 2006 Annual HOV Lane Report Page 129

SANTA CLARA-101 Southbound - P.M.Guadalupe Parkway to Route 280/680 Typical data for 2006
PEAK PERIOD PEAK HOUR3:00 - 6:00 PM 5:00 - 6:00 PM
VEHICLES HOV LaneMixed Flow
Lanes HOV LaneMixed Flow
Lanes
Motorcycles 95 21 51 7
Buses 3 13 2 0
Carpools (1) 2067 909 758 192
Vanpools 5 7 1 2
Hybrid/Single Occ. (2) 44 11847 26 4051Violators 2 — 0 —
TOTAL 2216 12797 838 4252
PERSONS HOV LaneMixed Flow
Lanes HOV LaneMixed Flow
Lanes
Motorcycles 95 21 51 7
Buses 105 455 70 0
Carpools (1) 4254 1918 1567 414
Vanpools 50 70 10 20
Hybrid/Single Occ. (2) 44 11847 26 4051Violators 2 — 0 —
TOTAL 4550 14311 1724 4492
RATES
HOV Lane occupancy rate
2.1 persons/veh 2.1 persons/veh
Mixed Flow occupancy rate
1.1 persons/veh 1.1 persons/veh
Overall occupancy (incl. buses)
1.3 persons/veh 1.2 persons/veh
Violation rate(HOV Lane)
(3)
0.1 0.0 %
NOTES: (1) Two or more occupants per vehicle.
(2) Hybrid HOV Lane only/Single Occupancy mixed flow lanes only.
(3) Violation rate = no. of violators in HOV lane x 100%
Total no. of vehicles in HOV lane
(4) HOV lane in operation from 3:00 to 7:00 P.M.
(5) Observations conducted 05/09/06 at the McKee Road I/C
(4)
(5)
District 4, Year 2006 Annual HOV Lane Report Page130

SANTA CLARA-101 Northbound - A.M.Route 280/680 I/C to Guadalupe Parkway Typical data for 2006
PEAK PERIOD PEAK HOUR6:00 - 9:00 AM 7:00 - 8:00 AM
VEHICLES HOV LaneMixed Flow
Lanes HOV LaneMixed Flow
Lanes
Motorcycles 180 16 48 5
Buses 4 3 1 1
Carpools (1) 3053 600 1151 178
Vanpools 9 9 4 2
Hybrid/Single Occ. (2) 118 15937 37 5673Violators 10 — 4 —
TOTAL 3374 16565 1245 5859
PERSONS HOV LaneMixed Flow
Lanes HOV LaneMixed Flow
Lanes
Motorcycles 180 16 48 5
Buses 140 105 35 35
Carpools (1) 6305 1280 2387 388
Vanpools 90 90 40 20
Hybrid/Single Occ. (2) 118 15937 37 5673Violators 10 — 4 —
TOTAL 6843 17428 2551 6121
RATES
HOV Lane occupancy rate
2.0 persons/veh 2.0 persons/veh
Mixed Flow occupancy rate
1.1 persons/veh 1.0 persons/veh
Overall occupancy (incl. buses)
1.2 persons/veh 1.2 persons/veh
Violation rate(HOV Lane)
(3)
3.8 % 3.3 %
NOTES: (1) Two or more occupants per vehicle.
(2) Hybrids HOV Lane only/Single Occupancy mixed flow lanes only.
(3) Violation rate = no. of violators in HOV lane x 100%
Total no. of vehicles in HOV lane
(4) HOV lane in operation from 5:00 to 9:00 A.M.
(5) Observations conducted 05/16/06 at the McKee Road I/C
(4)
(5)
District 4, Year 2006 Annual HOV Lane Report Page 131

SANTA CLARA-101 Violation History Guadalupe Parkway to Route 280/680 I/C Southbound
DATEPERIOD
MONITOREDTOTAL HOVL
VOLUMEVIOLATION
RATE
A.M. PEAK Year 2006 - - -Year 2005 - - -Year 2004 - - -Year 2003 - - -Thu May 30, 2002 6:00 - 9:00 AM 339 3.5%
Thu Oct 18, 2001 6:00 - 9:00 AM 495 3.0%
Thu Jun 8, 2000 6:00 - 9:00 AM 485 11.8%
Wed Mar 24, 1999 6:00 - 9:00 AM 378 9.5%
Thu Apr 2, 1998 6:00 - 9:00 AM 436 6.7%
Wed Mar 5, 1997 6:30 - 9:00 AM 438 2.1%
Thu Oct 24, 1996 7:00 - 9:00 AM 550 0.4%
Wed Oct 18, 1995 7:00 - 9:00 AM 172 3.5%
Tue Nov 8, 1994 6:30 - 9:00 AM 422 18.5%
P.M. PEAK Tue May 9, 2006 3:00 - 6:00 PM 2216 0.1%
Wed Sep 21, 2005 3:00 - 6:00 PM 2452 0.2%
Tue Nov 9, 2004 3:00 - 5:30 PM 1947 0.7%
Thu Apr 3, 2003 3:00 - 6:00 PM 1860 0.5%
Thu Jun 13, 2002 3:00 - 6:00 PM 2342 1.3%
Tue Mar 27, 2001 3:00 - 6:00 PM 2840 2.6%
Thu May 11, 2000 3:00 - 6:00 PM 3049 1.7%
Tue Dec 14, 1999 3:00 - 5:30 PM 2418 0.4%
Thu Sep 17, 1998 3:00 - 6:00 PM 3499 2.5%
Tue Sept 23, 1997 3:00 - 6:00 PM 2965 0.5%
Wed Oct 23, 1996 3:00 - 6:00 PM 3230 0.3%
Wed Apr 19, 1995 3:00 - 7:00 PM 3957 2.9%
Thu Nov 3, 1994 3:00 - 5:15 PM 1856 1.5%
NOTES: (a) Morning period of operation from 5:00 to 9:00 AM.(b) Evening period of operation from 3:00 to 7:00 PM.(c) Data was not collected in 2006 for off-peak direction
District 4, Year 2006 Annual HOV Lane Report Page 132

SANTA CLARA-101 Violation HistoryRoute 280/680 I/C to Guadalupe Parkway Northbound
DATEPERIOD
MONITOREDTOTAL HOVL
VOLUMEVIOLATION
RATE
A.M. PEAK Tue May 16, 2006 6:00 - 9:00 AM 3374 3.8%
Wed Mar 30, 2005 6:00 - 9:00 AM 4026 6.8%
Thu Dec 2, 2004 6:00 - 9:00 AM 3561 0.2%
Thu Jun 12, 2003 6:00 - 9:00 AM 3794 2.6%
Thu Apr 11, 2002 6:30 - 9:00 AM 3438 2.7%
Thu May 11, 2000 6:00 - 9:00 AM 4839 2.4%
Wed Apr 14, 1999 6:00 - 9:00 AM 4717 2.9%
Thu Dec 10, 1998 6:00 - 9:00 AM 4589 1.8%
Wed Sep 24, 1997 7:00 - 9:00 AM 2994 2.4%
Wed May 22, 1996 6:00 - 9:00 AM 5386 0.8%
Thu Nov 2, 1995 6:00 - 9:00 AM 5061 0.5%
Thu Nov 3, 1994 6:30 - 9:00 AM 3777 2.1%
P.M. PEAK Year 2006 - - -Year 2005 - - -Year 2004 - - -Year 2003 - - -Thu May 23, 2002 3:00 - 6:00 PM 1264 1.6%
Thu Apr 27, 2000 3:00 - 6:00 PM 1318 3.7%
Tue Dec 7, 1999 3:00 - 5:00 PM 1314 4.3%
Wed Nov 4, 1998 3:00 - 5:30 PM 1393 0.7%
Wed Apr 30, 1997 3:00 - 6:00 PM 2171 0.2%
Thu Nov 14, 1996 3:00 - 6:00 PM 1743 0.0%
Wed Oct 11, 1995 3:00 - 6:00 PM 1370 6.0%
Tue Nov 8, 1994 3:00 - 5:00 PM 1272 3.6%
NOTES: (a) Morning period of operation from 5:00 to 9:00 AM.
(b) Evening period of operation from 3:00 to 7:00 PM.
(c) Data was not collected in 2006 for off-peak direction
District 4, Year 2006 Annual HOV Lane Report Page 133

SANTA CLARA-101 Southbound - P.M.Route 280/680 I/C to Bernal Road Typical data for 2006
PEAK PERIOD PEAK HOUR3:00 - 6:00 PM 5:00 - 6:00 PM
VEHICLES HOV LaneMixed Flow
Lanes HOV LaneMixed Flow
Lanes
Motorcycles 86 22 36 7
Buses 6 10 2 1
Carpools (1) 1960 1554 661 522
Vanpools 5 6 0 1
Single Occ. (2) — 11239 — 3898Violators 70 — 24 —
TOTAL 2127 12831 723 4429
PERSONS HOV LaneMixed Flow
Lanes HOV LaneMixed Flow
Lanes
Motorcycles 86 22 36 7
Buses 210 350 70 35
Carpools (1) 4098 3297 1386 1110
Vanpools 50 60 0 10
Single Occ. (2) — 11239 — 3898Violators 70 — 24 —
TOTAL 4514 14968 1516 5060
RATES
HOV Lane occupancy rate
2.1 persons/veh 2.1 persons/veh
Mixed Flow occupancy rate
1.2 persons/veh 1.1 persons/veh
Overall occupancy (incl. buses)
1.3 persons/veh 1.3 persons/veh
Violation rate(HOV Lane)
(3)
3.3 % 3.3 %
NOTES: (1) Two or more occupants per vehicle.
(2) Mixed flow lanes only.
(3) Violation rate = no. of violators in HOV lane x 100%
Total no. of vehicles in HOV lane
(4) HOV lane in operation from 3:00 to 7:00 P.M.
(5) Observations conducted 05/03/06 at the Hellyer Avenue I/C
(4)
(5)
District 4, Year 2006 Annual HOV Lane Report Page 134

SANTA CLARA-101 Northbound - A.M.Bernal Road to Route 280/680 I/C Typical data for 2006
PEAK PERIOD PEAK HOUR6:00 - 9:00 AM 7:00 - 8:00 AM
VEHICLES HOV LaneMixed Flow
Lanes HOV LaneMixed Flow
Lanes
Motorcycles 75 5 24 2
Buses 3 10 1 1
Carpools (1) 1887 511 666 189
Vanpools 9 12 2 3
Single Occ. (2) — 13146 — 4631Violators 45 — 17 —
TOTAL 2019 13684 710 4826
PERSONS HOV LaneMixed Flow
Lanes HOV LaneMixed Flow
Lanes
Motorcycles 75 5 24 2
Buses 105 350 35 35
Carpools (1) 3897 1110 1391 424
Vanpools 90 120 20 30
Single Occ. (2) — 13146 — 4631Violators 45 — 17 —
TOTAL 4212 14731 1487 5122
RATES
HOV Lane occupancy rate
2.1 persons/veh 2.1 persons/veh
Mixed Flow occupancy rate
1.1 persons/veh 1.1 persons/veh
Overall occupancy (incl. buses)
1.2 persons/veh 1.2 persons/veh
Violation rate(HOV Lane)
(3)
2.2 % 2.4 %
NOTES: (1) Two or more occupants per vehicle.
(2) Mixed flow lanes only.
(3) Violation rate = no. of violators in HOV lane x 100%
Total no. of vehicles in HOV lane
(4) HOV lane in operation from 5:00 to 9:00 A.M.
(5) Observations conducted 04/18/06 at the Hellyer Avenue I/C
(4)
(5)
District 4, Year 2006 Annual HOV Lane Report Page 135

SANTA CLARA-101 Violation History Route 280/680 I/C to Bernal Road Southbound
DATEPERIOD
MONITOREDTOTAL HOVL
VOLUMEVIOLATION
RATE
A.M. PEAK Year 2006 - - -Year 2005 - - -Year 2004 - - -Year 2003 - - -Thu Jun 6, 2002 6:00 - 9:00 AM 730 5.6%
Thu Apr 19, 2001 6:00 - 9:00 AM 746 5.4%
Wed Oct 4, 2000 7:00 - 9:00 AM 413 5.6%
Wed Nov 3, 1999 6:00 - 9:00 AM 660 0.9%
Thur May 6, 1998 6:00 - 9:00 AM 576 0.7%
Thu May 22, 1997 6:30 - 9:00 AM 473 6.1%
Thu Oct 17, 1996 7:00 - 9:00 AM 538 0.7%
Tue Oct 24, 1995 7:00 - 9:00 AM 538 6.5%
Tue Nov 15, 1994 6:45 - 9:00 AM 490 11.4%
Wed May 3, 2006 3:00 - 6:00 PM 2127 3.3%
P.M. PEAK Thu Mar 10, 2005 3:00 - 6:00 PM 2225 0.6%
Tue Nov 23, 2004 3:00 - 5:30 PM 1747 0.3%
Thu May 1, 2003 3:00 - 6:00 PM 2204 1.6%
Tue Mar 19, 2002 3:00 - 6:00 PM 1496 2.0%
Wed May 16, 2001 3:00 - 6:00 PM 1732 0.8%
Tue Sep 19, 2000 3:00 - 6:00 PM 1898 0.7%
Tue Mar 16, 1999 3:00 - 6:30 PM 702 4.6%
Wed Apr 22,1998 3:00 - 6:00 PM 1498 0.1%
Tue Oct 7, 1997 3:00 - 6:00 PM 1843 0.1%
Wed Dec 11,1996 3:00 - 5:30 PM 1426 3.6%
Wed May 3, 1995 3:00 - 7:00 PM 2181 11.0%
Wed Nov 30, 1994 3:00 - 5:00 PM 1116 9.2%
NOTES: (a) Morning period of operation from 5:00 to 9:00 AM.
(b) Evening period of operation from 3:00 to 7:00 PM.
(c) Data was not collected in 2006 for off-peak direction
District 4, Year 2006 Annual HOV Lane Report Page 136

SANTA CLARA-101 Violation HistoryBernal Road to Route 280/680 I/C Northbound
DATEPERIOD
MONITOREDTOTAL HOVL
VOLUMEVIOLATION
RATE
A.M. PEAK Tue Apr 18, 2006 6:00 - 9:00 AM 2019 2.2%
Tue Apr 19, 2005 6:00 - 9:00 AM 2366 0.8%
Tue Dec 14, 2004 6:00 - 9:00 AM 1668 1.3%
Tue Jun 3, 2003 6:00 - 9:00 AM 2620 1.0%
Thu May 16, 2002 6:00 - 9:00 AM 1859 2.7%
Tue Apr 3, 2001 6:00 - 9:00 AM 2258 3.5%
Thu Nov 30, 2000 7:00 - 9:00 AM 1503 2.3%
Tue Dec 7, 1999 6:30 - 9:00 AM 2550 4.9%
Tue Dec 8, 1998 6:00 - 9:00 AM 2663 4.8%
Wed May 21, 1997 6:30 - 9:00 AM 1932 0.9%
Thu Jun 6, 1996 6:00 - 9:00 AM 2225 0.2%
Tue Apr 18, 1995 6:00 - 9:00 AM 1614 0.9%
Wed Nov 9, 1994 6:45 - 9:00 AM 1668 1.6%
P.M. PEAK Year 2006 - - -Year 2005 - - -Year 2004 - - -Year 2003 - - -Wed Mar 27, 2002 3:00 - 6:00 PM 1156 3.1%
Tue May 15, 2001 3:00 - 6:00 PM 1155 5.4%
Wed Apr 5, 2000 3:00 - 6:00 PM 1169 5.9%
Wed May 26, 1999 3:00 - 6:00 PM 1255 5.1%
Thu Apr 23, 1998 3:00 - 6:00 PM 995 4.6%
Wed Mar 12, 1997 3:00 - 6:00 PM 803 0.4%
Wed Dec 4, 1996 3:00 - 5:30 PM 777 3.3%
Thu Oct 19, 1995 3:00 - 6:00 PM 794 2.3%Wed Dec 7, 1994 3:00 - 5:00 PM 1156 3.4%
NOTES: (a) Morning period of operation from 5:00 to 9:00 AM.
(b) Evening period of operation from 3:00 to 7:00 PM.
(c) Data was not collected in 2006 for off-peak direction
District 4, Year 2006 Annual HOV Lane Report Page 137

SANTA CLARA-101 Southbound - P.M.Bernal Road to Cochrane Road Typical data for 2006
PEAK PERIOD PEAK HOUR3:00 - 6:00 PM 5:00 - 6:00 PM
VEHICLES HOV LaneMixed Flow
Lanes HOV LaneMixed Flow
Lanes
Motorcycles 72 26 27 6
Buses 0 2 0 1
Carpools (1) 1554 856 654 277
Vanpools 6 7 4 1
Single Occ. (2) — 10935 — 3819Violators 20 — 8 —
TOTAL 1652 11826 693 4104
PERSONS HOV LaneMixed Flow
Lanes HOV LaneMixed Flow
Lanes
Motorcycles 72 26 27 6
Buses 0 70 0 35
Carpools (1) 3200 1843 1348 604
Vanpools 60 70 40 10
Single Occ. (2) — 10935 — 3819Violators 20 — 8 —
TOTAL 3352 12944 1423 4474
RATES
HOV Lane occupancy rate
2.0 persons/veh 2.1 persons/veh
Mixed Flow occupancy rate
1.1 persons/veh 1.1 persons/veh
Overall occupancy (incl. buses)
1.2 persons/veh 1.2 persons/veh
Violation rate(HOV Lane)
(3)
1.2 % 1.2 %
NOTES: (1) Two or more occupants per vehicle.
(2) Mixed flow lanes only.
(3) Violation rate = no. of violators in HOV lane x 100%
Total no. of vehicles in HOV lane
(4) HOV lane in operation from 3:00 to 7:00 P.M.
(5) Observations conducted 04/19/06 at Coyote Creek Golf Drive I/C
(4)
(5)
District 4, Year 2006 Annual HOV Lane Report Page 138

SANTA CLARA-101 Northbound - A.M.Cochrane Road to Bernal Road Typical data for 2006
PEAK PERIOD PEAK HOUR6:00 - 9:00 AM 6:00 - 7:00 AM
VEHICLES HOV LaneMixed Flow
Lanes HOV LaneMixed Flow
Lanes
Motorcycles 22 4 4 0
Buses 7 2 2 1
Carpools (1) 2609 394 1067 0
Vanpools 0 1 0 1
Hybrid/Single Occ. (2) 134 12171 15 4207Violators 27 — 3 —
TOTAL 2799 12572 1091 4209
PERSONS HOV LaneMixed Flow
Lanes HOV LaneMixed Flow
Lanes
Motorcycles 22 4 4 0
Buses 245 70 70 35
Carpools (1) 5314 824 2144 0
Vanpools 0 10 0 10
Hybrid/Single Occ. (2) 134 12171 15 4207Violators 27 — 3 —
TOTAL 5742 13079 2236 4252
RATES
HOV Lane occupancy rate
2.1 persons/veh 2.0 persons/veh
Mixed Flow occupancy rate
1.0 persons/veh 1.0 persons/veh
Overall occupancy (incl. buses)
1.2 persons/veh 1.2 persons/veh
Violation rate(HOV Lane)
(3)
1.0 % 0.3 %
NOTES: (1) Two or more occupants per vehicle.
(2) Hybrid HOV Lane/Single Occupancy mixed flow lanes only
(3) Violation rate = no. of violators in HOV lane x 100%
Total no. of vehicles in HOV lane
(4) HOV lane in operation from 5:00 to 9:00 A.M.
(5) Observations conducted 12/19/06 at Coyote Creek Golf Drive I/C
(4)
(5)
District 4, Year 2006 Annual HOV Lane Report Page 139

SANTA CLARA-101 Violation HistoryBernal Road to Cochrane Road Southbound
DATEPERIOD
MONITOREDTOTAL HOVL
VOLUMEVIOLATION
RATE
A.M. PEAK Year 2006 - - -Year 2005 - - -Year 2004 - - -Year 2003 - - -
P.M. PEAK Wed Apr 19, 2006 3:00 - 6:00 PM 1652 1.2%
Tue Sep 13, 2005 3:00 - 6:00 PM 2102 0.1%
Wed Nov 3, 2004 3:00 - 5:30 PM 1493 1.5%
Wed May 21, 2003 3:00 - 6:00 PM 1775 1.1%
NOTES: (a) Morning period of operation from 5:00 to 9:00 AM.
(b) Evening period of operation from 3:00 to 7:00 PM.
(c) Data was not collected in 2006 for off-peak period
District 4, Year 2006 Annual HOV Lane Report Page 140

SANTA CLARA-101 Violation HistoryCochrane Road to Bernal Road Northbound
DATEPERIOD
MONITOREDTOTAL HOVL
VOLUMEVIOLATION
RATE
A.M. PEAK Tue Dec 19, 2006 6:00 - 9:00 AM 2799 1.0%
Wed Dec 14, 2005 6:00 - 9:00 AM 1827 1.4%
Tue Nov 9, 2004 6:00 - 9:00 AM 2120 0.2%
Tue Oct 28, 2003 6:00 - 9:00 AM 1720 0.0%
P.M. PEAK Year 2006 - - -Year 2005 - - -Year 2004 - - -Year 2003 - - -
NOTES: (a) Morning period of operation from 5:00 to 9:00 AM.
(b) Evening period of operation from 3:00 to 7:00 PM.
(c) Data was not collected in 2006 for off-peak direction
District 4, Year 2006 Annual HOV Lane Report Page 141

SANTA CLARA-237 Westbound - A.M.Route 880/237 I/C to Mathilda Avenue Typical data for 2006
PEAK PERIOD PEAK HOUR6:00 - 9:00 AM 8:00 - 9:00 AM
VEHICLES HOV LaneMixed Flow
Lanes HOV LaneMixed Flow
Lanes
Motorcycles 74 10 42 4
Buses 1 18 0 1
Carpools (1) 1450 199 593 44
Vanpools 9 4 1 0
Hybrid/Single Occ. (2) 92 12320 74 4269Violators 5 — 4 —
TOTAL 1631 12551 714 4318
PERSONS HOV LaneMixed Flow
Lanes HOV LaneMixed Flow
Lanes
Motorcycles 74 10 42 4
Buses 35 630 0 35
Carpools (1) 3001 432 1228 100
Vanpools 90 40 10 0
Hybrid/Single Occ. (2) 92 12320 74 4269Violators 5 — 4 —
TOTAL 3297 13432 1358 4408
RATES
HOV Lane occupancy rate
2.0 persons/veh 1.9 persons/veh
Mixed Flow occupancy rate
1.1 persons/veh 1.0 persons/veh
Overall occupancy (incl. buses)
1.2 persons/veh 1.1 persons/veh
Violation rate(HOV Lane)
(3)
0.3 % 0.6 %
NOTES: (1) Two or more occupants per vehicle.
(2) Hybrid HOV lane only/Single Occupancy mixed flow lanes only.
(3) Violation rate = no. of violators in HOV lane x 100%
Total no. of vehicles in HOV lane
(4) HOV lane in operation from 5:00 to 9:00 A.M.
(5) Observations conducted 04/26/06 at the Zanker Road I/C
(4)
(5)
District 4, Year 2006 Annual HOV Lane Report Page 142

SANTA CLARA-237 Westbound - P.M.Route 880/237 I/C to Mathilda Avenue Typical data for 2006
PEAK PERIOD PEAK HOUR3:00 - 6:00 PM 5:00 - 6:00 PM
VEHICLES HOV LaneMixed Flow
Lanes HOV LaneMixed Flow
Lanes
Motorcycles 1 4 1 0
Buses 3 27 2 8
Carpools (1) 958 694 464 172
Vanpools 3 1 3 0
Single Occ. (2) — 9338 — 3677Violators 43 — 24 —
TOTAL 1008 10064 494 3857
PERSONS HOV LaneMixed Flow
Lanes HOV LaneMixed Flow
Lanes
Motorcycles 1 4 1 0
Buses 105 945 70 280
Carpools (1) 1953 1438 953 354
Vanpools 30 10 30 0
Single Occ. (2) — 9338 — 3677Violators 43 — 24 —
TOTAL 2132 11735 1078 4311
RATES
HOV Lane occupancy rate
2.1 persons/veh 2.2 persons/veh
Mixed Flow occupancy rate
1.2 persons/veh 1.1 persons/veh
Overall occupancy (incl. buses)
1.3 persons/veh 1.2 persons/veh
Violation rate(HOV Lane)
(3)
4.3 % 4.9 %
NOTES: (1) Two or more occupants per vehicle.
(2) Mixed flow lanes only.
(3) Violation rate = no. of violators in HOV lane x 100%
Total no. of vehicles in HOV lane
(4) HOV lane in operation from 3:00 to 7:00 P.M.
(5) Observations conducted 03/28/06 at the Zanker Road I/C
(4)
(5)
District 4, Year 2006 Annual HOV Lane Report Page 143

SANTA CLARA-237 Eastbound - A.M.Mathilda Avenue to Route 880/237 I/C Typical data for 2006
PEAK PERIOD PEAK HOUR6:00 - 9:00 AM 8:00 - 9:00 AM
VEHICLES HOV LaneMixed Flow
Lanes HOV LaneMixed Flow
Lanes
Motorcycles 46 11 25 5
Buses 1 3 0 1
Carpools (1) 583 348 269 81
Vanpools 1 2 0 1
Single Occ. (2) — 8221 — 3636Violators 79 — 30 —
TOTAL 710 8585 324 3724
PERSONS HOV LaneMixed Flow
Lanes HOV LaneMixed Flow
Lanes
Motorcycles 46 11 25 5
Buses 35 105 0 35
Carpools (1) 1241 744 556 174
Vanpools 10 20 0 10
Single Occ. (2) — 8221 — 3636Violators 79 — 30 —
TOTAL 1411 9101 611 3860
RATES
HOV Lane occupancy rate
2.0 persons/veh 1.9 persons/veh
Mixed Flow occupancy rate
1.1 persons/veh 1.0 persons/veh
Overall occupancy (incl. buses)
1.1 persons/veh 1.1 persons/veh
Violation rate(HOV Lane)
(3)
11.1 % 9.3 %
NOTES: (1) Two or more occupants per vehicle.
(2) Mixed flow lanes only.
(3) Violation rate = no. of violators in HOV lane x 100%
Total no. of vehicles in HOV lane
(4) HOV lane in operation from 5:00 to 9:00 A.M.
(5) Observations conducted 05/09/06 at the Zanker Road I/C
(4)
(5)
District 4, Year 2006 Annual HOV Lane Report Page 144

SANTA CLARA-237 Eastbound - P.M.Mathilda Avenue to Route 880/237 I/C Typical data for 2006
PEAK PERIOD PEAK HOUR3:00 - 6:00 PM 5:00 - 6:00 PM
VEHICLES HOV LaneMixed Flow
Lanes HOV LaneMixed Flow
Lanes
Motorcycles 114 22 55 3
Buses 3 7 1 1
Carpools (1) 1481 726 662 149
Vanpools 2 1 0 0
Single Occ. (2) — 11555 — 4039Violators 71 — 29 —
TOTAL 1671 12311 747 4192
PERSONS HOV LaneMixed Flow
Lanes HOV LaneMixed Flow
Lanes
Motorcycles 114 22 55 3
Buses 105 245 35 35
Carpools (1) 3103 1645 1388 345
Vanpools 20 10 0 0
Single Occ. (2) — 11555 — 4039Violators 71 — 29 —
TOTAL 3413 13477 1507 4422
RATES
HOV Lane occupancy rate
2.0 persons/veh 2.0 persons/veh
Mixed Flow occupancy rate
1.1 persons/veh 1.1 persons/veh
Overall occupancy (incl. buses)
1.2 persons/veh 1.2 persons/veh
Violation rate(HOV Lane)
(3)
4.2 % 3.9 %
NOTES: (1) Two or more occupants per vehicle.
(2) Mixed flow lanes only.
(3) Violation rate = no. of violators in HOV lane x 100%
Total no. of vehicles in HOV lane
(4) HOV lane in operation from 3:00 to 7:00 P.M.
(5) Observations conducted 05/11/06 at the Zanker Road I/C
(4)
(5)
District 4, Year 2006 Annual HOV Lane Report Page 145

SANTA CLARA-237 Violation HistoryRoute 880/237 I/C to Mathilda Avenue Westbound
DATEPERIOD
MONITOREDTOTAL HOVL
VOLUMEVIOLATION
RATE
A.M. PEAK Wed Apr 26, 2006 6:00 - 9:00 AM 1631 0.3%
Wed Nov 2, 2005 6:00 - 9:00 AM 1666 3.1%
Thu Nov 18, 2004 6:00 - 9:00 AM 1407 0.9%
Thu May 29, 2003 6:00 - 9:00 AM 1644 0.0%
Thu May 2, 2002 6:00 - 9:00 AM 1577 3.7%
Thu May 3, 2001 6:00 - 9:00 AM 1916 5.3%
Wed Nov 15, 2000 6:00 - 9:00 AM 2055 2.7%
Tue Nov 9, 1999 6:30 - 9:00 AM 1917 1.9%
Tue Sep 29, 1998 7:00 - 9:00 AM 1770 3.3%
Tue May 13, 1997 6:30 - 9:00 AM 2015 2.8%
Thu May 30,1996 6:00 - 9:00 AM 3274 0.5%
Wed Oct 25, 1995 7:00 - 9:00 AM 1308 2.6%
P.M. PEAK Tue Mar 28, 2006 3:00 - 6:00 PM 1008 4.3%
Tue Oct 25, 2005 3:00 - 6:00 PM 908 2.1%
Thu Dec 9, 2004 3:00 - 5:15 PM 493 10.8%
Thu Oct 9, 2003 3:00 - 6:00 PM 698 5.6%
Wed May 15, 2002 3:00 - 6:00 PM 773 2.2%
Wed May 30, 2001 3:00 - 6:00 PM 1102 3.1%
Wed Sep 13, 2000 3:00 - 6:00 PM 1155 2.5%
Wed Mar 3, 1999 3:00 - 7:00 PM 1260 0.6%
Tue Sep 29, 1998 3:00 - 6:00 PM 1658 2.8%
Tue Oct 14, 1997 3:00 - 6:00 PM 1866 0.8%
Wed Jun 12,1996 3:00 - 6:00 PM 1593 0.9%
Tue Oct 24, 1995 3:00 - 6:00 PM 1072 7.3%
NOTES: (a) Morning period of operation from 5:00 to 9:00 AM.
(b) Evening period of operation from 3:00 to 7:00 PM.
District 4, Year 2006 Annual HOV Lane Report Page 146

SANTA CLARA-237 Violation HistoryMathilda Avenue to Route 880/237 I/C Eastbound
DATEPERIOD
MONITOREDTOTAL HOVL
VOLUMEVIOLATION
RATE
A.M. PEAK Tue May 9, 2006 6:00 - 9:00 AM 710 11.1%
Year 2005 - - -Year 2004 - - -Year 2003 - - -Thu Oct 31, 2002 7:00 - 9:00 AM 561 12.1%
Thu Mar 29, 2001 6:00 - 9:00 AM 759 15.0%
Thu May 25, 2000 6:00 - 9:00 AM 536 5.8%
Thu Oct 14, 1999 6:00 - 9:00 AM 769 11.4%
Thu Oct 8, 1998 7:00 - 9:00 AM 750 3.2%
Wed Oct 29, 1997 6:30 - 9:00 AM 723 0.1%
Thu Nov 14, 1996 6:30 - 9:00 AM 845 7.5%
Thu Oct 26, 1995 7:00 - 9:00 AM 495 2.2%
P.M. PEAK Thu May 11, 2006 3:00 - 6:00 PM 1671 4.2%
Thu Oct 6, 2005 3:00 - 6:00 PM 1746 13.3%
Wed Dec 1, 2004 3:00 - 5:00 PM 1324 0.8%
Tue Oct 14, 2003 3:00 - 6:00 PM 1296 0.9%
Wed May 1, 2002 3:00 - 6:00 PM 1396 1.9%
Thu May 3, 2001 3:00 - 6:00 PM 1255 2.1%
Tue Mar 21, 2000 4:00 - 7:00 PM 2181 0.4%
Thu Nov 18, 1999 3:00 - 6:00 PM 2535 3.0%
Thu Oct 15, 1998 3:00 - 6:00 PM 2418 5.0%
Tue Oct 28, 1997 3:00 - 6:00 PM 2835 2.7%
Thu Oct 17, 1996 3:00 - 6:00 PM 3682 0.3%
Wed Oct 25, 1995 3:00 - 6:00 PM 1827 5.8%
NOTES: (a) Morning period of operation from 5:00 to 9:00 AM.
(b) Evening period of operation from 3:00 to 7:00 PM.
District 4, Year 2006 Annual HOV Lane Report Page 147

SANTA CLARA-280 Southbound - P.M.Magdalena Avenue to Leland Avenue Typical data for 2006
PEAK PERIOD PEAK HOUR3:00 - 6:00 PM 5:00 - 6:00 PM
VEHICLES HOV LaneMixed Flow
Lanes HOV LaneMixed Flow
Lanes
Motorcycles 47 27 23 6
Buses 3 18 1 3
Carpools (1) 1455 1205 673 222
Vanpools 9 10 3 2
Single Occ. (2) — 14074 — 4982Violators 55 — 24 —
TOTAL 1569 15334 724 5215
PERSONS HOV LaneMixed Flow
Lanes HOV LaneMixed Flow
Lanes
Motorcycles 47 27 23 6
Buses 105 630 35 105
Carpools (1) 3026 2612 1393 487
Vanpools 90 100 30 20
Single Occ. (2) — 14074 — 4982Violators 55 — 24 —
TOTAL 3323 17443 1505 5600
RATES
HOV Lane occupancy rate
2.1 persons/veh 2.1 persons/veh
Mixed Flow occupancy rate
1.1 persons/veh 1.1 persons/veh
Overall occupancy (incl. buses)
1.2 persons/veh 1.2 persons/veh
Violation rate(HOV Lane)
(3)
3.5 % 3.3 %
NOTES: (1) Two or more occupants per vehicle.
(2) Mixed flow lanes only.
(3) Violation rate = no. of violators in HOV lane x 100%
Total no. of vehicles in HOV lane
(4) HOV lane in operation from 3:00 to 7:00 P.M.
(5) Observations conducted 04/27/06 at the Wolfe Road I/C
(4)
(5)
District 4, Year 2006 Annual HOV Lane Report Page 148

SANTA CLARA-280 Northbound - A.M.Leland Avenue to Magdalena Avenue Typical data for 2006
PEAK PERIOD PEAK HOUR6:00 - 9:00 AM 7:00 - 8:00 AM
VEHICLES HOV LaneMixed Flow
Lanes HOV LaneMixed Flow
Lanes
Motorcycles 15 3 7 0
Buses 3 5 1 4
Carpools (1) 1744 201 766 99
Vanpools 12 4 5 1
Hybrid/Single Occ. (2) 68 14422 35 5500Violators 1 — — —
TOTAL 1843 14635 814 5604
PERSONS HOV LaneMixed Flow
Lanes HOV LaneMixed Flow
Lanes
Motorcycles 15 3 7 0
Buses 105 175 35 140
Carpools (1) 3530 434 1555 217
Vanpools 120 40 50 10
Hybrid/Single Occ. (2) 68 14422 35 5500Violators 1 — — —
TOTAL 3839 15074 1682 5867
RATES
HOV Lane occupancy rate
2.1 persons/veh 2.1 persons/veh
Mixed Flow occupancy rate
1.0 persons/veh 1.0 persons/veh
Overall occupancy (incl. buses)
1.1 persons/veh 1.2 persons/veh
Violation rate(HOV Lane)
(3)
0.1 % 0.0 %
NOTES: (1) Two or more occupants per vehicle.
(2) Hybrid HOV lane only/ Single occupancy mixed flow lanes only.
(3) Violation rate = no. of violators in HOV lane x 100%
Total no. of vehicles in HOV lane
(4) HOV lane in operation from 5:00 to 9:00 A.M.
(5) Observations conducted 12/14/06 at the Wolfe Road I/C
(4)
(5)
District 4, Year 2006 Annual HOV Lane Report Page149

SANTA CLARA-280 Violation HistoryMagdalena Avenue to Leland Avenue Southbound
DATEPERIOD
MONITOREDTOTAL HOVL
VOLUMEVIOLATION
RATE
A.M. PEAK Year 2006 - - -Year 2005 - - -Year 2004 - - -Year 2003 - - -Thu Apr 18, 2002 6:30 - 9:00 AM 372 4.6%
Thu Apr 5, 2001 6:00 - 9:00 AM 524 2.7%
Thu Apr 13, 2000 6:00 - 9:00 AM 474 9.3%
Tue Apr 20, 1999 6:00 - 9:00 AM 608 0.3%
Thu Jun 4, 1998 6:00 - 9:00 AM 781 0.1%
Wed Oct 22, 1997 7:00 - 9:00 AM 592 0.0%
Wed Oct 9, 1996 7:00 - 9:00 AM 1087 1.4%
Wed Nov 1, 1995 6:30 - 9:00 AM 566 4.9%
Wed Nov 30, 1994 7:00 - 9:00 AM 989 1.6%
P.M. PEAK Thu Apr 27, 2006 3:00 - 6:00 PM 1569 3.5%
Tue Dec 13, 2005 3:00 - 6:00 PM 2469 0.0%
Tue Nov 2, 2004 3:00 - 5:30 PM 1817 2.3%
Thu Jun 12, 2003 3:00 - 5:30 PM 1756 1.0%
Thu Sep 19, 2002 3:00 - 6:00 PM 1933 0.6%
Thu Oct 11, 2001 3:00 - 6:00 PM 2221 1.0%
Wed Oct 11, 2000 3:00 - 6:00 PM 2325 5.0%
Wed Apr 21, 1999 3:00 - 6:00 PM 2058 4.9%
Tue Dec 8, 1998 3:00 - 6:00 PM 2236 1.0%
Tue Oct 21, 1997 3:00 - 6:00 PM 2050 2.8%
Tue Jun 11, 1996 3:00 - 6:00 PM 1716 4.3%
Tue May 16, 1995 3:00 - 6:00 PM 1996 9.3%Wed Nov 16, 1994 3:00 - 5:00 PM 858 2.3%
NOTES: (a) Morning period of operation from 5:00 to 9:00 AM.
(b) Evening period of operation from 3:00 to 7:00 PM.
(c) Data was not collected in 2006 for off-peak direction
District 4, Year 2006 Annual HOV Lane Report Page 150

SANTA CLARA-280 Violation HistoryLeland Avenue to Magdalena Avenue Northbound
DATEPERIOD
MONITOREDTOTAL HOVL
VOLUMEVIOLATION
RATE
A.M. PEAK Thu Dec 14, 2006 6:00 - 9:00 AM 1843 0.1%
Tue Mar 8, 2005 6:00 - 9:00 AM 1602 0.8%
Thu Oct 7, 2004 6:00 - 9:00 AM 2213 2.4%
Thu Jun 5, 2003 6:00 - 9:00 AM 1558 7.4%
Tue May 21, 2002 6:00 - 9:00 AM 1355 5.4%
Tue Nov 6, 2001 6:00 - 9:00 AM 1253 1.6%
Wed Mar 29, 2000 6:00 - 9:00 AM 2086 1.7%
Thu Nov 4, 1999 6:30 - 9:00 AM 1884 0.3%
Wed Dec 9, 1998 6:00 - 9:00 AM 2235 3.7%
Wed Apr 23, 1997 6:00 - 9:00 AM 1851 0.10%
Tue Jun 11, 1996 6:00 - 9:00 AM 1762 1.40%
Thu May 18, 1995 6:00 - 9:00 AM 2510 1.50%Wed Nov 16, 1994 6:45 - 9:00 AM 1124 2.9%
P.M. PEAK Year 2006 - - -Year 2005 - - -Year 2004 - - -Year 2003 - - -Tue May 28, 2002 3:00 - 6:00 PM 1081 1.5%
Wed Apr 4, 2001 3:00 - 6:00 PM 1160 0.9%
Thu Apr 13, 2000 3:00 - 6:00 PM 1106 5.4%
Tue Apr 20, 1999 3:00 - 6:00 PM 938 0.2%
Tue Sep 15, 1998 3:00 - 6:00 PM 955 5.3%
Wed, Apr 23, 1997 3:00 - 6:00 PM 1975 0.5%
Thu Dec 12, 1996 3:00 - 5:30 PM 1205 4.2%
Wed May 17, 1995 3:00 - 6:00 PM 1095 13.2%Thu Nov 17, 1994 3:00 - 5:00 PM 584 9.1%
NOTES: (a) Morning period of operation from 5:00 to 9:00 AM.
(b) Evening period of operation from 3:00 to 7:00 PM.
(c) Data was not collected in 2006 for off-peak direction
District 4, Year 2006 Annual HOV Lane Report Page 151

SAN FRANCISCO-80 Eastbound-P.M.RAMP HOV BYPASS LANES Typical data for 2006Sterling Street on-ramp to SFOBB
PEAK PERIOD PEAK HOUR3:30 - 7:00 PM 4:00 - 5:00 PM
VEHICLES HOV Lane SOV Lane HOV Lane SOV Lane
Motorcycles 109 — 33 —
Buses 17 — 7 —
Carpool (1) 1647 — 499 —
2 - seaters (2) 296 — 121 —
Hybrid 195 — 46 —
Vanpools 82 — 49 —
Trucks 130 — 49 —Violators 740 — 200 —
TOTAL 3216 N/A 1004 N/A
PERSONS HOV Lane SOV Lane HOV Lane SOV Lane
Motorcycles 109 — 33 —
Buses 595 — 245 —
Carpool (1) 5106 — 1547 —
2 - seaters (2) 592 — 242 —
Hybrid 195 — 46 —
Vanpools 820 — 490 —
Trucks 130 — 49 —Violators 1087 — 311 —
TOTAL 8634 N/A 2963 N/A
RATES
HOV Lane occupancy rate
2.7 persons/veh 3.0 persons/veh
Violation rate(HOV Lane)
(3)
23.0 % 19.9 %
NOTES: (1) 3 or more persons per vehicle.
(2) 2 - seater vehicles with 2 persons.
(3) Violation rate = no. of violators in HOV lane x 100%
Total no. of vehicles in HOV lane
(4) HOV lane in operation from 3:30 to 7:00 PM.
(5) Observations conducted 9/12/06 at the Sterling Street on-ramp
(4)
(5)
District 4, Year 2006 Annual HOV Lane Report Page 152
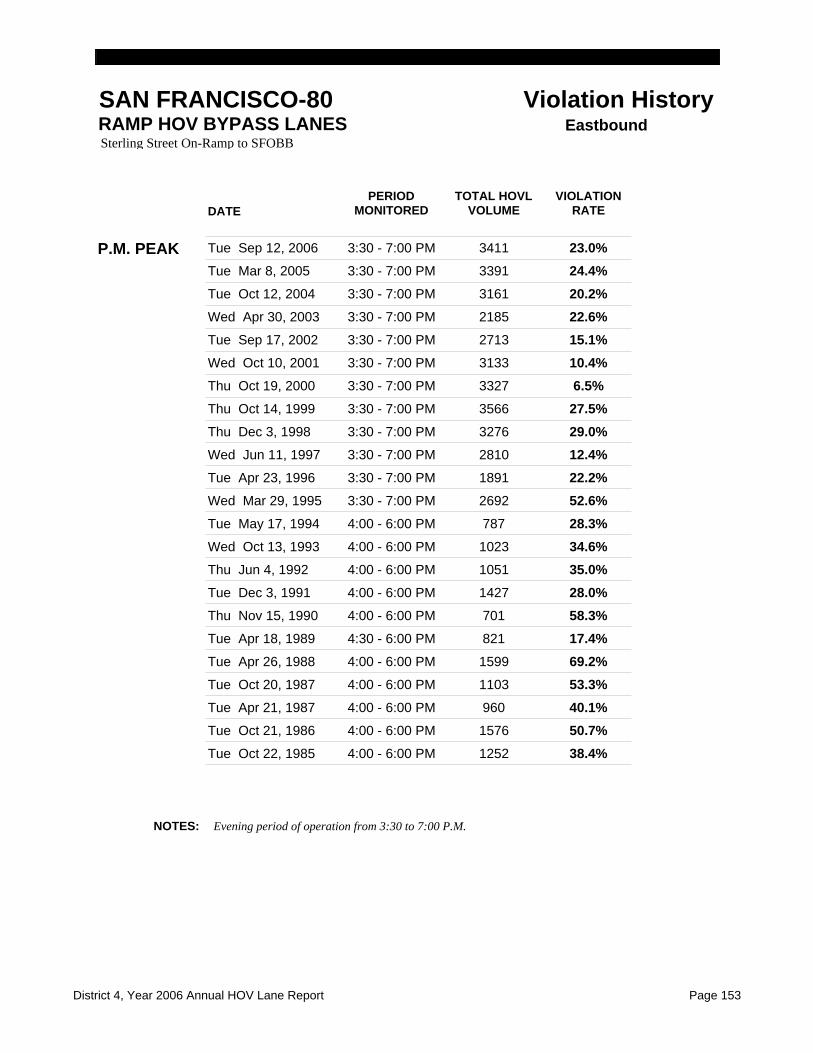
SAN FRANCISCO-80 Violation HistoryRAMP HOV BYPASS LANES Eastbound Sterling Street On-Ramp to SFOBB
DATEPERIOD
MONITOREDTOTAL HOVL
VOLUMEVIOLATION
RATE
P.M. PEAK Tue Sep 12, 2006 3:30 - 7:00 PM 3411 23.0%
Tue Mar 8, 2005 3:30 - 7:00 PM 3391 24.4%
Tue Oct 12, 2004 3:30 - 7:00 PM 3161 20.2%
Wed Apr 30, 2003 3:30 - 7:00 PM 2185 22.6%
Tue Sep 17, 2002 3:30 - 7:00 PM 2713 15.1%
Wed Oct 10, 2001 3:30 - 7:00 PM 3133 10.4%
Thu Oct 19, 2000 3:30 - 7:00 PM 3327 6.5%
Thu Oct 14, 1999 3:30 - 7:00 PM 3566 27.5%
Thu Dec 3, 1998 3:30 - 7:00 PM 3276 29.0%
Wed Jun 11, 1997 3:30 - 7:00 PM 2810 12.4%
Tue Apr 23, 1996 3:30 - 7:00 PM 1891 22.2%
Wed Mar 29, 1995 3:30 - 7:00 PM 2692 52.6%
Tue May 17, 1994 4:00 - 6:00 PM 787 28.3%
Wed Oct 13, 1993 4:00 - 6:00 PM 1023 34.6%
Thu Jun 4, 1992 4:00 - 6:00 PM 1051 35.0%
Tue Dec 3, 1991 4:00 - 6:00 PM 1427 28.0%
Thu Nov 15, 1990 4:00 - 6:00 PM 701 58.3%
Tue Apr 18, 1989 4:30 - 6:00 PM 821 17.4%
Tue Apr 26, 1988 4:00 - 6:00 PM 1599 69.2%
Tue Oct 20, 1987 4:00 - 6:00 PM 1103 53.3%
Tue Apr 21, 1987 4:00 - 6:00 PM 960 40.1%
Tue Oct 21, 1986 4:00 - 6:00 PM 1576 50.7%
Tue Oct 22, 1985 4:00 - 6:00 PM 1252 38.4%
NOTES: Evening period of operation from 3:30 to 7:00 P.M.
District 4, Year 2006 Annual HOV Lane Report Page 153

SAN MATEO-101 Southbound - A.M. Whipple Avenue to SM/SCL County Line Typical data for 2006
PEAK PERIOD PEAK HOUR6:00 - 9:00 AM 8:00 - 9:00 AM
VEHICLES HOV LaneMixed Flow
Lanes HOV LaneMixed Flow
Lanes
Motorcycles 101 31 20 4
Buses 18 24 9 9
Carpools (1) 1009 705 405 307
Vanpools 8 5 3 1
Hybrid/Single Occ. (2) 92 12769 44 4772Violators 10 — — —
TOTAL 1238 13534 481 5093
PERSONS HOV LaneMixed Flow
Lanes HOV LaneMixed Flow
Lanes
Motorcycles 101 31 20 4
Buses 630 840 315 315
Carpools (1) 2146 1505 872 649
Vanpools 80 50 30 10
Hybrid/Single Occ. (2) 92 12769 44 4772Violators 10 — — —
TOTAL 3059 15195 1281 5750
RATES
HOV Lane occupancy rate
2.5 persons/veh 2.7 persons/veh
Mixed Flow occupancy rate
1.1 persons/veh 1.1 persons/veh
Overall occupancy (incl. buses)
1.2 persons/veh 1.3 persons/veh
Violation rate(HOV Lane)
(3)
0.8 % 0.0 %
NOTES: (1) Two or more occupants per vehicle.
(2) Hybrid HOV lane only/Single Occupancy mixed flow lanes only
(3) Violation rate = no. of violators in HOV lane x 100%
Total no. of vehicles in HOV lane
(4) HOV lane in operation from 5:00 to 9:00 A.M.
(5) Observations conducted 05/31/06 at the Woodside Road I/C
(4)
(5)
District 4, Year 2006 Annual HOV Lane Report Page 154

SAN MATEO-101 Southbound - P.M.Whipple Avenue to SM/SCL County Line Typical data for 2006
PEAK PERIOD PEAK HOUR3:00 - 6:00 PM 5:00 - 6:00 PM
VEHICLES HOV LaneMixed Flow
Lanes HOV LaneMixed Flow
Lanes
Motorcycles 45 32 19 10
Buses 0 40 0 7
Carpools (1) 1635 1975 624 574
Vanpools 6 11 2 1
Hybrid/Single Occ. (2) 60 15417 26 5281Violators 8 — — —
TOTAL 1754 17475 671 5873
PERSONS HOV LaneMixed Flow
Lanes HOV LaneMixed Flow
Lanes
Motorcycles 45 32 19 10
Buses 0 1400 0 245
Carpools (1) 3310 4220 1288 1242
Vanpools 60 110 20 10
Hybrid/Single Occ. (2) 60 15417 26 5281Violators 8 — — —
TOTAL 3483 21179 1353 6788
RATES
HOV Lane occupancy rate
2.0 persons/veh 2.0 persons/veh
Mixed Flow occupancy rate
1.2 persons/veh 1.2 persons/veh
Overall occupancy (incl. buses)
1.3 persons/veh 1.2 persons/veh
Violation rate(HOV Lane)
(3)
0.5 % 0.0 %
NOTES: (1) Two or more occupants per vehicle.
(2) Hybrid HOV lane only/Single Occupancy mixed flow lanes only.
(3) Violation rate = no. of violators in HOV lane x 100%
Total no. of vehicles in HOV lane
(4) HOV lane in operation from 3:00 to 7:00 P.M.
(5) Observations conducted 06/13/06 at the Woodside Road I/C
(4)
(5)
District 4, Year 2006 Annual HOV Lane Report Page 155

SAN MATEO-101 Northbound - A.M.SM/SCL County Line to Whipple Avenue Typical data for 2006
PEAK PERIOD PEAK HOUR6:00 - 9:00 AM 8:00 - 9:00 AM
VEHICLES HOV LaneMixed Flow
Lanes HOV LaneMixed Flow
Lanes
Motorcycles 24 14 17 8
Buses 1 28 1 8
Carpools (1) 1468 415 497 228
Vanpools 0 2 0 0
Hybrid/Single Occ. (2) 77 10362 45 3707Violators 3 — — —
TOTAL 1573 10821 560 3951
PERSONS HOV LaneMixed Flow
Lanes HOV LaneMixed Flow
Lanes
Motorcycles 24 14 17 8
Buses 35 980 35 280
Carpools (1) 3044 909 1048 492
Vanpools 0 20 0 0
Hybrid/Single Occ. (2) 77 10362 45 3707Violators 3 — — —
TOTAL 3183 12285 1145 4487
RATES
HOV Lane occupancy rate
2.0 persons/veh 2.0 persons/veh
Mixed Flow occupancy rate
1.1 persons/veh 1.1 persons/veh
Overall occupancy (incl. buses)
1.2 persons/veh 1.2 persons/veh
Violation rate(HOV Lane)
(3)
0.2 % 0.0 %
NOTES: (1) Two or more occupants per vehicle.
(2) Hybrid HOV lane only/Single Occupancy mixed flow lanes only.
(3) Violation rate = no. of violators in HOV lane x 100%
Total no. of vehicles in HOV lane
(4) HOV lane in operation from 5:00 to 9:00 A.M.
(5) Observations conducted 10/26/06 at the Woodside Road I/C
(4)
(5)
District 4, Year 2006 Annual HOV Lane Report Page 156

SAN MATEO-101 Northbound - P.M.SM/SCL County Line to Whipple Avenue Typical data for 2006
PEAK PERIOD PEAK HOUR3:00 - 6:00 PM 5:00 - 6:00 PM
VEHICLES HOV LaneMixed Flow
Lanes HOV LaneMixed Flow
Lanes
Motorcycles 60 7 21 2
Buses 12 20 5 1
Carpools (1) 2165 838 706 257
Vanpools 9 6 5 0
Hybrid/Single Occ. (2) 97 11122 41 4042Violators — — — —
TOTAL 2343 11993 778 4302
PERSONS HOV LaneMixed Flow
Lanes HOV LaneMixed Flow
Lanes
Motorcycles 60 7 21 2
Buses 420 700 175 35
Carpools (1) 4530 1887 1457 577
Vanpools 90 60 50 0
Hybrid/Single Occ. (2) 97 11122 41 4042Violators — — — —
TOTAL 5197 13776 1744 4656
RATES
HOV Lane occupancy rate
2.2 persons/veh 2.2 persons/veh
Mixed Flow occupancy rate
1.1 persons/veh 1.1 persons/veh
Overall occupancy (incl. buses)
1.3 persons/veh 1.3 persons/veh
Violation rate(HOV Lane)
(3)
0.0 % 0.0 %
NOTES: (1) Two or more occupants per vehicle.
(2) Hybrid HOV lane only/Single Occupancy mixed flow lanes only.
(3) Violation rate = no. of violators in HOV lane x 100%
Total no. of vehicles in HOV lane
(4) HOV lane in operation from 3:00 to 7:00 P.M.
(5) Observations conducted 06/01/06 at the Woodside Road I/C
(4)
(5)
District 4, Year 2006 Annual HOV Lane Report Page 157

SAN MATEO-101 Violation History Whipple Avenue to the SM/SCL County Line Southbound
DATEPERIOD
MONITOREDTOTAL HOVL
VOLUMEVIOLATION
RATE
A.M. PEAK Wed May 31, 2006 6:00 - 9:00 AM 1238 0.8%
Thu Mar 10, 2005 6:00 - 9:00 AM 1177 1.4%
Wed Dec 15, 2004 7:00 - 9:00 AM 1355 0.1%
Wed Apr 9, 2003 6:00 - 9:00 AM 1701 0.6%
Tue Mar 26, 2002 6:00 - 9:00 AM 1549 3.5%
Thu Mar 22, 2001 6:00 - 9:00 AM 1746 2.2%
Tue Apr 25, 2000 6:00 - 9:00 AM 1849 7.0%
Thu Dec 2, 1999 6:45 - 9:00 AM 1915 5.2%
Tue Mar 10, 1998 6:00 - 9:00 AM 2711 0.8%
Tue Sept 23, 1997 7:00 - 9:00 AM 1761 0.7%
Wed Mar 27, 1996 6:00 - 9:00 AM 1681 4.6%
Wed Jun 7, 1995 6:00 - 9:00 AM 1922 3.0%
P.M. PEAK Tue Jun 13, 2006 3:00 - 6:00 PM 1754 0.5%
Wed Sep 28, 2005 3:00 - 6:00 PM 1568 1.5%
Tue Oct 26, 2004 3:00 - 6:00 PM 1296 1.5%
Wed May 14, 2003 3:00 - 6:00 PM 1488 2.5%
Wed Oct 2, 2002 3:00 - 6:00 PM 1895 3.2%
Thu Nov 8, 2001 3:00 - 5:30 PM 1685 7.0%
Thu Oct 12, 2000 3:00 - 6:00 PM 2245 3.3%
Wed Dec 8, 1999 3:00 - 5:15 PM 1683 0.5%
Thu Dec 10, 1998 3:00 - 6:00 PM 2537 1.6%
Wed Nov 5, 1997 3:00 - 6:00 PM 2514 0.6%
Wed Mar 27,1996 3:00 - 6:00 PM 2836 1.9%
Tue Sept 26, 1995 3:00 - 6:00 PM 2505 2.0%
NOTES: (a) Morning period of operation from 5:00 to 9:00 AM.
(b) Evening period of operation from 3:00 to 7:00 PM.
District 4, Year 2006 Annual HOV Lane Report Page 158

SAN MATEO-101 Violation HistorySM/SCL County Line to Whipple Avenue Northbound
DATEPERIOD
MONITOREDTOTAL HOVL
VOLUMEVIOLATION
RATE
A.M. PEAK Thu Oct 26, 2006 6:00 - 9:00 AM 1573 0.2%
Wed Apr 6, 2005 6:00 - 9:00 AM 1409 0.5%
Wed Dec 1, 2004 6:00 - 9:00 AM 1337 0.7%
Thu Oct 9, 2003 7:00 - 9:00 AM 1031 1.5%
Tue Apr 9, 2002 6:45 - 9:00 AM 865 5.7%
Wed Oct 31, 2001 6:00 - 9:00 AM 1662 2.1%
Thu Oct 12, 2000 6:00 - 9:00 AM 2964 4.7%
Thu Apr 29, 1999 6:00 - 9:00 AM 2088 0.5%
Tue Oct 27, 1998 6:00 - 9:00 AM 1873 2.1%
Thu Sept 25, 1997 7:00 - 9:00 AM 1348 0.1%
Wed Jun 5, 1996 6:00 - 9:00 AM 1799 3.3%
Thu Jun 15, 1995 6:00 - 9:00 AM 2272 2.9%
P.M. PEAK Thu Jun 1, 2006 3:00 - 6:00 PM 2343 0.0%
Tue Oct 4, 2005 3:00 - 6:00 PM 2025 0.4%
Thu Oct 28, 2004 3:00 - 6:00 PM 1929 0.1%
Tue Apr 8, 2003 3:00 - 6:00 PM 2327 2.0%
Wed Jun 5, 2002 3:00 - 6:00 PM 1969 3.4%
Wed Nov 14, 2001 3:00 - 5:30 PM 1675 0.2%
Tue Sep 12, 2000 3:00 - 6:00 PM 2329 14.3%
Tue Oct 26, 1999 3:00 - 6:00 PM 2987 8.5%
Wed Dec 9, 1998 3:00 - 6:00 PM 2670 6.6%
Tue Apr 29, 1997 3:00 - 6:00 PM 2616 0.9%
Thu Sep 26, 1996 3:00 - 6:00 PM 2619 5.8%
Tue Jun 6, 1995 3:00 - 6:30 PM 2617 4.4%
NOTES: (a) Morning period of operation from 5:00 to 9:00 AM.
(b) Evening period of operation from 3:00 to 7:00 PM.
District 4, Year 2006 Annual HOV Lane Report Page 159

SOLANO-80 Eastbound - P.M.Carquinez Bridge Toll Plaza Typical data for 2006
PEAK PERIOD PEAK HOUR3:00 to 7:00 P.M. 5:00 to 6:00 P.M.
VEHICLES HOV LaneMixed Flow
Lanes HOV LaneMixed Flow
Lanes
Motorcycles 229 — 58 —
Buses (4) 30 — 10 —
Carpools (1) 1890 — 575 —
2 - seaters (2) 566 — 139 —
Hybrid 64 — 12 —
Vanpools 144 — 63 —Violators (HOV only) 362 — 56 —
TOTAL 3285 16926 913 4268
PERSONS HOV LaneMixed Flow
Lanes HOV LaneMixed Flow
Lanes
Motorcycles 242 — 58 —
Buses (4) 1680 — 350 —
Carpools (1) 6885 — 1783 —
2 - seaters (2) 1326 — 278 —
Hybrid 64 — 12 —
Vanpools 1360 — 630 —Violators (HOV only) 525 — 91 —
TOTAL 12082 18619 3202 4695
RATES
HOV Lane occupancy rate
3.7 persons/veh 3.5 persons/veh
Mixed FlowOccupancy Rate
(7)
1.1 persons/veh 1.1 persons/veh
Violation rate(HOV Lane)
(3)
11.0 % 6.1 %
NOTES: (1) 3 or more persons per vehicle.
(2) 2 - seater vehicles with 2 persons.
(3) Violation rate = no. of violators in HOV lane x 100%
Total no. of vehicles in HOV lane
(4) Assumed PM bus occupancy = 35 persons/vehicle.
(5) HOV lane in operation from 3:00 to 7:00 P.M.
(6) Observations conducted 9/14/06 at the Carquinez Bridge Toll Plaza.
(7) Data from Toll Plaza vehicle Registration Report.
(5)
(6)
(7)
(7)
District 4, Year 2006 Annual HOV Lane Report Page 160

SOLANO-80 Violation HistoryCarquinez Bridge Toll Plaza Eastbound
DATEPERIOD
MONITOREDTOTAL HOVL
VOLUMEVIOLATION
RATE
A.M. PEAK Year 2006 - - -Year 2005 - - -Year 2004 - - -Year 2003 - - -Thu Nov 14, 2002 5:00 - 10:00 AM 706 10.1%
Thu May 31, 2001 5:00 - 10:00 AM 804 24.5%
Thu Nov 16, 2000 5:00 - 10:00 AM 773 34.4%
Wed Mar 10, 1999 6:00 - 10:00 AM 664 26.2%
Wed Sep 16, 1998 6:00 - 10:00 AM 559 27.2%
P.M. PEAK Thu Sep 14, 2006 3:00 - 7:00 PM 3285 11.0%
Wed Sep 14, 2005 3:00 - 7:00 PM 3523 6.0%
Wed Oct 13, 2004 3:00 - 7:00 PM 3342 9.4%
Thu May 15, 2003 3:00 - 7:00 PM 3360 8.8%
Thu Sep 26, 2002 3:00 - 7:00 PM 3429 9.5%
Thu Mar 29, 2001 3:00 - 7:00 PM 3493 1.2%
Tue Oct 17, 2000 3:00 - 7:00 PM 3373 9.5%
Wed Sep 29, 1999 3:00 - 7:00 PM 2945 12.9%
Wed Sep 16, 1998 3:00 - 7:00 PM 2203 12.4%
NOTES: (a) Morning period of operation from 5:00 to 10:00 AM
(b) Evening period of operation from 3:00 to 7:00 PM.
(c) Data was not collected in 2006 for off-peak direction
District 4, Year 2006 Annual HOV Lane Report Page 161

SONOMA-101 Southbound - A.M.Route 12 to Wilfred Avenue Typical data for 2006
PEAK PERIOD PEAK HOUR7:00 - 9:00 AM 8:00 - 9:00 AM
VEHICLES HOV LaneMixed Flow
Lanes HOV LaneMixed Flow
Lanes
Motorcycles 39 5 21 4
Buses 4 5 3 2
Carpools (1) 598 330 309 157
Vanpools 2 3 1 3
Hybrid/Single Occ. (2) 29 6475 8 3291Violators 33 — 9 —
TOTAL 705 6818 351 3457
PERSONS HOV LaneMixed Flow
Lanes HOV LaneMixed Flow
Lanes
Motorcycles 39 5 21 4
Buses 140 175 105 70
Carpools (1) 1248 695 643 328
Vanpools 20 30 10 30
Hybrid/Single Occ. (2) 29 6475 8 3291Violators 33 — 9 —
TOTAL 1509 7380 796 3723
RATES
HOV Lane occupancy rate
2.1 persons/veh 2.3 persons/veh
Mixed Flow occupancy rate
1.1 persons/veh 1.1 persons/veh
Overall occupancy (incl. buses)
1.2 persons/veh 1.2 persons/veh
Violation rate(HOV Lane)
(3)
4.7 % 2.6 %
NOTES: (1) Two or more occupants per vehicle.
(2) Hybrid HOV lane only/Single Occupancy mixed flow lane only
(3) Violation rate = no. of violators in HOV lane x 100%
Total no. of vehicles in HOV lane
(4) HOV lane in operation from 7:00 to 9:00 A.M.
(5) Observations conducted 10/18/06 at South of Hearn Avenue Interchange.
(4)
(5)
District 4, Year 2006 Annual HOV Lane Report Page 162

SONOMA-101 Southbound - P.M.Route 12 to Wilfred Avenue Typical data for 2006
PEAK PERIOD PEAK HOUR3:00 - 6:30 PM 5:00 - 6:00 PM
VEHICLES HOV LaneMixed Flow
Lanes HOV LaneMixed Flow
Lanes
Motorcycles 97 34 29 8
Buses 16 36 1 8
Carpools (1) 2053 1190 593 342
Vanpools 4 2 2 0
Hybrid/Single Occ. (2) 25 11147 6 3465Violators 82 — 5 —
TOTAL 2277 12409 636 3823
PERSONS HOV LaneMixed Flow
Lanes HOV LaneMixed Flow
Lanes
Motorcycles 97 34 29 8
Buses 560 1260 35 280
Carpools (1) 4278 2490 1217 718
Vanpools 40 20 20 0
Hybrid/Single Occ. (2) 25 11147 6 3465Violators 82 — 5 —
TOTAL 5082 14951 1312 4471
RATES
HOV Lane occupancy rate
2.2 persons/veh 2.1 persons/veh
Mixed Flow occupancy rate
1.2 persons/veh 1.2 persons/veh
Overall occupancy (incl. buses)
1.4 persons/veh 1.3 persons/veh
Violation rate(HOV Lane)
(3)
3.6 % 0.8 %
NOTES: (1) Two or more occupants per vehicle.
(2) Hybrid HOV lane only/Single Occupancy mixed flow lane only
(3) Violation rate = no. of violators in HOV lane x 100%
Total no. of vehicles in HOV lane
(4) HOV lane in operation from 3:00 to 6:30 P.M.
(5) Observations conducted 04/27/06 at South of Hearn Avenue Interchange.
(4)
(5)
District 4, Year 2006 Annual HOV Lane Report Page 163

SONOMA-101 Northbound - A.M.Wilfred Avenue to Route 12 Typical data for 2006
PEAK PERIOD PEAK HOUR7:00 - 9:00 AM 8:00 - 9:00 AM
VEHICLES HOV LaneMixed Flow
Lanes HOV LaneMixed Flow
Lanes
Motorcycles 21 0 9 0
Buses 5 31 4 8
Carpools (1) 717 279 433 119
Vanpools 5 2 2 0
Hybrid/Single Occ. (2) 31 5616 20 2780Violators 28 — 8 —
TOTAL 807 5928 476 2907
PERSONS HOV LaneMixed Flow
Lanes HOV LaneMixed Flow
Lanes
Motorcycles 21 0 9 0
Buses 175 1085 140 280
Carpools (1) 1502 619 899 267
Vanpools 50 20 20 0
Hybrid/Single Occ. (2) 31 5616 20 2780Violators 28 — 8 —
TOTAL 1807 7340 1096 3327
RATES
HOV Lane occupancy rate
2.2 persons/veh 2.3 persons/veh
Mixed Flow occupancy rate
1.2 persons/veh 1.1 persons/veh
Overall occupancy (incl. buses)
1.4 persons/veh 1.3 persons/veh
Violation rate(HOV Lane)
(3)
3.5 % 1.7 %
NOTES: (1) Two or more occupants per vehicle.
(2) Hybrid HOV lane only/Single Occupancy mixed flow lane only
(3) Violation rate = no. of violators in HOV lane x 100%
Total no. of vehicles in HOV lane
(4) HOV lane in operation from 7:00 to 9:00 A.M.
(5) Observations conducted 10/25/06 at North of Todd Road Interchange.
(4)
(5)
District 4, Year 2006 Annual HOV Lane Report Page 164

SONOMA-101 Northbound - P.M.Wilfred Avenue to Route 12 Typical data for 2006
PEAK PERIOD PEAK HOUR3:00 - 6:30 PM 5:00 - 6:00 PM
VEHICLES HOV LaneMixed Flow
Lanes HOV LaneMixed Flow
Lanes
Motorcycles 67 16 22 3
Buses 14 30 7 9
Carpools (1) 1745 933 523 216
Vanpools 0 2 0 1
Hybrid/Single Occ. (2) 10 10393 2 3129Violators 71 — 12 —
TOTAL 1907 11374 566 3358
PERSONS HOV LaneMixed Flow
Lanes HOV LaneMixed Flow
Lanes
Motorcycles 67 16 22 3
Buses 490 1050 245 315
Carpools (1) 3589 1950 1069 450
Vanpools 0 20 0 10
Hybrid/Single Occ. (2) 10 10393 2 3129Violators 71 — 12 —
TOTAL 4227 13429 1350 3907
RATES
HOV Lane occupancy rate
2.2 persons/veh 2.4 persons/veh
Mixed Flow occupancy rate
1.2 persons/veh 1.2 persons/veh
Overall occupancy (incl. buses)
1.3 persons/veh 1.3 persons/veh
Violation rate(HOV Lane)
(3)
3.7 % 2.1 %
NOTES: (1) Two or more occupants per vehicle.
(2) Hybrid HOV lane only/Single Occupancy mixed flow lane only
(3) Violation rate = no. of violators in HOV lane x 100%
Total no. of vehicles in HOV lane
(4) HOV lane in operation from 3:00 to 6:30 P.M.
(5) Observations conducted 04/13/06 at North of Todd Road Interchange.
(4)
(5)
District 4, Year 2006 Annual HOV Lane Report Page 165

SONOMA-101 Violation HistoryWilfred Avenue to Route 12 Northbound
DATEPERIOD MONITORED
TOTAL HOVL VOLUME
VIOLATION RATE
A.M. PEAK Wed Oct 25, 2006 7:00 - 9:00 AM 807 3.5%
Tue Mar 15, 2005 7:00 - 9:00 AM 836 4.9%
Thu Oct 14, 2004 7:00 - 9:00 AM 666 4.4%
Wed Apr 9, 2003 6:30 - 9:30 AM 839 6.0%
Thu Dec 5, 2002 6:30 - 9:30 AM 696 6.6%
P.M. PEAK Thu Apr 13, 2006 3:00 - 6:30 PM 1907 3.7%
Thu Oct 6, 2005 3:00 - 6:30 PM 2263 2.0%
Thu Oct 21, 2004 3:00 - 6:30 PM 1945 2.2%
Thu Oct 16, 2003 3:00 - 7:00 PM 2172 3.2%
Thu Dec 5, 2002 3:00 - 7:00 PM 2145 1.9%
NOTES: (a) Morning period of operation from 7:00 to 9:00 AM.
(b) Evening period of operation from 3:00 to 6:30 PM.
District 4, Year 2006 Annual HOV Lane Report Page 167

District 4, Year 2006 Annual HOV Lane Report Page 169
HOV TOLL GATES
VOLUME/PERSON DATA

HOV TOLL GATE Westbound - A.M.Richmond-San Rafael Bridge Toll Plaza Typical data for 2006
CONTRA COSTA - 580
PEAK PERIOD PEAK HOUR6:00 - 10:00 AM 7:00 - 8:00 AM
VEHICLES
Motorcycles 56 16
Buses 42 4
Vanpools 15 5
Carpools (1) 869 422
Total HOVs 982 447
1 Occupancy 549 1182 Occupancy 158 52
TOTAL 1689 617
PERSONS
Motorcycles 56 16
Buses 1470 140
Vanpools 150 50
Carpools (1) 2433 1182
Total HOVs 4109 1388
1 Occupancy 549 118
2 Occupancy 316 104
TOTAL 4974 1610
RATES
HOVOccupancy Rate
4.2 persons/veh 3.1 persons/veh
Mixed Flow Occupancy Rate
1.2 persons/veh 1.3 persons/veh
Overall Occupancy (incl. buses)
2.9 persons/veh 2.6 persons/veh
NOTES: (1) 3 or more persons per vehicle & 2 - seater vehicles with 2 persons.
(2) HOV operation hours from 5:00 to 10:00 AM and 3:00 to 6:00 PM.
(3) Observations conducted 5/4/06 at Toll Plaza.
(2)
(3)
District 4, Year 2006 Annual HOV Lane Report Page 171

HOV TOLL GATE Westbound - P.M.Richmond-San Rafael Bridge Toll Plaza Typical data for 2006
CONTRA COSTA - 580
PEAK PERIOD PEAK HOUR3:00 - 6:00 PM 5:00 - 6:00 PM
VEHICLES
Motorcycles 44 26
Buses 5 3
Vanpools 14 5
Carpools (1) 340 135
Total HOVs 403 169
1 Occupancy 505 2032 Occupancy 110 29
TOTAL 1018 401
PERSONS
Motorcycles 44 26
Buses 175 105
Vanpools 140 50
Carpools (1) 952 378
Total HOVs 1311 559
1 Occupancy 505 203
2 Occupancy 220 58
TOTAL 2036 820
RATES
HOVOccupancy Rate
3.3 persons/veh 3.3 persons/veh
Mixed Flow Occupancy Rate
1.2 persons/veh 1.1 persons/veh
Overall Occupancy (incl. buses)
2.0 persons/veh 2.0 persons/veh
NOTES: (1) 3 or more persons per vehicle & 2 - seater vehicles with 2 persons.
(2) HOV operation hours from 5:00 to 10:00 AM and 3:00 to 6:00 PM.
(3) Observations conducted 9/13/06 at Toll Plaza.
(2)
(3)
District 4, Year 2006 Annual HOV Lane Report Page 172

HOV TOLL GATE Northbound A.M.Antioch Bridge Toll Plaza Typical data for 2006
CONTRA COSTA -160
PEAK PERIOD PEAK HOUR 6:00 to 9:00 A.M. 6:00 to 7:00 A.M.
VEHICLES
Motorcycles 3 2
Buses 0 0
Vanpools 0 0
Carpools (1) 25 5
Total HOV 28 7
1 Occupancy 855 3022 Occupancy 93 38
TOTAL 976 347
PERSONS
Motorcycles 3 2
Buses 0 0
Vanpools 0 0
Carpools (1) 78 16
Total HOV 81 18
1 Occupancy 855 302
2 Occupancy 186 76TOTAL 1122 396
RATES
HOV Ocupancy Rate
2.9 persons/veh 2.5 persons/veh
Overall occupancy (incl. buses)
1.1 persons/veh 1.1 persons/veh
NOTES: (1) 3 or more occupants per vehicle & 2-seater vehicles w/2 occupants.
(2) HOV operation hours 5:00 to 10:00 AM.
(3) Observations conducted 09/06/06 at Toll Plaza
(2)
(3)
District 4, Year 2006 Annual HOV Lane Report Page 173

HOV TOLL GATE Northbound P.M.Antioch Bridge Toll Plaza Typical data for 2006
CONTRA COSTA -160
PEAK PERIOD PEAK HOUR 3:00 to 6:00 P.M. 4:00 to 5:00 P.M.
VEHICLES
Motorcycles 6 1
Buses 0 0
Vanpools 1 1
Carpools (1) 74 28
Total HOV 81 30
1 Occupancy 1419 4892 Occupancy 295 107
TOTAL 1795 626
PERSONS
Motorcycles 6 1
Buses 0 0
Vanpools 10 10
Carpools (1) 229 87
Total HOV 245 98
1 Occupancy 1419 489
2 Occupancy 590 214TOTAL 2254 801
RATES
HOV Ocupancy Rate
3.0 persons/veh 3.3 persons/veh
Overall occupancy (incl. buses)
1.3 persons/veh 1.3 persons/veh
NOTES: (1) 3 or more occupants per vehicle & 2-seater vehicles w/2 occupants.
(2) HOV operation hours 3:00 to 7:00 PM.
(3) Observations conducted 5/23/06 at Toll Plaza
(2)
(3)
District 4, Year 2006 Annual HOV Lane Report Page 174

HOV TOLL GATE Northbound A.M.Benicia-Martinez Bridge Toll Plaza
SOLANO - 680
PEAK PERIOD PEAK HOUR 6:00 to 9:00 A.M. 7:00 to 8:00 A.M.
VEHICLES
Motorcycles 54 15
Buses 19 3
Vanpools 10 6
Carpools (1) 166 78
Total HOV 249 102
1 Occupancy 6769 25802 Occupancy 808 296
TOTAL 7826 2978
PERSONS
Motorcycles 54 15
Buses 665 105
Vanpools 100 60
Carpools (1) 515 242
Total HOV 1334 422
1 Occupancy 6769 2580
2 Occupancy 1616 592TOTAL 9719 3594
RATES
HOV Ocupancy Rate
5.4 persons/veh 4.1 persons/veh
Overall occupancy (incl. buses)
1.2 persons/veh 1.2 persons/veh
NOTES: (1) 3 or more persons per vehicle & 2 - seater vehicles with 2 persons.
(2) HOV operation hours from 5:00 to 10:00 AM.
(3) Observations conducted 5/4/06 at Benicia Bridge Toll Plaza.
Typical data for 2006
(2)
(3)
District 4, Year 2006 Annual HOV Lane Report Page 175

HOV TOLL GATE Northbound P.M.Benicia-Martinez Bridge Toll Plaza
SOLANO - 680
PEAK PERIOD PEAK HOUR 3:00 to 6:00 P.M. 4:00 to 5:00 P.M.
VEHICLES
Motorcycles 60 23
Buses 14 3
Vanpools 22 3
Carpools (1) 230 64
Total HOV 326 93
1 Occupancy 10729 38412 Occupancy 1464 325
TOTAL 12519 4259
PERSONS
Motorcycles 60 23
Buses 490 105
Vanpools 220 30
Carpools (1) 713 198
Total HOV 1483 356
1 Occupancy 10729 3841
2 Occupancy 2928 650TOTAL 15140 4847
RATES
HOV Ocupancy Rate
4.5 persons/veh 3.8 persons/veh
Overall occupancy (incl. buses)
1.2 persons/veh 1.1 persons/veh
NOTES: (1) 3 or more persons per vehicle & 2 - seater vehicles with 2 persons.
(2) HOV operation hours from 3:00 to 7:00 PM.
(3) Observations conducted 11/1/06 at Benicia Bridge Toll Plaza.
Typical data for 2006
(2)
(3)
District 4, Year 2006 Annual HOV Lane Report Page 176