california energy commission california’s economic and demographic outlook electricity and natural...
TRANSCRIPT

California Energy Commission
California’s Economic and Demographic Outlook
Electricity and Natural Gas Model Inputs and Assumptions IEPR Lead Commissioner
Workshop
February 26, 2015
Nancy Tran
Demand Analysis Office
Energy Assessments Division
[email protected] / 916-654-3848
1
California Energy Commission
Purpose Provide an overview of California’s
economy and demographics Provide economic and demographic
background that is considered in the demand forecast
Summarize comments received from experts on the post-recession landscape
Describe major uncertainties over the next 10 years
2

California Energy Commission
Agenda
The Recession Demographics The Economy California’s Regions Uncertainties Conclusion
3
California Energy Commission
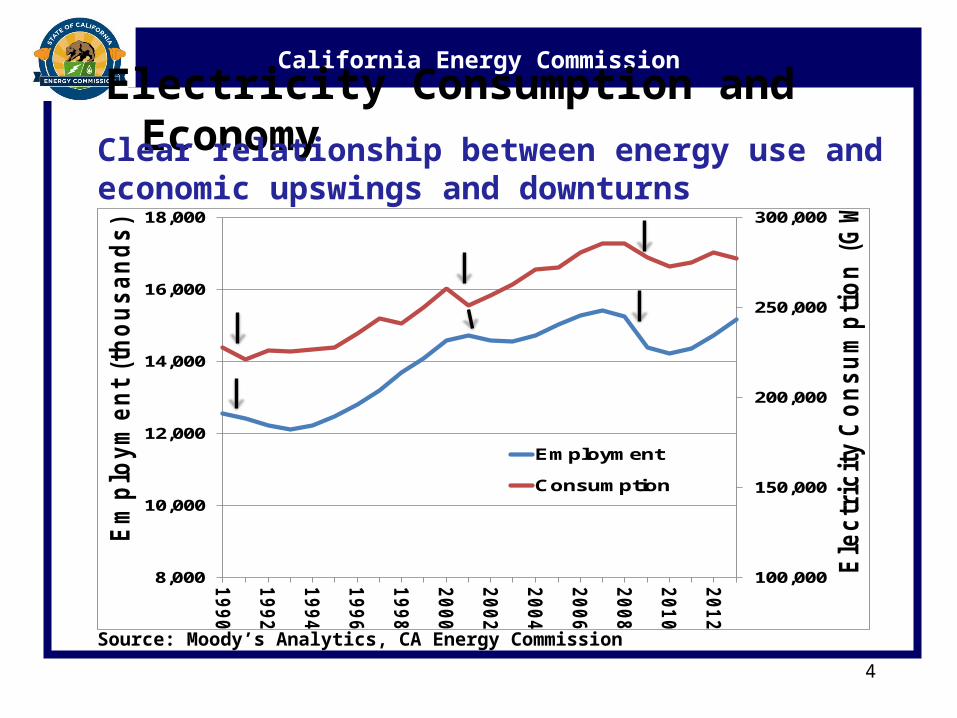
Electricity Consumption and Economy
4
Source: Moody’s Analytics, CA Energy Commission
Clear relationship between energy use and economic upswings and downturns
100,000
150,000
200,000
250,000
300,000
8,000
10,000
12,000
14,000
16,000
18,000
1990
1992
1994
1996
1998
2000
2002
2004
2006
2008
2010
2012
Ele
ctr
icit
y C
on
su
mp
tio
n (
GW
h)
Em
plo
ym
en
t (t
ho
us
an
ds
)
Employment
Consumption

California Energy Commission
Key Economic Drivers Used in the Forecast:
5
Population Number of Homes Personal Income Dollar Output by Sector Employment by Sector Unemployment Rate Average Household Size
California Energy Commission
During the Recession, California experienced:
6
Downturns in nearly all major industries within the state
Job loss: one million+ California residents lost their jobs
A housing market bust
California Energy Commission
7
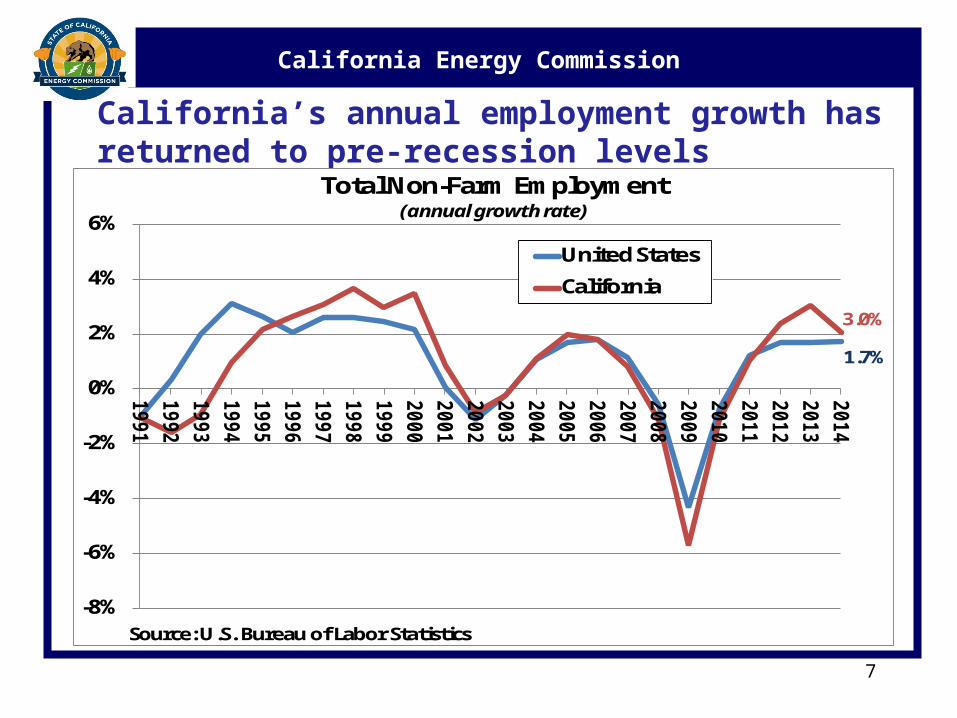
California’s annual employment growth has returned to pre-recession levels
1.7%
3.0%
-8%
-6%
-4%
-2%
0%
2%
4%
6%
19
91
19
92
19
93
19
94
19
95
19
96
19
97
19
98
19
99
20
00
20
01
20
02
20
03
20
04
20
05
20
06
20
07
20
08
20
09
20
10
20
11
20
12
20
13
20
14
United States
California
Source: U.S. Bureau of Labor Statistics
Total Non-Farm Employment (annual growth rate)

California Energy Commission
8
The Great Recession: Unemployment RateCalifornia’s unemployment rate reached 12.4% in 2010
9.6
6.2
12.4
7.6
0.0
2.0
4.0
6.0
8.0
10.0
12.0
14.020
00
2001
2002
2003
2004
2005
2006
2007
2008
2009
2010
2011
2012
2013
2014
Ave
rage
An
nu
al U
nem
plo
ymen
t R
ate
(Per
cen
tage
)
United StatesCalifornia
Source: California Employment Development Department and U.S. Bureau of Labor Statistics
Recession

California Energy Commission
9
Housing is starting to rebound
37,674
28,895
-
20,000
40,000
60,000
80,000
100,000
120,000
140,000
160,000
2000 2002 2004 2006 2008 2010 2012 2014
California Housing Construction Completions(Number of Units, Seasonally Adjusted)
Single-family
Multi-family
Source: Moody's Analytics

California Energy Commission
10
Slow down in California’s population growth – only 0.9% growth last year
20,000
22,000
24,000
26,000
28,000
30,000
32,000
34,000
36,000
38,000
40,000
19
90
19
91
19
92
19
93
19
94
19
95
19
96
19
97
19
98
19
99
20
00
20
01
20
02
20
03
20
04
20
05
20
06
20
07
20
08
20
09
20
10
20
11
20
12
20
13
20
14
California's Population Estimates (1990-2014) (in thousands)
Source: CA Dept of Finance
California Energy Commission
11
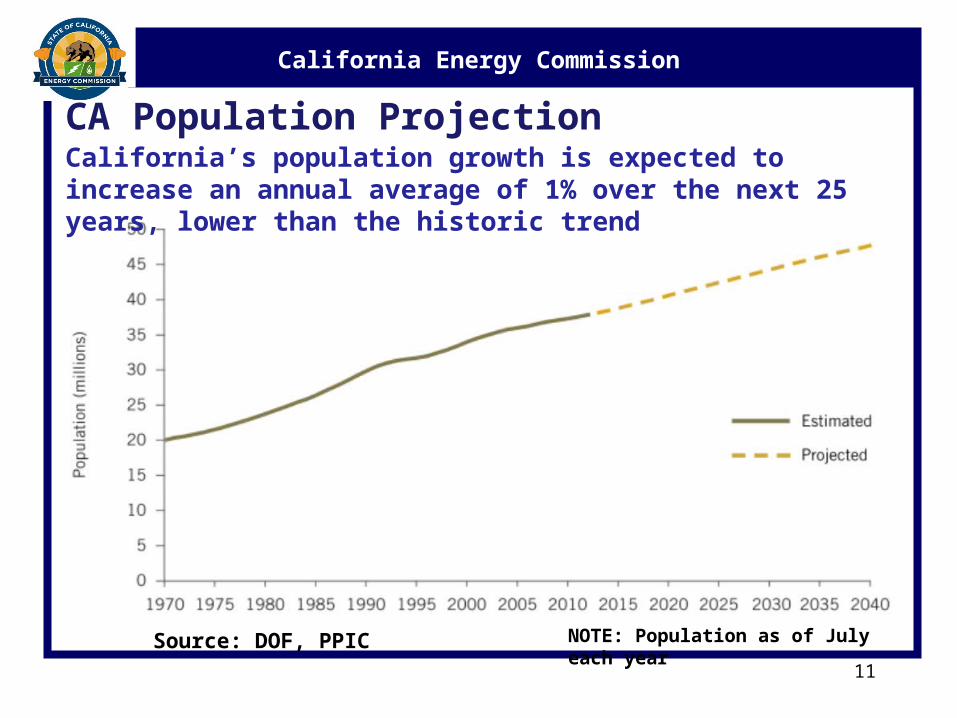
Source: DOF, PPIC NOTE: Population as of July each year
CA Population ProjectionCalifornia’s population growth is expected to increase an annual average of 1% over the next 25 years, lower than the historic trend
California Energy Commission
12
Two aspects of population growth are birth rates and migration
The following are growth drivers related to birth rates and migration:
Number of women of child bearing ages State of job market Wage and salary opportunities Housing prices Death rates (minor)

California Energy Commission
Migration in California California consists of immigrants from 60
different countries In 2013, net migration added 92,000 people California is a leading destination for foreign
immigration into the U.S.A. California continues to have low domestic
migration California’s inland areas experienced faster
population growth rates than coastal areas Population growth: 5.7% to 5.9% for coastal regions
and 15.3% to 16.4% inland regions13
California Energy Commission
14
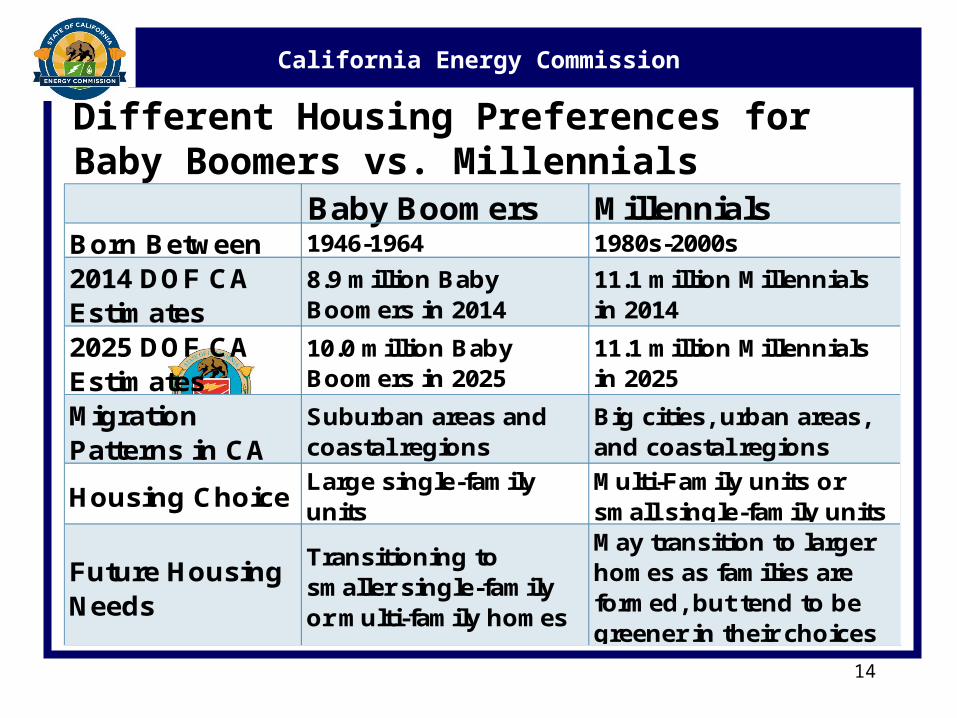
Different Housing Preferences for Baby Boomers vs. Millennials
Baby Boomers MillennialsBorn Between 1946-1964 1980s-2000s
2014 DOF CA Estimates
8.9 million Baby Boomers in 2014
11.1 million Millennials in 2014
2025 DOF CA Estimates
10.0 million Baby Boomers in 2025
11.1 million Millennials in 2025
Migration Patterns in CA
Suburban areas and coastal regions
Big cities, urban areas, and coastal regions
Housing ChoiceLarge single-family units
Multi-Family units or small single-family units
Future Housing Needs
Transitioning to smaller single-family or multi-family homes
May transition to larger homes as families are formed, but tend to be greener in their choices
California Energy Commission
15
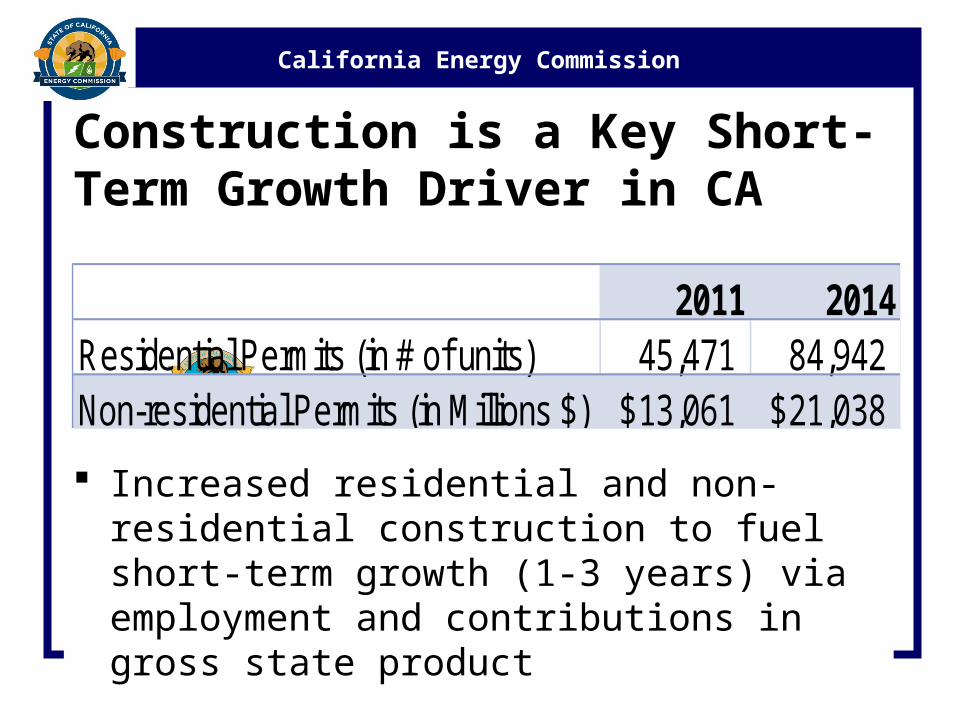
Construction is a Key Short-Term Growth Driver in CA
Increased residential and non-residential construction to fuel short-term growth (1-3 years) via employment and contributions in gross state product
2011 2014Residential Permits (in # of units) 45,471 84,942 Non-residential Permits (in Millions $) 13,061$ 21,038$

California Energy Commission
16
Additional short-term economic drivers include:
Lower mortgage and foreclosure rates
Lower oil and gasoline prices Income growth from technology
industries Government recovery

California Energy Commission
17
CA’s Mid- and Long-Term Growth
Mid-term growth (3-5 years) expected in the housing and technology sectors
Gross State Product growth at 3%+ annually Recent economic forecasts are more
pessimistic about long term growth compared to last year due to a “scarring effect”
Long-term growth (5-10 years) expected to keep pace with the nation in CA’s high-tech industry and with infrastructure improvements
Gross State Product growth at 2%+ annually

California Energy Commission
California Regions
Los Angeles Region
Sacramento Region San Diego RegionSan Francisco
Region
18

California Energy Commission
Los Angeles Region Unemployment rate is currently 7.9 percent,
down from 13.0 percent in 2010 (EDD) Growth in trade and films
Software, application development, internet services, and biotechnology are components of LA’s success
Housing sector draws international investors More multi-family units to be built (UCLA Anderson
Forecast)
Potential shipping changes: Panama Canal
19

California Energy Commission
Sacramento Region Unemployment rate is currently 6.9 percent,
down from 12.6 percent in 2010 (EDD) Growth in demand for healthcare, agriculture,
manufacturing jobs, and business industrial space
Geographical location attracts Central Valley food producers and San Francisco’s high-tech businesses
Impact of the drought Kern County oil industry
20

California Energy Commission
San Diego Region
Unemployment rate is currently 5.8 percent, down from 10.4 percent in 2010 (EDD)
Growth in biotechnology, defense, and manufacturing
Homebuilding rebound short of expectations Attracting entrepreneurs to clean technology
with renewable energy focus 850+ companies with clean tech employment =
10% of total green jobs in CA
21

California Energy Commission
San Francisco Region Unemployment rate is currently 4.2 percent,
down from 9.1 percent in 2010 (EDD) Technology sector is the main driver to
success – tech firms can integrate their products into the business infrastructure in all industries
Housing prices and rental growth will continue to increase
Growth in nonresidential units is seen with new local startup companies
22
California Energy Commission
23
Forecast Uncertainties Drought Gasoline and oil prices Impact of Baby Boomers and
Millennials Length and severity of scarring
effects caused by the recession Migration patterns

California Energy Commission
24
Conclusions California is recovering from the Great
Recession at a faster pace than most states Growth in high-tech can be seen throughout
California Population continues to grow, but at a slower
pace “Traditional” electricity usage likely to grow at
slower pace in the next 10 years Degree of electrification (electric vehicles, ports,
trains, etc.) will determine whether electricity usage overall slows down