callaway golf company -...
TRANSCRIPT

CALLAWAY GOLF COMPANY
Presentation materials for February 15, 2006 Conference
for Financial Analysts and Investors
Important Notice: Attached are copies of the power point slides presented at the conference. For a more comprehensive understanding of the information contained in the slides, they should be read in conjunction with the audio replay of the conference, which will be available through 9:00 pm (Pacific Time) on February 22, 2006 and may be accessed through the investor relations portion of the Company’s website at http://ir.callawaygolf.com.

Investor Day
February 15, 2006

Safe Harbor DisclaimerI would like to point out that any comments made about future
performance, events or circumstances, including estimated charges or savings relating to the Company’s business improvement and cost reduction initiatives announced on September 29th or the Top-Flite integration, as well as the Company’s three-year core business targets regarding sales growth, operating income as a % of net sales, return on invested capital and free cash flows, are forward-looking statements subject to safe harbor protection under the federal securities laws. Such statements are based on current market trends and conditions. Actual results could differ materially as a result of changes in market trends or conditions or other risks and uncertainties applicable to the Company and its business. For details concerning these and other risks and uncertainties, you should consult Part I, Item 2, of our most recent Form 10-Q filed with the SEC, as well as the Company’s other reports subsequently filed with the SEC from time to time.

Safe Harbor DisclaimerDuring today’s presentation, in order to provide information with
regard to the Company’s core ongoing business, we will provide certain pro forma information as to the Company’s performance excluding charges associated with the integration of the Top-Flite operations and charges associated with the Company’s cost reduction initiatives. This information may include “non-GAAP financial measures” within the meaning of Regulation G. The attachments to the earnings release we issued on January 25, 2006 includes a reconciliation of such non-GAAP financial measures to the most directly comparable financial measures prepared in accordance with GAAP. The earnings release is available on the investor relations section of the Company’s website at http://ir.callawaygolf.com.
Finally, today’s presentation is being broadcast simultaneously over the Internet. Following the conference, a replay of the broadcast, as well as the presentation materials, will be available through 9:00 pm (Pacific Time) on February 22nd on the investor relations section of the Company’s website at http://ir.callawaygolf.com.
AgendaCEO Overview - George FellowsBrand Overview – John MelicanResearch & Development – Alan HocknellBreakManufacturing – Bob PenickaFinancial Update – Brad HolidayQ&ALunchClinic/Demo & Product Trial

Investor Day
CEO UPDATEGeorge Fellows
President and Chief Executive Officer

Why Callaway• Icon for golf innovation – Ely Callaway changed
paradigm - opportunity to make a difference
• Strong consumer equity
• Best trade relations in industry
• Innovation drives impulse
• Critical Company skill sets -technology/innovation/culture of winning
• Growth opportunities

Problems/Opportunities
• Cost structure out of alignment
• Processes not well coordinated/fragmented
• Supply chain not leveraged/customer service sub-optimal
• Organizational structure not optimized
• Management turmoil

Actions Taken To Date
Cost Structure
– Sept. 29th restructuring– $60-70 million annual savings by 2007– $50-60 realized in 2006– Re-investment into marketing– Majority of savings to profit

Actions Taken To Date
Processes Were Not Well Coordinated/Fragmented• Remapped Product development process - 3 year new
products plan
• Remapped forecasting process - adding new toolsets

Actions Taken To Date
Supply Chain Not Leveraged/Customer Service Sub-optimal• Re-examining off-shore vs. domestic
• Shorter lead times
• Reviewing new vendors
• CAPEX focus on automation/cost reduction
• Revamped production planning
• Re-timed introductory calendar/higher levels of core inventory
• Introduced performance metrics

Actions Taken To DateOrganizational Structure Not Optimized• Completed Top-Flite/Hogan integration
• Restructured marketing to product management system -enhance P&L accountability and control
• Sales reporting to CEO
• Hiring some key positions
• Established MBO system - more closely align cross departmental objectives to compensation
• Improved integration of International into product development process
Actions Taken To Date
Management Turmoil• Planned vs. unplanned
Immediate Next Steps
• Gross Margin improvement – Automation– Sourcing– Value analysis

Immediate Next Steps
• More aggressive Marketing/Sales efforts– Direct to consumer efforts – pull vs. push– Grass roots initiatives – grow underdeveloped segment– Improved coordination of marketing/sales programs– Regional focus– Sharing of best practices internationally– Restructuring international distributor efforts– China initiative– Coordinated licensing marketing/category expansion

Expectations
• Focus on profitable growth/financial goals
• Investment in margin improvement
• Industry leading Customer Service
• Steady flow of innovative new products - drive impulse
• More aggressive market presence
• Disciplined prioritization of growth initiatives
• Create long term value for shareholders

Metrics• Financial
– Sales/Profit Growth– Operating Income/percent to Sales– Return on Invested Capital– Free Cash Flow
• Operational– Customer Service - orders shipped complete/on time
(OSCOT)– Forecast Accuracy– Independent Review of Customer Satisfaction– Share Growth


INVESTOR DAY
Brand Portfolio OverviewJohn Melican
Sr. VP Marketing

MARKET DRIVEN BY NEW PRODUCTS
Category: Woods, Irons, Golf Balls, Putters, Wedges, Shoes, Bags, GlovesChannel: On Course and Off CourseChannel Dollars: 36% On Course 64% Off Course
• Club (woods, irons, wedges) categories had double digit dollar growth in 2005• Golf Datatech market data captures approximately 65%-70% of U.S. golf industry dollars• National rounds played are up +0.4% year, Dec 05 rounds were flat compared to Dec 04.
Yearly $...... %......Sales Change Change
Woods $ 792.2 + $ 138.0 + 21.1%Irons $ 534.3 + $ 51.7 + 10.7%Balls $ 536.0 + $ 28.8 + 5.7%Putters $ 188.4 - $ 0.2 - 0.1%Wedges $ 87.5 + $ 8.1 + 10.3%Shoes $ 245.2 + $ 11.2 + 4.8%Bags $ 150.7 + $ 4.0 + 2.7%Gloves $ 13.7 + $ 0.4 + 2.9%
Total Industry $ 2,547.9 + $ 242.1 + 10.5%
’05 U.S. $ Sales – Total Industry
Source: Golf Datatech

Category: Woods, Irons, Golf Balls, Putters, Wedges, Shoes, Bags, GlovesAcushnet: Titleist, Cobra, Pinnacle, FootjoyAdidas: Taylormade, MaxfliCallaway Golf: Callaway Golf, Odyssey, Top Flite, Ben HoganChannel: On Course and Off CourseChannel Dollars: 36% On Course 64% Off Course
CALLAWAY GOLF STRONG PERFORMANCE DESPITE EXECUTION CHALLENGES
’05 U.S. $ SalesBy Company
YTD.. $...... %...... YTD...Sales Change Change $ Share
Acushnet $ 782.5 + $ 60.3 + 8.3% 30.7%Callaway Golf $ 495.6 + $ 48.8 + 10.9% 19.5%Adidas $ 317.1 + $ 11.0 + 3.6% 12.4%Ping $ 206.8 + $ 57.8 + 38.8% 8.1%Nike $ 162.1 + $ 19.2 + 13.4% 6.4%Cleveland $ 138.3 + $ 22.3 + 19.2% 5.4%Mizuno $ 59.2 + $ 15.8 + 36.4% 2.3%All Others $ 386.4 + $ 7.0 + 1.8% 15.2%
Total $ 2,547.9 + $ 242.1 + 10.5%
Source: Golf Datatech

WOODS: CALLAWAY GOLF STRONG #2, PREPARED FOR SOLID 2006
KEY ACTIONS:1. Launch X460/X460 Tour drivers,
X Fairway Woods, FT Hybrid, CFT Ti Hybrid
2. Re-invigorate FT-33. Launch OptiFit Driver System4. Hybrid competitiveness
YTD.. $...... %...... YTD...Sales Change Change $ Share
Taylormade $ 189.5 + $ 11.8 + 6.6% 23.9%Callaway $ 130.8 + $ 6.8 + 5.5% 16.5%Cobra $ 105.9 + $ 18.0 + 20.4% 13.4%Ping $ 77.8 + $ 51.1 + 191.8% 9.8%Cleveland $ 73.1 + $ 17.5 + 31.6% 9.2%Titleist $ 49.2 + $ 3.3 + 7.3% 6.2%Nike $ 28.0 + $ 5.2 + 22.9% 3.5%Ben Hogan $ 17.1 + $ 11.5 + 204.4% 2.2%
Total Woods $ 792.2 + $ 138.0 + 21.1%
STRATEGIC FOCUS:1. Innovation & Technology2. Execution3. Consumer Communications
’05 U.S. $ Sales

IRONS: CALLAWAY GOLF STRONG #1
KEY ACTIONS:1. Launch BB ’06 Irons, Fusion
Wide Sole Irons, X-Tour Wedges, Apex, Apex Edge
2. Year-2 Marketing3. Customs Performance4. Re-ground Hogan line (Forged,
craftsmanship, feel)
STRATEGIC FOCUS:1. Innovation & Technology2. Segmentation3. Execution
YTD.. $...... %...... YTD...Sales Change Change $ Share
Callaway $ 143.6 + $ 36.7 + 34.3% 26.9%Ping $ 70.2 + $ 6.4 + 10.1% 13.1%Taylormade $ 60.2 + $ 0.5 + 0.9% 11.3%Mizuno $ 38.8 + $ 13.0 + 50.3% 7.3%Cobra $ 38.3 + $ 11.1 + 40.7% 7.2%Cleveland $ 34.5 + $ 2.6 + 8.2% 6.5%Nike $ 26.1 + $ 0.6 + 2.4% 4.9%Titleist $ 25.7 - $ 5.5 - 17.7% 4.8%
Total $ 534.3 + $ 51.7 + 10.7%
’05 U.S. $ Sales

BALLS: CALLAWAY GOLF-DEFINITIVE #2
KEY ACTIONS:1. Launch improved HX Tour/56, Big
Bertha, HX Pearl, XL Extreme, XL+
2. Rebuild Top-Flite equity with focus on strong XL sub-brand (≤$20)
3. Heavy seeding/sampling of all balls in portfolio
4. RIM: $ cost↓ performance↑
STRATEGIC FOCUS:1. Distribution2. Trial/Sampling3. Tour4. Top-Flite Brand Health
YTD.. $...... %...... YTD...Sales Change Change $ Share
Titleist $ 286.2 + $ 19.5 + 7.3% 53.4%Callaway $ 56.4 + $ 11.3 + 25.2% 10.5%Nike $ 48.9 + $ 10.1 + 26.0% 9.1%Pinnacle $ 39.8 + $ 2.4 + 6.5% 7.4%Bridge/Precept $ 24.9 + $ 0.6 + 2.4% 4.6%Maxfli $ 24.8 - $ 2.7 - 9.9% 4.6%Top Flite $ 24.4 - $ 10.4 - 29.8% 4.6%Volvik $ 7.2 + $ 3.3 + 82.0% 1.4%
Total Balls $ 536.0 + $ 28.8 + 5.7%
’05 U.S. $ Sales

PUTTERS: ODYSSEY DOMINANT #1
KEY ACTIONS:1. Upgrade product line through
launch of Tri-Ball/2-Ball SRT, White Hot XG
2. Explore entry point into premium non-inserted market space
3. Stretch Odyssey brand through product line and product category extensions
4. Drive Tour usage through model variety, customization, and best-in-class service
STRATEGIC FOCUS:1. #1 Putter Brand in Golf2. Technology Leadership3. Tour
YTD.. $...... %...... YTD...Sales Change Change $ Share
Odyssey $ 68.5 - $ 3.8 - 5.3% 36.4%Titleist $ 39.7 + $ 4.1 + 11.6% 21.1%Ping $ 31.2 - $ 2.6 - 7.7% 16.6%Taylormade $ 12.5 + $ 0.8 + 7.3% 6.6%Nike $ 4.7 + $ 0.6 + 14.6% 2.5%Never Comp $ 4.6 - $ 1.0 - 7.4% 2.4%Callaway $ 2.1 + $ 0.1 + 5.2% 1.1%Yes $ 1.9 + $ 1.9 + 0.0% 1.0%
Total Putters $ 188.4 - $ 0.2 - 0.1%
’05 U.S. $ Sales

TARGET AUDIENCE
6.0 Million
7.1 Million
14.2 Million
Total Golfers Total Golf Equipment Spending
Serious Golfers Play 25+ rounds/year
Moderate Golfers Play 8-24 rounds/year
Occasional GolfersPlay 1-7 rounds/year
“Golf’s Best Customers”– Play 25+ rounds/yr or spend $1,000/yr– At the top of golf’s “Pyramid of Influence”– Early adopters, trend-setters– May not be the most accomplished, but the most influential
$2.1 Billion
$1.2 Billion
$413 Million
*Source: National Golf Foundation

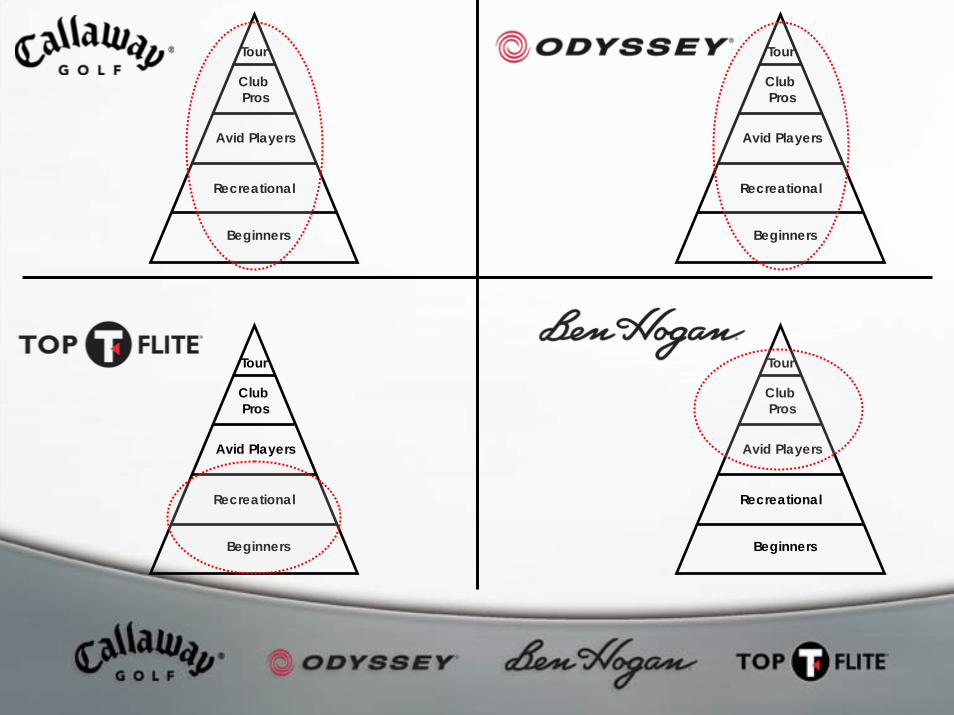
CALLAWAY GOLF COMPANY
• One Company
• 4 Brands
• Strongest Brands in the Business
• Complimentary
• Cover all Consumer Segments in Golf

Beginner Recreational Avid Player Club Pro Tour
SuperPremium
Premium
Value
$
Moderate
Tour
Club Pros
Avid Players
Recreational
Beginners
Tour
Club Pros
Avid Players
Recreational
Beginners
Tour
Club Pros
Avid Players
Recreational
Beginners
Tour
Club Pros
Avid Players
Recreational
Beginners
2005 MARKETING OVERVIEW

BRAND STATEMENT
Through an unwavering commitment to innovation, Callaway Golf creates products and services designed to make every golfer a better golfer.
Consumer InsightRegardless of skill level, all golfers want to play better golf. Whether it’s birdying the last hole to win on the PGA Tour, winning your club championship, taking 2 sides of $5 dollar Nassau, or breaking 100 for the 1st time, all golfers want to play their best.

BRAND POSITIONING
Tour
Club Pros
Beginners
Recreational
AvidPlayers
FROM TO
Tour
Club Pros
AvidPlayers
Recreational
Beginners

BRAND ARCHITECTURE
• Bold• Passionate• Innovative• Leader
Performance
• Contemporary• Core Technology• Premium•“X”
Game Enjoyment
• Forgiving• Fun• Friendly• “Big Bertha”
• Distance• 1st Mover Technology• Super Premium• “Fusion”
Statement

BRAND ARCHITECTURE
Tour
Club Pros
AvidPlayers
Recreational
Beginners
Statement Performance Game Enjoyment
Tour
Club Pros
AvidPlayers
Beginners
Recreational
Tour
Club Pros
AvidPlayers
Beginners
Recreational
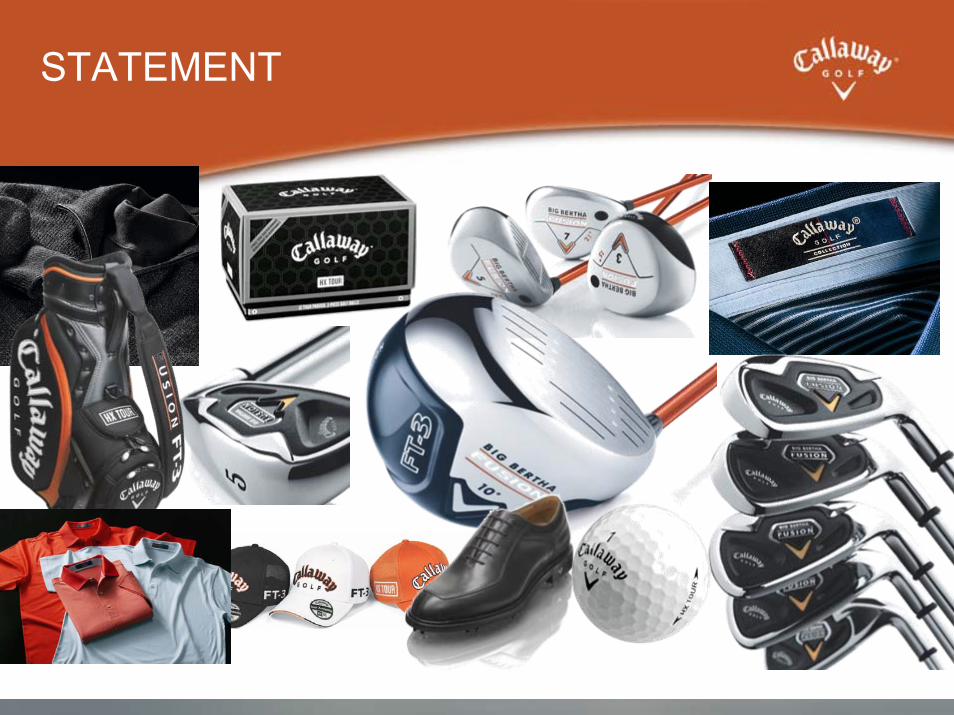
STATEMENT
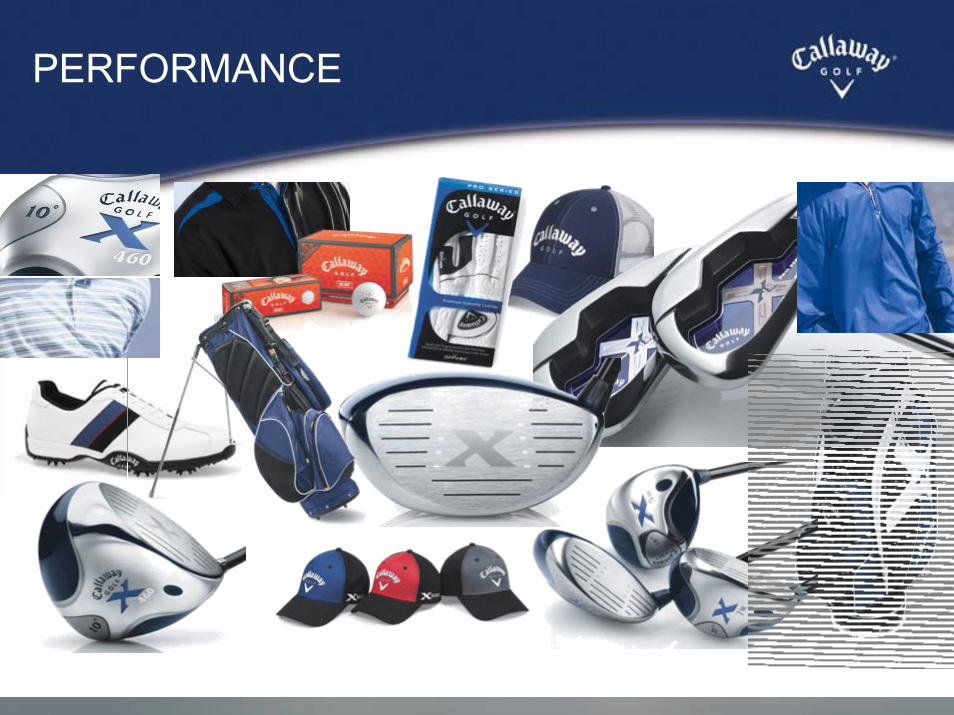
PERFORMANCE
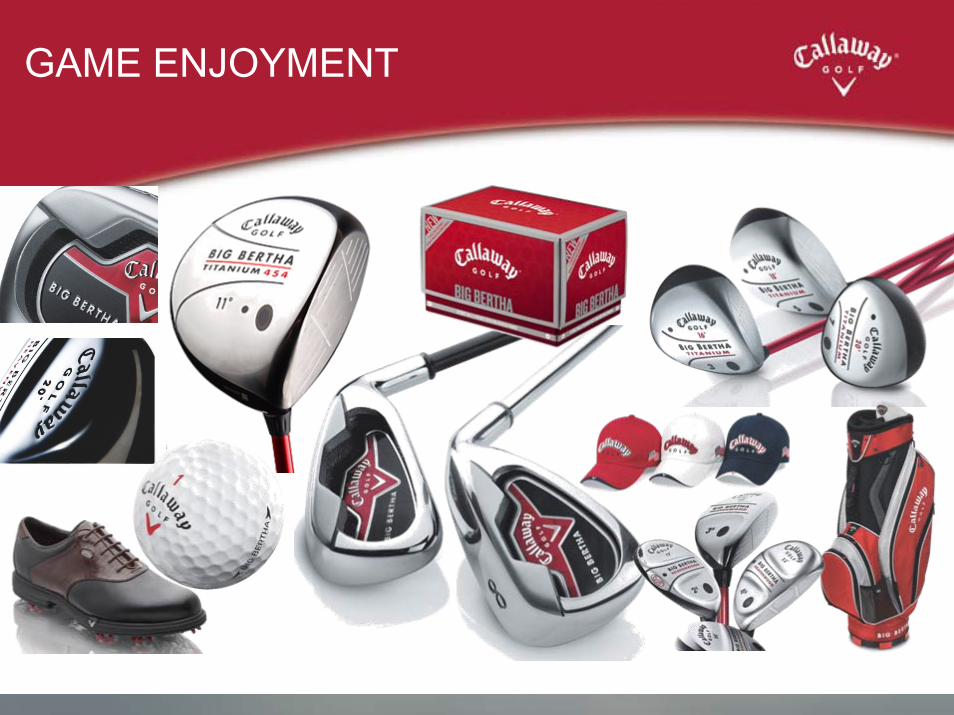
GAME ENJOYMENT
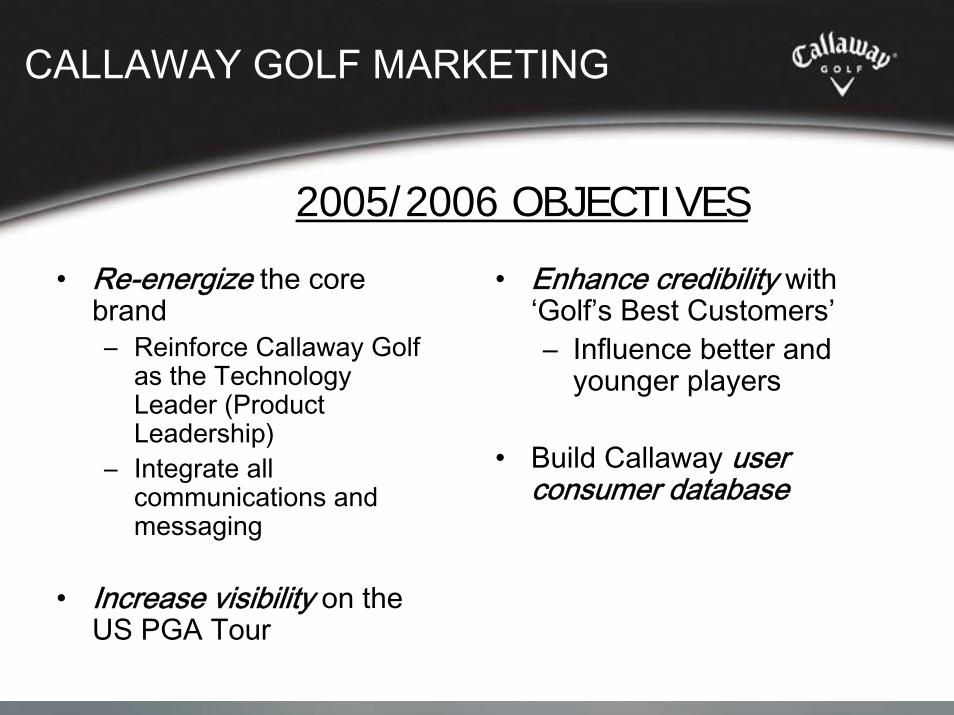
CALLAWAY GOLF MARKETING
• Re-energize the core brand– Reinforce Callaway Golf
as the Technology Leader (Product Leadership)
– Integrate all communications and messaging
• Increase visibility on the US PGA Tour
• Enhance credibility with ‘Golf’s Best Customers’– Influence better and
younger players
• Build Callaway user consumer database
2005/2006 OBJECTIVES


BRAND STATEMENT
To be the #1 putter brand in the world by pushing and challenging putter convention to create magic on the
green.
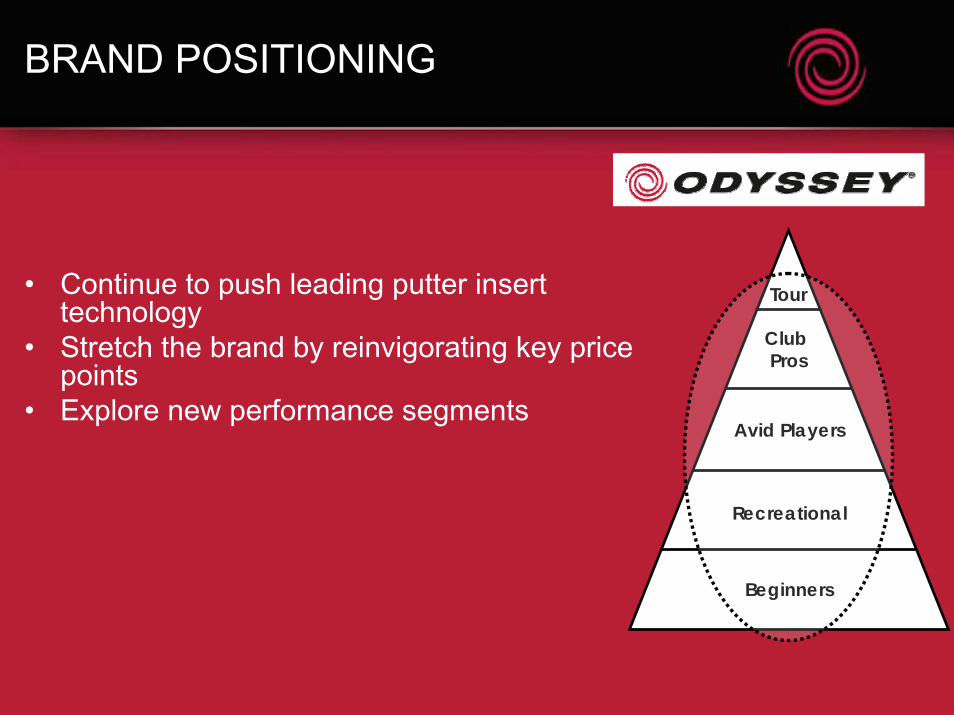
BRAND POSITIONING
Tour
Club Pros
Avid Players
Recreational
Beginners
• Continue to push leading putter insert technology
• Stretch the brand by reinvigorating key price points
• Explore new performance segments

TOP-FLITE

Tour
Club Pros
Avid Players
Recreational
Beginners
The Top-Flite brand appeals to:• The “everyman” golfer who plays the
game for fun• Golfers who still want quality
equipment at value price points • Those with a sense of “anti-establishment”
blue-collar attitude and “bragging rights”attributes (distance)
BRAND POSITIONING

BRAND MISSION
What It Is:
To re-establish Top Flite as the #1 golf ball brand in the value segment
How We’ll Do It With Products:
Through innovative design that provides golfers superior value without sacrificing performance
How We’ll Do It With Marketing:
By connecting with golfers on both an emotional and practical level

BEN HOGAN

BRAND STATEMENT
To create the highest-quality, best looking, and best feeling golf equipment for the most
discerning of golfers

BRAND POSITIONING
Ben Hogan equipment appeals to:• The traditionalist• The aspiring “player”• Those who favor looks, feel and feedback
over forgiveness and game improvement.
Tour
Club Pros
Avid Players
Recreational
Beginners
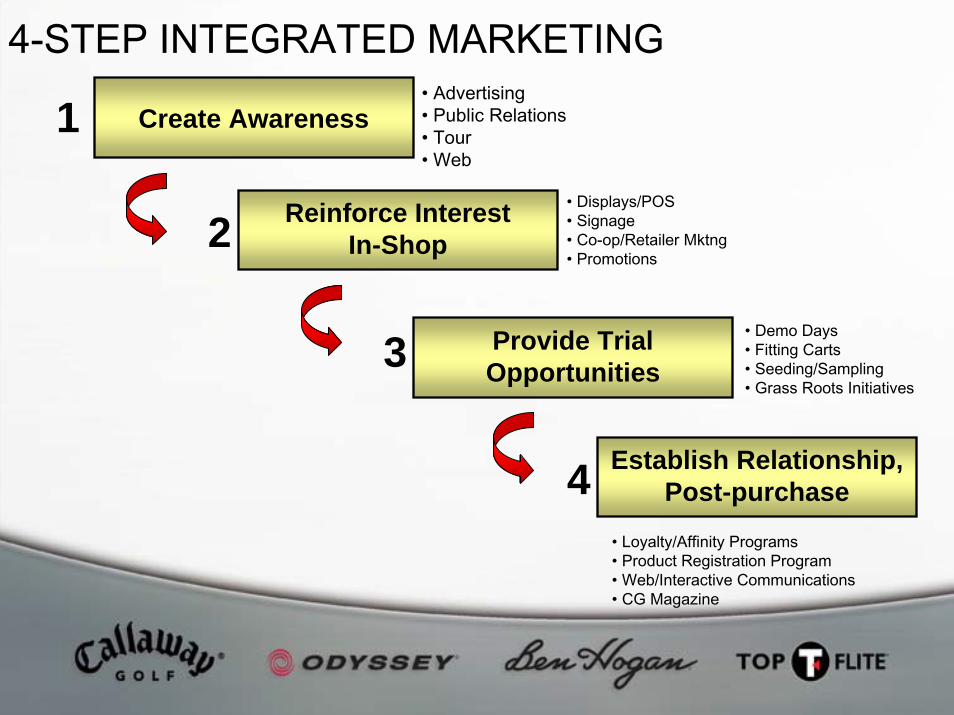
Create Awareness1• Advertising• Public Relations• Tour• Web
Provide Trial Opportunities3
• Demo Days• Fitting Carts• Seeding/Sampling• Grass Roots Initiatives
Reinforce Interest In-Shop2
• Displays/POS• Signage• Co-op/Retailer Mktng• Promotions
Establish Relationship, Post-purchase4
• Loyalty/Affinity Programs• Product Registration Program• Web/Interactive Communications• CG Magazine
4-STEP INTEGRATED MARKETING


Investor Day 2006
Research and Development
Dr Alan HocknellVP, Innovation and Advanced Design

• Innovation and the future health of the game
• What has Callaway Golf offered to earn areputation as an innovator?
• How can Callaway Golf continue to offer the mostinnovative products to consumers ?
Research and Development
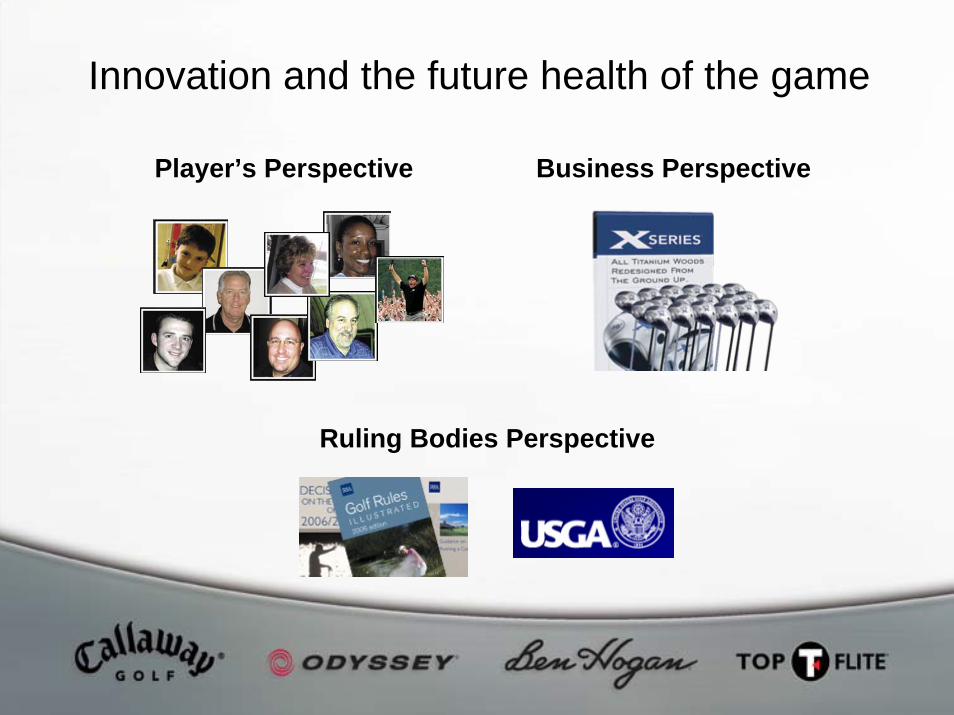
Player’s Perspective Business Perspective
Ruling Bodies Perspective
Innovation and the future health of the game

• Golf is a difficult game and golfers are looking for an edge from their equipment
• We seek to make aspects of the game easier– Appeal to broader segment of the population– Increased enjoyment… Fewer golfers leave the game
• Motivated golfers have reasons to re-invest in themselves– Impulse purchases
• The aspirational effect – golfers want the clubs the Tour Pros and PGA Pros use
Player’s Perspective
Innovation and the future health of the game
Business Perspective• Innovation as part of the Brand Identity
• Innovation as a means to counter Price Compression
Innovation and the future health of the game
a better game by design
Products differentiated from the competition throughtechnology, performance, consumer connection
At the forefront of every major equipment innovationin the last 25 years

Ruling Bodies Perspective• Product Innovation has enabled some of the
observed gains in elite player performance over thelast 20 years
• Product Innovation can be regulated in ways that course setup and player athleticism cannot
• Equipment regulation is a tool to maintain an appropriate skill balance between driving distance, driving accuracy, greens in regulation and putting forelite players
Innovation and the future health of the game
Opportunities in the face of increasing regulation
• Our aim is to make every golfer a better golferThere is room within the rules to appeal to new player types- especially leveraging all 4 Brands
• Our design, analysis, measurement and fabricationtechnologies give us a competitive performance edgein designing right up to the limits of any rules
There is room within the rules to design more of our golf knowledge into our clubs and balls than present
Innovation and the future health of the game

What has Callaway Golf offered to earna reputation as an innovator?

First OversizedTitanium Heads
Screw Weight Technology for shot shaping“Tungsten Gravity Screws”
- 7 Years ago

• Forged Titanium Drivers
• Cup Face Technology
• Hot Face Engineering
Variable Face Thickness2000 onwards
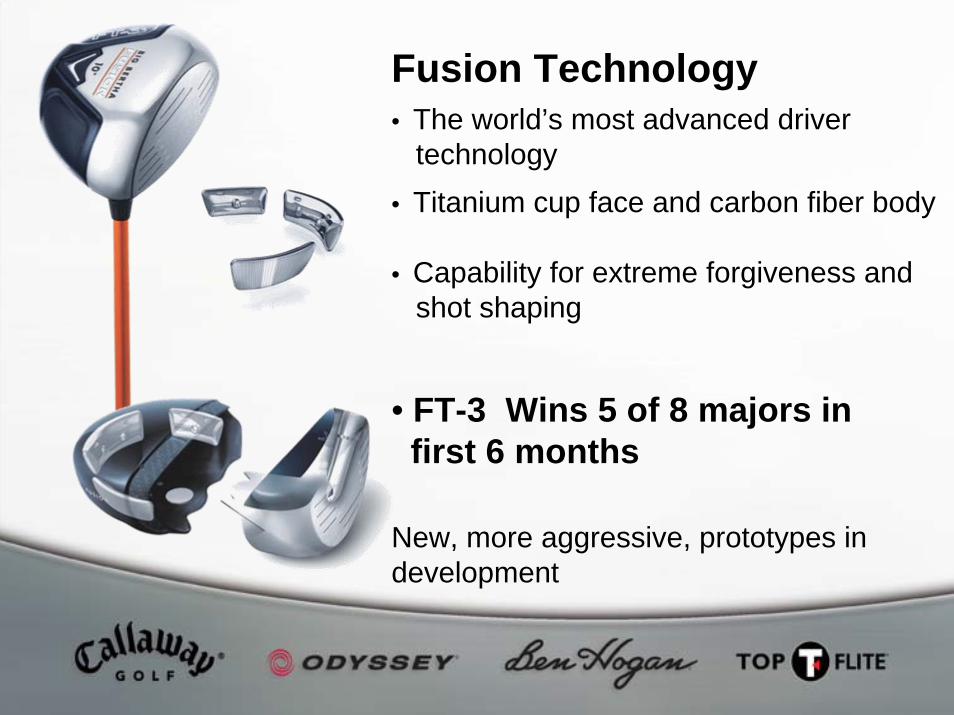
Fusion Technology• The world’s most advanced driver
technology• Titanium cup face and carbon fiber body
• Capability for extreme forgiveness andshot shaping
• FT-3 Wins 5 of 8 majors in first 6 months
New, more aggressive, prototypes in development

Tungsten-Titanium Irons
360 UndercutBore Thru S2H2
Iron Technology
Titanium-Nickel-Tungsten-Polyurethane Irons

Irons Innovationfor differentplayer types
Elite Player
Performance Iron Game Enjoyment

Putter Innovations :Odyssey• Dual Force• White Hot• Tri-Hot• 2-Ball• White-Steel• SRT

Golf Ball Innovation
• Tubular Lattice ‘Hex’ PatternBreakthrough AerodynamicsVisual Differentiation
• 3-Piece Construction TechnologyUltra-Thin Thermoset Urethane Cover
• Measurement ScienceAnalytical and Experimental Tools
Continuous Process Improvement

2004 2005Issued USPatents: 46 41Filed US Patent Applications: 84 73
Issued Worldwide Patents: 94 121Filed Worldwide Patent Applications: 125 164
Global Patent Protection
How can Callaway Golf continue to offerthe most innovative products
to consumers ?

Organization
• Re-Mapped Product Development Process
3 yr Product and Technology Plans
• More effective use of R&D resources
External partnerships in design and technology development
Innovation and Advanced Design Team
Platform approach to technology development
Full pipeline of product

Leverage our Portfolio of Brands
• Greater design freedom using all 4 brands• Embody brand spirit in design

Draw Neutral Fade• Fusion Technology - Extreme weight movement for shot shaping
and forgivenessPerformance equivalent to a larger volume Titanium driver
Use Technology to serve Every Golfer’s Needs

• Higher Ball Speeds from More of the FaceUse Technology to serve Every Golfer’s Needs
• Average Golfers use a lotof the face…
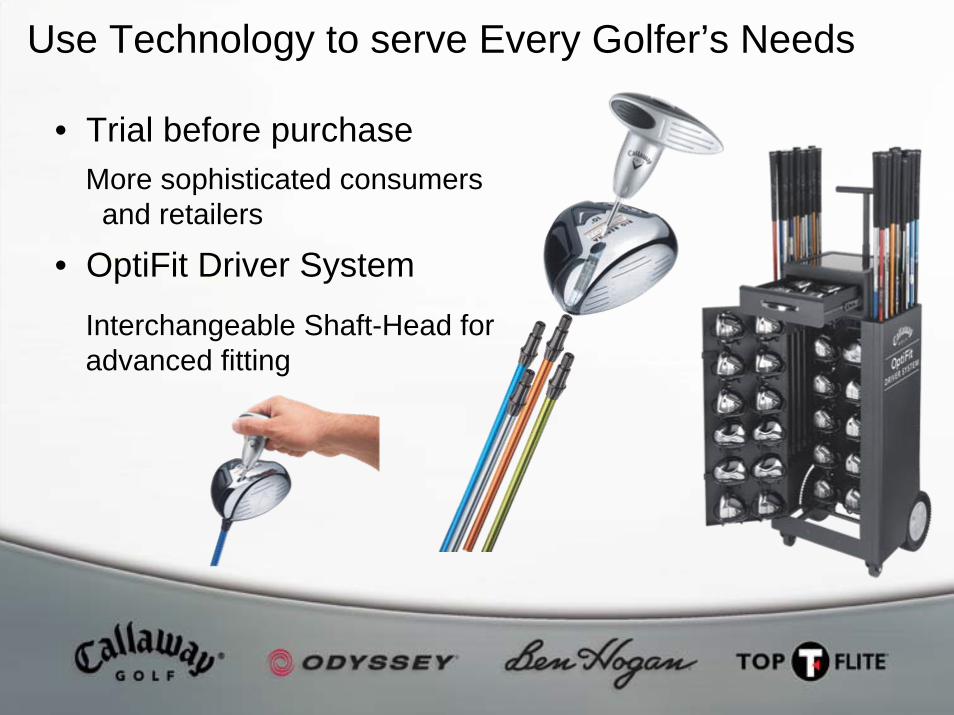
• OptiFit Driver System
• Trial before purchase
Use Technology to serve Every Golfer’s Needs
More sophisticated consumersand retailers
Interchangeable Shaft-Head foradvanced fitting
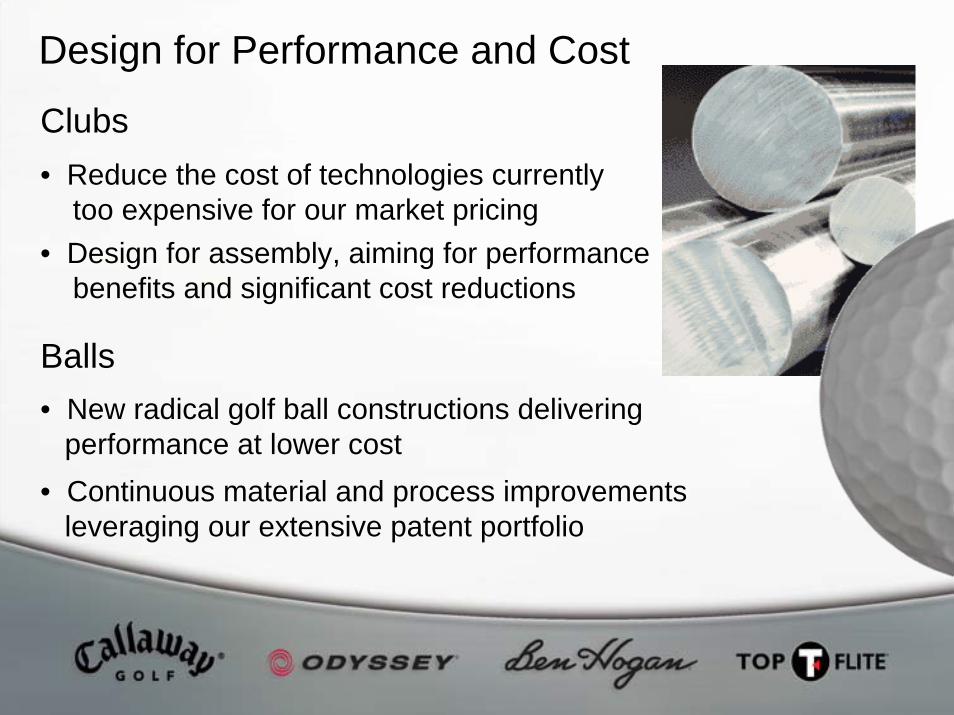
• New radical golf ball constructions deliveringperformance at lower cost
• Reduce the cost of technologies currentlytoo expensive for our market pricing
Design for Performance and Cost
Clubs
Balls
• Design for assembly, aiming for performancebenefits and significant cost reductions
• Continuous material and process improvementsleveraging our extensive patent portfolio

Conclusion
• We will continue to make the Best Ball and Best Clubsin the world
• We have a 3 year strategic product and technology planwhich targets performance improvements and significantcost reductions
• Callaway has a rich history of Product Innovation
• Innovation at Callaway is alive and thriving on the challenges presented by the rules, margin targets and making every golfer a better golfer

We are currently on a short break -the webcast will resume shortly.

Investor Day Manufacturing
Bob PenickaSr. Executive VP, Chief Operations and R & D

2005 – A problematic year• Lean/KanBan Implementation
• Shortages and shipping delays
• $$$ spent to expedite
Supply Chain Update
2006 – Significant improvements implemented• Planning process restored and improved
• Process is forecast driven and dynamic
• Safety Stocks are in place
• Negotiated lead time reductions on critical components
Supply Chain Update
Focus – Service, service, service• Goal – Best in Industry
• Key metrics in place – Great visibility and focus on On-Time Delivery
• Positioned for growth in Custom Order clubs
Supply Chain Update
• Ideation to P.A.R. (Product At Retail)
• Process focus and improvements have yielded:– More capable supply base
– More front end focus in the process
– Successful product launches – PAR and Safety Stocks
Seamless Product Development Process

Sourcing Strategy
Drive margin improvements, protect service levels• Off-shore sources
– High labor content – cost reductions– High volume skus – “A” items– Product launch inventory
• Retain “B” & “C” item manufacturing in U.S.– Component utilization– Quick order turnaround
• Automation and margin improvement plans will change current landscape

Big advances underway . . .• Labor intensive and cumbersome• Automation
– Enabled by new design– Cost reduction– Throughput improvement– Better quality– Best in Class
– Savings significantly in excess of material and labor cost increases
Club Assembly Process
State-of-the-Art and Getting Better• Top-Flite acquisition
– Critical mass– Intellectual property and manufacturing know-how– New technologies
• RIM process is a major break through• Automation projects underway
– RIM– Factory layout/material handling
• Significant margin enhancement opportunities
Golf Ball Manufacturing

Continuous Improvement is our Mission . . .Metrics are our Validation
• On-Time Delivery • Quality • Cost of Goods• Value analysis• Forecast Accuracy• Inventory Utilization


Investor Day
CFO UPDATE
Brad HolidaySr. Executive VP & Chief Financial Officer
85
Financial Performance

2005 Income StatementPro Forma (as of 12/31/05)*
($'s in Millions) Actual Last Year VarianceNet Sales $998.1 $934.6 63.5$ Gross Margin 422.9 374.5 48.4 Gross Margin% 42.4% 40.1%
Total OPEX 385.0 370.7 (14.3) OPEX % 38.6% 39.7%
Operating Income 37.9 3.8 34.1 Op. Income % 3.8% 0.4%
Other Income (2.7) 1.0 (3.7)
Pretax Income 35.3 4.8 30.5 Pretax Income % 3.5% 0.5%
Income Tax Provision 9.1 (2.6) (11.7)
Net Income $26.1 $7.4 18.8$ Net Income % 2.6% 0.8%
EPS @69M shares $0.38 $0.11 0.27$ *Excludes integration and restructuring charges

Working Capital(as of 12/31/05)
($'s in Millions) Actuals Last Year VarianceCash $49.5 $31.7 17.8$ Borrowing - 13.0 (13.0) Net Cash $49.5 $18.7 30.8$
Accounts Receivable $98.1 $105.2 7.1$ Inventory 241.6 181.2 (60.3)A/P and Accrued Expenses 102.1 75.5 26.6Working Capital $237.5 $210.9 (26.6)$
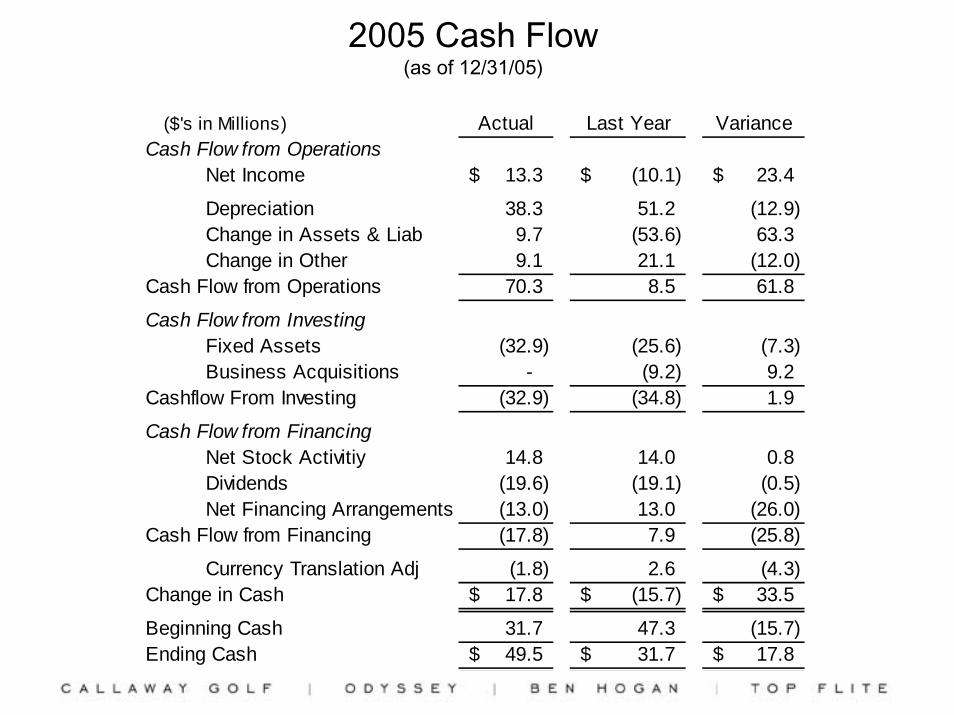
2005 Cash Flow (as of 12/31/05)
($'s in Millions) Actual Last Year VarianceCash Flow from Operations
Net Income 13.3$ (10.1)$ 23.4$
Depreciation 38.3 51.2 (12.9) Change in Assets & Liab 9.7 (53.6) 63.3 Change in Other 9.1 21.1 (12.0)
Cash Flow from Operations 70.3 8.5 61.8
Cash Flow from InvestingFixed Assets (32.9) (25.6) (7.3) Business Acquisitions - (9.2) 9.2
Cashflow From Investing (32.9) (34.8) 1.9
Cash Flow from FinancingNet Stock Activitiy 14.8 14.0 0.8 Dividends (19.6) (19.1) (0.5) Net Financing Arrangements (13.0) 13.0 (26.0)
Cash Flow from Financing (17.8) 7.9 (25.8)
Currency Translation Adj (1.8) 2.6 (4.3) Change in Cash 17.8$ (15.7)$ 33.5$
Beginning Cash 31.7 47.3 (15.7) Ending Cash 49.5$ 31.7$ 17.8$

Three Year Core Business Targets*
• Target will cover four categories– Sales Growth
– Operating Income as a Percent of Sales
– Return on Invested Capital
– Free Cash Flow
*Excludes integration, restructuring and FAS123R charges

Three Year Core Business TargetsSales Growth
• 3 yr growth targeted in mid single digits• How will we accomplish?
– Industry growth driven by new product innovation
– Grow wood market share
– Accelerate growth in Callaway Golf ball business
– Stabilize Top-Flite ball business
– Drive international growth
– Expand licensing/accessories business

Three Year Core Business TargetsSales Growth
Mid-single digits %
• Industry experienced strong growth in ’05 driven by new product innovation
• Long term demographics favor an increase in rounds played as ‘Baby Boomers’retire
• Callaway Golf will benefit from overall Market Growth0%
5%
10%
15%
Indu
stry
G
row
th %
2003 2004 2005
US Golf Industry
Source: Golf Datatech

Three Year Core Business TargetsSales Growth
Mid-single digits %
• Growing Wood Market Share to ’03 levels in 3 years– estimated at $80 to $90
million in global sales• Supply issues
– Contributed to decline, but have been addressed
• New 2006 products– FT3 Driver– FT Hybrid– X460 Driver/FW Woods– Hogan Hybrid
• Product Category Opportunities
24.0%
16.5%
0%
5%
10%
15%
20%
25%
30%
Shar
e %
2003 2005
Callaway Golf US Woods Market Share
7.5%

Three Year Core Business TargetsSales Growth
Mid-single digits %
• Matching ball share growth in 3 years represents $30 to $40 million in global sales
• Callaway line has been gaining momentum
• Premium balls has been fastest growing segment
• Key focus
• Product Category Opportunities
6.0%
10.5%
0%
5%
10%
15%
20%
Shar
e %
2003 2005
Callaway Golf US Ball Market Share
4.5%

Three Year Core Business TargetsSales Growth
Mid-single digits %
• Stabilizing and regaining Top-Flite Market Share to ’03 levels represents $30 to $40 million in sales
• Product Category Opportunities
9.4%
4.6%
0%
5%
10%
15%
Shar
e %
2003 2005
Top-Flite US Ball Market Share
4.8%

Sales Growth OpportunitiesMid-single digit %Summary
• There will be some growth in the overall Global Market– Static share represents sales growth for Callaway Golf
• Growth in specific product categories represent sales growth opportunities
Sales Potential– Grow wood share $80-$90 million– Continued Callaway Golf Ball share growth $30-$40 million– Regain Top-Flite Ball share $30-$40 million– Growth in all other product categories
Irons/wedges/putters/accessories/royalties $50-$60 million

Three Year Core TargetsOperating Income - % of Sales
• Three year target returning to the mid teens
• How do we get there?– Leverage Growth in Sales
– Increased mix of higher margin product (woods)
– Operating Expense Savings
– Gross Margin Improvement

Three Year Core Business TargetsOperating Income - % of Sales
• Three year target returning to the mid teens %

4%
2005
Ope
ratin
g In
com
e %
• Three year target returning to the mid teens %• How do we get there?
Three Year Core Business TargetsOperating Income - % of Sales

4%
2005
Ope
ratin
g In
com
e %
‘06-’08 Sales
Growth Leverage
• Increase in sales will leverage
– COGS fixed costs– Operating Expenses
Will contribute to operating margin improvement
Three Year Core Business TargetsOperating Income - % of Sales
• Three year target returning to the mid teens %• Sales Growth

4%
2005
Ope
ratin
g In
com
e % ’06-’08
Woods Mix
Increase‘06-’08 Sales
Growth Leverage
• Increasing the mix of product sales to higher margin woods will contribute to operating margin improvement
Three Year Core Business TargetsOperating Income - % of Sales
• Three year target returning to the mid teens %• Woods Mix

4%
2005
Ope
ratin
g In
com
e %
’06-’07 Opex
Initiatives’06-’08 Woods
Mix Increase
‘06-’08 Sales
Growth Leverage
• September 29th actions to lower operating expenses contribute to operating margin improvement
• Majority of savings will flow to profit
Three Year Core Business TargetsOperating Income - % of Sales
• Three year target returning to the mid teens %• Operating Expenses
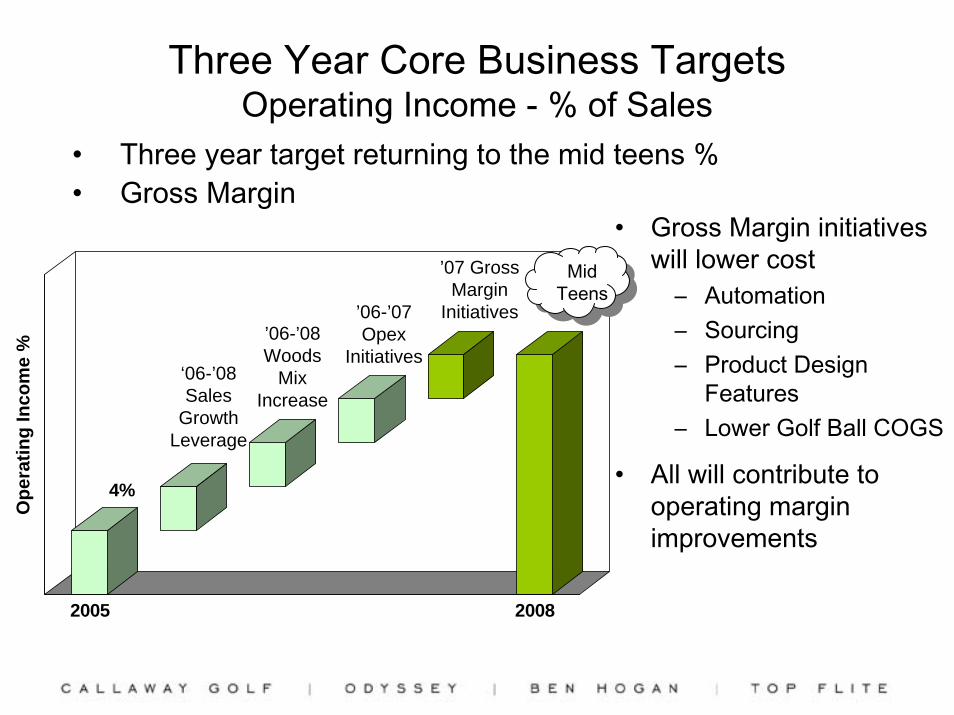
• Gross Margin initiatives will lower cost
– Automation– Sourcing– Product Design
Features– Lower Golf Ball COGS
• All will contribute to operating margin improvements
4%
2005 2008
Ope
ratin
g In
com
e %
’06-’07 Opex
Initiatives
’07 Gross Margin
Initiatives
Three Year Core Business TargetsOperating Income - % of Sales
’06-’08 Woods
Mix Increase
‘06-’08 Sales
Growth Leverage
Mid Teens
• Three year target returning to the mid teens %• Gross Margin

Three Year Core TargetsReturn on Invested Capital
• Three year targeted ROIC in low twenty % range
Definition: Pre-Tax Income/equity + debt
Three Year Core TargetsFree Cash Flow
• Three year targeted Free Cash Flow between $90-120MM annuallyDefinition: Cash Flow from Operations less CAPEX
• Assumes CAPEX and D&A approximately $25MM each

Peer Group Discussion
• Peer Group Definition– Looked for consumer, cyclical, sporting goods companies
who manufacture as well as sell to retail• Peer Groups Used
– Mercer Group– S & P consumer durables and apparel group
• Data Used– Data gathered from Bloomberg– 3 year and 5 year averages
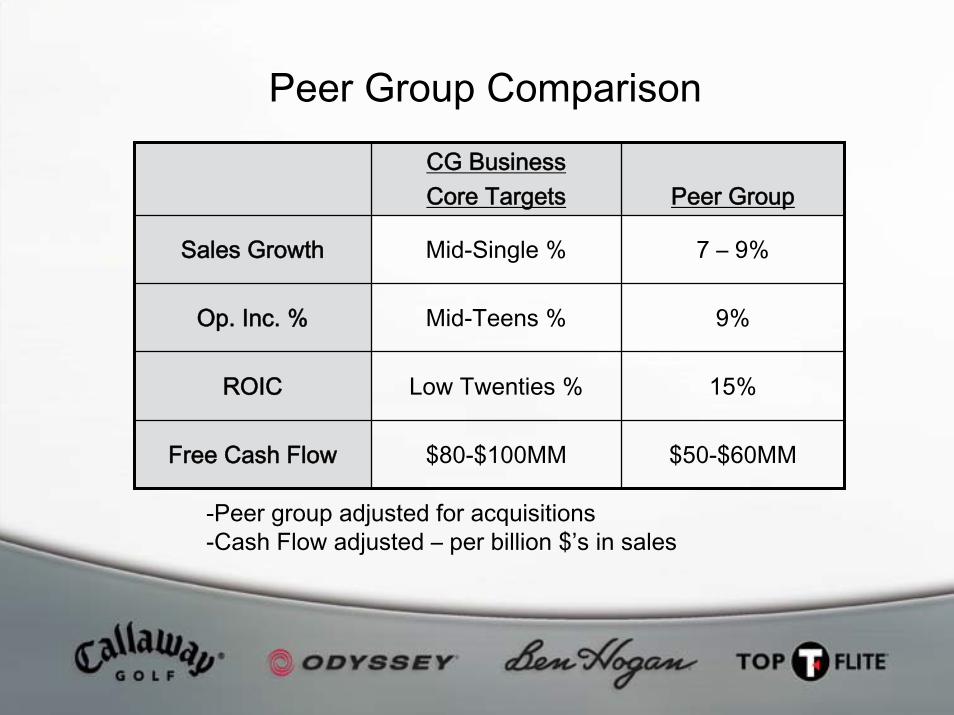
Peer Group ComparisonCG BusinessCore Targets Peer Group
Sales Growth
Op. Inc. %
ROIC
Free Cash Flow
7 – 9%Mid-Single %
Mid-Teens %
Low Twenties %
9%
15%
$80-$100MM $50-$60MM
-Peer group adjusted for acquisitions-Cash Flow adjusted – per billion $’s in sales

Summary• Callaway Golf is and will continue to be an innovation and
technology company• Driving top-line growth remains a priority
– Through consumer focused marketing– Leveraging brand portfolio and aligning with consumer and
channels• Disciplined growth through acquisitions
– Golf centric is priority, but may expand beyond– Bringing skills or other attributes is key
• Committed to increasing shareholder value– Key financial metrics– Share repurchase/other

Q&A