called ‘australian story’ - aofmaofm.gov.au/files/2009/09/12934.pdf · the current status of...
TRANSCRIPT

1
Thank you to Euromoney for inviting me here to speak to you today.
Australia seems truly to have in view the end of its transition out of the global recession and having
only several weeks ago released a Budget that reflects this, it is an opportune time to update the so-
called ‘Australian Story’.
I will use the time available to take you through the three overviews:
The current status of its economic fundamentals;
Its forecast fiscal position; and
The context for the future of the Commonwealth bond market and the main elements of our
program for the coming year.
But let me first give you a snapshot.
The Australian economy is in a strong position with a favourable outlook. Without doubt there are
domestic and international challenges ahead for Australia, but these challenges have been
anticipated and are closely monitored.
The strength of Australia’s economy and financial position are recognised by the fact that it enjoys
‘triple A’ status. Australia is one of only 19 S&P AAA (stable) rated sovereigns in the world and is one
of only seven S&P AAA (stable) rated sovereigns with more than $190 billion of bonds on issue.

2
Although a relatively small population by international standards, it has been growing at an average
annual rate of 1.5 per cent for the past two decades.
Prior to the global recession Australia’s unemployment rate was around 4 per cent, peaked in 2009
at 5.2 per cent, and has now declined to a current level of 4.9 per cent.
Monetary policy was relaxed in Australia ahead of most other countries, and from an overnight cash
rate low of 3 per cent in April 2009, there have been seven rate rises to the current level of
4.75 per cent, with only two increases in the last 12 months. A steady but effective monetary policy
has served Australia well.
Australia will face the challenge of managing inflation in the years ahead with some of that pressure
emerging domestically, but the impact of global inflationary pressures more generally will also
emerge. The current headline rate is at 3.3 per cent (with an underlying rate of 2.3 per cent).
The Australian dollar remains strong at around a post-currency float high. The $AUD has been
gaining a ‘reserve currency’ status and is now the fifth most traded currency – with the $AUD/US
being the fourth most traded currency pair.

3
Recent natural disasters in Australia will have had temporarily held back domestic economic growth.
Together with the impacts of disasters in Japan and NZ, these effects will have taken about ¾ of a
percent off GDP in 2010-11. However a return to above-trend real GDP growth is forecast for the
coming two years and this will be led by a substantial uplift in resource sector investment, together
with growing exports.
Although from a global perspective the post-recession economic recovery is uneven, the favourable
economic outlook for Australia is supported by improving conditions for its major trading partners,
which are expected to grow collectively at 4.5 per cent this year and 5 per cent next year. As the
chart shows, this will contribute to an expected GDP outcome for Australia this year of 3.75 per cent
- with a 4 per cent growth outcome forecast for the coming year.

4
While the strong overall domestic growth for Australia will mask differential performances between
sectors and regions within the country, the main contributors to GDP growth for the coming years
will reflect an expected picture. This chart indicates the significant pick-up in business investment
and modest improvement in household consumption that will contribute to this growth. Also of
significance will be a higher level of exports dominated by non-rural commodities, such as liquefied
natural gas, iron ore and coal. As the Government continues to wind down its stimulatory fiscal
policy, public expenditure will have a sharply reduced contribution to GDP growth.

5
Household consumption declined sharply in Australia during the onset of the global recession. This
was in response to falling incomes, rising unemployment, a large and rapid growth in savings (in
order to reduce outstanding credit balances), and uncertainty at the time for near-term employment
prospects.
That said, the Government responded quickly with fiscal stimulatory measures aimed in large part
directly at households. This action primed a relatively quick recovery in consumption, even if it was
at more modest levels.
In the medium to long-term, a more robust domestic sector will result from stronger household
balance sheets. In the meantime, lower demand for retail sales and consumer services will facilitate
a shift in resources towards the expanding mining and energy sectors in particular.

6
Investment in residential dwellings was highly variable up until 2003, after which growth has been
significantly weaker. A general caution exercised by the household sector in recent years, together
with tightening credit conditions and a slowdown in land releases for residential development, have
all contributed to low growth in housing supply.
The improving outlook that will underpin employment and income growth, and a general
improvement in household confidence, will give rise to a medium-term increase in dwellings
investment. This growth will in part also be due to a lagged response to recent increases in
population growth.

7
A long series of negative trade balances was reversed sharply in 2008-09, due mostly to the large
growth in exports of that time. During the global recession, domestic income and employment
effects resulted in a greater downward impact on imports than did the slowing of export growth. As
a result the current account deficit has narrowed markedly over this period, contracting to about
2 per cent of GDP this year.
Even though this most recent year has been one of rising resource sector export prices and volumes,
large offshore repatriation of mining profits has contributed to a net negative income balance
sufficient to offset the positive trade balance.
A forecast widening of the current account deficit over the near term reflects the expected impact of
a large increase in business investment, particularly in the mining and energy sectors. Households
maintaining high levels of saving, and the Government’s policy to achieve a rapid fiscal
consolidation, will together support national savings.

8
Over the past five to six years Australia has experienced a steep increase in its terms of trade as the
global demand for and the prices of its resources have risen appreciably. This year the terms of
trade will be at an historic high – about twice the average level experienced over the preceding four
decades.
However, the prices of key commodity exports are not expected to remain at current levels, with a
global commodity supply response to this record high demand for resources expected to take effect
over the next two years. While this will begin to dampen Australia’s terms of trade, they are
expected to remain at high levels for quite some time.
In the meantime, the high terms of trade are supporting high national income and domestic
economic growth more broadly.
Together with a strong economic performance (relative to other advanced economies) and
tightening macroeconomic policy, the high terms of trade have provided the circumstances for a
strong appreciation in the $AUD.

9
There is much commentary at present about the reliance of Australia on China and India as rapidly
expanding and emerging economies. As this chart shows, China as an export destination has
increased its share from about 4 per cent in 1990 to over 25 per cent this year. During the same
period Korea’s importance has doubled to about 12 per cent, and India’s has increased almost
five-fold to about 6 per cent.
Japan remains an important trading partner and the outlook is for this to remain the case. Continued
strong growth in China, India and Australia’s Asian trading partners is set to underpin the growth in
demand for exports, to which I have already referred. This part of the Australian story ties closely
with the planned mining capacity and port facility expansions that will facilitate a further uplift in
resource sector exports.

10
The labour market picture in Australia is very healthy, with unemployment peaking at well below an
anticipated global recession high of over 8 per cent. This contrasts with experience in the US, for
example, where substantial job losses over the past two years are only just beginning to abate and
where the current unemployment rate is more than twice that of Australia.
In what is also a very positive sign for the Australian labour market, the participation rate has
continued to rise steadily over the last two years, this reflecting strong confidence about the
prospect for an expanding jobs market.
With a natural unemployment rate in the range of 4.5 - 5 per cent, forecasts for an unemployment
rate of 4.75 per cent in the coming year and 4.5 per cent in 2012-13 indicate tightening labour
market conditions over the coming years. This will become more evident with the expansionary
impact of the uplift in exports.

11
As the labour market tightens, inflationary pressure will build, although forecasts are for inflation to
be contained within a target range of 2-3 per cent. Winding down of the Government’s recent fiscal
stimulus, together with a less accommodating monetary policy will of course moderate these
inflationary pressures.
Inflation over the past decade arose largely from persistent increases in domestic prices for goods
and services. Therefore, a tighter labour market and upward pressure on the costs of health and
utilities in particular will present a renewed inflationary threat. And, while the high $AUD will have a
dampening effect on prices in the tradeable sector, this effect will lessen as wages in emerging
economies increase and a continuation in the international recovery more generally adds to the
global demand for food and other consumables.
As this chart shows, underlying inflation is currently at around a 10-year low of 2.5 per cent but is
forecast to rise to 3 per cent by the end of 2012-13.
The current spike in headline inflation is largely due to the impacts of recent flood and cyclone
devastation of fruit and vegetable crops, together with the influence of higher oil prices.

12
As the chart on relative contributions to GDP growth indicated earlier, Australia will not rely on
export expansion alone for its economic growth in the coming years. Although this will be an
important component, it should be noted that Australia’s economic base is quite diverse and this
provides some protection in times of either domestic or internationally sourced risk.
Population growth in Australia has been steady, with total population having increased by about
25 per cent over the past two decades to a current level of 22.5 million. More than half of this
growth has been in the last decade, with a clear acceleration in growth having occurred between
2004 and 2009.
Continued population growth will be important to support a growing demand for labour and to
maintain a healthy demand for domestic consumption.

13
Domestic savings, consumption and investment are of course reliant on a healthy and robust
financial sector. In this regard Australia’s banking sector has proved to be as resilient, if not the
most resilient, of any banking sector in the world. Australia’s four main domestic banks are well
capitalised and rank amongst the top 10 of the largest 100 global banks – all of these top 10 are
rated AA by S&P.
14
In addition to Australia’s solid economic position, its fiscal and national debt positions are also sound
by international standards. Successive Australian Government’s have set fiscal strategies to guide
and underpin their budget positions, and in turn their exposure to debt.
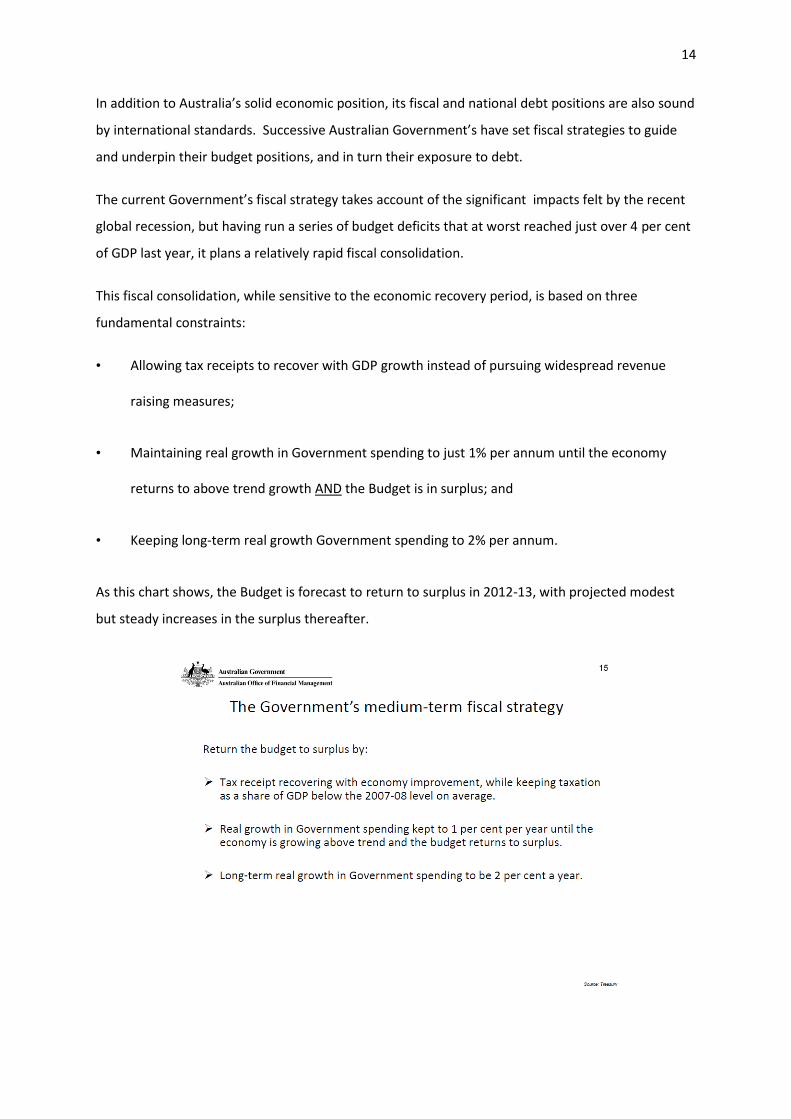
The current Government’s fiscal strategy takes account of the significant impacts felt by the recent
global recession, but having run a series of budget deficits that at worst reached just over 4 per cent
of GDP last year, it plans a relatively rapid fiscal consolidation.
This fiscal consolidation, while sensitive to the economic recovery period, is based on three
fundamental constraints:
• Allowing tax receipts to recover with GDP growth instead of pursuing widespread revenue
raising measures;
• Maintaining real growth in Government spending to just 1% per annum until the economy
returns to above trend growth AND the Budget is in surplus; and
• Keeping long-term real growth Government spending to 2% per annum.
As this chart shows, the Budget is forecast to return to surplus in 2012-13, with projected modest
but steady increases in the surplus thereafter.

15
Australia’s negative net debt position of about 4 per cent of GDP in 2007-08 was very quickly eroded
by the onset of the global recession, with net debt forecast to peak at about 7% of GDP in the
coming year. Current Budget projections, however, show an anticipated return to negative net debt
by 2019-20.
As we can see from this next chart, Australia’s net debt position in global terms is indeed small
reflecting the strong fiscal position Australia had going into the global recession. The fact that it will
remain very low by international standards - and actually decrease during a period in which the debt
positions of many of the major advanced economies will either be maintained at best, or worsen -
also reflects the underlying resilience of the economy and its relatively rapid return to expansion.

16

17
In 2003 the Australian Government reviewed the need to maintain a stock of Commonwealth
Government Bondson issue. It has again reviewed this in light of the experiences arising from the
global recession, and as a result has renewed its commitment to maintain a presence in the bond
market.
In particular it has committed to supporting the 3 and 10 year futures markets; is considering what
stock of gross issuance will promote liquidity, while at the same time supporting new international
banking regulations; and has announced that it will maintain liquidity in the Inflation Indexed Bond
market.
Although a decision is yet to be taken on the future size of the Commonwealth Government Bond
market, careful consideration is being given to a proposal from industry to maintain an ongoing
stock of gross issuance at about 12-14 per cent of GDP. This of course would allow for the market
to grow in line with future expansion of the economy. The Government has also acknowledged that
the opportunity should be taken to extend the government bond yield curve as market demand
allows and to be consistent with prudent sovereign debt management.

18
Following the release of the Commonwealth Budget two weeks ago, the Australian Office of
Financial Management has announced its issuance program for 2011-12.
For nominal bonds this will involve face value gross issuance of $51 billion; with two new mid-curve
bond lines; and the launch of a 15-year bond to occur either this year or next year – depending on
market demand.
The Government’s commitment to maintain about 10-15 per cent of the gross outstanding stock of
bonds as Inflation Indexed Bonds will translate into face value issuance in the coming year of about
$2 billion. However, no new Inflation Indexed Bond lines are planned for 2011-12.
Finally, a minimum of about $10 billion of Treasury Notes will kept on issue so as to support the
market for this paper.

19
Three years ago gross issuance was about $5-6 billion per year. This year Australia’s gross
government bond issuance will be about $55 billion in order to support what was has been a sharply
deteriorating underlying cash deficit. Although gross issuance will peak this year, an annual bond
program of about $30 billion will be required to support the government’s forecast budget position.
In terms of the stock of government bonds, by 30 June this year, it will have increased almost four-
fold in only four years to plateau at just over $200 billion. This will equate to about 15 per cent of
GDP. Through the expected fiscal stability of the years to follow, the gross stock of Commonwealth
Government Bonds on issues will represent between 13-14 per cent of GDP.

20
This chart shows where new nominal government bond issuance has been targeted over the last
three years – with the white bars showing bond line levels at the end of June 2008; the dark blue
bars showing gross issuance last year; and the lighter shaded bars showing gross issuance so far this
year. A new April 2023 line was just launched by tender last week, with other new lines this year
having been the October 2014; the July 2016; and the January 2018.
In terms of Treasury Indexed Bonds a new 2025 line was launched last financial year and a new 2030
line was launched this financial year. Indications from market participants seem to suggest that
bond lines of $4-5 billion are sufficient to maintain liquidity in this segment of the market.

21
I will conclude by pointing out that offshore interest in Australian Government Bonds has been
building steadily and holdings are currently estimated at about 70 per cent. While there was a brief
lag in the pick-up of offshore holdings as the Government bond market expanded quickly in 2009,
the representation of foreign holdings soon recovered to recent previous levels. This would in large
part have been as a result of relatively high yields; Australia’s strong credit standing; the emerging
status of the $AUD as a reserve currency; strong liquidity; and growing prominence more generally
of the Australian Government Bond market in international settings.
Thank you.