the classical theory of inflation and its uses todayirelandp.com/papers/somc201411.pdf ·...
TRANSCRIPT

The Classical Theory of Inflation and Its Uses Today
Peter Ireland Boston College
Shadow Open Market Committee Meeting
New York, New York November 3, 2014

THE CLASSICAL THEORY OF INFLATION AND ITS USES TODAY
Peter Ireland1
Boston College and Shadow Open Market Committee
October 2014
The Classical Theory: Why We Believe In It
The classical theory of inflation attributes sustained price inflation to excessive growth in the
quantity of money in circulation. For this reason, the classical theory is sometimes called the
“quantity theory of money,” even though it is a theory of inflation, not a theory of money.
More specifically, the classical theory of inflation explains how the aggregate price level
gets determined through the interaction between money supply and money demand. As a matter
of fact, because it traces the behavior of an important economy-wide variable – inflation – back
to the most basic forces of supply and demand, the classical theory must qualify as one of the
oldest “microfounded” models in all of macroeconomics!
Figure 1 presents the familiar diagram. The graph measures the quantity of money M
along the horizontal axis and the “price” of money 1/P along the vertical axis. This is the only
tricky part: remembering that because the aggregate price level P measures the number of dollars
that must be exchanged for each proverbial “basket of goods,” its inverse 1/P measures the
number of baskets of goods that must be traded for each dollar. Hence, 1/P is the price or value
of a dollar in real terms.
1 Prepared for the November 2014 SOMC meeting. I would like to thank Michael Belongia for very helpful comments on an early draft of this paper and many useful discussions on topics related to those covered here, while retaining full responsibility for all errors, omissions, and misstatements that remain.

2
In the graph, the money demand curve slopes down. Why? When the dollar price of a
basket of goods goes up, each person must carry more money to make exactly the same
purchases as before. Thus, when 1/P falls, the quantity of money demand rises. This means that
in the graph, the demand curve must move to the right along the horizontal axis as its works its
way down the vertical axis.
Suppose first that the central bank fixes the money supply at some level M0. An initial
equilibrium prevails where money supply equals money demand: the graph shows that this
requires the value of money to equal 1/P0 and hence the aggregate price level to be P0. Suppose
next that the central bank takes policy actions to increase the quantity of money in circulation to
M1. A new equilibrium is reached after the value of money falls to 1/P1 and the price level rises
to P1. This, again, is the key implication of the classical theory: money growth causes inflation.
Thus, the classical theory allows us to think about inflation without any reference to
interest rates, unemployment, or any of the other variables that are more frequently referred to in
popular discussions of inflation and its causes today. This is a big part of what makes the
classical theory of inflation so useful. It recognizes that unemployment may be high or low and
interest rates may be rising or falling – it really doesn’t matter. If the money supply is growing
too fast, inflation results. The classical theory is also useful because it reveals inflation for what
it truly is: a debasement of the currency – an erosion in the purchasing power of money
engineered through deliberate policy actions taken by the central bank.
But as clean and aesthetically pleasing as its microfoundations might be, they are not the
reason we all believe in the classical theory of inflation. Instead, we believe in the classical
theory of inflation because it enjoys more empirical support than any other theory in all of
3
economics, except perhaps for the law of demand, which predicts correctly that when the price of
an individual good goes up, people tend to buy less of it.
In particular, the best and most convincing evidence in support of the classical theory is
presented in famous studies like Sargent’s (1982), which focus on the hyperinflationary episodes
that have occurred in various places in various times throughout world economic history. In each
and every one of these episodes, where inflation rates in excess of 100 percent per year can be
observed, these high rates of inflation are inevitably accompanied by equally high rates of
growth in the money supply. And in each and every one of these episodes, the hyperinflation is
seen to stop as soon as the central bank takes decisive action to restrain the monetary expansion.
Thus, these episodes come close to being controlled, laboratory experiments in which the
independent variable – money growth – is deliberately manipulated holding all else constant and
the dependent variable – inflation – changes in accordance with the predictions of theory.
Money Demand Instability: The Achilles Heel of Monetarism
The empirical success of the classical theory ought to calm those who fear that, as it attempts to
unwind the massive, unconventional policy actions it took to help stabilize the economy in the
aftermath of the financial crisis, the Federal Reserve might allow the US inflation rate to reach
unacceptably high levels. We don’t have to worry about this because, according to the theory, a
noticeable acceleration in the growth rate of the broad monetary aggregates will presage such an
outcome. Federal Open Market Committee members will then receive an early warning signal
that they are falling behind the curve and can act more quickly to renormalize monetary policy,
so that inflation need not overshoot their two percent long-run target.

4
But while history has offered up numerous episodes that confirm the validity and
relevance of the classical theory, painful experience has also shown that the classical theory
serves much less well as a guide for decision-making at the six-week frequency with which
FOMC meetings are held. The biggest challenge to the theory – what Bernanke and Blinder
(1988) call the “Achilles heel of monetarism” – stems from money demand instability: right or
leftward shifts in the money demand curve in figure 1 that generate unwanted volatility in prices
and can, therefore, cause inflation to deviate from target if the central bank keeps the money
supply growing along a fixed, pre-set path. Regrettably, abrupt and often large shifts in
econometric money demand specifications for the US have appeared repeatedly since the days of
the “missing money” chronicled by Goldfeld (1976). For this reason, most economists would
argue – and I would tend to agree – that it would be a bad idea for the Federal Reserve to go back
to announcing specific, numerical targets for money growth the way it did as part of its regular
reporting to Congress before the year 2000.2
Yet, to admit that the FOMC should not tie its meeting-by-meeting decisions too tightly
to high-frequency observations of money growth rates is quite different from saying that the
FOMC should ignore data on money growth altogether. For one thing, alternative approaches to
short-run policymaking that focus on unemployment, the output gap, or other measures of excess
capacity or “slack” – strategies similar, in fact, to those the FOMC seems to have re-adopted
most recently – have failed the Fed before, as work by Orphanides (2003) makes abundantly
2 I hedge here, however, because there are a number of studies, including Belongia (1996) and Hendrickson (2014), that show that much of the discrepancy between the observed behavior of the monetary aggregates and the predictions of monetary theory disappears when the Federal Reserve’s official measures are replaced in econometric models by the Divisia indices described below. Indeed, the main message of Belongia and Ireland (2013, 2014) is that there is no substitute for a careful consideration of money supply and money demand in understanding the full range of effects that monetary policy has on the economy in both the short and long run.

5
clear. And while Belongia and Ireland (2014) confirm that popular interest rate measures do have
significant explanatory power, that paper also shows that measures of broad money growth are
often equally if not more useful in gauging the short-run stance of monetary policy.
Thus, the classical theory of inflation provides a useful cross check. Bergevin and Laidler
(2010) develop this idea further by outlining procedures through which the Bank of Canada
might regularly monitor measures of money growth so as to detect otherwise unseen evidence of
inflationary pressures or early signs of macroeconomic instability. Organized broadly around the
same “two-pillar” approach to policymaking espoused by the European Central Bank, Bergevin
and Laidler’s strategy begins with what have become the standard procedures for short-run
policymaking by central banks around the world by consulting a wide range of macroeconomic
variables including output, unemployment, and wage and price indicators to guide the adjustment
of a short-term policy rate. But, to those standard procedures, Bergevin and Laidler add a
separate analysis of monetary conditions that culminates in the setting of a “reference value” for
money growth believed to be consistent with the central bank’s longer-run objectives for
inflation. As Bergevin and Laidler carefully emphasize, deviations of actual money growth from
the reference value need not trigger policy actions different from those called for by standard
macroeconomic analyses, but they ought to be noted and discussed, to make sure that all useful
information has been accounted for and that policy remains firmly on course.
Bergevin and Laidler’s approach is open-minded and recognizes that there is great value
in state-of-the-art economic research and econometric modeling. Yet, it also reaffirms the
enduring usefulness of the much older and more traditional classical theory of inflation. Several
very recent experiences, described next, suggest strongly that the Fed would benefit greatly from
adopting a similar, more balanced approach to policymaking.
6
The Great Recession and Slow Recovery
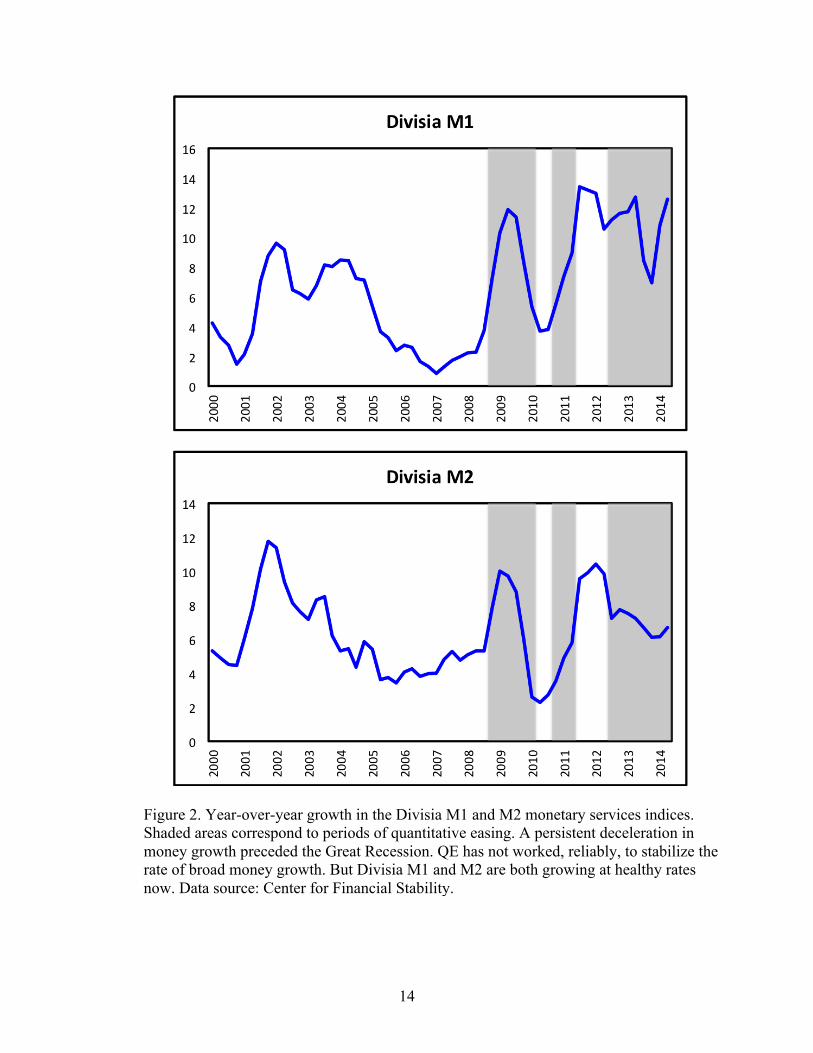
The two graphs in figure 2 plot year-over-year growth rates of the Divisia M1 and M2 monetary
aggregates made available by William Barnett through the Center for Financial Stability’s
website and described in more detail by Barnett et al. (2013). Although the assets included in
each Divisia index – currency and checking deposits in M1 and currency, checking deposits, and
savings deposits in M2 – are the same as those comprising the Federal Reserve’s official M1 and
M2 aggregates, the Divisia indices weight each component in proportion to the flow of
“monetary services” it provides. In practice, this flow of monetary services gets captured by the
spread between the rate of return offered by an illiquid “benchmark” asset and the interest rate
paid each monetary asset itself, measuring the opportunity cost that consumers incur when they
choose to hold that monetary asset.3
Strikingly, both Divisia aggregates – but especially Divisia M1, which Belongia and
Ireland (2013) find to be quite highly correlated with subsequent movements in aggregate output
and prices in recent years – show a marked deceleration in growth over the period from 2004
through 2007. The classical theory of inflation, when combined with this observation of slowing
money growth, suggests that Federal Reserve policy may have been a nontrivial source of
disinflationary pressure even before the financial crisis of 2007-2008 and the Great Recession
that followed. It is really too bad that no one noticed this at the time it was happening.4
3 An excellent and highly readable book by Barnett (2012) outlines in detail the logic behind his development of the theory of Divisia monetary aggregation and reviews the extensive literature documenting the improved empirical performance of the Divisia aggregates over the official “simple-sum” measures in capturing the effects of monetary policy on the economy as a whole. 4 Actually, Jack Tatom (2006) did, and history has now provided an answer to the question posed rhetorically by the title of his paper: “Money Growth Has Slowed Sharply—Should Anybody Care?”

7
In hindsight, though, the graphs in figure 1 provide further support for arguments in
Ireland (2011), Tatom (2011), Barnett (2012), and Hetzel (2012), all pointing to monetary policy
itself as a significant factor contributing to the onset of the most recent recession. As Hetzel
(2012) makes clear, this subtle shift in emphasis has much broader implications. Popular
accounts depict the financial crisis as yet another manifestation of the instability and irrationality
that, the stories say, inevitably plague a free market economy. But evidence points, instead, to a
highly unfortunate combination of policy mistakes, including but of course not limited to
monetary policy mistakes, that disrupted what would have otherwise been more stable and
efficient financial and housing markets.
The two panels of figure 2 also reveal that after rebounding strongly in 2008 and early
2009, most likely in response to the Federal Reserve’s initial response to the financial crisis,
growth in both Divisia aggregates plummeted in late 2009 and 2010. In retrospect, the Fed
appears to have pulled back from its expansionary policies too quickly. Once again, the classical
theory of inflation offers a new perspective on recent events. The slow inflation and sluggish
growth experienced throughout much of the recovery from the Great Recession partly reflect the
effects of a monetary policy that, in hindsight, was insufficiently accommodative in the face of
what surely was a sharp increase in the demand for safe and highly liquid monetary assets. They
are not necessarily symptoms of the kind of “secular stagnation” that, for many popular
observers, seem to spell the end of an age of American prosperity.5
5 Along these same lines, it is worth noting that the last time theories of secular stagnation enjoyed the widespread popularity they have today was in the aftermath of the Great Depression. Thanks to Friedman and Schwartz (1963), however, we now know that the Depression was also the result of a series of terrible policy mistakes, not an inevitable failure of the capitalist system. And, of course, the American economy’s exceptionally strong performance of during the 1950s and 1960s also helped put those earlier fears of long-term stagnation to rest. Here is a prediction: years from now, much of today’s handwringing over secular stagnation will seem as laughably

8
Interest on Reserves
The shaded areas in the graphs from figure 2 mark periods during which the Federal Reserve
conducted its three waves of large-scale asset purchases, or “quantitative easing,” during and
after the financial crisis. These massive bond-buying programs have expanded the Fed’s balance
sheet enormously: the quantity of reserves supplied to the banking system increased from
slightly less than $46 billion to over $2.8 trillion – that is, by a factor of more than 60 – between
August 2008 and August 2014. The graphs confirm that QE did work, over a multi-year period,
to generate enough growth in the broad monetary aggregates to avoid a period of sustained price
deflation. And yet, the graphs also suggest that QE has proven less than fully reliable, as money
growth rates have displayed considerably volatility since 2008 and appear to have fallen almost
as frequently as they have risen during periods of active bond buying.
Why didn’t QE produce more consistent growth in the broad monetary aggregates? Once
again, the classical theory of inflation, with its emphasis on the interaction between money
supply and money demand, helps us understand. Since October 2008, the Federal Reserve has
been paying interest on bank reserves, often at rates above those offered by other safe and highly
liquid assets like US Treasury bills. As Goodfriend (2002) emphasizes, the ability to manipulate
the interest rate paid on reserves provides the central bank with a new and valuable tool that
allows it to influence the demand for as well as the supply of base money. The Fed’s recent
experiments highlight just how powerful this new tool can be. By first lowering the federal funds
rate to a level close to zero and then paying interest on reserves at rate that is slightly higher, the
Fed has generated a massive rightward shift in the demand curve for reserves. Quantitative
easing has worked to shift the supply curve far to the right, too, but much of this increased
overdone as some of the most gloriously optimistic forecasts from the late 1990s – e.g., “Dow 36000” – do today. For a related, pre-crisis discussion, see Fogel (2005).

9
supply simply accommodates the increased demand, without strong effects on the broader
monetary aggregates or inflation.
Considerations like these will remain important if the Federal Reserve, as expected,
manages actively both its traditional federal funds rate target and the interest rate it pays on
reserves as it gradually shrinks its balance sheet and renormalizes its policies in the years to
come. As Ireland (2014) explains in more detail, far from making quantity-theoretic reasoning
obsolete, policy strategies that involve the payment of interest on reserves actually enhance the
relevance of the Marshallian framework that pays attention to both the supply of and demand for
reserves and other monetary assets.
Europe and United States Today
To provide a final example highlighting just how useful the classical theory of inflation can be,
figure 3 plots the year-over-year growth rate of the official M3 monetary aggregate for the Euro
area. Observations of short-term interest rates close to zero are invoked, almost invariably, to
support popular assertions that monetary policy in Europe, as in the United States, has been
extraordinarily accommodative throughout the years since 2008. But whereas figure 2 suggests
that this popular view has been sometimes incorrect for the US, figure 3 shows that it has been
quite consistently incorrect for the EA where, instead, monetary policy has been and remains
extraordinarily tight. In fact, the European Central Bank allowed the money growth rate to fall
by more than 10 percentage points between 2007 and 2009, and unlike the case of the US, broad
money growth has yet to recover in the EA. This is disappointing and more than a bit ironic,
given the ECB’s claimed commitment to its second, monetary “pillar.”
10
These events bring the lessons of Friedman and Schwartz (1963) back to mind. During
the Great Depression, low nominal interest rates were not a sign of expansionary monetary
policy; instead, they were the product of deflationary expectations, which made investors willing
to hold bonds despite those low rates. In such circumstances, Friedman and Schwartz’s
observations of slow money growth and even outright monetary contraction provide the more
reliable signal that monetary policy was far too tight.
Thankfully, the Great Recession has not been nearly as severe as the Great Depression,
either here or in Europe. But figures 2 and 3 make clear that similar monetary dynamics have
appeared. The classical theory of inflation predicts that Europe’s economies will continue to
experience very low rates of inflation until the ECB re-acknowledges the value of its monetary
pillar and finds alternative policies that lead to more robust growth in the broader monetary
aggregates. In the meantime, Europe’s recovery will continue to lag our own.
Turning back to figure 2 for the US, however, we see that broad measures of money have
grown at healthy rates for several years now. QE has done its job, and the Fed can continue to
normalize its policies as the economic recovery strengthens. Looking forward, these same
measures of money growth can be used, with the classical theory in mind, to help confirm that
Fed policy remains on track. A sharp acceleration in money growth would be a clear warning
sign that the Fed has fallen behind the curve and needs to act faster to prevent inflation from
overshooting the two percent target. A noticeable decline in money growth, on the other hand,
would give the FOMC good reason to pause, so as to avoid an overly rushed exit that threatens
the economy recovery, too.
For now, however, believers in the classical theory of inflation are optimistic. In the data,
we see clear signs of better times ahead.
11
References
Barnett, William A, Jia Liu, Ryan S. Mattson, and Jeff van den Noort. “The New CFS Divisia
Monetary Aggregates: Design, Construction, and Data Sources.” Open Economies
Review 24 (February 2013): 101-124.
Barnett, William A. Getting It Wrong: How Faulty Monetary Statistics Undermine the Fed, the
Financial System, and the Economy. Cambridge: MIT Press, 2012.
Belongia, Michael T. “Money Matters: Recent Results from Monetary Economics Reexamined.”
Journal of Political Economy 104 (October 1996): 1065-1083.
Belongia, Michael T. and Peter N. Ireland. “Instability: Monetary and Real.” Working Paper
830. Chestnut Hill: Boston College, Department of Economics, August 2013.
Belongia, Michael T. and Peter N. Ireland. “Interest Rates and Money in the Measurement of
Monetary Policy.” Working Paper 20134. Cambridge: National Bureau of Economic
Research, May 2014.
Bergevin, Philippe and David Laidler. “Putting Money Back into Monetary Policy: A Monetary
Anchor for Price and Financial Stability.” Commentary 312. Toronto: C.D. Howe
Institute, October 2010.
Bernanke, Ben S. and Alan S. Blinder. “Credit, Money, and Aggregate Demand.” American
Economic Review 78 (May 1988): 435-439.
Fogel, Robert W. “Reconsidering Expectations of Economic Growth After World War II from
the Perspective of 2004.” IMF Staff Papers 52 (Special Issue 2005): 6-14.
Friedman, Milton and Anna J. Schwartz. A Monetary History of the United States, 1867-1960.
Princeton: Princeton University Press, 1963.

12
Goldfeld, Stephen M. “The Case of the Missing Money.” Brookings Papers on Economic
Activity (1976, Issue 3): 683-730.
Goodfriend, Marvin. “Interest on Reserves and Monetary Policy.” Federal Reserve Bank of New
York Economic Policy Review 8 (May 2002): 77-84.
Hendrickson, Joshua R. “Redundancy or Mismeasurement? A Reappraisal of Money.”
Macroeconomic Dynamics 18 (October 2014): 1437-1465.
Hetzel, Robert L. The Great Recession: Market Failure or Policy Failure? Cambridge:
Cambridge University Press, 2012.
Ireland, Peter N. “A New Keynesian Perspective on the Great Recession.” Journal of Money,
Credit, and Banking 43 (February 2011): 31-54.
Ireland, Peter N. “The Macroeconomic Effects of Interest on Reserves.” Macroeconomic
Dynamics 18 (September 2014): 1271-1312.
Orphanides, Athanasios. “The Quest for Prosperity Without Inflation.” Journal of Monetary
Economics 50 (April 2003): 633-663.
Sargent, Thomas J. “The Ends of Four Big Inflations.” In Robert E. Hall, Ed. Inflation: Causes
and Effects. Chicago: University of Chicago Press, 1982.
Tatom, John A. “Money Growth Has Slowed Sharply—Should Anybody Care?” Paper 17780.
Munich: Munich Personal RePEc Archive, November 2006.
Tatom, John A. “U.S. Monetary Policy in Disarray.” Working Paper 2011-WP-11. Terre Haute:
Indiana State University, Networks Financial Institute, August 2011.

13
Figure 1. The classical theory of inflation associates an increase in the supply of money with a decrease in the value of money and thereby implies that money growth causes inflation.
14
Figure 2. Year-over-year growth in the Divisia M1 and M2 monetary services indices. Shaded areas correspond to periods of quantitative easing. A persistent deceleration in money growth preceded the Great Recession. QE has not worked, reliably, to stabilize the rate of broad money growth. But Divisia M1 and M2 are both growing at healthy rates now. Data source: Center for Financial Stability.

15
Figure 3. Year-over-year growth in the Euro Area M3 money supply. What happens when a central bank allows the money growth rate to decline by more than 10 percentage points over a two-year period? What happens when the money stock shows almost no growth for a five-year period? Is it really a surprise that Europe is experiencing a prolonged, deflationary recession? Data source: Federal Reserve Bank of St. Louis, FRED database.