cambridge city council older persons tenant survey … · cambridge city council older persons...
TRANSCRIPT
1
Cambridge City Council Older Persons
Tenant Survey July 2014 Survey Report
Analysis and report by
NWA Social Research
2
Cambridge City Council Older Persons Tenant Survey July 2014
Survey Report
Contents
Page No.
1 KEY FINDINGS .................................................................................................. 3
2 BACKGROUND, OBJECTIVES & METHODOLOGY ................................................ 7
SURVEY FINDINGS
3 OVERALL SATISFACTION WITH SERVICES .......................................................... 9
4 VALUE FOR MONEY .......................................................................................... 11
5 REPAIRS ........................................................................................................... 14
6 YOUR ESTATE AND NEIGHBOURHOOD ............................................................. 18
7 INFLUENCING YOUR HOUSING SERVICE ............................................................ 20
8 COMPLAINTS ................................................................................................... 22
9 CONTACTING THE COUNCIL .............................................................................. 24
10 PRIORITIES FOR THE FUTURE ............................................................................ 26
11 ABOUT YOU ..................................................................................................... 28
Appendix 1B Copy of questionnaire marked-up with top-line findings
Appendix 2B Tables of frequencies
Appendix 3B Tables of results
Appendix 4B Responses to open questions
3
1. KEY FINDINGS
OVERALL SATISFACTION WITH SERVICES
1.1 Over 90% of all respondents were 'satisfied' with the 'services provided by landlord'
(94.6%), 'neighbourhood as a place to live' (93.5%), 'quality of your home' (92.8%) and
'condition of your home' (92.2%).
1.2 Agreement relating to terms of tenancy was highest for the statements:
'I understand my responsibilities as a Council tenant' (98.0%),
'My landlord has friendly, approachable staff' (94.5%).
1.3 These were followed by:
‘It is easy to contact my landlord' (93.4%);
'I understand what to expect from my landlord' (92.4%);
'I understand my rights as a Council tenant' (92.0%);
'My landlord treats tenants fairly' (91.7%), and;
'I know how to access Council housing services' (91.5%).
1.4 82.0% of respondents to the Older People's survey agreed that 'my landlord listens to my
views', with 79.4% agreeing that 'I can afford my rent' which saw the highest percentage
of 'disagree' responses (7.9%: 5.3% 'somewhat'/2.6% 'strongly disagree').
1.5 Agreement was lowest in relation to the statement: 'my landlord acts on my views'
(77.5%).
1.6 94.0% of respondents indicated that they are 'satisfied' with the service provided by their
landlord.
VALUE FOR MONEY
1.7 Four-in-five, or more, respondents expressed satisfaction with four aspects of their
tenancy in terms of ‘value for money’, with satisfaction being highest in relation to ‘the
clarity of information you get from the Council about how your rent and service charges
are set’ (88.4%) and ‘that your rent provides value for money’ (86.9%).
1.8 85.5% expressed satisfaction with ‘the advice and support you receive from the Council
for paying rent and service charges or managing your finances’ while satisfaction was
lowest in relation to service charges providing ‘value for money’ (80.0%).
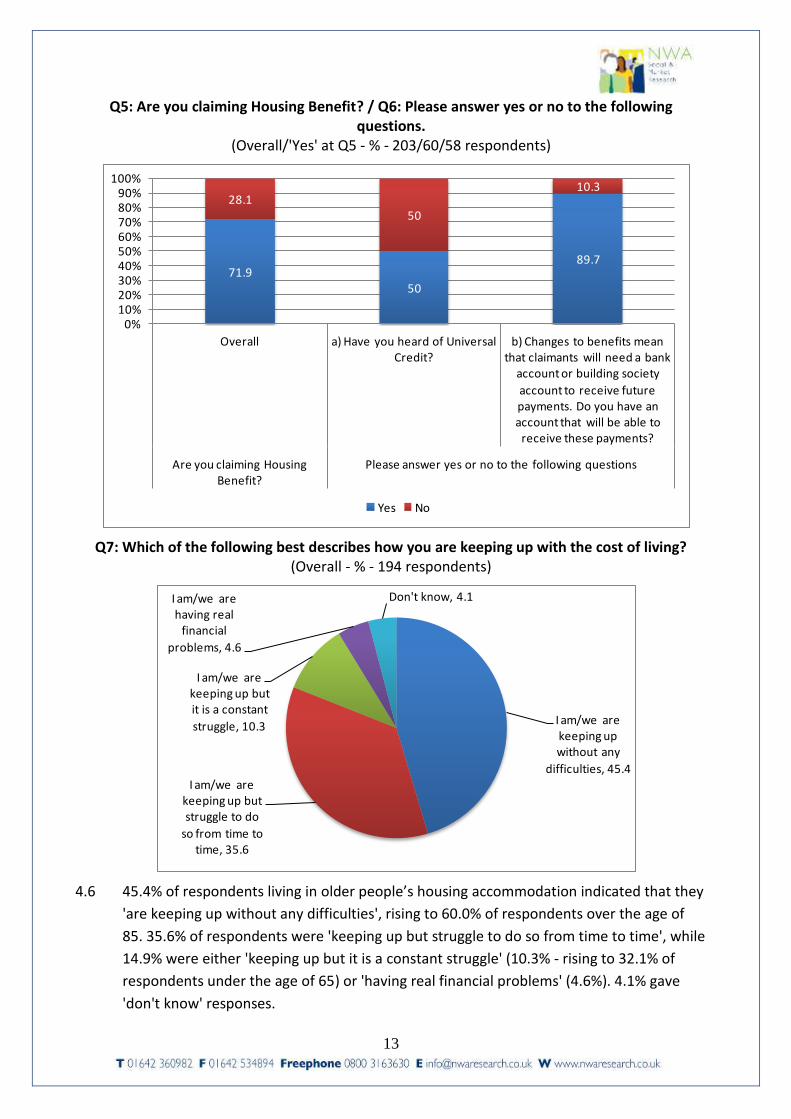
1.9 71.9% of respondents indicated that they are currently claiming Housing Benefit. 50.0% of
respondents in receipt of Housing Benefit have heard of Universal Credit, with nine-in-ten
respondents in receipt of Housing Benefit indicating that they have a bank or building
society account in order to receive future payments (89.7% 'yes').
4
1.10 45.4% of respondents living in sheltered accommodation indicated that they 'are keeping
up without any difficulties'. 35.6% of respondents were 'keeping up but struggle to do so
from time to time', while 14.9% were either 'keeping up but it is a constant struggle'
(10.3%) or 'having real financial problems' (4.6%). 4.1% gave 'don't know' responses.
REPAIRS
1.11 56.2% of respondents had ordered a repair to their property in the last year.
1.12 Amongst respondents who had had a repair completed in the previous 12 months,
satisfaction was highest in relation to 'attitude of workers' (94.6%) and 'being told when
workers would call' (92.7%), while nine-in-ten respondents were satisfied with the 'quality
of repair work' (90.0%). Satisfaction only fell below 90% in relation to the 'speed of
completion of work' (88.1%) and 'time taken before work started' (85.5%).
1.13 Nine-in-ten respondents were 'satisfied' (90.0%) with the repairs service provided by
Cambridge City Council.
1.14 Over half of all respondents selected 'improvements to pathways' (53.4%) as their first
priority for their neighbourhood, while 19.8% selected 'security measures' as their first
priority. Third most selected as respondents' first priority were 'estate lighting' (7.6%) and
'car parking facilities' (7.6%).
1.15 Most selected as either 'very' or 'fairly important' services were:
'Adaptations for people with disabilities' (97.3%);
'Energy efficiency improvements' (91.1%), and;
‘Regular external repairs and decoration' (87.3%).
1.16 These were followed by:
'Installing new bathrooms' (76.1%);
‘Installing new central heating systems' (74.6%);
‘Installing new kitchens' (71.9%);
‘Installing new windows' (62.8%), and;
‘Making structural improvements' (60.7%).
1.17 Least selected as being important were 'installing new doors' (57.8%) and 'fencing'
(55.4%).
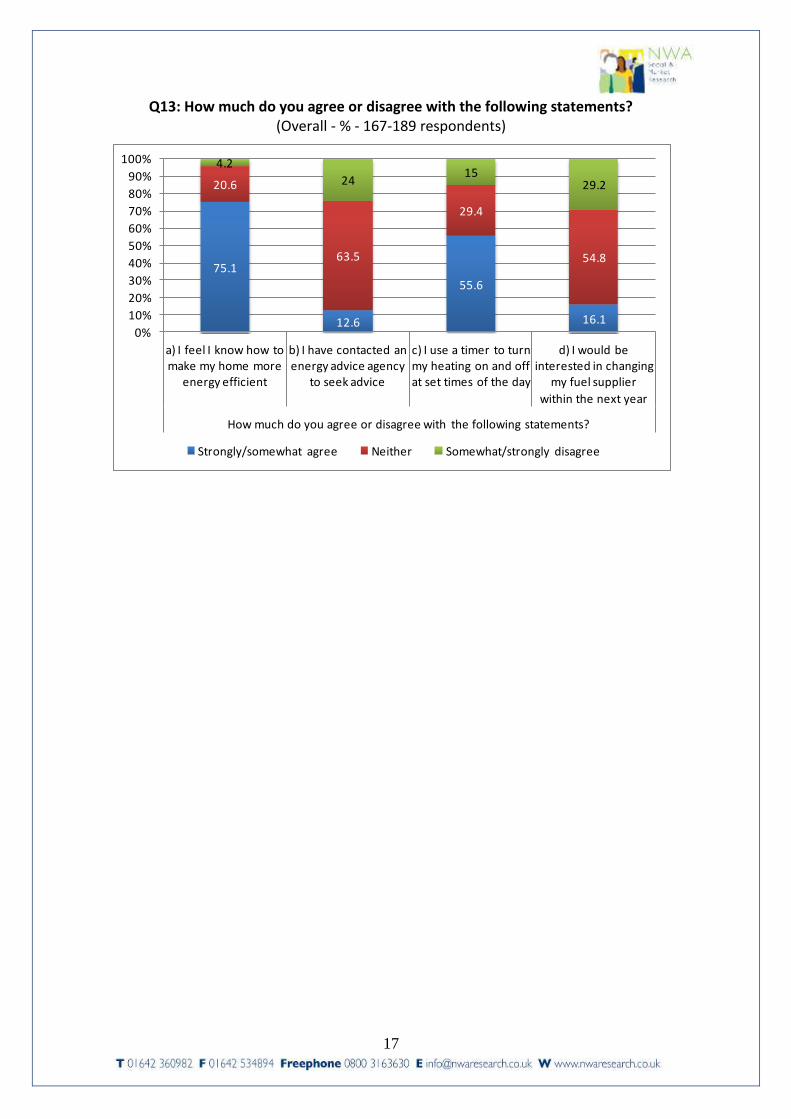
1.18 When asked to give their level of agreement relating to four statements regarding energy
efficiency, agreement was highest relating to the statement: 'I feel I know how to make
my home more energy efficient' (75.1%). Over half gave 'agree' responses to the
statement - 'I use a timer to turn my heating on and off at set times of the day' (55.6%) -
while agreement was lowest in relation to the statements: 'I would be interested in
5
changing my fuel supplier within the next year' (16.1%) and; 'I have contacted an energy
advice agency to seek advice' (12.6%).
YOUR ESTATE AND NEIGHBOURHOOD
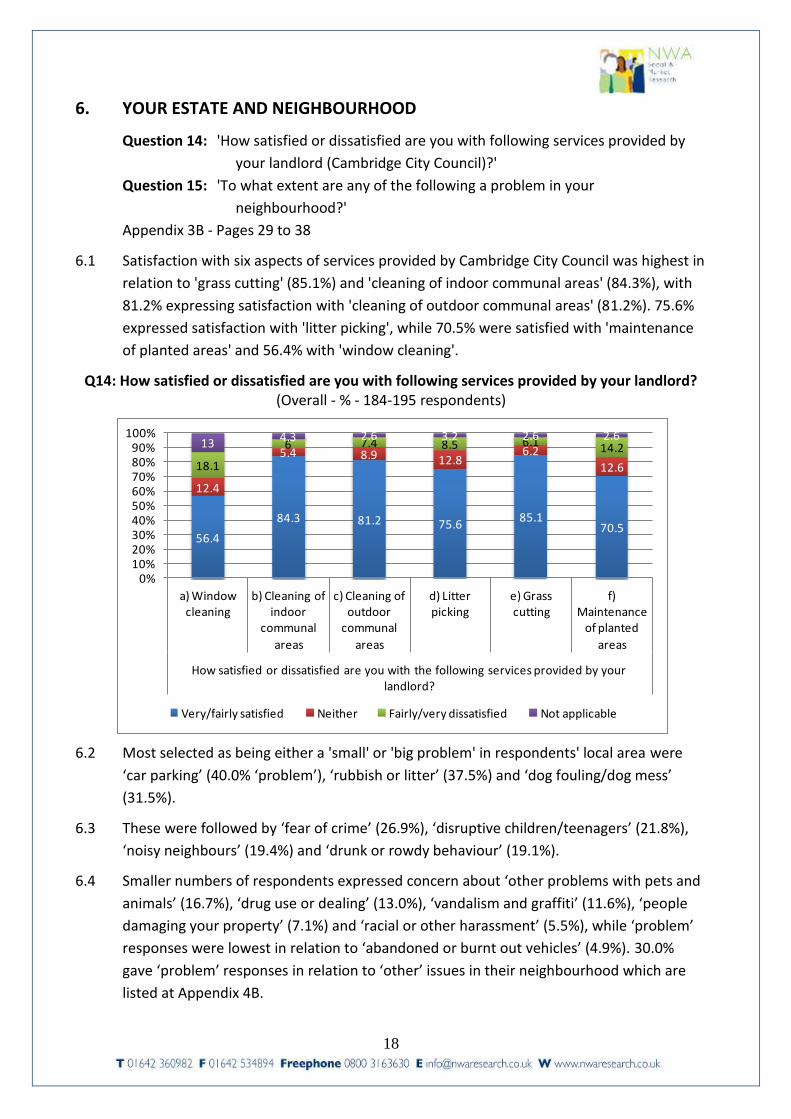
1.19 Satisfaction with six aspects of services provided by Cambridge City Council was highest in
relation to 'grass cutting' (85.1%) and 'cleaning of indoor communal areas' (84.3%), with
81.2% expressing satisfaction with 'cleaning of outdoor communal areas' (81.2%). 75.6%
expressed satisfaction with 'litter picking', while 70.5% were satisfied with 'maintenance
of planted areas' and 56.4% with 'window cleaning'.
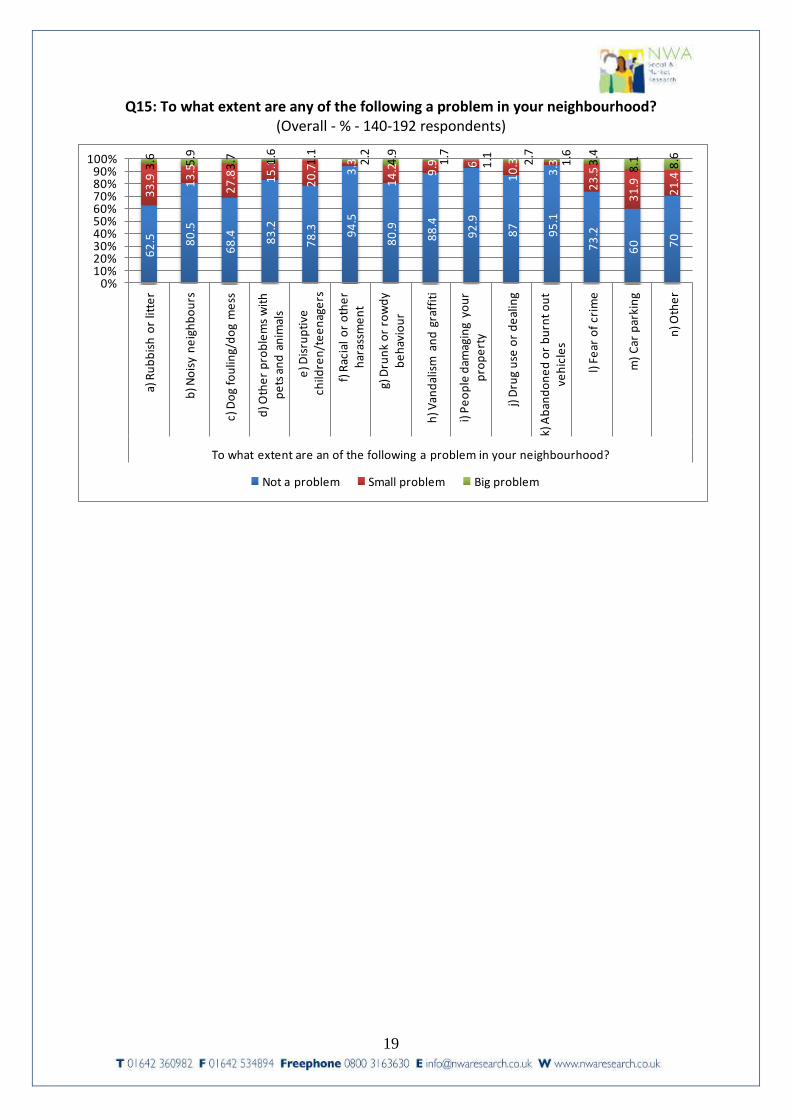
1.20 Most selected as being either a 'problem' in respondents' local area were ‘car parking’
(40.0%), ‘rubbish or litter’ (37.5%) and ‘dog fouling/dog mess’ (31.5%). These were
followed by ‘fear of crime’ (26.9%), ‘disruptive children/teenagers’ (21.8%), ‘noisy
neighbours’ (19.4%) and ‘drunk or rowdy behaviour’ (19.1%).
INFLUENCING YOUR HOUSING SERVICE
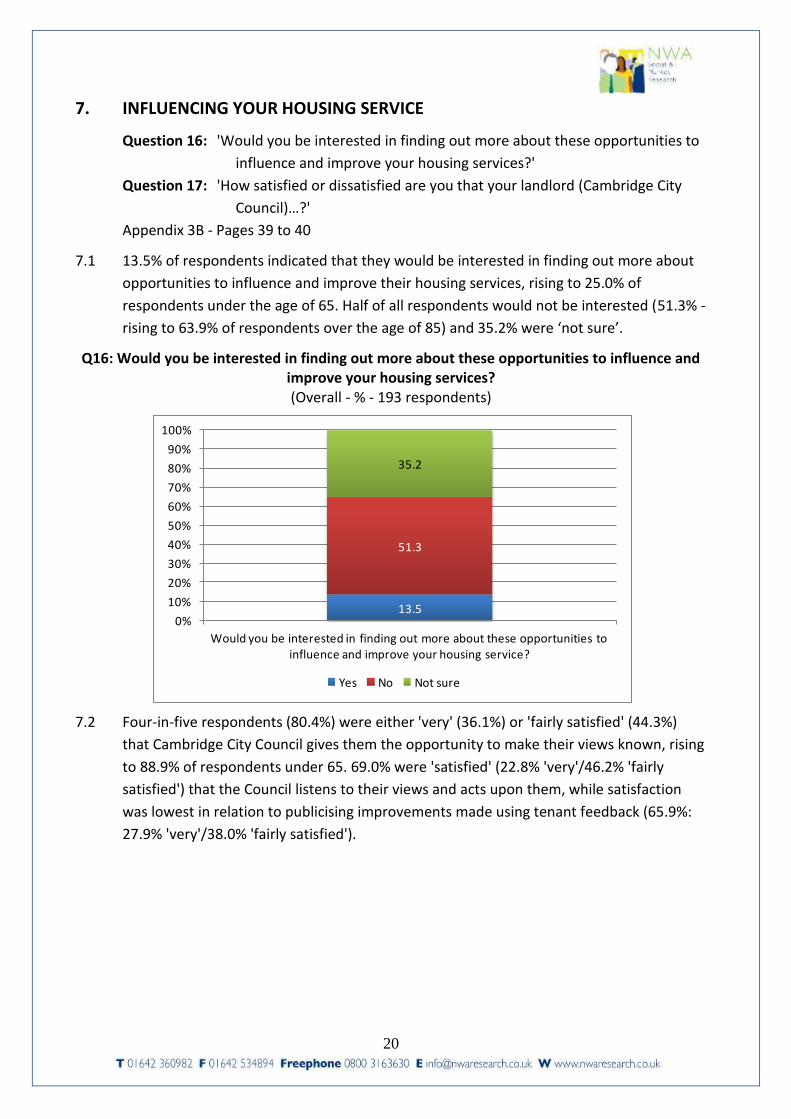
1.21 13.5% of respondents indicated that they would be interested in finding out more about
opportunities to influence and improve their housing services.
1.22 Four-in-five respondents (80.4%) were 'satisfied' that Cambridge City Council gives them
the opportunity to make their views known. 69.0% were 'satisfied' that the Council listens
to their views and acts upon them, while satisfaction was lowest in relation to publicising
improvements made using tenant feedback (65.9%).
COMPLAINTS
1.23 14.6% of respondents had made a complaint to Cambridge City Council in the previous 12
months. Respondents who had made a complaint were most likely to have done so in
relation to 'repairs' (41.4%) or 'anti-social behaviour' (20.7%), while 10.3% (3
respondents) had done so regarding 'rent'. 6.9% had made a complaint in regards to
'tenancy issues' with 3.4% (1 respondent) doing so in relation to 'estate services'.
1.24 Three-quarters of respondents were 'satisfied' (75.0%) with the way their complaint was
handled.
CONTACTING THE COUNCIL
1.25 The majority of respondents preferred to receive information from Cambridge City
Council by 'letter' (80.9%), while a 22.5% would prefer 'face to face' contact and 19.6% by
'phone'. 14.7% would like to receive information from Cambridge City Council by 'email'.
1.26 37.7% of respondents indicated that they have access to the internet. Of respondents
with internet access, access was most likely to be through a 'desktop/laptop' (79.2%),
while smaller numbers had access through a 'tablet' (20.8%) or 'Smartphone' (15.6%).
13.0% indicated that they access the internet at a 'library', with 7.8% doing so through a
'work device'.
6
1.27 Half of all respondents without internet access (49.6%) stated that not being interested
was their main reason for not having access, while 29.3% could not afford access. 17.9%
stated that they 'don't know how'.
1.28 Amongst respondents who had contacted Cambridge City Council in the preceding 12
months, satisfaction was highest in relation to 'how enquiries are dealt with' (86.3%) and
'satisfaction with outcome' (86.0%). Satisfaction was lowest regarding the 'ability of staff
to deal with query' (83.3%).
PRIORITIES FOR THE FUTURE
1.29 Most selected as respondents’ first priority was ‘providing sheltered accommodation for
elderly or vulnerable tenants’ (30.9%), followed by ‘building new council housing’ (24.4%)
and ‘advice and support for those seeking a home’ (13.8%).
7
2. BACKGROUND, OBJECTIVES & METHODOLOGY
2.1 NWA Research was commissioned to undertake a postal and online survey of 498 older
people’s housing tenants. The questionnaires were made up of core ‘STAR’ questions
provided by Housemark, and benchmarking questions from Cambridge City Homes to
meet the annual benchmarking requirements. Key issues included in the questionnaire
were:
Overall satisfaction with services
Value for money
Repairs
Estate and neighbourhood
Influencing the housing service
Complaints
Contacting the Council
Priorities of for the future
2.2 The section relating to respondent details included information on the number, age,
gender and relationship with the lead tenant; working status; ethnic group; disability and
whether the household is likely to move in the next three years. If likely to move further
questions on where to and why respondents were likely to move were asked.
2.3 Questionnaires were branded both on the questionnaire and the envelope in which it was
sent to encourage response. The questionnaires contained a separate tear off slip with
additional household data. A copy of the questionnaire marked up with top line findings is
included with this report as Appendix 1B. The questionnaire was also available on line via
a link which could be accessed using the ID on the paper questionnaire and respondent’s
postcode.
2.4 Questionnaires were posted out to tenants on 29th May for delivery that weekend and
reminder questionnaires to non respondents were sent out on 19th June. At the time of
proceeding to analysis a total of 210 returned questionnaires had been received, a
response rate of 42%.
2.5 Results from the survey were analysed using SPSS and this analysis is attached as further
appendices to this report. Appendix 2B shows tables of frequencies including missing
data; Appendix 2C tables of results with cross breaks and Appendix 2D shows responses
to open questions. The cross breaks used for the analysis are shown in the table overleaf.
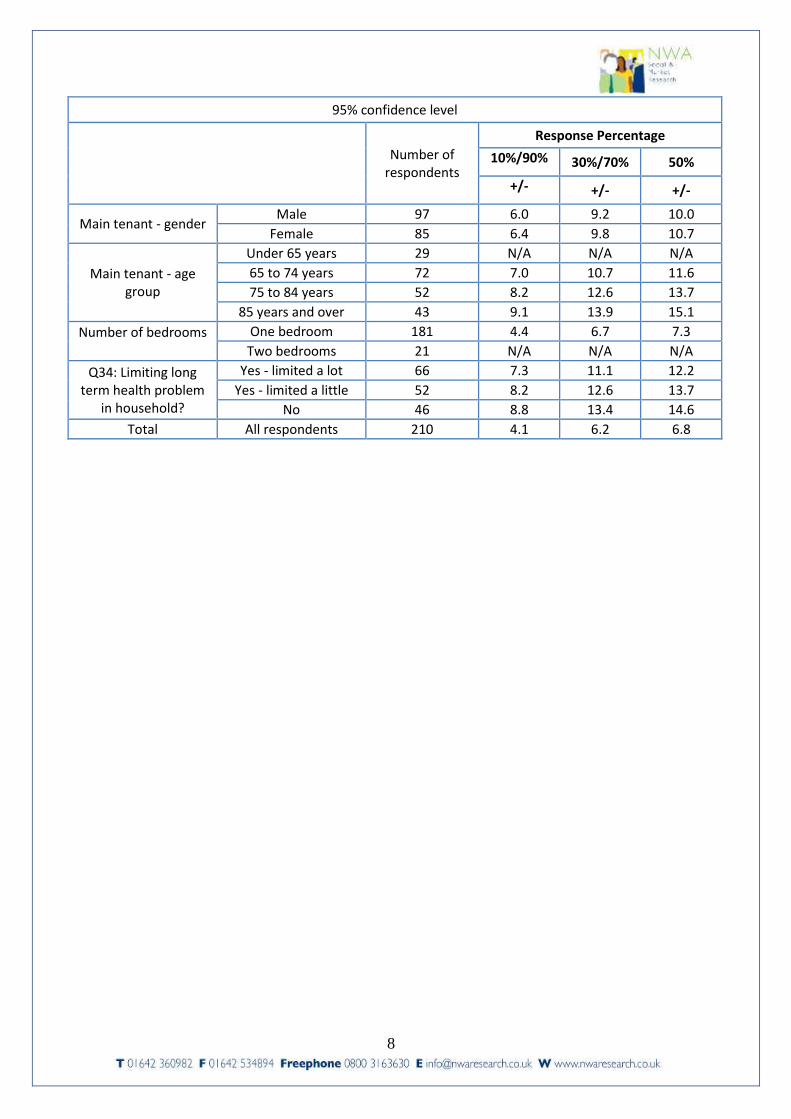
2.6 In order to assess whether observed differences between two samples or sample sub-
groups have just occurred by chance or whether they are ‘real’, ‘statistical significance’
testing is undertaken. Sample numbers are of prime importance when assessing
‘statistical significance’, and the table below shows the minimum difference which needs
to be observed between random samples of various sizes, in order to be ‘95% Confident’
that these differences are statistically significance.
8
95% confidence level
Number of respondents
Response Percentage
10%/90% 30%/70% 50%
+/- +/- +/-
Main tenant - gender Male 97 6.0 9.2 10.0
Female 85 6.4 9.8 10.7
Main tenant - age group
Under 65 years 29 N/A N/A N/A
65 to 74 years 72 7.0 10.7 11.6
75 to 84 years 52 8.2 12.6 13.7
85 years and over 43 9.1 13.9 15.1
Number of bedrooms
One bedroom 181 4.4 6.7 7.3
Two bedrooms 21 N/A N/A N/A
Q34: Limiting long term health problem
in household?
Yes - limited a lot 66 7.3 11.1 12.2
Yes - limited a little 52 8.2 12.6 13.7
No 46 8.8 13.4 14.6
Total All respondents 210 4.1 6.2 6.8
9
3. OVERALL SATISFACTION WITH SERVICES
Question 1: 'How satisfied or dissatisfied are you with the following?'
Question 2: 'How much do you agree or disagree with the following statement?'
Question 3: 'Taking everything into account, how satisfied or dissatisfied are you with
the service provided by your landlord (Cambridge City Council)?'
Appendix 3B - Pages 1 to 8
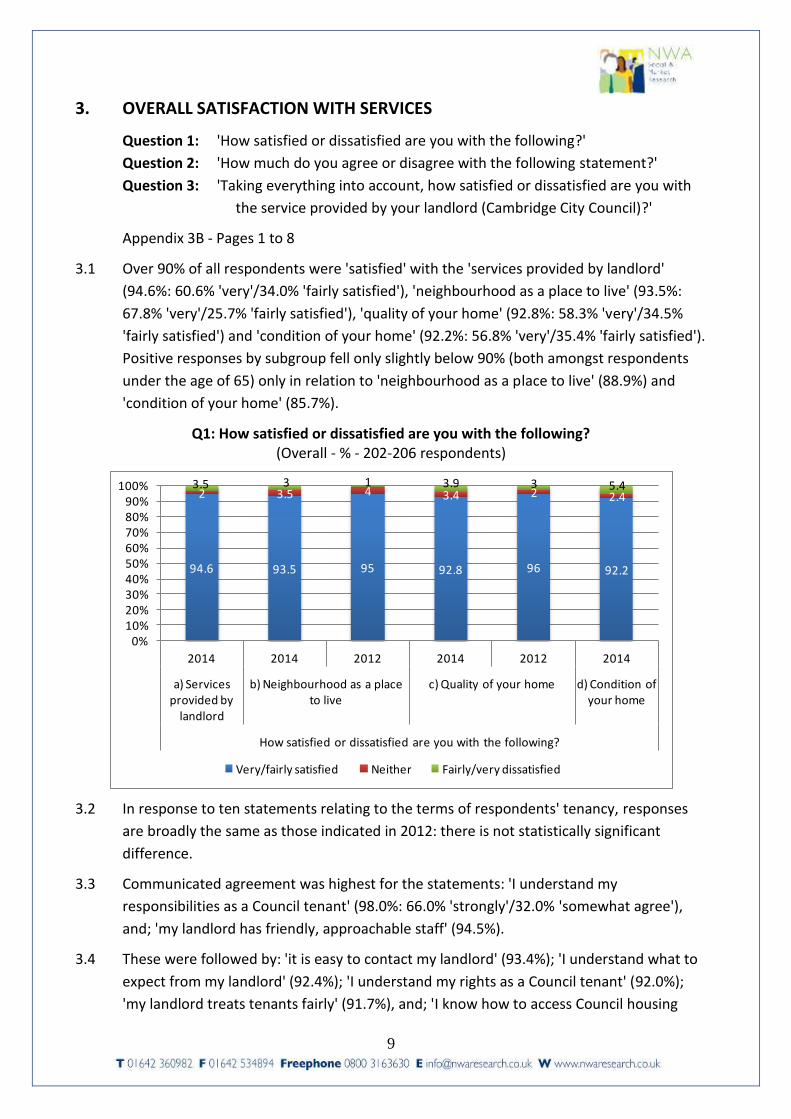
3.1 Over 90% of all respondents were 'satisfied' with the 'services provided by landlord'
(94.6%: 60.6% 'very'/34.0% 'fairly satisfied'), 'neighbourhood as a place to live' (93.5%:
67.8% 'very'/25.7% 'fairly satisfied'), 'quality of your home' (92.8%: 58.3% 'very'/34.5%
'fairly satisfied') and 'condition of your home' (92.2%: 56.8% 'very'/35.4% 'fairly satisfied').
Positive responses by subgroup fell only slightly below 90% (both amongst respondents
under the age of 65) only in relation to 'neighbourhood as a place to live' (88.9%) and
'condition of your home' (85.7%).
Q1: How satisfied or dissatisfied are you with the following? (Overall - % - 202-206 respondents)
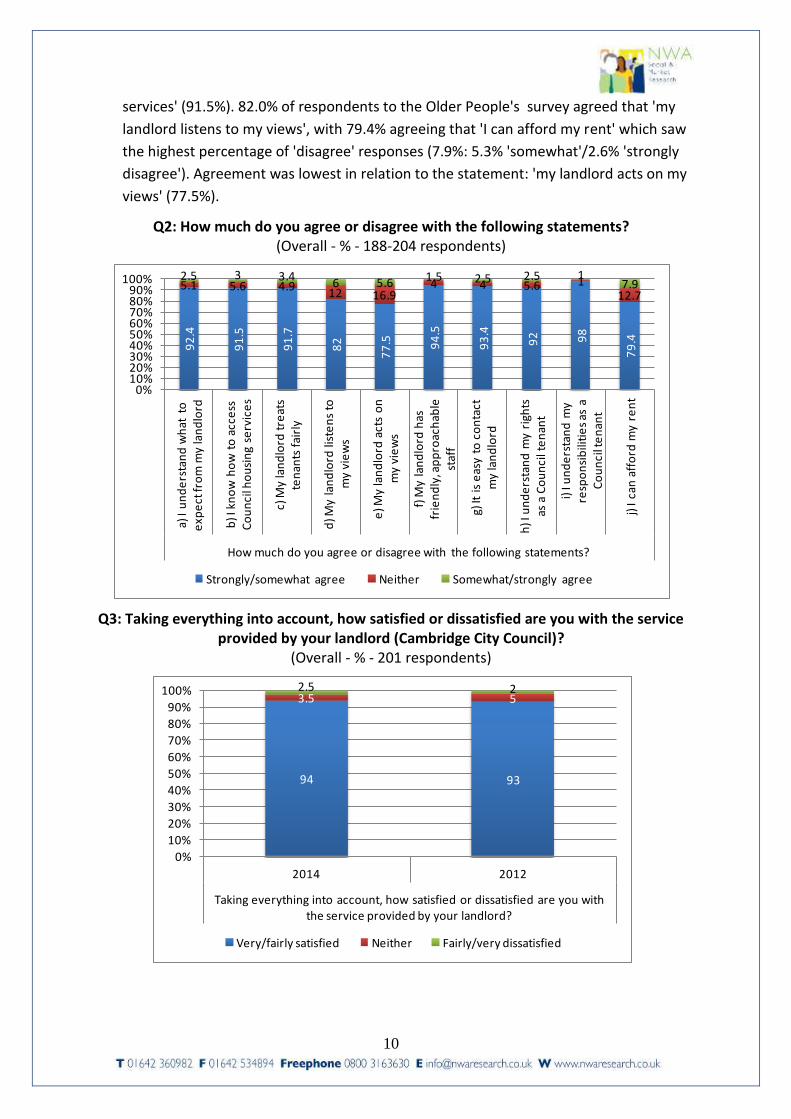
3.2 In response to ten statements relating to the terms of respondents' tenancy, responses
are broadly the same as those indicated in 2012: there is not statistically significant
difference.
3.3 Communicated agreement was highest for the statements: 'I understand my
responsibilities as a Council tenant' (98.0%: 66.0% 'strongly'/32.0% 'somewhat agree'),
and; 'my landlord has friendly, approachable staff' (94.5%).
3.4 These were followed by: 'it is easy to contact my landlord' (93.4%); 'I understand what to
expect from my landlord' (92.4%); 'I understand my rights as a Council tenant' (92.0%);
'my landlord treats tenants fairly' (91.7%), and; 'I know how to access Council housing
94.6 93.5 95 92.8 96 92.2
2 3.5 4 3.4 2 2.43.5 3 1 3.9 3 5.4
0%10%20%30%40%50%60%70%80%90%
100%
2014 2014 2012 2014 2012 2014
a) Services provided by
landlord
b) Neighbourhood as a place to live
c) Quality of your home d) Condition of your home
How satisfied or dissatisfied are you with the following?
Very/fairly satisfied Neither Fairly/very dissatisfied
10
services' (91.5%). 82.0% of respondents to the Older People's survey agreed that 'my
landlord listens to my views', with 79.4% agreeing that 'I can afford my rent' which saw
the highest percentage of 'disagree' responses (7.9%: 5.3% 'somewhat'/2.6% 'strongly
disagree'). Agreement was lowest in relation to the statement: 'my landlord acts on my
views' (77.5%).
Q2: How much do you agree or disagree with the following statements? (Overall - % - 188-204 respondents)
Q3: Taking everything into account, how satisfied or dissatisfied are you with the service
provided by your landlord (Cambridge City Council)? (Overall - % - 201 respondents)
92
.4
91
.5
91
.7
82
77
.5 94
.5
93
.4
92 98
79
.4
5.1 5.6 4.912 16.9
4 4 5.6 112.7
2.5 3 3.46 5.6 1.5 2.5 2.5 1
7.9
0%10%20%30%40%50%60%70%80%90%
100%
a) I
un
de
rsta
nd
wh
at t
o
exp
ect
fro
m m
y la
nd
lord
b) I
kn
ow
ho
w t
o a
cce
ss
Co
un
cil h
ou
sin
g se
rvic
es
c) M
y la
nd
lord
tre
ats
ten
ants
fai
rly
d) M
y la
nd
lord
list
en
s to
m
y vi
ew
s
e) M
y la
nd
lord
act
s o
n
my
vie
ws
f) M
y la
nd
lord
has
fr
ien
dly
, ap
pro
ach
able
st
aff
g) It
is
eas
y to
co
nta
ct
my
lan
dlo
rd
h) I
un
de
rsta
nd
my
righ
ts
as a
Co
un
cil t
en
ant
i) I
un
de
rsta
nd
my
resp
on
sib
iliti
es
as a
C
ou
nci
l te
nan
t
j) I
can
aff
ord
my
ren
t
How much do you agree or disagree with the following statements?
Strongly/somewhat agree Neither Somewhat/strongly agree
94 93
3.5 52.5 2
0%
10%
20%
30%
40%
50%
60%
70%
80%
90%
100%
2014 2012
Taking everything into account, how satisfied or dissatisfied are you with the service provided by your landlord?
Very/fairly satisfied Neither Fairly/very dissatisfied
11
3.5 94.0% of respondents (93.0% in 2012) indicated that they are either 'very' (56.7%) or
'fairly satisfied' (37.3%) with the service provided by their landlord, with such responses
only falling below 90% amongst respondents living in properties with two bedrooms
(89.3% 'satisfied'). 3.5% gave 'neither satisfied nor dissatisfied responses while 2.5% (5
respondents) gave 'fairly dissatisfied' responses (no respondents gave 'very dissatisfied'
responses.
4. VALUE FOR MONEY
Question 4: 'How satisfied or dissatisfied are you with the following?'
Question 5: 'Are you claiming Housing Benefit?'
Question 6: 'Please answer yes or no to the following questions.'
Question 7: 'Which of the following best describes how you are keeping up with the
cost of living?'
Appendix 3B - Pages 9 to 14
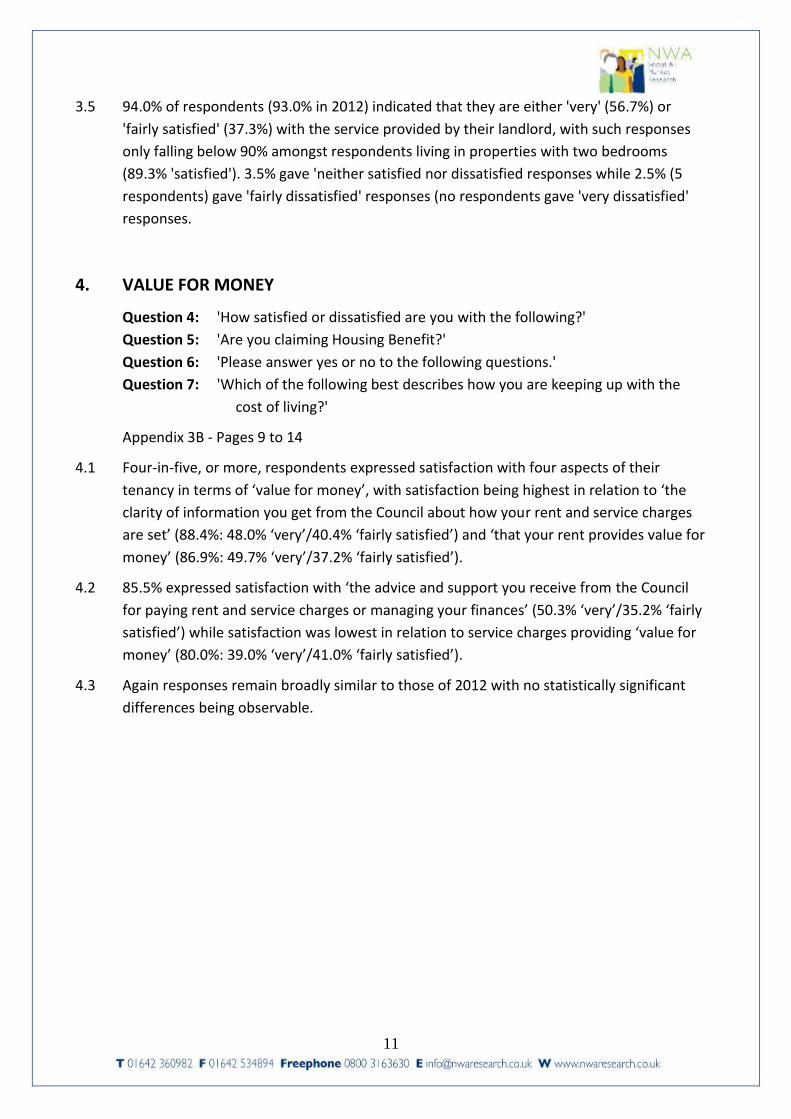
4.1 Four-in-five, or more, respondents expressed satisfaction with four aspects of their
tenancy in terms of ‘value for money’, with satisfaction being highest in relation to ‘the
clarity of information you get from the Council about how your rent and service charges
are set’ (88.4%: 48.0% ‘very’/40.4% ‘fairly satisfied’) and ‘that your rent provides value for
money’ (86.9%: 49.7% ‘very’/37.2% ‘fairly satisfied’).
4.2 85.5% expressed satisfaction with ‘the advice and support you receive from the Council
for paying rent and service charges or managing your finances’ (50.3% ‘very’/35.2% ‘fairly
satisfied’) while satisfaction was lowest in relation to service charges providing ‘value for
money’ (80.0%: 39.0% ‘very’/41.0% ‘fairly satisfied’).
4.3 Again responses remain broadly similar to those of 2012 with no statistically significant
differences being observable.
12
Q4: How satisfied or dissatisfied are you with the following? (Overall - % - 195-199 respondents)
4.4 71.9% of respondents indicated that they are currently claiming Housing Benefit, rising to
82.8% of respondents under the age of 65. Females were more likely than males to be in
receipt of Housing Benefit (76.5% cf. 66.7%). 28.1% were not claiming Housing Benefit.
4.5 50.0% of respondents in receipt of Housing Benefit has heard of Universal Credit, rising to
65.0% of respondents between the ages of 65 and 74. 50.0% of the relevant respondents
had not previously heard of Universal Credit. Nine-in-ten respondents in receipt of
Housing Benefit indicated that they have a bank or building society account in order to
receive future payments (89.7% 'yes').
85.5 84 88.4 86.9 9280 80
12.1 14 7.6 9 711.8 11
2.5 3 4 4 2 6.6 71.5 1
0%10%20%30%40%50%60%70%80%90%
100%
2014 2012 2014 2014 2012 2014 2012
a) The advice and support you receive from the Council for
paying rent and service charges
or managing your finances
b) The clarity of information you get from
the Council about how
your rent and service charges
are set
c) That your rent provides value for money
d) That your service charge provides value for money
How satisfied or dissatisfied are you with the following?
Very/fairly satisfied Neither Fairly/very dissatisfied Not applicable
13
Q5: Are you claiming Housing Benefit? / Q6: Please answer yes or no to the following questions.
(Overall/'Yes' at Q5 - % - 203/60/58 respondents)
Q7: Which of the following best describes how you are keeping up with the cost of living?
(Overall - % - 194 respondents)
4.6 45.4% of respondents living in older people’s housing accommodation indicated that they
'are keeping up without any difficulties', rising to 60.0% of respondents over the age of
85. 35.6% of respondents were 'keeping up but struggle to do so from time to time', while
14.9% were either 'keeping up but it is a constant struggle' (10.3% - rising to 32.1% of
respondents under the age of 65) or 'having real financial problems' (4.6%). 4.1% gave
'don't know' responses.
71.950
89.7
28.150
10.3
0%10%20%30%40%50%60%70%80%90%
100%
Overall a) Have you heard of Universal Credit?
b) Changes to benefits mean that claimants will need a bank
account or building society
account to receive future payments. Do you have an account that will be able to
receive these payments?
Are you claiming Housing Benefit?
Please answer yes or no to the following questions
Yes No
I am/we are keeping up without any
difficulties, 45.4I am/we are
keeping up but struggle to do
so from time to time, 35.6
I am/we are keeping up but it is a constant
struggle, 10.3
I am/we are having real
financial
problems, 4.6
Don't know, 4.1
14
5. REPAIRS
Question 8: 'Have you ordered a repair to your property in the last year?'
Question 9: 'How satisfied or dissatisfied were you with the following?'
Question 10: 'Overall, how satisfied or dissatisfied are you with the repairs services
provided by your landlord (Cambridge City Council)?'
Question 11: 'Which three of the following improvements to your neighbourhood would
you consider to be your first, second and third priorities?'
Question 12: 'From the list below please indicate how important or unimportant you feel
each is.'
Question 13: 'How much do you agree or disagree with the following statements?'
Appendix 3B - Pages 15 to 28
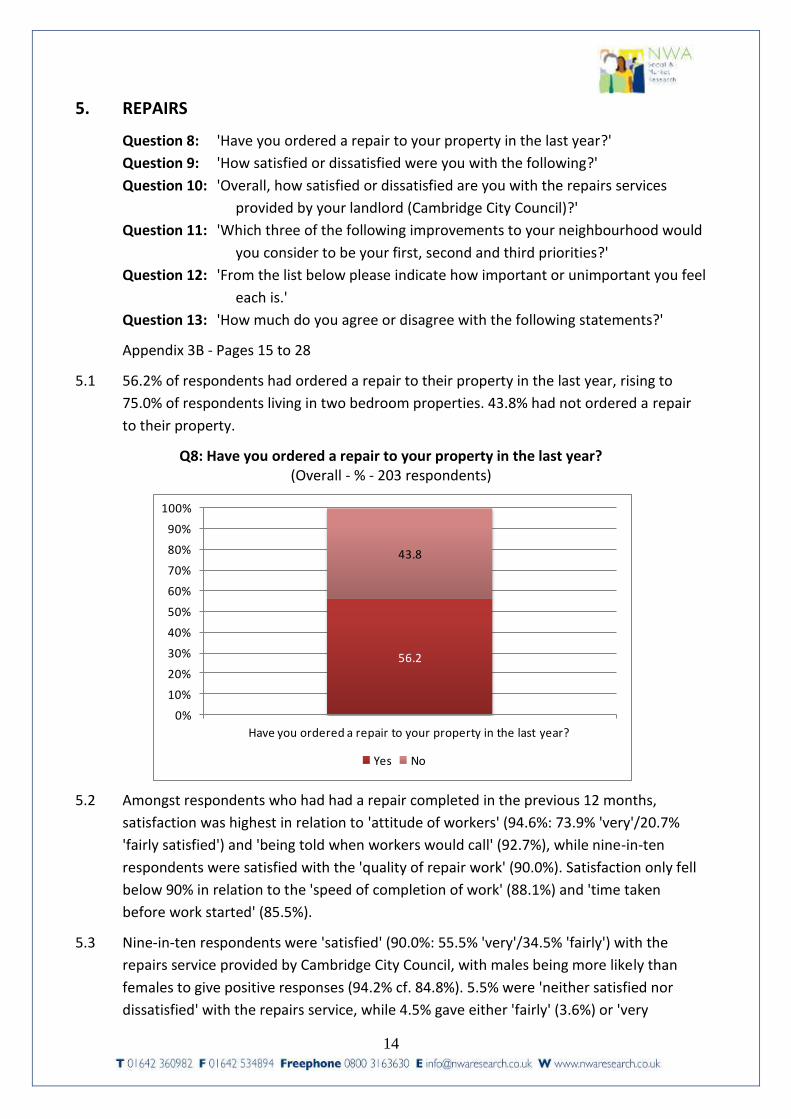
5.1 56.2% of respondents had ordered a repair to their property in the last year, rising to
75.0% of respondents living in two bedroom properties. 43.8% had not ordered a repair
to their property.
Q8: Have you ordered a repair to your property in the last year? (Overall - % - 203 respondents)
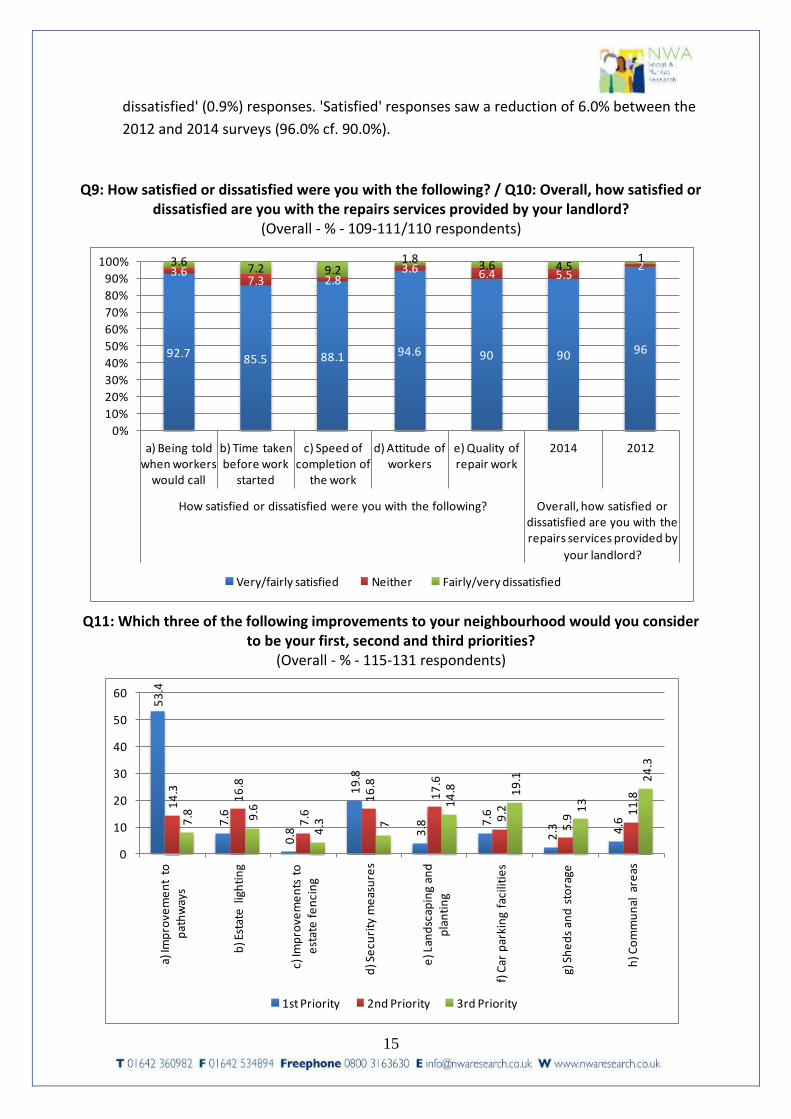
5.2 Amongst respondents who had had a repair completed in the previous 12 months,
satisfaction was highest in relation to 'attitude of workers' (94.6%: 73.9% 'very'/20.7%
'fairly satisfied') and 'being told when workers would call' (92.7%), while nine-in-ten
respondents were satisfied with the 'quality of repair work' (90.0%). Satisfaction only fell
below 90% in relation to the 'speed of completion of work' (88.1%) and 'time taken
before work started' (85.5%).
5.3 Nine-in-ten respondents were 'satisfied' (90.0%: 55.5% 'very'/34.5% 'fairly') with the
repairs service provided by Cambridge City Council, with males being more likely than
females to give positive responses (94.2% cf. 84.8%). 5.5% were 'neither satisfied nor
dissatisfied' with the repairs service, while 4.5% gave either 'fairly' (3.6%) or 'very
56.2
43.8
0%
10%
20%
30%
40%
50%
60%
70%
80%
90%
100%
Have you ordered a repair to your property in the last year?
Yes No
15
dissatisfied' (0.9%) responses. 'Satisfied' responses saw a reduction of 6.0% between the
2012 and 2014 surveys (96.0% cf. 90.0%).
Q9: How satisfied or dissatisfied were you with the following? / Q10: Overall, how satisfied or dissatisfied are you with the repairs services provided by your landlord?
(Overall - % - 109-111/110 respondents)
Q11: Which three of the following improvements to your neighbourhood would you consider
to be your first, second and third priorities? (Overall - % - 115-131 respondents)
92.7 85.5 88.1 94.6 90 90 96
3.67.3 2.8
3.6 6.4 5.523.6
7.2 9.21.8
3.6 4.51
0%
10%
20%
30%
40%
50%
60%
70%
80%
90%
100%
a) Being told when workers
would call
b) Time taken before work
started
c) Speed of completion of
the work
d) Attitude of workers
e) Quality of repair work
2014 2012
How satisfied or dissatisfied were you with the following? Overall, how satisfied or dissatisfied are you with the repairs services provided by
your landlord?
Very/fairly satisfied Neither Fairly/very dissatisfied
53
.4
7.6
0.8
19
.8
3.8 7
.6
2.3 4
.6
14
.3
16
.8
7.6
16
.8
17
.6
9.2
5.9
11
.8
7.8 9.6
4.3 7
14
.8 19
.1
13
24
.3
0
10
20
30
40
50
60
a) Im
pro
vem
en
t to
p
ath
way
s
b) E
stat
e l
igh
tin
g
c) Im
pro
vem
en
ts t
o
est
ate
fe
nci
ng
d) S
ecu
rity
me
asu
res
e) L
and
scap
ing
and
p
lan
tin
g
f) C
ar p
arki
ng
faci
litie
s
g) S
he
ds
and
sto
rage
h) C
om
mu
nal
are
as
1st Priority 2nd Priority 3rd Priority
16
5.4 Over half of all respondents selected 'improvements to pathways' (53.4%) as their first
priority for their neighbourhood, while 19.8% selected 'security measures' as their first
priority. Third most selected as respondents' first priority were 'estate lighting' (7.6%) and
'car parking facilities' (7.6%). Most selected as respondents' second priority were
'landscaping and planting' (17.6%), 'estate lighting' (16.8%) and 'security measures'
(16.8%), while most selected in terms of the third priority were 'communal areas' (24.3%),
'car parking facilities' (19.1%) and 'landscaping and planting' (14.8%).
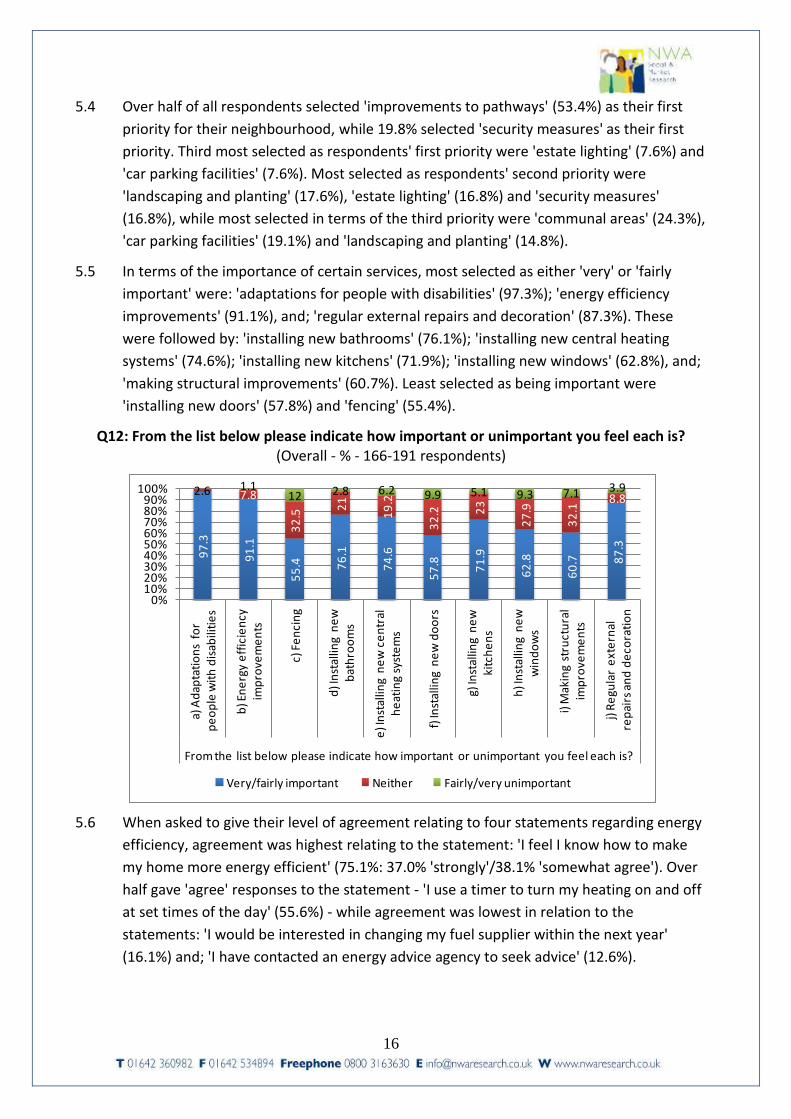
5.5 In terms of the importance of certain services, most selected as either 'very' or 'fairly
important' were: 'adaptations for people with disabilities' (97.3%); 'energy efficiency
improvements' (91.1%), and; 'regular external repairs and decoration' (87.3%). These
were followed by: 'installing new bathrooms' (76.1%); 'installing new central heating
systems' (74.6%); 'installing new kitchens' (71.9%); 'installing new windows' (62.8%), and;
'making structural improvements' (60.7%). Least selected as being important were
'installing new doors' (57.8%) and 'fencing' (55.4%).
Q12: From the list below please indicate how important or unimportant you feel each is? (Overall - % - 166-191 respondents)
5.6 When asked to give their level of agreement relating to four statements regarding energy
efficiency, agreement was highest relating to the statement: 'I feel I know how to make
my home more energy efficient' (75.1%: 37.0% 'strongly'/38.1% 'somewhat agree'). Over
half gave 'agree' responses to the statement - 'I use a timer to turn my heating on and off
at set times of the day' (55.6%) - while agreement was lowest in relation to the
statements: 'I would be interested in changing my fuel supplier within the next year'
(16.1%) and; 'I have contacted an energy advice agency to seek advice' (12.6%).
97
.3
91
.1
55
.4 76
.1
74
.6
57
.8 71
.9
62
.8
60
.7 87
.3
2.6 7.8
32
.5
21
19
.2
32
.2 23
27
.9
32
.1
8.81.1
12 2.8 6.2 9.9 5.1 9.3 7.1 3.9
0%10%20%30%40%50%60%70%80%90%
100%
a) A
dap
tati
on
s fo
r p
eo
ple
wit
h d
isab
iliti
es
b) E
ne
rgy
eff
icie
ncy
im
pro
vem
en
ts
c) F
en
cin
g
d) I
nst
allin
g n
ew
b
ath
roo
ms
e) I
nst
allin
g n
ew
ce
ntr
al
he
atin
g sy
ste
ms
f) In
stal
ling
ne
w d
oo
rs
g) In
stal
ling
ne
w
kitc
he
ns
h) I
nst
allin
g n
ew
w
ind
ow
s
i) M
akin
g st
ruct
ura
l im
pro
vem
en
ts
j) R
egu
lar
ext
ern
al
rep
airs
an
d d
eco
rati
on
From the list below please indicate how important or unimportant you feel each is?
Very/fairly important Neither Fairly/very unimportant
17
Q13: How much do you agree or disagree with the following statements? (Overall - % - 167-189 respondents)
75.1
12.6
55.6
16.1
20.6
63.5
29.4
54.8
4.2
2415
29.2
0%
10%
20%
30%
40%
50%
60%
70%
80%
90%
100%
a) I feel I know how to make my home more
energy efficient
b) I have contacted an energy advice agency
to seek advice
c) I use a timer to turn my heating on and off at set times of the day
d) I would be interested in changing
my fuel supplier
within the next year
How much do you agree or disagree with the following statements?
Strongly/somewhat agree Neither Somewhat/strongly disagree
18
6. YOUR ESTATE AND NEIGHBOURHOOD
Question 14: 'How satisfied or dissatisfied are you with following services provided by
your landlord (Cambridge City Council)?'
Question 15: 'To what extent are any of the following a problem in your
neighbourhood?'
Appendix 3B - Pages 29 to 38
6.1 Satisfaction with six aspects of services provided by Cambridge City Council was highest in
relation to 'grass cutting' (85.1%) and 'cleaning of indoor communal areas' (84.3%), with
81.2% expressing satisfaction with 'cleaning of outdoor communal areas' (81.2%). 75.6%
expressed satisfaction with 'litter picking', while 70.5% were satisfied with 'maintenance
of planted areas' and 56.4% with 'window cleaning'.
Q14: How satisfied or dissatisfied are you with following services provided by your landlord? (Overall - % - 184-195 respondents)
6.2 Most selected as being either a 'small' or 'big problem' in respondents' local area were
‘car parking’ (40.0% ‘problem’), ‘rubbish or litter’ (37.5%) and ‘dog fouling/dog mess’
(31.5%).
6.3 These were followed by ‘fear of crime’ (26.9%), ‘disruptive children/teenagers’ (21.8%),
‘noisy neighbours’ (19.4%) and ‘drunk or rowdy behaviour’ (19.1%).
6.4 Smaller numbers of respondents expressed concern about ‘other problems with pets and
animals’ (16.7%), ‘drug use or dealing’ (13.0%), ‘vandalism and graffiti’ (11.6%), ‘people
damaging your property’ (7.1%) and ‘racial or other harassment’ (5.5%), while ‘problem’
responses were lowest in relation to ‘abandoned or burnt out vehicles’ (4.9%). 30.0%
gave ‘problem’ responses in relation to ‘other’ issues in their neighbourhood which are
listed at Appendix 4B.
56.4
84.3 81.2 75.685.1
70.5
12.4
5.4 8.9 12.86.2
12.618.1
6 7.4 8.5 6.1 14.213 4.3 2.6 3.2 2.6 2.6
0%10%20%30%40%50%60%70%80%90%
100%
a) Window cleaning
b) Cleaning of indoor
communal
areas
c) Cleaning of outdoor
communal
areas
d) Litter picking
e) Grass cutting
f) Maintenance
of planted
areas
How satisfied or dissatisfied are you with the following services provided by your landlord?
Very/fairly satisfied Neither Fairly/very dissatisfied Not applicable
19
Q15: To what extent are any of the following a problem in your neighbourhood? (Overall - % - 140-192 respondents)
62
.5 80
.5
68
.4 83
.2
78
.3 94
.5
80
.9
88
.4
92
.9
87
95
.1
73
.2
60 7
0
33
.9 13
.5
27
.8 15
.1
20
.7 3.3
14
.2 9.9 6
10
.3
3.3
23
.5
31
.9
21
.4
3.6 5.9
3.7 1.6
1.1
2.2
4.9
1.7
1.1 2.7
1.6
3.4
8.1 8.6
0%10%20%30%40%50%60%70%80%90%
100%a)
Ru
bb
ish
or
litte
r
b) N
ois
y n
eig
hb
ou
rs
c) D
og
fou
ling/
do
g m
ess
d) O
the
r p
rob
lem
s w
ith
p
ets
an
d a
nim
als
e) D
isru
pti
ve
child
ren
/te
en
age
rs
f) R
acia
l o
r o
the
r h
aras
sme
nt
g) D
run
k o
r ro
wd
y b
eh
avio
ur
h) V
and
alis
m a
nd
gra
ffit
i
i) P
eo
ple
dam
agin
g yo
ur
pro
pe
rty
j) D
rug
use
or
de
alin
g
k) A
ban
do
ne
d o
r b
urn
t o
ut
veh
icle
s
l) F
ear
of
crim
e
m)
Car
par
kin
g
n) O
the
r
To what extent are an of the following a problem in your neighbourhood?
Not a problem Small problem Big problem
20
7. INFLUENCING YOUR HOUSING SERVICE
Question 16: 'Would you be interested in finding out more about these opportunities to
influence and improve your housing services?'
Question 17: 'How satisfied or dissatisfied are you that your landlord (Cambridge City
Council)…?'
Appendix 3B - Pages 39 to 40
7.1 13.5% of respondents indicated that they would be interested in finding out more about
opportunities to influence and improve their housing services, rising to 25.0% of
respondents under the age of 65. Half of all respondents would not be interested (51.3% -
rising to 63.9% of respondents over the age of 85) and 35.2% were ‘not sure’.
Q16: Would you be interested in finding out more about these opportunities to influence and improve your housing services? (Overall - % - 193 respondents)
7.2 Four-in-five respondents (80.4%) were either 'very' (36.1%) or 'fairly satisfied' (44.3%)
that Cambridge City Council gives them the opportunity to make their views known, rising
to 88.9% of respondents under 65. 69.0% were 'satisfied' (22.8% 'very'/46.2% 'fairly
satisfied') that the Council listens to their views and acts upon them, while satisfaction
was lowest in relation to publicising improvements made using tenant feedback (65.9%:
27.9% 'very'/38.0% 'fairly satisfied').
13.5
51.3
35.2
0%
10%
20%
30%
40%
50%
60%
70%
80%
90%
100%
Would you be interested in finding out more about these opportunities to influence and improve your housing service?
Yes No Not sure
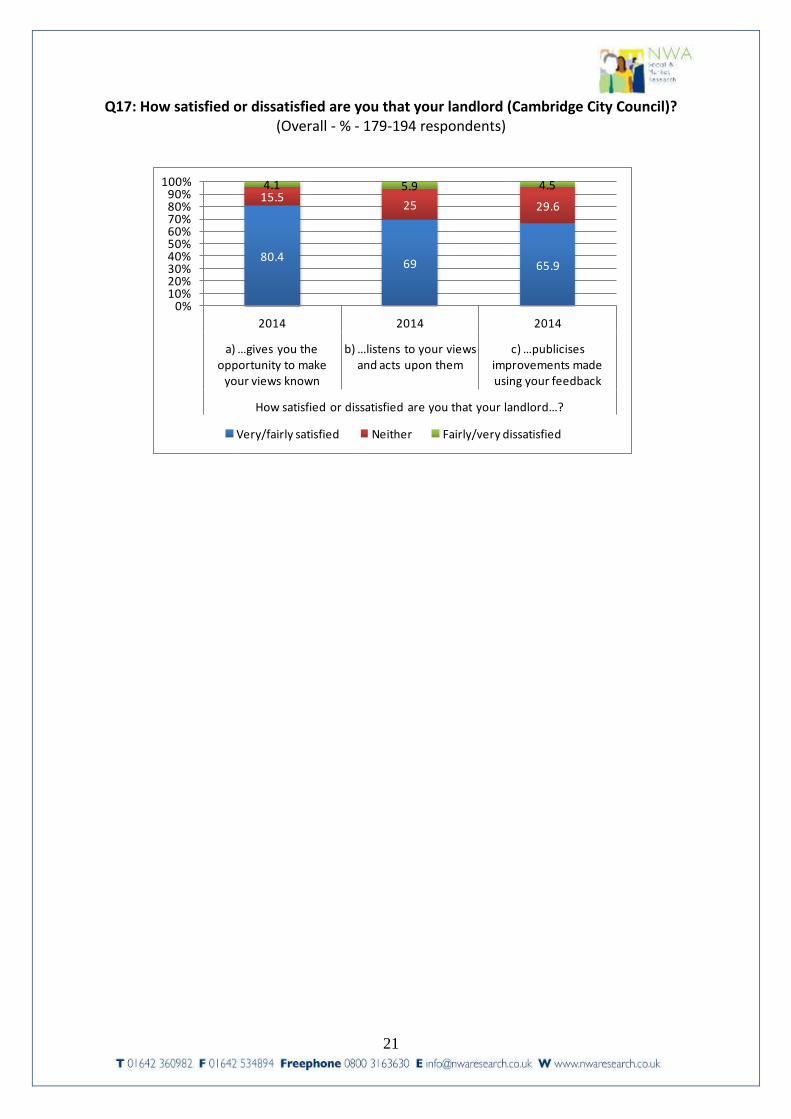
21
Q17: How satisfied or dissatisfied are you that your landlord (Cambridge City Council)? (Overall - % - 179-194 respondents)
80.469 65.9
15.525 29.6
4.1 5.9 4.5
0%10%20%30%40%50%60%70%80%90%
100%
2014 2014 2014
a) …gives you the opportunity to make
your views known
b) …listens to your views and acts upon them
c) …publicises improvements made using your feedback
How satisfied or dissatisfied are you that your landlord…?
Very/fairly satisfied Neither Fairly/very dissatisfied
22
8. COMPLAINTS
Question 18: 'Have you made a complaint to your landlord (Cambridge City Council) in
the last 12 months?'
Question 19: 'What was your complaint about?'
Question 20: 'Overall, how satisfied or dissatisfied are you with the way your complaint
was handled by your landlord (Cambridge City Council)?'
Appendix 3B - Pages 41 to 42
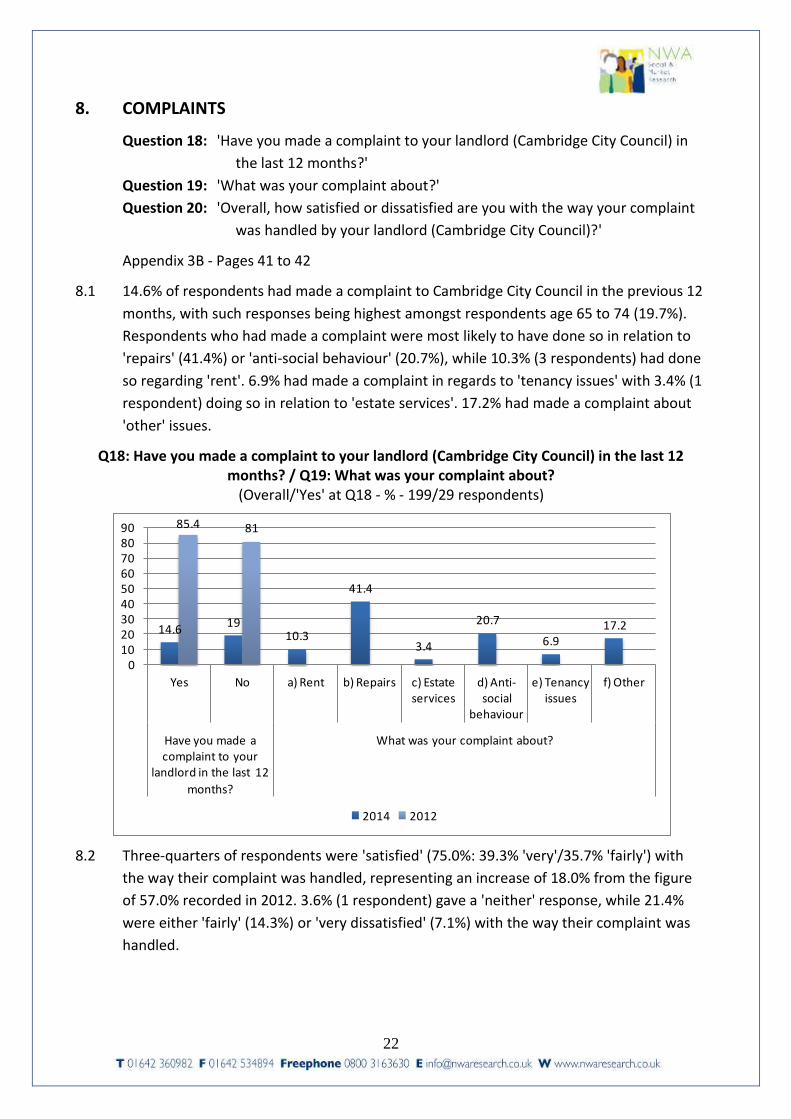
8.1 14.6% of respondents had made a complaint to Cambridge City Council in the previous 12
months, with such responses being highest amongst respondents age 65 to 74 (19.7%).
Respondents who had made a complaint were most likely to have done so in relation to
'repairs' (41.4%) or 'anti-social behaviour' (20.7%), while 10.3% (3 respondents) had done
so regarding 'rent'. 6.9% had made a complaint in regards to 'tenancy issues' with 3.4% (1
respondent) doing so in relation to 'estate services'. 17.2% had made a complaint about
'other' issues.
Q18: Have you made a complaint to your landlord (Cambridge City Council) in the last 12 months? / Q19: What was your complaint about?
(Overall/'Yes' at Q18 - % - 199/29 respondents)
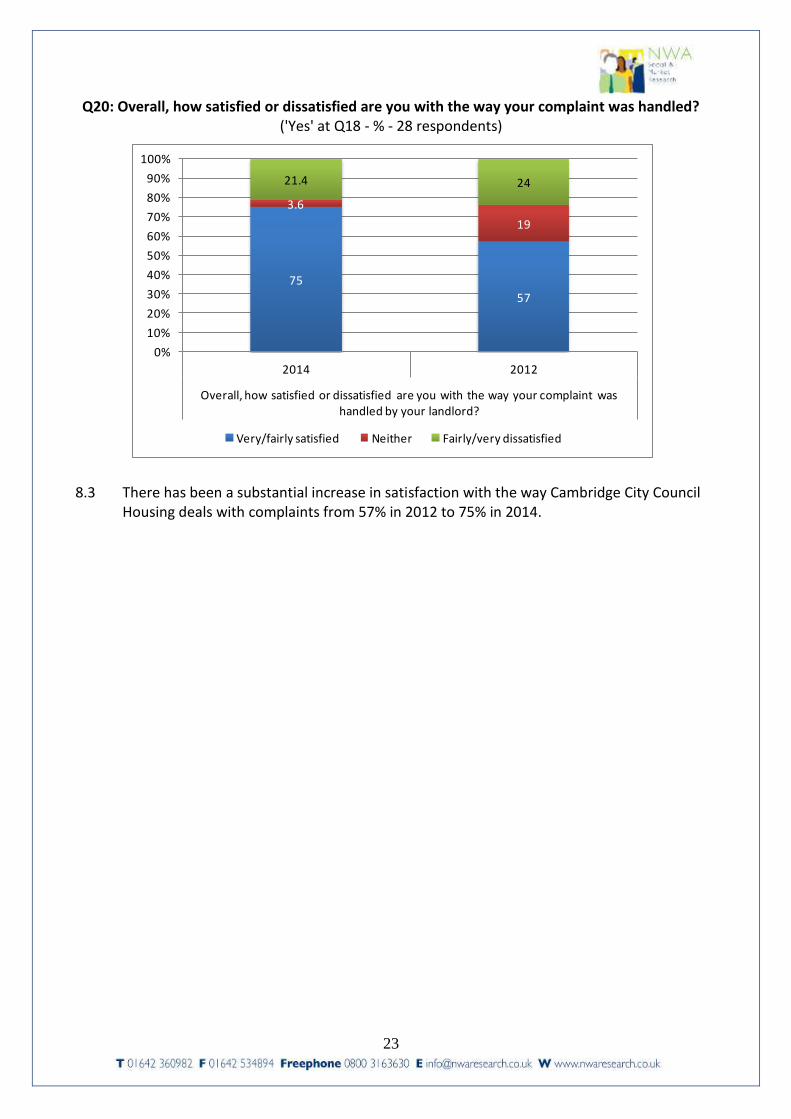
8.2 Three-quarters of respondents were 'satisfied' (75.0%: 39.3% 'very'/35.7% 'fairly') with
the way their complaint was handled, representing an increase of 18.0% from the figure
of 57.0% recorded in 2012. 3.6% (1 respondent) gave a 'neither' response, while 21.4%
were either 'fairly' (14.3%) or 'very dissatisfied' (7.1%) with the way their complaint was
handled.
14.619
10.3
41.4
3.4
20.7
6.917.2
85.4 81
0102030405060708090
Yes No a) Rent b) Repairs c) Estate services
d) Anti-social
behaviour
e) Tenancy issues
f) Other
Have you made a complaint to your
landlord in the last 12
months?
What was your complaint about?
2014 2012
23
Q20: Overall, how satisfied or dissatisfied are you with the way your complaint was handled? ('Yes' at Q18 - % - 28 respondents)
8.3 There has been a substantial increase in satisfaction with the way Cambridge City Council Housing deals with complaints from 57% in 2012 to 75% in 2014.
75
57
3.6
19
21.4 24
0%
10%
20%
30%
40%
50%
60%
70%
80%
90%
100%
2014 2012
Overall, how satisfied or dissatisfied are you with the way your complaint was handled by your landlord?
Very/fairly satisfied Neither Fairly/very dissatisfied
24
9. CONTACTING THE COUNCIL
Question 21: 'How do you prefer to receive information from your landlord (Cambridge
City Council)?'
Question 22: 'Do you have access to the internet?'
Question 23: 'If yes, how do you access the internet?'
Question 24: 'If no, what is your main reason for not having internet access?'
Question 25: 'If you have made contact with your landlord (Cambridge City Council) in
the last 12 months, how satisfied or dissatisfied were you with the
following?'
Appendix 3B - Pages 43 to 48
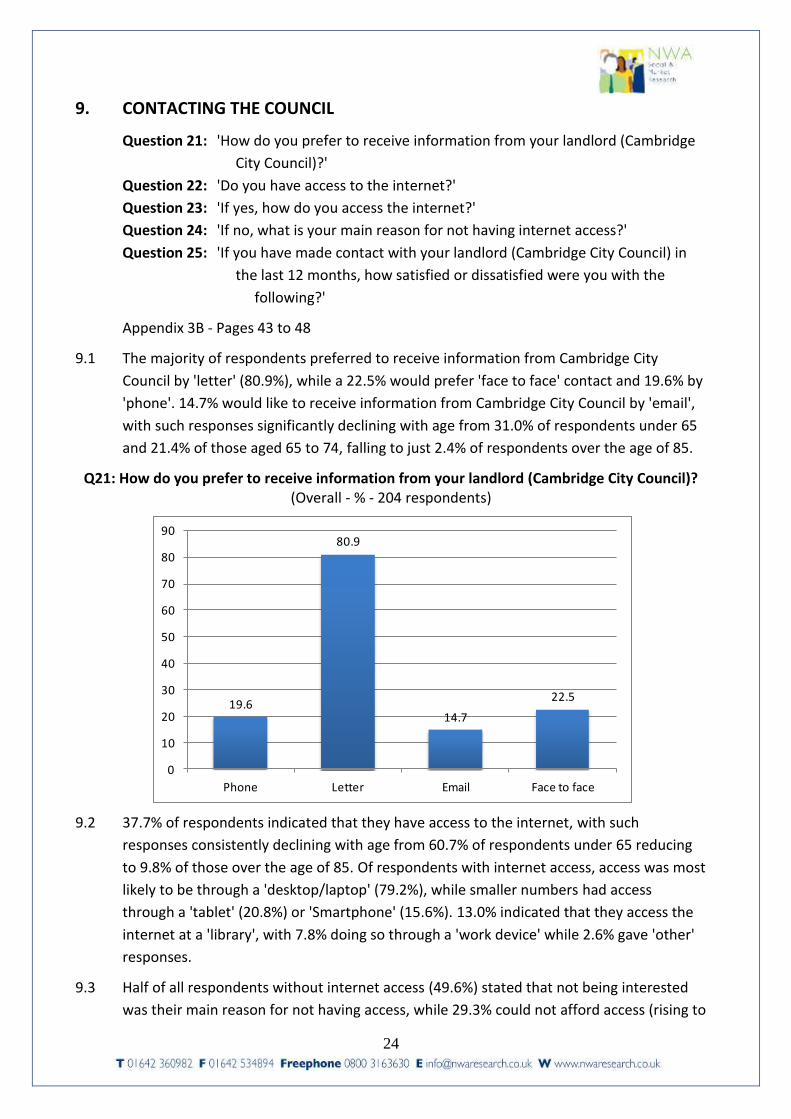
9.1 The majority of respondents preferred to receive information from Cambridge City
Council by 'letter' (80.9%), while a 22.5% would prefer 'face to face' contact and 19.6% by
'phone'. 14.7% would like to receive information from Cambridge City Council by 'email',
with such responses significantly declining with age from 31.0% of respondents under 65
and 21.4% of those aged 65 to 74, falling to just 2.4% of respondents over the age of 85.
Q21: How do you prefer to receive information from your landlord (Cambridge City Council)? (Overall - % - 204 respondents)
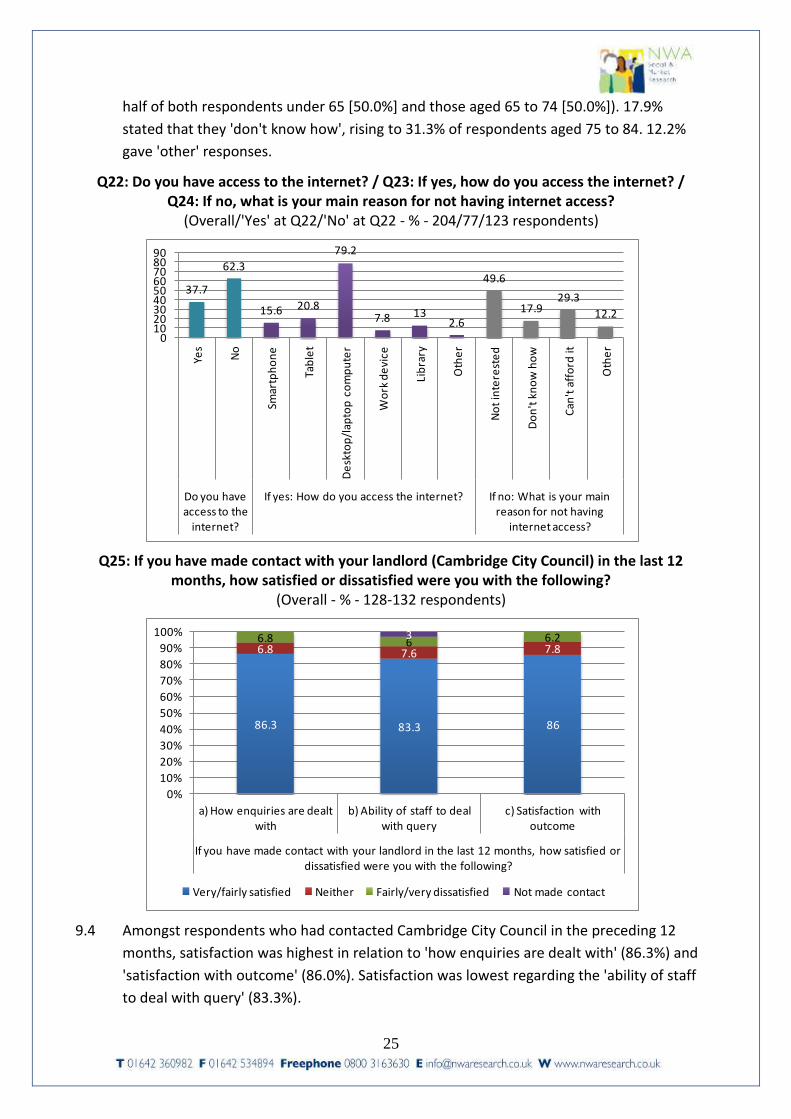
9.2 37.7% of respondents indicated that they have access to the internet, with such
responses consistently declining with age from 60.7% of respondents under 65 reducing
to 9.8% of those over the age of 85. Of respondents with internet access, access was most
likely to be through a 'desktop/laptop' (79.2%), while smaller numbers had access
through a 'tablet' (20.8%) or 'Smartphone' (15.6%). 13.0% indicated that they access the
internet at a 'library', with 7.8% doing so through a 'work device' while 2.6% gave 'other'
responses.
9.3 Half of all respondents without internet access (49.6%) stated that not being interested
was their main reason for not having access, while 29.3% could not afford access (rising to
19.6
80.9
14.7
22.5
0
10
20
30
40
50
60
70
80
90
Phone Letter Email Face to face
25
half of both respondents under 65 [50.0%] and those aged 65 to 74 [50.0%]). 17.9%
stated that they 'don't know how', rising to 31.3% of respondents aged 75 to 84. 12.2%
gave 'other' responses.
Q22: Do you have access to the internet? / Q23: If yes, how do you access the internet? / Q24: If no, what is your main reason for not having internet access?
(Overall/'Yes' at Q22/'No' at Q22 - % - 204/77/123 respondents)
Q25: If you have made contact with your landlord (Cambridge City Council) in the last 12
months, how satisfied or dissatisfied were you with the following? (Overall - % - 128-132 respondents)
9.4 Amongst respondents who had contacted Cambridge City Council in the preceding 12
months, satisfaction was highest in relation to 'how enquiries are dealt with' (86.3%) and
'satisfaction with outcome' (86.0%). Satisfaction was lowest regarding the 'ability of staff
to deal with query' (83.3%).
37.7
62.3
15.6 20.8
79.2
7.8 132.6
49.6
17.929.3
12.2
0102030405060708090
Yes
No
Smar
tph
on
e
Tab
let
De
skto
p/l
apto
p c
om
pu
ter
Wo
rk d
evi
ce
Lib
rary
Oth
er
No
t in
tere
ste
d
Do
n't
kn
ow
ho
w
Can
't a
ffo
rd it
Oth
er
Do you have access to the
internet?
If yes: How do you access the internet? If no: What is your main reason for not having
internet access?
86.3 83.3 86
6.8 7.6 7.86.8 6 6.23
0%
10%
20%
30%
40%
50%
60%
70%
80%
90%
100%
a) How enquiries are dealt with
b) Ability of staff to deal with query
c) Satisfaction with outcome
If you have made contact with your landlord in the last 12 months, how satisfied or dissatisfied were you with the following?
Very/fairly satisfied Neither Fairly/very dissatisfied Not made contact
26
10. PRIORITIES FOR THE FUTURE
Question 26: 'Which three of the following housing related services would you consider
to be your first, second and third priorities?'
Question 27: 'Are there any other housing related services you think should be
prioritised?'
Question 28: 'What single improvement would you most like to see in your housing
service?'
Question 28a: 'What would be the top three reasons that would encourage you to move
to an older people’s housing scheme?'
Appendix 3B - Pages 49 to 51
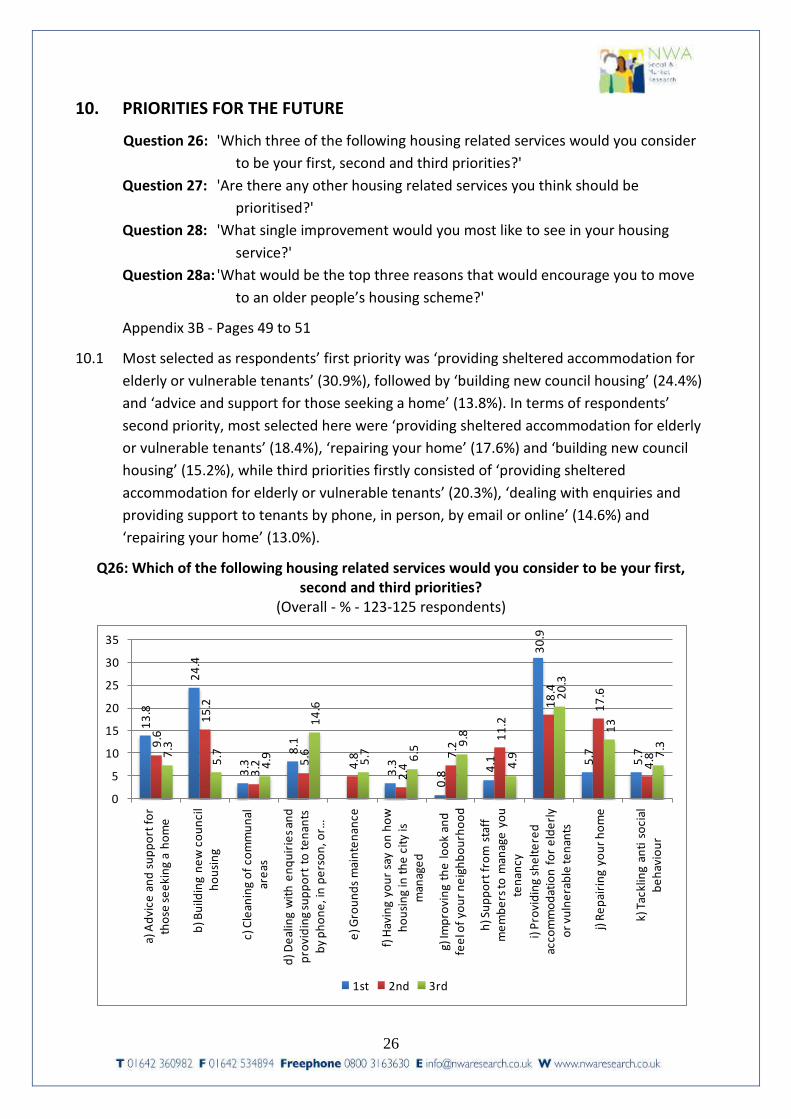
10.1 Most selected as respondents’ first priority was ‘providing sheltered accommodation for
elderly or vulnerable tenants’ (30.9%), followed by ‘building new council housing’ (24.4%)
and ‘advice and support for those seeking a home’ (13.8%). In terms of respondents’
second priority, most selected here were ‘providing sheltered accommodation for elderly
or vulnerable tenants’ (18.4%), ‘repairing your home’ (17.6%) and ‘building new council
housing’ (15.2%), while third priorities firstly consisted of ‘providing sheltered
accommodation for elderly or vulnerable tenants’ (20.3%), ‘dealing with enquiries and
providing support to tenants by phone, in person, by email or online’ (14.6%) and
‘repairing your home’ (13.0%).
Q26: Which of the following housing related services would you consider to be your first, second and third priorities?
(Overall - % - 123-125 respondents)
13
.8
24
.4
3.3
8.1
3.3
0.8
4.1
30
.9
5.7
5.7
9.6
15
.2
3.2 5
.6
4.8
2.4
7.2
11
.2
18
.4
17
.6
4.87
.3
5.7
4.9
14
.6
5.7 6.5
9.8
4.9
20
.3
13
7.3
0
5
10
15
20
25
30
35
a) A
dvi
ce a
nd
su
pp
ort
fo
r th
ose
se
eki
ng
a h
om
e
b) B
uild
ing
ne
w c
ou
nci
l h
ou
sin
g
c) C
lean
ing
of
com
mu
nal
ar
eas
d) D
eal
ing
wit
h e
nq
uir
ies
and
p
rovi
din
g su
pp
ort
to
te
nan
ts
by
ph
on
e, i
n p
ers
on
, or …
e) G
rou
nd
s m
ain
ten
ance
f) H
avin
g yo
ur
say
on
ho
w
ho
usi
ng
in t
he
cit
y is
m
anag
ed
g) Im
pro
vin
g th
e l
oo
k an
d
fee
l of
you
r n
eig
hb
ou
rho
od
h) S
up
po
rt f
rom
sta
ff
me
mb
ers
to m
anag
e y
ou
te
nan
cy
i) P
rovi
din
g sh
elt
ere
d
acco
mm
od
atio
n f
or
eld
erl
y o
r vu
lne
rab
le te
nan
ts
j) R
ep
airi
ng
you
r h
om
e
k) T
ackl
ing
anti
so
cial
b
eh
avio
ur
1st 2nd 3rd
27
10.2 When asked if they have any other housing related issues that should be prioritised, 9.5%
made suggestions, while 24.8% made comments relating to a single improvement which
they would like to made in their neighbourhood, both of which are listed at Appendix 4B.
10.3 When asked what were the top three reasons respondents would have for moving to an
older people’s housing scheme, the most popular responses related to ‘security’, ‘need
support’ and the nature of the accommodation. Full responses are listed at Appendix 4B.
28
11. ABOUT YOU
Question 30: 'Please provide details for all household members including yourself.'
Question 31: 'Does the household include a pregnant woman?'
Question 32: 'What is your work status?'
Question 33: 'What is your ethnic group?'
Question 34: 'Are your day to day activities limited because of a health problem which
has lasted, or is expected to last, at least 12 months?'
Question 35: 'Does anyone in the household require…?'
Question 36: 'How likely are you to move from your current home in the next 3 years?'
Question 37: 'Where are you most likely to move to?'
Question 38: 'Why would you like to move?'
Appendix 3B - Pages 52 to 54
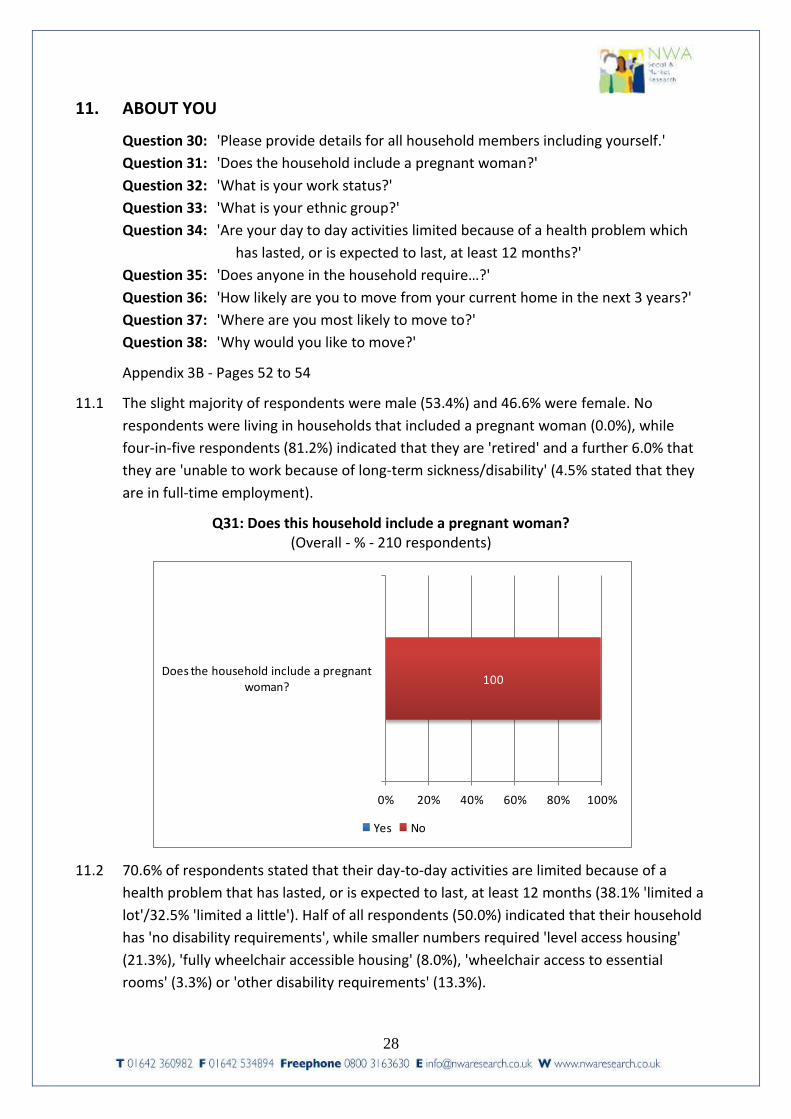
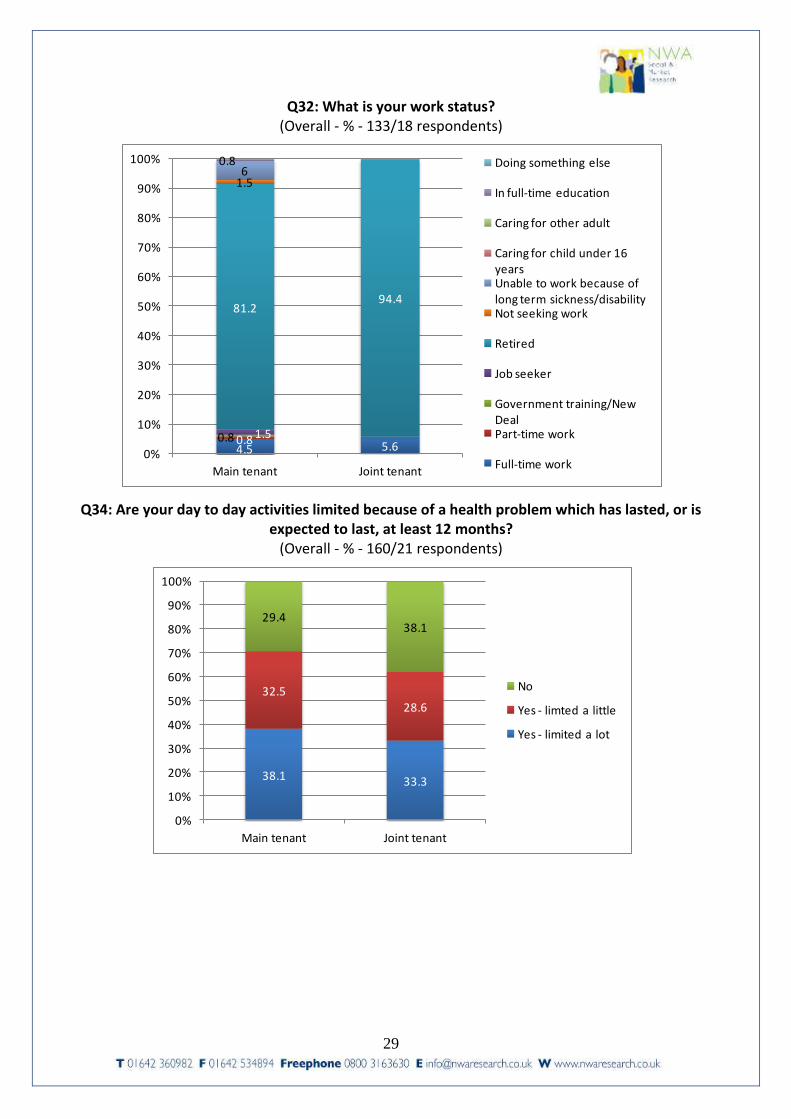
11.1 The slight majority of respondents were male (53.4%) and 46.6% were female. No
respondents were living in households that included a pregnant woman (0.0%), while
four-in-five respondents (81.2%) indicated that they are 'retired' and a further 6.0% that
they are 'unable to work because of long-term sickness/disability' (4.5% stated that they
are in full-time employment).
Q31: Does this household include a pregnant woman? (Overall - % - 210 respondents)
11.2 70.6% of respondents stated that their day-to-day activities are limited because of a
health problem that has lasted, or is expected to last, at least 12 months (38.1% 'limited a
lot'/32.5% 'limited a little'). Half of all respondents (50.0%) indicated that their household
has 'no disability requirements', while smaller numbers required 'level access housing'
(21.3%), 'fully wheelchair accessible housing' (8.0%), 'wheelchair access to essential
rooms' (3.3%) or 'other disability requirements' (13.3%).
100
0% 20% 40% 60% 80% 100%
Does the household include a pregnant woman?
Yes No
29
Q32: What is your work status? (Overall - % - 133/18 respondents)
Q34: Are your day to day activities limited because of a health problem which has lasted, or is expected to last, at least 12 months?
(Overall - % - 160/21 respondents)
4.5 5.60.80.8 1.5
81.294.4
1.56
0.8
0%
10%
20%
30%
40%
50%
60%
70%
80%
90%
100%
Main tenant Joint tenant
Doing something else
In full-time education
Caring for other adult
Caring for child under 16 yearsUnable to work because of long term sickness/disabilityNot seeking work
Retired
Job seeker
Government training/New DealPart-time work
Full-time work
38.1 33.3
32.528.6
29.438.1
0%
10%
20%
30%
40%
50%
60%
70%
80%
90%
100%
Main tenant Joint tenant
No
Yes - limted a little
Yes - limited a lot

30
Q35: Does anyone in the household require...? (Overall - % - 150 respondents)
Q36: How likely are you to move from your current home in the next 3 years? (Overall - % - 210 respondents)
11.3 Three-quarters of respondents (76.0%) stated that they are either ‘fairly’ (16.2%) or ‘very
unlikely’ (59.8%) to move from their current home in the next 3 years, rising to 91.1% of
respondents between the ages of 75 and 84. 12.3% were ‘neither’ likely nor unlikely to
move from their home, while 11.7% were either ‘very’ (6.1%) or ‘fairly likely’ (5.6%) to do
so, rising to 24.0% of respondents under the age of 65.
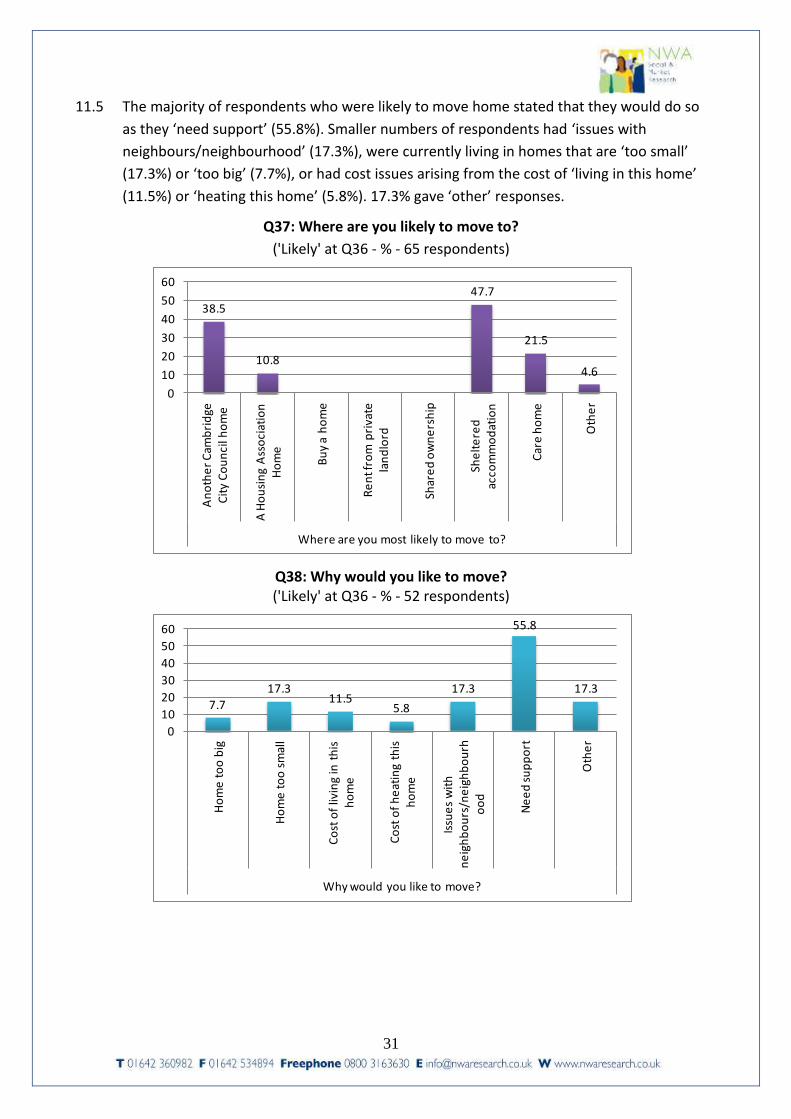
11.4 47.7% of respondents who indicated that they are likely to move within the next 3 years
stated that they are most likely to move to ‘sheltered accommodation’, while a further
38.5% would move to ‘another Cambridge City Council home’. 21.5% are likely to move to
a ‘care home’, with 10.8% giving ‘a Housing Association home’ responses. 4.6% gave
‘other’ responses.
83.3
21.3
13.3
50
0%
10%
20%
30%
40%
50%
60%
70%
80%
90%
100%
Does anyone in the household require…?
No disability requirements
Other disability requirements
Level access housing
Wheelchair access to essential rooms
Fully wheelchair accessible housing
11.7
12.3
76
0%
10%
20%
30%
40%
50%
60%
70%
80%
90%
100%
How likely are you to move from your current home in the next 3 years?
Fairly/very unlikely
Neither
Very/fairly likely
31
11.5 The majority of respondents who were likely to move home stated that they would do so
as they ‘need support’ (55.8%). Smaller numbers of respondents had ‘issues with
neighbours/neighbourhood’ (17.3%), were currently living in homes that are ‘too small’
(17.3%) or ‘too big’ (7.7%), or had cost issues arising from the cost of ‘living in this home’
(11.5%) or ‘heating this home’ (5.8%). 17.3% gave ‘other’ responses.
Q37: Where are you likely to move to?
('Likely' at Q36 - % - 65 respondents)
Q38: Why would you like to move? ('Likely' at Q36 - % - 52 respondents)
38.5
10.8
47.7
21.5
4.6
0
10
20
30
40
50
60
An
oth
er
Cam
bri
dge
C
ity
Co
un
cil h
om
e
A H
ou
sin
g A
sso
ciat
ion
H
om
e
Bu
y a
ho
me
Re
nt f
rom
pri
vate
la
nd
lord
Shar
ed
ow
ne
rsh
ip
She
lte
red
ac
com
mo
dat
ion
Car
e h
om
e
Oth
er
Where are you most likely to move to?
7.7
17.311.5
5.8
17.3
55.8
17.3
0
10
20
30
40
50
60
Ho
me
to
o b
ig
Ho
me
to
o s
mal
l
Co
st o
f liv
ing
in t
his
h
om
e
Co
st o
f h
eat
ing
this
h
om
e
Issu
es
wit
h
ne
igh
bo
urs
/ne
igh
bo
urh
oo
d
Ne
ed
su
pp
ort
Oth
er
Why would you like to move?