camille kandiko, indiana university bloomington jon acker and william fendley, the university of...
TRANSCRIPT

Camille Kandiko, Indiana University Bloomington
Jon Acker and William Fendley, The University of Alabama
Lawrence Redlinger, The University of Texas at Dallas
The National Survey of Student Engagement:
Promoting Assessment & Accountability in Higher Education
Presentation Overview
The National Survey of Student Engagement
Institutional Perspectives The University of Alabama The University of Texas at Dallas
Questions and Discussion

Two Components of Student Engagement
What institutions do -- using effective educational practices to induce students to do the right things
What students do -- time and energy devoted to educationally purposeful activities
What is the National Survey of Student Engagement?
(pronounced “nessie”)
A college student survey that assesses the extent to which students engage in educational practices associated with high levels of learning and development
A way to refocus conversation about college quality

NSSE Items
Student Behaviors in College
Institutional Actions & Requirements
Student Reactions to College
Student BackgroundInformation
Related to Student Learning &
Development
Institutional Actions & Requirements

NSSE Survey Administration
National Survey of Student Engagement
Third Party Administration Random Sample of First-year
& Senior Students Spring Semester Administration Modes:
Paper Web-only Web +
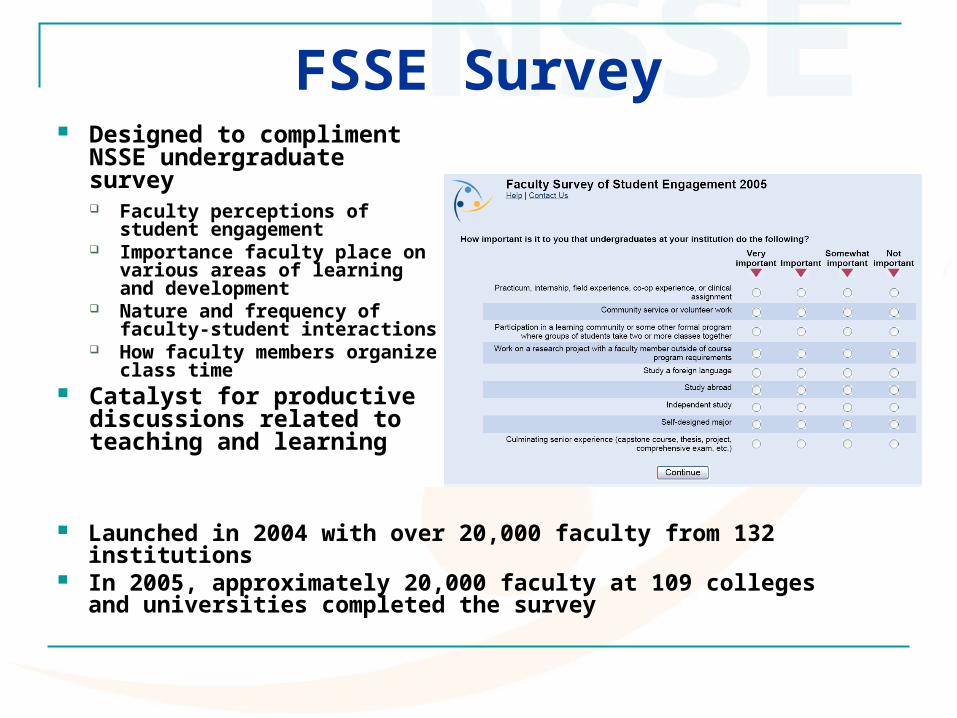
FSSE Survey Designed to compliment
NSSE undergraduate survey Faculty perceptions of student
engagement Importance faculty place on
various areas of learning and development
Nature and frequency of faculty-student interactions
How faculty members organize class time
Catalyst for productive discussions related to teaching and learning
Launched in 2004 with over 20,000 faculty from 132 institutions In 2005, approximately 20,000 faculty at 109 colleges and
universities completed the survey

BCSSE Survey Based on numerous requests
over the years for pre-college controls
Measures first-year students’ expectations for college and selected high school experiences
Ability to combine with spring NSSE data for pre- and post-look at first-year experience
Second pilot in Fall 2005 with an estimated 75 institutions

NSSE Project Scope
Half of the participating institutions in self-selected consortia 50 states, D.C., the Virgin Islands & Puerto Rico
Canada, Italy, Lebanon, Japan, Macedonia Sent surveys to over 700,000 students annually
Project Year Colleges & Universities
NSSE 2003 437
NSSE 2004 473
NSSE 2005 529
NSSE 2006 560 (in progress)
NSSE Institutional Report Overview
Institutional student data
Means summary report
Frequency distribution
First-year students vs. seniors
Comparative data for same Carnegie type, peer group or consortium, and national
National benchmark data (available in November)

National Benchmarks of Effective Educational Practice
Level of Academic Challenge
Active & Collaborative
Learning
EnrichingEducational Experiences
SupportiveCampus
Environment
StudentFaculty Interaction
NSSE developed five indicators, or benchmarks, to represent the multi-dimensional nature of student engagement at the institutional, sector, and national levels
Using NSSE Data
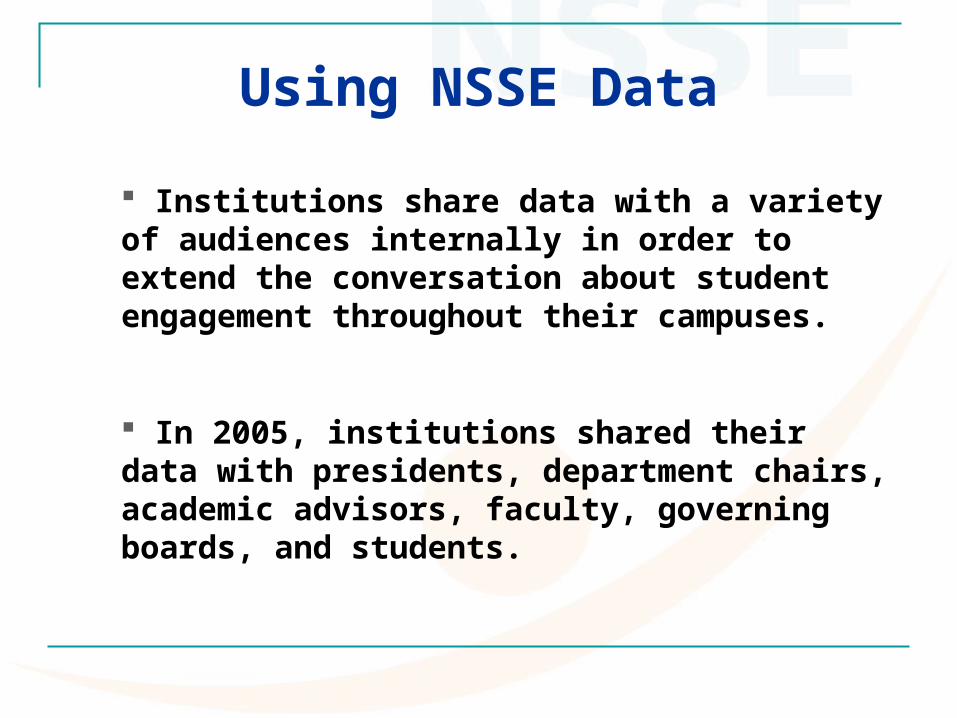
Institutions share data with a variety of audiences internally in order to extend the conversation about student engagement throughout their campuses.
In 2005, institutions shared their data with presidents, department chairs, academic advisors, faculty, governing boards, and students.

Using NSSE Data
Institutions share data with external audiences in order to refocus the conversation on college quality on state, regional, and national levels.
In 2004, institutions shared data with accreditation agencies, media, prospective students, parents, and alumni.

The University of Alabama
For SACS re-affirmation developed a Quality Enhancement Plan that focuses on improving student learning.
Used feedback from the NSSE survey and saw that the lowest score (and greatest opportunity for improvement) was in active and collaborative learning among first-year students.
UA uses NSSE data during self- assessment to identify areas to focus on improvement to drive the Quality Enhancement Plan.

The University of Alabama
UA developed a QEP strategy around using active and collaborative learning to enhance student learning in first-year courses. The initiative focuses on introducing active and collaborative learning methods in large lecture classes.
At present, UA is endeavoring to identify which classes employ active and collaborative learning activities and which classes do not.

University of Texas at Dallas
Student satisfaction is an outcome measure of the educational experience. Legislation passed in 1999 in the 76th session of the Texas Legislature requires that all state agencies and public universities address customer satisfaction.
To help meet this mandate, U. T. System participates in (NSSE).

Use of NSSE in UT System The University of Texas System is committed to providing
opportunities for access to and success in high-quality, affordable higher education for students from a wide range of social, ethnic, cultural, and economic backgrounds.
Evaluation by first-year students of academic advising as “good” or “excellent” increased from 2003 to 2004 at U. T. Austin, U. T. Brownsville/TSC, U. T. Dallas, and U. T. Permian Basin.

Dissemination: Potential NSSE Roadmap
Step #1: Survey Data
• Survey Students• Review Results• Develop Preliminary
List of Strengths and Opportunities for Improvement
Step #2: Feedback
• Share results with Faculty, Administrators & Students
• Identify Themes & Priorities
• Design Action Plan
Step #2: Feedback
• Share results with Faculty, Administrators & Students
• Identify Themes & Priorities
• Design Action PlanStep #3: Action Plan
• Finalize Plan• Share Plan with
Appropriate Groups• Link to Strategic
Plan• Implement Action
Step #4: Follow-up
• Use Results as Benchmarks to Monitor Progress
• Faculty & Student Focus Groups
Step #4: Follow-up
• Use Results as Benchmarks to Monitor Progress
• Faculty & Student Focus Groups
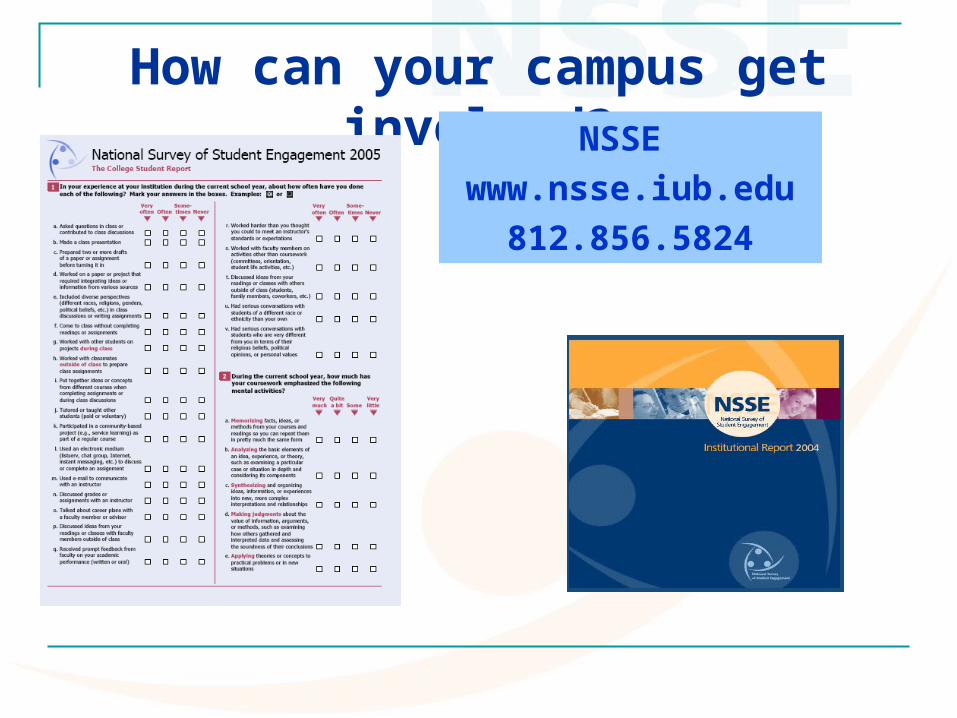
How can your campus get involved?NSSE
www.nsse.iub.edu
812.856.5824

Questions and Discussion

The National Survey of Student Engagement: Promoting Assessment & Accountability in Higher
EducationCamille Kandiko, NSSE Project Associate
William Fendley, The University of Alabama ([email protected])
John Acker, The University of Alabama
Lawrence Redlinger, The University of Texas at Dallas ([email protected])