campbell scientific obs-3+ turbidity sondes with optical wiper...ashby creek upper (2015) march 23rd...
TRANSCRIPT


•
•
•

• Campbell Scientific OBS-3+ Turbidity Sondes with Optical Wiper
• High Frequency Data Sampling Interval
• Most Locations Instrumented with Stage Height Recorders and Rain Gauge

From Schwartz et al., 2008
Events Duration % Sample Events Duration % Sample Events Duration % Sample Events Duration % Sample Events Duration % Sample Events Duration % Sample
Sweede - Upper (2011) May 12th - Septmeber 30th 137.4 601 7.08 5.2% 22 0.18 0.1% 0 0 0.0% 0 0 0.0% 0 0 0.0% 0 0 0.0%
Sweede - Lower (2011) May 12th - Septmeber 30th 135.9 34 0.54 0.4% 2 0.01 0.0% 0 0 0.0% 0 0 0.0% 0 0 0.0% 0 0 0.0%
Harris Creek (2012) June 6th - November 7th 148.9 3 0.03 0.0% 0 0 0.0% 0 0 0.0% 0 0 0.0% 0 0 0.0% 0 0 0.0%
Harris Creek (2013) April 9th - October 9th 182.9 55 44.17 24.1% 6 0.08 0.0% 1 0.03 0.0% 1 0.02 0.0% 0 0 0.0% 0 0 0.0%
Harris Creek (2014)** April 10th - November 5th 189.0 328 54.85 29.0% 189 30.69 16.2% 27 2.49 1.3% 14 0.34 0.2% 1 0.05 0.0% 0 0 0.0%
Harris Creek (2015) March 25th - September 9th 168.3 2 0.01 0.0% 0 0.00 0.0% 0 0.00 0.0% 0 0.00 0.0% 0 0.00 0.0% 0 0 0.0%
Harris Creek (2016 March 21st- October 14th 208.0 28 0.91 0.4% 13 0.10 0.1% 2 0.01 0.0% 0 0.00 0.0% 0 0.00 0.0% 0 0 0.0%
Whitetail - Lower (2010) April 8th - October 12th 176.4 39 15.9 9.0% 52 10.1 5.7% 41 5.7 3.2% 19 2 1.1% 7 0.9 0.5% 0 0 0.0%
Whitetail - Upper (2011) May 5th - September 30th 170.3 5 0.09 0.1% 1 0.01 0.0% 1 0.01 0.0% 0 0 0.0% 0 0 0.0% 0 0 0.0%
Whitetail - Middle (2011) May 5th - September 30th 148.5 4 0.05 0.0% 2 0.01 0.0% 2 0.01 0.0% 0 0 0.0% 0 0 0.0% 0 0 0.0%
Whitetail - Lower (2011) April 12th - September 30th 141.6 5 0.06 0.0% 4 0.06 0.0% 3 0.03 0.0% 3 0.02 0.0% 0 0 0.0% 0 0 0.0%
Ashby Creek Lower (2012) June 8th -October 12th 135.5 255 14.07 10.4% 33 1.62 1.2% 16 0.63 0.3% 6 0.3 0.2% 1 0.07 0.1% 0 0 0.0%
Ashby Creek Lower (2013)* April 3rd - November 19th 230.1 402 46.67 20.3% 209 13.97 6.1% 156 6.85 5.1% 130 4.81 2.1% 85 3.37 1.5% 51 2.40 1.0%
Ashby Creek Lower (2014) March 20th - October 20th 213.9 367 85.74 40.1% 110 30.28 14.2% 26 4.53 2.1% 12 0.65 5.6% 2 0.04 0.9% 0 0.00 0.0%
Ashby Creek Lower (2015) March 23rd - September 29th 189.7 205 14.79 7.8% 17 1.69 0.9% 10 0.51 0.3% 1 0.07 0.0% 0 0.00 0.0% 0 0.00 0.0%
Ashby Creek Upper (2014) March 20th - October 20th 214 360 75.06 35.1% 182 38.03 17.8% 43 15.90 7.4% 58 7.78 3.6% 10 3.06 1.4% 6 1.28 0.6%
Ashby Creek Upper (2015) March 23rd - September 20th 181.3 188 9.20 5.1% 19 1.50 0.8% 12 0.56 0.3% 5 0.13 0.1% 3 0.03 0.0% 2 0.01 0.0%
7 20 55 150Sample Size
(days)Site Name
Turbidity Thresholds (NTU)
400 1000Sample Period
• Data QA/QC to remove fouled data
• Concentration-Duration-Frequency Analysis

From Newcombe, 2003
Connecting the physical to the biological:
• Empirical model relying heavily on sediment
dose effect models
• Optimized for clear water systems
• Calculates severity of ill effects (SEV) for
trout and ranges from 0-14
• SEV 0 = nil effect -> SEV 14 = 100% mortality

Upper Willow Creek, Anaconda Unit: Culvert Removal
Upper Willow Culvert Removal
% Exceedance NTU
99.0 2.6
95.0 2.7
90.0 2.8
80.0 4.0
50.0 5.6
25.0 8.5
10.0 28.4
5.0 102.8
2.0 226.9
1.0 338.0
0.1 861.4
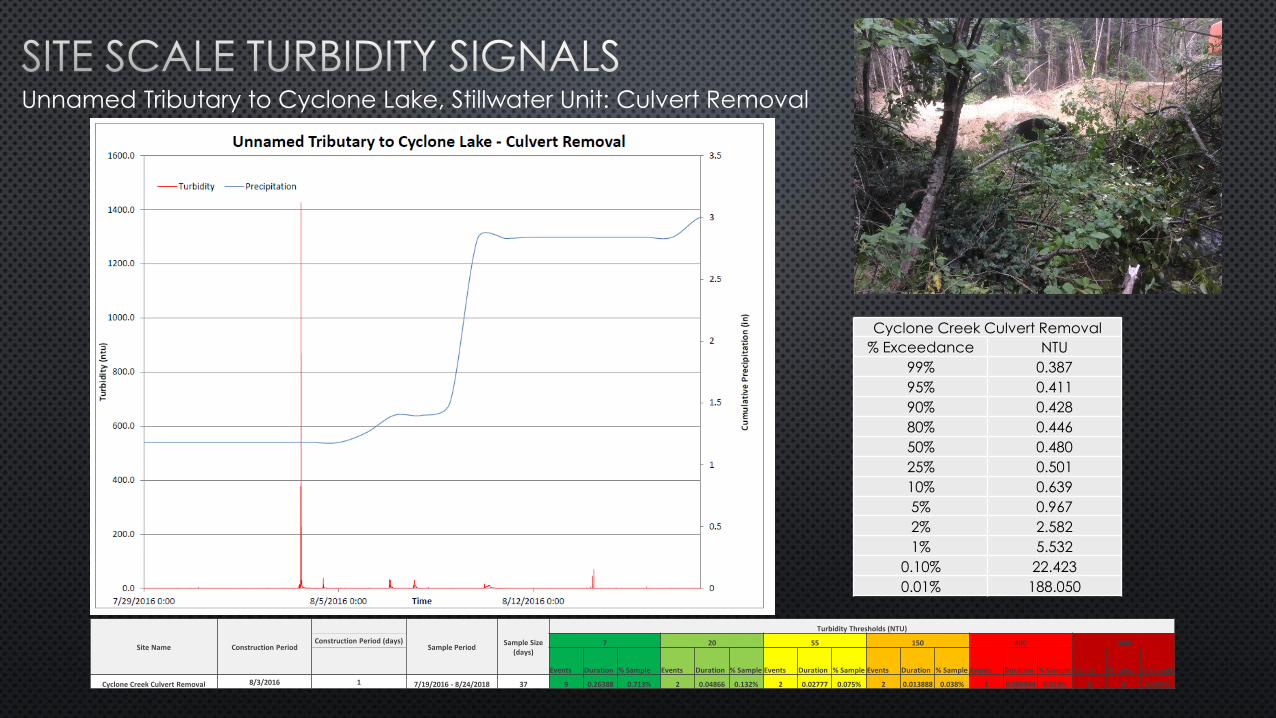
Unnamed Tributary to Cyclone Lake, Stillwater Unit: Culvert Removal
Cyclone Creek Culvert Removal
% Exceedance NTU
99% 0.387
95% 0.411
90% 0.428
80% 0.446
50% 0.480
25% 0.501
10% 0.639
5% 0.967
2% 2.582
1% 5.532
0.10% 22.423
0.01% 188.050
Site Name Construction Period
Sample Period Sample Size
(days)
Turbidity Thresholds (NTU)
Construction Period (days) 7 20 55 150 400 1000
Events Duration % Sample Events Duration % Sample Events Duration % Sample Events Duration % Sample Events Duration % Sample Events Duration % Sample
Cyclone Creek Culvert Removal 8/3/2016 1 7/19/2016 - 8/24/2018 37 9 0.26388 0.713% 2 0.04866 0.132% 2 0.02777 0.075% 2 0.013888 0.038% 1 0.006944 0.019% 0 0 0.000%

Swede Creek, Stillwater Unit: Stream Emulation Culvert
% Exceedance NTU
99 0
95 0
90 0
80 0
50 0
25 1
10.0 2
5.0 7
2.0 14
1.0 27
0.1 671
Swede Creek Culvert Replacement

Cyclone Creek, Stillwater Unit: Stream Emulation Culvert
Site Name Construction Period
Sample Period Sample Size
(days)
Turbidity Thresholds (NTU)
Construction Period (days) 7 20 55 150 400 1000
Events Duration % Sample Events Duration % Sample Events Duration % Sample Events Duration % Sample Events Duration % Sample Events Duration % Sample
Cyclone Creek Culvert Replacement 7/26/2016 - 8/2/2016 8 7/6/2016 - 8/24/2019 50 36 9.38888 18.778% 18 3.673611 7.347% 16 1.13888 2.278% 8 0.486111 0.972% 6 0.208333 0.417% 3 0.041666 0.083%
Cyclone Creek Culvert Replacement
% Exceedance NTU
99% 0.160
95% 0.213
90% 0.231
80% 0.256
50% 2.278
25% 4.616
10% 13.607
5% 29.543
2% 72.282
1% 149.544
0.10% 926.631
0.01% 1465.059

Whitetail Creek, Swan Unit : Fish Passage Barrier
% Exceedence NTU
99% 0.0
95% 0.0
90% 0.0
80% 0.0
50% 0.0
25% 0.0
10% 4.0
5% 29.0
2% 87.0
1% 167.0
0.10% 708.0
0.01% 775.0
Whitetail Creek Barrier Install

Stillwater Unit: Cross Laminated Temporary Bridge Removal

Bear Creek, Missoula Unit: Culvert Removal Sc
ale
Ch
an
ge

South Woodward Creek, Swan Unit: Culvert Removal

Harris Creek, Libby Unit: Regeneration Harvest and Broadcast Burning

Harris Creek, Libby Unit: Regeneration Harvest and Broadcast Burning

Harris Creek, Libby Unit: Regeneration Harvest and Broadcast Burning
Harris Creek 99% 95% 90% 80% 50% 25% 10% 5% 2% 1% 0.10% 0.01%
2012 1.1 1.2 1.2 1.2 1.3 1.4 1.5 1.5 1.6 1.8 3.4 15.1
2013 4.3 4.5 4.6 4.8 5.7 6.3 10.9 11.1 11.2 11.3 12.3 173.9
2014 2.3 2.4 2.4 2.5 2.9 9.2 28.6 32.0 40.4 70.9 182.3 551.0
2015 1.2 1.2 1.3 1.3 1.5 1.7 2.1 2.4 2.8 2.9 3.5 7.9
2016 0.48 0.53 0.55 0.6 0.7 0.9 2.2 2.9 3.9 5.2 9.2 81.7
Average 1.9 2.0 2.0 2.1 2.4 3.9 9.1 10.0 12.0 18.4 42.1 165.9
Median 1.2 1.2 1.3 1.3 1.5 1.7 2.2 2.9 3.9 5.2 9.2 81.7
Max 4.3 4.5 4.6 4.8 5.7 9.2 28.6 32.0 40.4 70.9 182.3 551.0
Min 0.5 0.5 0.5 0.6 0.7 0.9 1.5 1.5 1.6 1.8 3.4 7.9
STDEV 1.5 1.6 1.6 1.7 2.0 3.7 11.6 12.9 16.3 29.5 78.5 225.4
Events Duration % Sample Events Duration % Sample Events Duration % Sample Events Duration % Sample Events Duration % Sample Events Duration % Sample
Harris Creek (2012) June 6th - November 7th 148.9 3 0.03 0.0% 0 0 0.0% 0 0 0.0% 0 0 0.0% 0 0 0.0% 0 0 0.0%
Harris Creek (2013) April 9th - October 9th 182.9 55 44.17 24.1% 6 0.08 0.0% 1 0.03 0.0% 1 0.02 0.0% 0 0 0.0% 0 0 0.0%
Harris Creek (2014)** April 10th - November 5th 189.0 328 54.85 29.0% 189 30.69 16.2% 27 2.49 1.3% 14 0.34 0.2% 1 0.05 0.0% 0 0 0.0%
Harris Creek (2015) March 25th - September 9th 168.3 2 0.01 0.0% 0 0.00 0.0% 0 0.00 0.0% 0 0.00 0.0% 0 0.00 0.0% 0 0 0.0%
Harris Creek (2016 March 21st- October 14th 208.0 28 0.91 0.4% 13 0.10 0.1% 2 0.01 0.0% 0 0.00 0.0% 0 0.00 0.0% 0 0 0.0%
Site Name Sample PeriodSample Size
(days)
Turbidity Thresholds (NTU)
7 20 55 150 400 1000

Exceedance Probability Curves
Increasing Management Intensity
within Watershed

1.57 mi2
1.81 mi2
4.52 mi2
11.02 mi2
Swede Creek
Harris Creek
Whitetail Creek
Ashby Creek

•
•
•
•

•
•
•

For more information:
Jeff Schmalenberg – MT DNRC
Missoula, MT
406.542.4322