campcounts 2020 - american camp association
TRANSCRIPT

CAMPCOUNTS 2020 Enrollment, Finance, COVID-19 Responses, and Practices

CAMP COUNTS 2020 1
CAMPCOUNTS 2020 CampCounts 2020 is one of three annual surveys conducted by the ACA Research Team. The
purpose of the CampCounts series is to support camp professionals in their operational decision
making and to support ACA’s advocacy efforts. Responses are anonymous and reported in
aggregate by the following segments: primary program type (day and overnight), business model,
budget size, and region. This report describes CampCounts 2020, which was unique in its efforts to
capture the effects of the COVID-19 pandemic on camps in the U.S. Results are compared to the
2017 ACA Business Operations Survey (now called CampCounts) where possible.
CONTENTS
Survey Methods ............................................................................................................ 2
2020 Camp Participants, Staff, and Program Snapshot ................................................ 5
2020 Camp Financial Snapshot .................................................................................. 13
COVID-19 Prevention Practices & Outcomes ............................................................. 28
CAMP COUNTS 2020 2
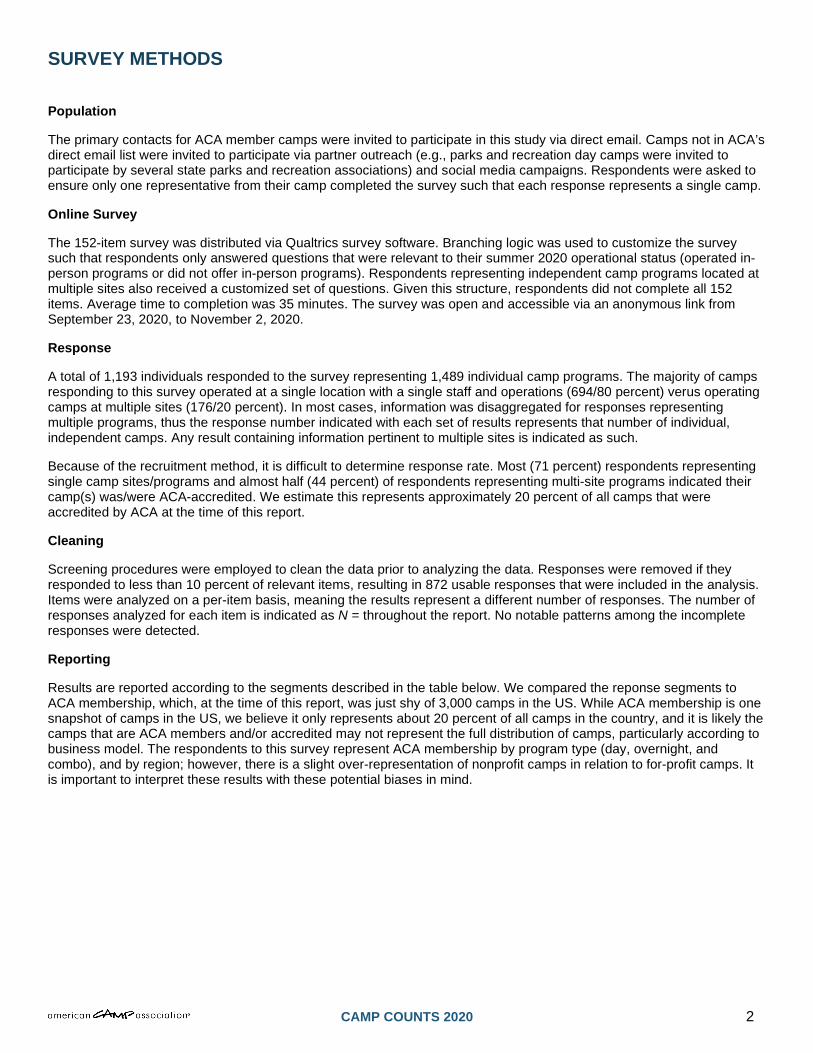
SURVEY METHODS
Population
The primary contacts for ACA member camps were invited to participate in this study via direct email. Camps not in ACA’s direct email list were invited to participate via partner outreach (e.g., parks and recreation day camps were invited to participate by several state parks and recreation associations) and social media campaigns. Respondents were asked to ensure only one representative from their camp completed the survey such that each response represents a single camp.
Online Survey
The 152-item survey was distributed via Qualtrics survey software. Branching logic was used to customize the survey such that respondents only answered questions that were relevant to their summer 2020 operational status (operated in-person programs or did not offer in-person programs). Respondents representing independent camp programs located at multiple sites also received a customized set of questions. Given this structure, respondents did not complete all 152 items. Average time to completion was 35 minutes. The survey was open and accessible via an anonymous link from September 23, 2020, to November 2, 2020.
Response
A total of 1,193 individuals responded to the survey representing 1,489 individual camp programs. The majority of camps responding to this survey operated at a single location with a single staff and operations (694/80 percent) verus operating camps at multiple sites (176/20 percent). In most cases, information was disaggregated for responses representing multiple programs, thus the response number indicated with each set of results represents that number of individual, independent camps. Any result containing information pertinent to multiple sites is indicated as such.
Because of the recruitment method, it is difficult to determine response rate. Most (71 percent) respondents representing single camp sites/programs and almost half (44 percent) of respondents representing multi-site programs indicated their camp(s) was/were ACA-accredited. We estimate this represents approximately 20 percent of all camps that were accredited by ACA at the time of this report.
Cleaning
Screening procedures were employed to clean the data prior to analyzing the data. Responses were removed if they responded to less than 10 percent of relevant items, resulting in 872 usable responses that were included in the analysis. Items were analyzed on a per-item basis, meaning the results represent a different number of responses. The number of responses analyzed for each item is indicated as N = throughout the report. No notable patterns among the incomplete responses were detected.
Reporting
Results are reported according to the segments described in the table below. We compared the reponse segments to ACA membership, which, at the time of this report, was just shy of 3,000 camps in the US. While ACA membership is one snapshot of camps in the US, we believe it only represents about 20 percent of all camps in the country, and it is likely the camps that are ACA members and/or accredited may not represent the full distribution of camps, particularly according to business model. The respondents to this survey represent ACA membership by program type (day, overnight, and combo), and by region; however, there is a slight over-representation of nonprofit camps in relation to for-profit camps. It is important to interpret these results with these potential biases in mind.

CAMP COUNTS 2020 3
CampCounts Sample Profile By Segment
Segment Description Number of Responses
Percent of Segment
Percent of ACA
Member Camps
Primary Program Type
Day 50% or more day camp programming 337 40% 46%
Overnight 50% or more overnight camp programming or overnight rentals 437 50% 35%
Combo
Even distribution of two or more program types (day, overnight, and rental)
95 11% 19%
TOTAL FOR PROGAM TYPE 869
Camp Owner/Sponsor
Independent nonprofit (INP)
501(c)(3) status but not affiliated with an agency or umbrella organization 266 31% 16%
For-profit (FP) Commercial status, sometimes affiliated with an umbrella organization 194 22% 21%
Municipal/government (Gov) City, county, state, or federal programs 74 8% 2%
Nonprofit affiliated with another entity (NP-Affiliated)
501(c)(3) status affiliated with an agency, faith/religious organization, school, etc.
338 39% 21%
TOTAL FOR CAMP OWNER/SPONSOR 872
Typical Annual Operating Budget
$200,000 or less
Respondents were asked to report their typical operating budget, assuming 2020 was not a typical budgetary year for most camps.
173 22% 29%
$200,001-$500,000 134 17% 15%
$500,001-$1,000,000 164 21% 17%
$1,000,001-$5,000,000 268 34% 29%
$5,000,001 or more 43 .06% 9%
TOTAL FOR TYPICAL OPERATING BUDGET 782
US Region
New England (NE) CT, ME, MA, NH, RI, VT 96 13% 13%
Mid-Atlantic (MidAtl) DE, DC, MD, NJ, NY, PA, VA, WV 208 28% 30%
South (South) AL, AK, FL, GA, KY, LA, MS, NC, OK, PR/VI, SC, TN, TX 112 15% 16%
Mid-America (MidAm) IL, IN, IA, KS, MI, MN, MO, NE, ND, OH, SD, WI 182 24% 22%
West (West) AK, AZ, CA, CO, HI, ID, MT, NM, NV, OR, UT, WA, WY 148 20% 19%
TOTAL FOR REGION 746
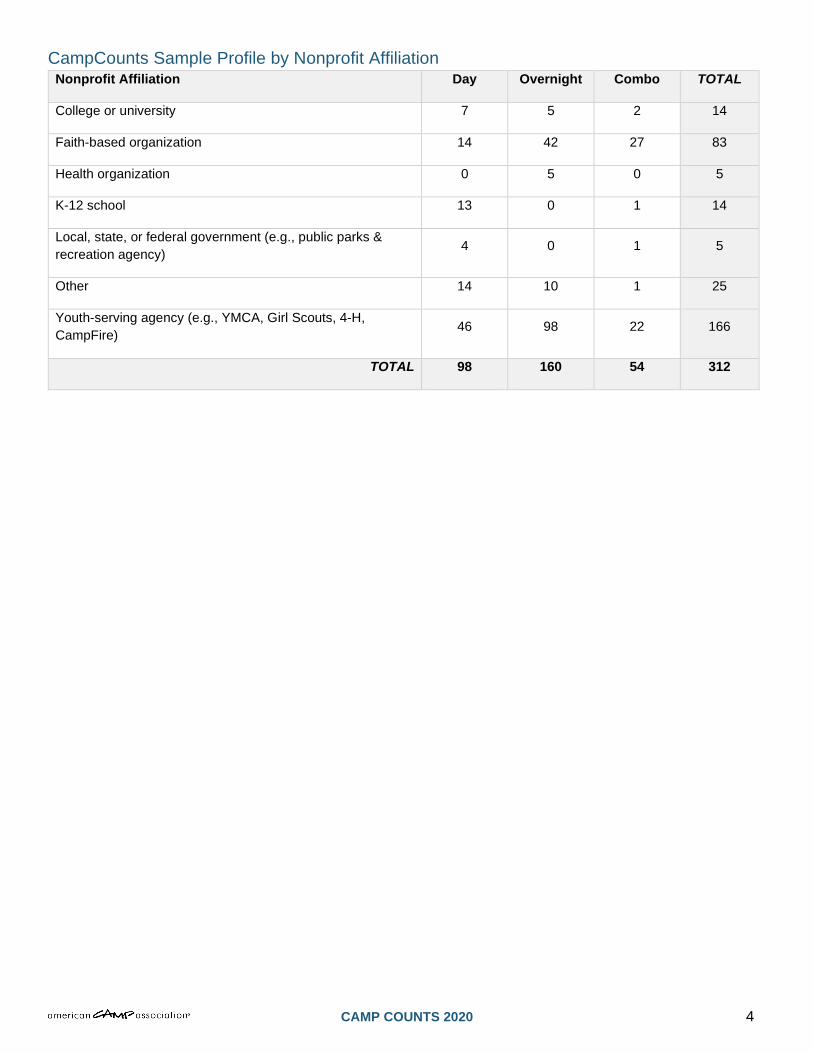
CAMP COUNTS 2020 4
CampCounts Sample Profile by Nonprofit Affiliation Nonprofit Affiliation Day Overnight Combo TOTAL
College or university 7 5 2 14
Faith-based organization 14 42 27 83
Health organization 0 5 0 5
K-12 school 13 0 1 14
Local, state, or federal government (e.g., public parks & recreation agency) 4 0 1 5
Other 14 10 1 25
Youth-serving agency (e.g., YMCA, Girl Scouts, 4-H, CampFire) 46 98 22 166
TOTAL 98 160 54 312

CAMP COUNTS 2020 5
2020 CAMP PARTICIPANTS, STAFF, AND PROGRAM SNAPSHOT
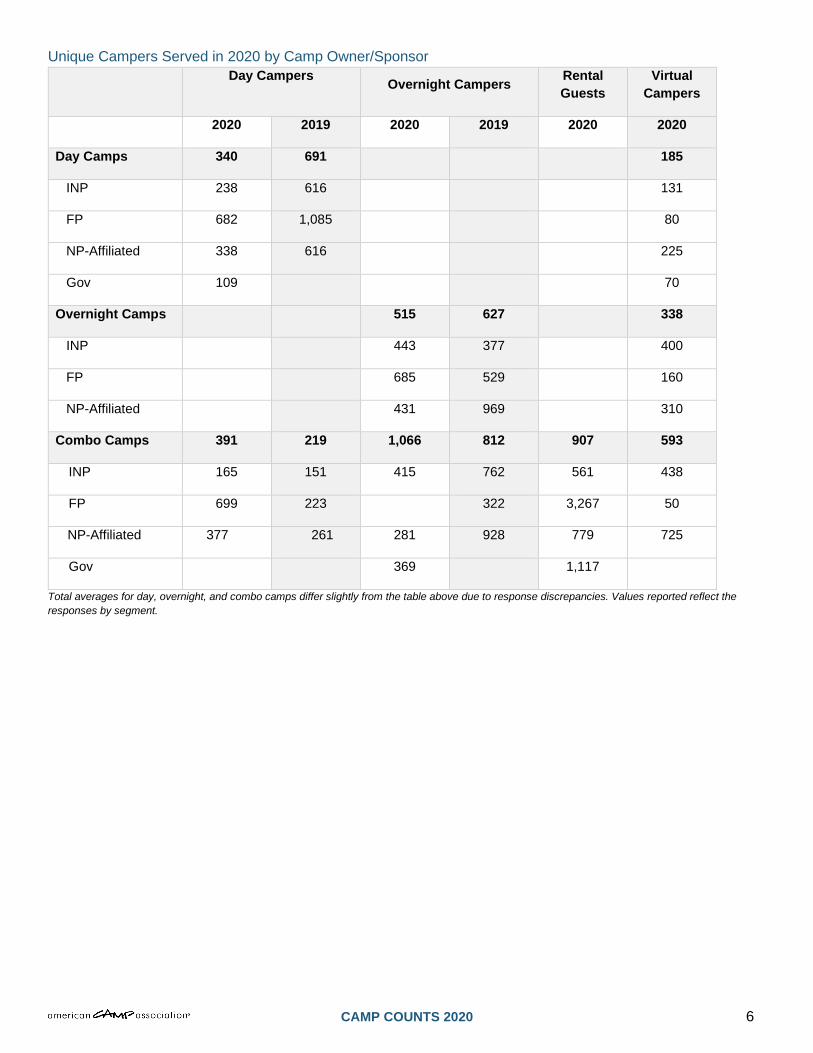
Camp Participants Respondents were asked to report the number of unique campers served in the entire 2020 year and in summer 2020 specifically. Unique campers served counts each participant only one time, even if they attended multiple sessions of camp. This is an important metric for understanding the total reach of camp programs in the US.
These averages were calculated using only the enrollment numbers reported. Blank cells represent segments where no enrollment was reported, or there were too few responses to report. This could be an omission by the respondent and should not be interpreted as no campers served. Overall, response rate for this section was low, so interpret with caution.
As expected, there were fewer campers served across all camp types in 2020. Our data suggest there was a 61 percent decline in day campers served and 26 percent fewer overnight campers served. While we expected fewer campers served in overnight camps, it is possible that a small number of camps in the Mid-Atlantic region served a larger than expected number of overnight campers in 2020, thus skewing the data.
Average Number of Unique Campers Served Per Camp in 2020 and 2019, by Region Day Campers Overnight Campers Rental
Guests Virtual
Campers
2020 2019 2020 2019 2020 2020
Day Camps 270 691 170
NE 356 580 187
MidAtl 179 491 253
South 164 479 185
MidAm 423 862 53
West 216 1,116 58
Overnight Camps 466 627 316
NE 176 326 468
MidAtl 1,062 638 135
South 371 1,060 687
MidAm 423 659 183
West 340 658 290
Combo Camps 428 220 379 812 825 482
NE 398 254 527 418 25
MidAtl 374 236 20 617 1,225 901
South 1,588 191 435 1,042 634 517
MidAm 172 185 425 617 1,086 154
West 34 265 400 1,085 421 100
Virtual campers are included here because they were reported by respondents representing all program types. This does not indicate that all camps served campers virtually in 2020; this is the average number of campers served virtually across camps that served campers virtually.
CAMP COUNTS 2020 6
Unique Campers Served in 2020 by Camp Owner/Sponsor
Day Campers Overnight Campers Rental Guests
Virtual Campers
2020 2019 2020 2019 2020 2020
Day Camps 340 691 185
INP 238 616 131
FP 682 1,085 80
NP-Affiliated 338 616 225
Gov 109 70
Overnight Camps 515 627 338
INP 443 377 400
FP 685 529 160
NP-Affiliated 431 969 310
Combo Camps 391 219 1,066 812 907 593
INP 165 151 415 762 561 438
FP 699 223 322 3,267 50
NP-Affiliated 377 261 281 928 779 725
Gov 369 1,117
Total averages for day, overnight, and combo camps differ slightly from the table above due to response discrepancies. Values reported reflect the responses by segment.

CAMP COUNTS 2020 7
Camp Participant Demographics This question was asked only of camps that served campers on-site in summer 2020. Questions were stated as follows:
Estimate the percent of all 2020 campers/guests that fall into the following broad household income categories. Please estimate if you do not have this information readily available. Use whatever makes sense for your region and the communities you serve to determine how you define these categories. Include campers/guests served through all program types, across all sites, and for the entire 2020 year. Skip if you did not serve any campers in any capacity in 2020.
Estimate the percent of all 2020 campers/guests that fall into the following age categories. Please estimate if you do not have this information readily available. Include campers/guests served through all program types, across all sites, and for the entire 2020 year. Skip if you did not serve any campers in any capacity in 2020.
Estimate the percent of all 2020 campers/guests that fall into the following race/ethnicity categories. Please estimate if you do not have this information readily available. Include campers/guests served through all program types, across all sites, and for the entire 2020 year. Skip if you did not serve any campers in any capacity in 2020.
Percent of Campers Served by Demographic Characteristics Day Camps Overnight Camps Combo Camps
Household Income
No income/poverty 3.48% 2.85% 2.73%
Low-income 11.35% 10.95% 14%
Middle-income 37.03% 29.45% 39.18%
High-income 24.39% 19.94% 11.69%
Age 5 years old or younger 10.04% 1.32% 2.44%
6-9 years old 38.27% 11.64% 11.53%
10-12 years old 23.26% 21.30% 19.14%
13-17 years old 7.59% 19.39% 15.32%
18 years old or older 1.74% 12.94% 23.39%
Race/Ethnicity American Indian or Alaska Native 0.50% .57% .25%
Asian 4.71% 1.51% 2.10%
Biracial or Multiracial 4.47% 2.59% 3.17%
Black/African American 9.04% 4.20% 4%
Caucasion/White 48.46% 45.79% 51.17%
Hispanic/Latinx 5.62% 3.49% 5.99%
Native Hawaiian/Pacific Islander 0.19% 0.07% 0.20%
Other 1.05% 1.40% 0.75%
This table is based on the following resonses: Day camp respondents = 195, Overnight camp respondents = 324, Combo camp respondents = 74. Total respondents = 593. Percentages for each segment might not sum to 100% as respondents were asked to estimate the percent in each category but not forced by the survey software to input responses to total 100%.

CAMP COUNTS 2020 8
Camp Staff Demographics This question was asked only of camps that served employed staff at any point in 2020. Questions were stated as follows:
Estimate the percent of all 2020 seasonal and year-round staff that fall into the following race/ethnicity categories. Please estimate if you do not have this information readily available.
Camps responding to this survey indicated employing a variety of seasonal and year-round staff members. On average, more than half of all year-round employees and between 42 percent to 52 percent of seasonal employees were White. Very few staff members from these camps were American Indian or Alaska Natives, nor Native Hawaiian/Pacific Islander. Still, compared to 2018, this seems to represent an increase in diverse representation amongst seasonal staff, who were more than 71 percent White on average at day camps and more than 78 percent White at overnight camps.
Note: We are comparing 2020 to data collected in the 2017 Business Operations Survey, where the question was stated as follows: “What is the racial/ethnic makeup of this year’s paid staff (year-round and seasonal)?” Thus, what you see below is our best attempt to compare “Paid Staff” to “Seasonal” and “Year-Round” staff, although it is possible that some camps might engage volunteers as seasonal and/or year-round staff. The differences between the 2017 and 2020 data are also likely related to reporting error as many respondents did not enter percentages such that they totaled 100 percent.
Percent Paid & Seasonal Staff by Race/Ethnicity Day Camp Overnight Camp Combo Camps
2020 Seasonal
2020 Year-Round
2020 Seasonal
2020 Year-Round
2020 Seasonal
2020 Year-Round
American Indian or Alaska Native .73% .46% 0.11% 0.19% 0% 0%
Asian 1.63% 1.47% 0.64% 0.35% 1% 0%
Biracial or Multiracial 2.51% 1.87% 1.66% 0.42% 1.17% 0.61%
Black/African American 7.39% 4.96% 2.76% 1.08% 5.67% 2.18%
Caucasion/White 49.47% 54.89% 42.20% 64.22% 51.44% 63.70%
Hispanic/Latinx 3.53% 3.45% 3.03% 1.54% 3.94% 5.89%
Native Hawaiian/Pacific
Islander 0.05% 0.10% 0.19% 0.04% 0% 0%
Other 0.82% 1.12% 0.49% 0.61% 0.10% 0%
Day camp respondents = 195, Overnight camp respondents = 324, Combo camp respondents = 74. Total respondents = 593. Percentages for each segment might not sum to 100% as respondents were asked to estimate the percent in each category but not forced by the survey software to input responses to total 100%.

CAMP COUNTS 2020 9
International Staff In response to the challenges of the COVID-19 global pandemic, the United States Department of State temprorarily suspended routine visa services at all US Embassies and Consulates, resulting in a significant reduction of international summer camp staff members. Only 5 percent of day camps and 13 percent of overnight camps indicated having any international staff or staff who were cultural exchange visitors (J-1 Visa holders) on site at any point in 2020 (down from 23 percent and 73 percent, respectively, in 2018). International day camp staff reportedly came from England, Ireland, Israel, Poland, and the UK. International overnight camp staff came from the Australia, Azerbaijan, UK, Canada, China, Columbia, Germany, Holland, Hungary, India, Israel, Ireland, Mexico, New Zealand, Poland, Russia, Scotland, Slovakia, South Africa, Spain, Sweden, and Turkey.
2020 N=300 responses
5%
23%13%
73%
95%
77%87%
27%
D A Y C A MP S 2 0 2 0 D A Y C A MP S 2 0 1 8 O V E R N I G H T C A MP S 2 0 2 0 O V E R N I G H T C A MP S 2 0 1 8
INTERNATIONAL STAFF ON SITE, 2018 AND 2020
Yes No

CAMP COUNTS 2020 10
Programs & Program Pivots When asked about their reasons for not running in 2020, the most common reason indicated by camps responding to this survey was “we could not maintain our camp culture/traditions while implementing necessary COVID-19 prevention protocols.” These results mirrored findings from ACA’s Camps & COVID qualitative study in which 35 camp directors were interviewed about their summer 2020 decision-making process across three distinct time points. “It’s just not camp,” was a common refrain amongst those who opted not to take on virtual or alternative programming. The second most commonly reported reason for not running programming in summer 2020 was “our state or local health department prohibited opening.” As late as June 30, 2020, typically the midpoint of an average camp season, overnight camps were not permitted to operate in four states (Connecticut, New Jersey, New York, and Oregon), 22 states were still waiting for the green light, and three states remained restricted by county regulations.
N = 657
Responses above reflect only camps that indicated they did not run in-person programs in summer 2020. N = 243 individual responses, respondents to this question were allowed to select all that apply.
71%
42% 42%
29%
58% 58%
D A Y C A MP S O V E R N I G H T C A MP S C O MB O C A MP S
SUMMER 2020 IN-PERSON PROGRAMMINGYes No
36%
9%
20%
59%
58%
19%
15%
60%
0% 10% 20% 30% 40% 50% 60% 70%
Our state or local health department prohibited opening
We serve a population that is particularly vulnerable to theeffects of COVID-19
We could not secure sufficient supplies and/or equipment toimplement necessary COVID-19 prevention protocols
We could not maintain our camp culture/traditions whileimplementing necessary COVID-19 prevention protocols
Reasons for Not Running In-Person Programs in Summer 2020
Overnight Camps Day Camps

CAMP COUNTS 2020 11
Of those camps who indicated they did not offer in-person programming in 2020 but offered some “other” kind of programming substitute, some examples include child care, family programs (e.g. family gardening, family camping and rentals, takeout meals), equipment rentals, and extended use of facilities and resources (e.g., supporting local Meals on Wheels programs, renting camp vans to other camps in operation, and offering their site as a base camp for local fire departments fighting forest fires.)
Chart above represents only respondents that indicated they did not offer traditional in-person programming in summer 2020 and who answered “yes” to any of the program pivots provided.
While several of these same camps expressed a hopefulness that none of their changes would have to be permanent, or remained in a “TBD/Uncertain/Still Assessing” state of consideration regarding the permanence of changes they made, many camps discovered new programs, protocols, and procedures that are likely to stick around even in a post-pandemic summer. The most commonly reported changes that camps suggested would likely be permanent involved a continuation and further integration of virtual programming (both summer-specific and year-round, actual enrolled programming and simple engagement/communication strategies, and also virtual training options for staff), cleaning protocols, and changes to the check-in/check-out process.
Similarly, several camp directors interviewed as part of the Camps & COVID Summer 2020 Decision-Making research study highlighted some of the pleasant surprises that came out of programmatic changes in response to the pandemic that they’re looking forward to holding on to, such as contactless drop-off and pickup and the elimination of package deliveries during extended overnight camp stays. Many also spoke to the advantages of cohorts. For example, one camp, responding to the need for campers to move through the day in a group, shifted activities that may have been an elective for some or activities that in a normal summer would have come with an extra fee instead became standard and all campers were able to participate regardless of cost. Another camp that normally took a free-choice approach to camper programming was forced to shift to a cohort model, but the camp director has decided to maintain the cohorts “at least in the mornings, no matter what” because it got campers to step outside of their comfort zone (though still with the support of their cabin group or cohort) and try activities they may not have otherwise chosen for themselves.
29
157 4 3
109
60
4637
18
0
20
40
60
80
100
120
Virtual Programs Camp-In-A-Box Facility Rentals orRepurposing for Non-Camp Use (e.g., usingkitchen for a food bank)
Family Camping/Resort-Style Camping
Other
Summer 2020 Program Pivots
Day Camps Overnight Camps

CAMP COUNTS 2020 13
2020 CAMP FINANCIAL SNAPSHOT
In this section we asked respondents to report their actual 2020 income and expenses, even if they did not have any income due to COVID-19. Comparisons with the 2017 Camp Business Operations Study are offered where possible.
Most camps reported income and expenses for a single camp program or site. Those reporting on multiple sites were asked to provide figures for all sites together as well as an average or value for their most typical site.
2020 Income & Camp Fees When asked if they had any income in 2020, or anticipated any income between the time of taking the survey and the end of 2020 (including fees collected, contributions, or loans received), most camps responded “yes.” Only camps reporting income in 2020 are included in the following set of findings.
N = 795 responses
239
351
81
43
68
13
0
50
100
150
200
250
300
350
400
450
Day Camps Overnight Camps Combo Camps
2020 Income
Yes No

CAMP COUNTS 2020 14
Average Gross Income in 2020
Day Overnight Combo TOTAL
Camp Owner/Sponsor
INP $433,751.14 $777,728.29 $633,162.59 $671,350.73
FP $975,090.32 $1,212,134.00 $1,114,000.00 $1,120,597.58
Municipal/government $49,292.45
$375,000.00 $63,453.65
NP-Affiliated $234,920.21 $443,878.00 $589,030.82 $405,828.71
TOTAL BY OWNER/SPONSOR $456,311.36 $764,815.57 $632,983.49 $646,087.89
Region Mid-American $338,866.88 $480,540.19 $604,690.79 $451,835.64
Mid-Atlantic $562,927.61 $1,044,485.45 $264,750.00 $741,988.07
New England $808,536.09 $1,239,397.16 $340,500.00 $1,090,126.95
Southern $232,521.30 $599,326.70 $680,124.42 $516,205.69
Western $218,725.81 $708,610.49 $746,500.00 $595,155.55
TOTAL BY REGION $448,946.06 $786,215.23 $583,615.18 $649,107.21
Typical Operating Budget
$200,000 or less $70,619.64 $50,480.77 $42,125.00 $63,836.78
$200,001-$500,000 $159,228.03 $146,269.88 $215,900.00 $161,423.24
$500,001-$1,000,000 $361,821.63 $323,916.06 $392,333.33 $348,786.34
$1,000,001-$5,000,000 $1,169,586.65 $1,129,496.65 $1,302,202.47 $1,152,884.64
$5,000,001 or more $2,176,666.67 $2,080,814.67 $1,735,417.75 $2,041,742.11
TOTAL BY REGION $458,299.69 $765,529.22 $632,983.49 $647,973.09
$890,000.00
$1,660,000.00
456,311.36
764,815.57
Day Camps
Overnight Camps
Gross Income 2020 versus 2017
2020 2017

CAMP COUNTS 2020 15
Average Gross Income in 2020 by Nonprofit Affiliation Day Overnight Combo TOTAL
College or university $5,800.00 $700,000.00 $2,000,000.00 $677,900.00
Faith-based organization $289,752.51 $338,609.20 $549,681.82 $400,277.83
Health organization $487,500.00 $487,500.00
K-12 school $441,175.00 $441,175.00
Local, state, or federal government (e.g., public parks & recreation agency)
$453,000.00 $586,000.00 $497,333.33
Other $46,818.18 $137,142.86 $300,000.00 $93,421.05
Youth-serving agency (e.g., YMCA, Girl Scouts, 4-H, CampFire)
$229,143.96 $443,855.63 $450,347.58 $387,341.12
TOTAL $236,637.71 $396,608.50 $550,896.51 $374,620.76
Average Gross Income by Income Categories, 2017 and 2020 (in percent) Day Overnight Combo
2017 2020 2017 2020 2020
Summer youth camp registration fees 78.9 64.17 60.2 21.7 10.41
Adult program registration fees 0.9 0.73 3.0 2.38 4.26
CIT/LIT/Teen leadership program registration fees 2.0 0.94 2.2 0.56 0.55
School youth program (non-camp) registration fees 1.3 4.55 3.0 1.97 3.90
Group/conferencing rental fees 1.4 0.63 7.3 10.78 24.04
Activity/transportation/insurance fees 1.4 0.18 0.5 0.79 0.1
Camp store/book store revenues 0.3 0.94 1.6 1.65 1.17
Contributions for operations and/or for capital expenses 2.6 4.03 8.1 18.72 19.16
Contributions/scholarships/camperships (include COVID-specific fundraising/donations other than loans here) 5.9 6.58 10.1 18.03 17.65
All other income (include PPP and other COVID-specific loans here)* 5.3 10.76 3.9 19.02 9.84
PPP and other COVID-specific loans are not income; however, we asked camps to report these figures here for the sake of year-to-year benchmarking.

CAMP COUNTS 2020 16
2020 Enrollment Fees by Session A good percentage of camps surveyed for this study reported offering some combination of day, overnight, and rental programming. This was even more complex this year as some camps reported to pivoting to new program structures due to COVID-19. The table below represents fees for whatever programming was actually offered in 2020, thus it is possible that an overnight camp reported day camp fees. In general, the number of respondants who shared fee information was low, so the results below should be interpretted with caution. Fees did not appear to vary meaningfully by region.
2020 Fees by Program Type
2020 Day Camp Fee, Per Session
2020 Day Camp Fee, Per Day
2020 Overnight Camp Fee, Per Session
2020 Overnight Camp Fee, Per Day
Day Camps $650.00 $65.70 $267.50 $90.00
Overnight Camps $280.00 $54.48 $3,303.00 $210.39
Combo Camps $575.00 $50.39 $570.83 $83.62
TOTAL $472.00 $56.14 $1,981.59 $173.63
2020 Fees by Camp Owner/Sponsor
2020 Day Camp Fee, Per Session
2020 Day Camp Fee, Per Day
2020 Overnight Camp Fee, Per Session
2020 Overnight Camp Fee, Per Day
INP $180.00 $59.00 $1,680.00 $280.33
FP $825.00 $114.99 $7,525.00 $209.68
NP-Affiliated $350.00 $42.53 $439.20 $97.21
TOTAL $472.00 $56.29 $1,981.59 $174.73
2020 Fee Increase/Decrease (by percentage) Day Camps Min Max Mean Median
Fee Increase Amount 0.01 300 17.298 5
Fee Decrease Amount 10 100 55.59 50
Overnight Camps
Fee Increase Amount 1.5 25 4.28 3
Fee Decrease Amount 20 100 20 80
Combo Camps
Fee Increase Amount 2 15 8.1 7
Fee Decrease Amount 10 100 73.09 98

CAMP COUNTS 2020 17
When asked to identify the biggest reason why fees increased from 2019 to 2020, the most commonly selected response was “increased cost of inputs (e.g., COVID-related supplies or other program supplies)” followed by “to cover increased cost of living.”
N = 559
Camps indicating that they did not offer in-person programming in 2020 were asked to select all of the enrollment fee options they offered for canceled and/or modified programming. The most commonly reported response across all camp types was a full refund, followed by the option to rollover to future programming or to donate enrollment fees to a fundraising campaign. When asked to elaborate on the amounts refunded, rolled over, and donated, responses were limited and extremely variable. Partial refunds ranged from $28,000 to $491,000 for day camps and from $2,000 to $1,000,000 for overnight camps. Rollover amounts ranged from $200 to $182,000 for day camps and from $220 to $12,000,000 for overnight camps, and donations ranged from $600 to $16,000 for day camps and from $1,000 to $815,000 for overnight camps. A few camps also simply stated a variation of “whatever they wanted” or “whatever amount they designated.”
N=284 individual respondents; respondents were asked to select all that apply.
51 52
14
36 31
98
52
12
46
103
915
514
21
0
20
40
60
80
100
120
Increased Stayed the same andsession length stayed
the same
Stayed the same but forshortened session
Decreased Did not offer any campprogramming in 2020
2020 Fee Changes
Day Camps Overnight Camps Combo Camps
1
43
1023
14 73
150
42
131
103
18
0
37
3
2516
10
20
40
60
80
100
120
140
160
No options madeavailable
Full refund Partial refund Rollover Donate Other
Options for Cancelled/Adapted Programs
Day Camps Overnight Camps Combo Camps

CAMP COUNTS 2020 18
6%
10%
5%
5%
2%
3%
4%
7%
3%
8%
0%
7%
29%
36%
16%
29%
22%
52%
25%
45%
30%
33%
72%
75%
65%
54%
79%
66%
77%
45%
71%
48%
67%
59%
28%
18%
0% 10% 20% 30% 40% 50% 60% 70% 80% 90%
Federal PPP Loan - Day
Federal PPP Loan - Overnight
SBA Economic Injury Disaster Loan (EIDL) - Day
SBA Economic Injury Disaster Loan (EIDL) - Overnight
Bank Loan or other form of private financing - Day
Bank Loan or other form of private financing - Overnight
Fundraising Campaign (other than a regularly scheduledfundraising campaign) - Day
Fundraising Campaign (other than a regularly scheduledfundraising campaign) - Overnight
Charitable Grant(s) - Day
Charitable Grant(s) - Overnight
Other- Day
Other- Overnight
COVID-19 Financial Relief- Day & Overnight Camps
Niether pursued nor received Pursued and received Pursued but did not receive

CAMP COUNTS 2020 19
Percent of expected 2020 income lost due to COVID-19 enrollment restrictions
If you operated in-person programs in 2020, what, if any, was your loss of revenue due to enrollment/occupancy restrictions to prevent spread of COVID-19? Skip if you did non operate in-person programs in 2020.
N = 250
For camps that were able to open and run in-person programs in 2020, we asked if they experienced any loss in revenue due specifically to enrollment/occupancy restrictions to prevent the spread of COVID-19. Overwhelmingly, camps responded that they did indeed experience a loss in revenue due to these restrictions (only eight camps, or 3.2 percent of the respondents to this question, indicated that they did not experience a loss in revenue). Though this survey did not ask respondents to elaborate on this response, camp directors interviewed as part of ACA’s Camps & COVID research study spoke to increased costs of supplies and the need for a higher staff-to-camper ratio in order to help manage the new protocols amongst campers, pointing to an overall increase in expenses. Of the camps interviewed, most were also operating at a decreased capacity and spoke of lost revenue as a result of both increases in COVID-related expenses and decreases in overall enrollment revenue.
5
9
9
15
9
11
15
16
11
9
6
3
2
6
5
9
12
12
10
11
18
19
0
1
2
3
0
3
4
6
4
3
2
0 2 4 6 8 10 12 14 16 18 20
No Loss In Revenue
1-10%
11-20%
21-30%
31-40%
41-50%
51-60%
61-70%
71-80%
81-90%
91-100%
Lost Income in 2020
Combo Camps Overnight Camps Day Camps
CAMP COUNTS 2020 20
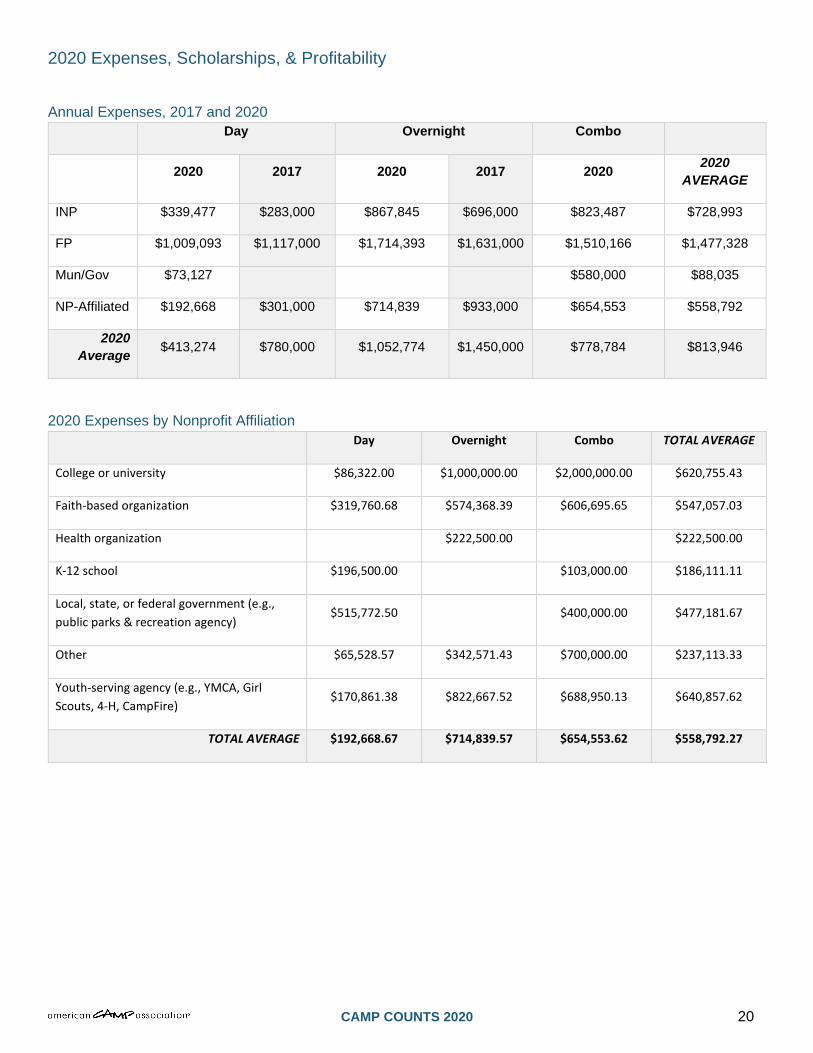
2020 Expenses, Scholarships, & Profitability
Annual Expenses, 2017 and 2020 Day Overnight Combo
2020 2017 2020 2017 2020 2020 AVERAGE
INP $339,477 $283,000 $867,845 $696,000 $823,487 $728,993
FP $1,009,093 $1,117,000 $1,714,393 $1,631,000 $1,510,166 $1,477,328
Mun/Gov $73,127 $580,000 $88,035
NP-Affiliated $192,668 $301,000 $714,839 $933,000 $654,553 $558,792
2020 Average $413,274 $780,000 $1,052,774 $1,450,000 $778,784 $813,946
2020 Expenses by Nonprofit Affiliation Day Overnight Combo TOTAL AVERAGE
College or university $86,322.00 $1,000,000.00 $2,000,000.00 $620,755.43
Faith-based organization $319,760.68 $574,368.39 $606,695.65 $547,057.03
Health organization $222,500.00 $222,500.00
K-12 school $196,500.00 $103,000.00 $186,111.11
Local, state, or federal government (e.g., public parks & recreation agency)
$515,772.50 $400,000.00 $477,181.67
Other $65,528.57 $342,571.43 $700,000.00 $237,113.33
Youth-serving agency (e.g., YMCA, Girl Scouts, 4-H, CampFire)
$170,861.38 $822,667.52 $688,950.13 $640,857.62
TOTAL AVERAGE $192,668.67 $714,839.57 $654,553.62 $558,792.27
CAMP COUNTS 2020 21
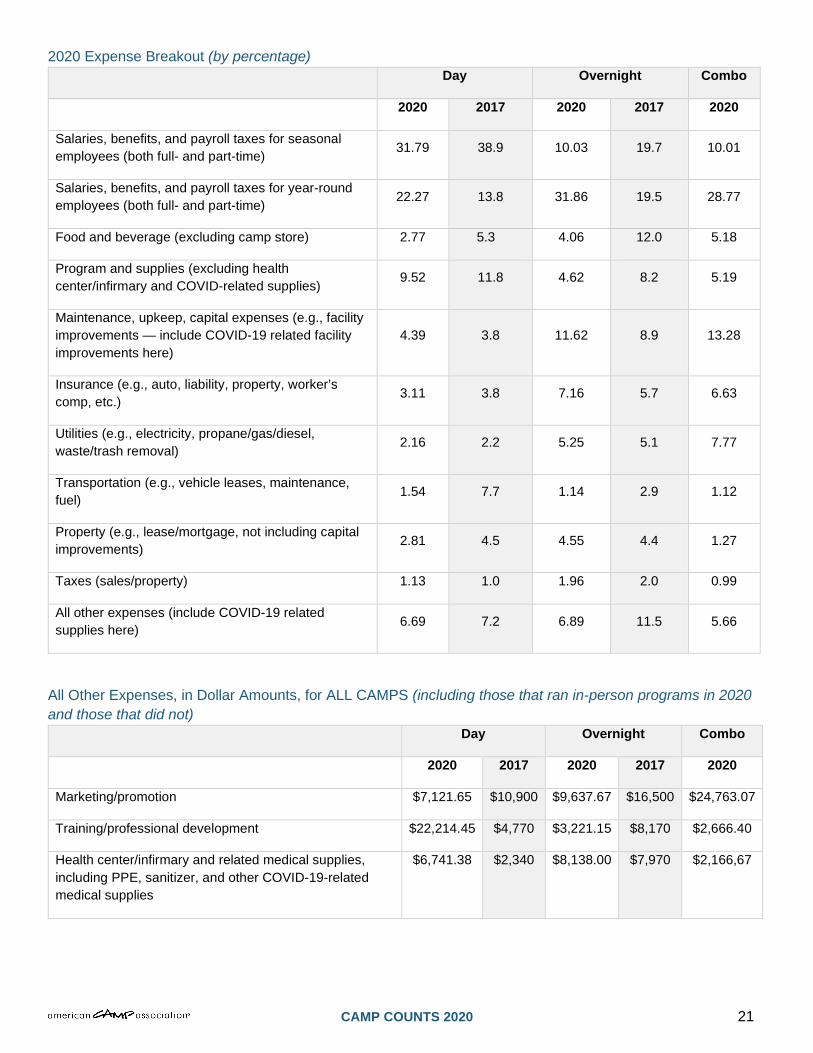
2020 Expense Breakout (by percentage) Day Overnight Combo
2020 2017 2020 2017 2020
Salaries, benefits, and payroll taxes for seasonal employees (both full- and part-time) 31.79 38.9 10.03 19.7 10.01
Salaries, benefits, and payroll taxes for year-round employees (both full- and part-time) 22.27 13.8 31.86 19.5 28.77
Food and beverage (excluding camp store) 2.77 5.3 4.06 12.0 5.18
Program and supplies (excluding health center/infirmary and COVID-related supplies) 9.52 11.8 4.62 8.2 5.19
Maintenance, upkeep, capital expenses (e.g., facility improvements — include COVID-19 related facility improvements here)
4.39 3.8 11.62 8.9 13.28
Insurance (e.g., auto, liability, property, worker’s comp, etc.) 3.11 3.8 7.16 5.7 6.63
Utilities (e.g., electricity, propane/gas/diesel, waste/trash removal) 2.16 2.2 5.25 5.1 7.77
Transportation (e.g., vehicle leases, maintenance, fuel) 1.54 7.7 1.14 2.9 1.12
Property (e.g., lease/mortgage, not including capital improvements) 2.81 4.5 4.55 4.4 1.27
Taxes (sales/property) 1.13 1.0 1.96 2.0 0.99
All other expenses (include COVID-19 related supplies here) 6.69 7.2 6.89 11.5 5.66
All Other Expenses, in Dollar Amounts, for ALL CAMPS (including those that ran in-person programs in 2020 and those that did not)
Day Overnight Combo
2020 2017 2020 2017 2020
Marketing/promotion $7,121.65 $10,900 $9,637.67 $16,500 $24,763.07
Training/professional development $22,214.45 $4,770 $3,221.15 $8,170 $2,666.40
Health center/infirmary and related medical supplies, including PPE, sanitizer, and other COVID-19-related medical supplies
$6,741.38 $2,340 $8,138.00 $7,970 $2,166,67
CAMP COUNTS 2020 22
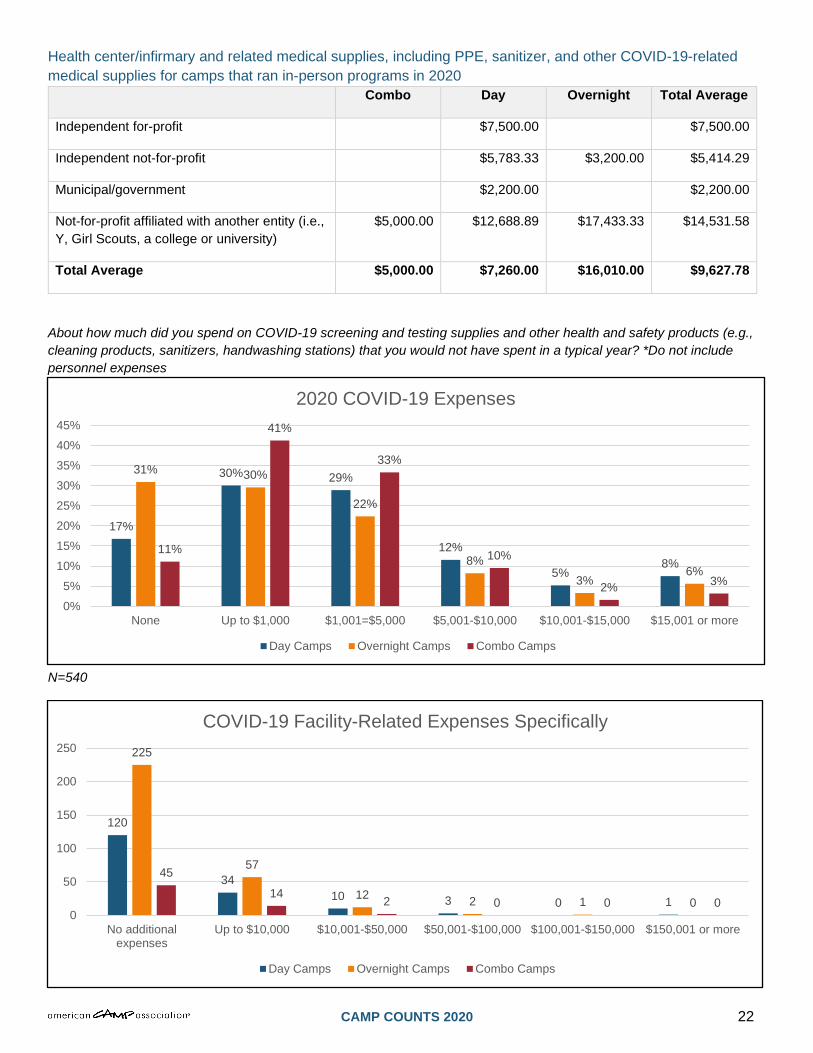
Health center/infirmary and related medical supplies, including PPE, sanitizer, and other COVID-19-related medical supplies for camps that ran in-person programs in 2020
Combo Day Overnight Total Average
Independent for-profit
$7,500.00
$7,500.00
Independent not-for-profit
$5,783.33 $3,200.00 $5,414.29
Municipal/government
$2,200.00
$2,200.00
Not-for-profit affiliated with another entity (i.e., Y, Girl Scouts, a college or university)
$5,000.00 $12,688.89 $17,433.33 $14,531.58
Total Average $5,000.00 $7,260.00 $16,010.00 $9,627.78
About how much did you spend on COVID-19 screening and testing supplies and other health and safety products (e.g., cleaning products, sanitizers, handwashing stations) that you would not have spent in a typical year? *Do not include personnel expenses
N=540
17%
30% 29%
12%
5%8%
31% 30%
22%
8%3%
6%
11%
41%
33%
10%
2% 3%
0%5%
10%15%20%25%30%35%40%45%
None Up to $1,000 $1,001=$5,000 $5,001-$10,000 $10,001-$15,000 $15,001 or more
2020 COVID-19 Expenses
Day Camps Overnight Camps Combo Camps
120
3410 3 0 1
225
57
12 2 1 0
45
14 2 0 0 00
50
100
150
200
250
No additionalexpenses
Up to $10,000 $10,001-$50,000 $50,001-$100,000 $100,001-$150,000 $150,001 or more
COVID-19 Facility-Related Expenses Specifically
Day Camps Overnight Camps Combo Camps

CAMP COUNTS 2020 23
N=529
Overall Profitability, 2017 and 2020, by Program Type and Camp Owner/Sponsor
INP FP Gov NP-Affiliated Grand Mean
Day
Income $382,255.23 $898,944.65 $53,403.65 $245,370.23 $403,319.06
Expenses $339,477.29 $1,009,093.62 $73,127.11 $192,668.67 $413,274.60
Inc-Exp $42,777.94 ($110,148.97) ($19,723.46) $52,701.56 ($9,955.54)
% 11% -12% -37% 21% -2%
2017 Profit $203,000 $342,000 $168,000 $202,000
2017% $12.2% $17.6% 21.2%% 16.2%%
Overnight
Income $785,718.98 $1,351,052.02 $478,813.39 $822,677.26
Expenses $867,845.72 $1,714,393.84 $714,839.57 $1,052,774.31
Inc-Exp ($82,126.74) ($363,341.82) ($236,026.18) ($230,097.05)
% -10% -27% -49% -28%
2017 Profit $17,000 $416,000 $128,000 $137,000
2017% 1% 13,.2% 2.5%% 3%
Combo
Income $633,162.59 $1,291,200.00 $375,000.00 $494,571.11 $588,586.81
Expenses $823,487.88 $1,510,166.67 $580,000.00 $654,553.62 $778,784.35
Inc-Exp ($190,325.29) ($218,966.67) ($205,000.00) ($159,982.51) ($190,197.54)
% -30% -17% -55% -32% -32%
Grand Mean
Income $655,996.73 $1,185,712.83 $61,866.71 $410,141.45 $647,017.85
Expenses $728,993.54 $1,477,328.50 $88,035.13 $558,792.27 $813,946.28
Inc-Exp ($72,996.81) ($291,615.67) ($26,168.42) ($148,650.82) ($166,928.43)
% -11% -25% -42% -36% -26%

CAMP COUNTS 2020 24
Staffing Changes
3%
7%
4%
3%
25%
12%
6%
19%
54%
50%
31%
0%
18%
34%
41%
40%
18%
17%
8%
3%
16%
6%
1%
0%
6%
10%
14%
36%
2%
5%
1%
1%
12%
11%
31%
48%
6%
10%
12%
9%
18%
38%
19%
40%
11%
40%
16%
27%
2%
1%
20%
5%
33%
3%
24%
8%
0% 10% 20% 30% 40% 50% 60%
Seasonal Staff- Day
Season Staff- Overnight
Full-time Staff- Day
Full-time Staff- Overnight
Healthcare Staff- Day
Healthcare Staff- Overnight
Volunteers- Day
Volunteers- Overnight
No Change Laid Off Furloughed Paid Less Paid More Hired Less Hired More

CAMP COUNTS 2020 25
Need-Based Scholarships/Discounts
N=814
Average Total Value of Need-Based Scholarships/Discounts Awarded Per Camp in 2017 and 2020
Day Overnight Combo TOTAL
2020 2017 2020 2017 2020
INP $ 82,735.10 $38,200 $ 94,656.77 $158,100 $ 32,762.14 $ 86,491.25
FP $ 28,134.13 $57,600 $ 83,291.50 $89,800 $ 25,125.00 $ 64,825.47
Gov $ 4,466.30 $ 4,466.30
NP-Affiliated $ 14,493.13 $40,700 $ 38,051.97 $145,700 $ 29,109.45 $ 27,302.09
TOTAL $ 33,163.63 $40,200 $ 70,208.71 $118,100 $ 29,572.61 $ 51,214.69
Note: 2017 survey separated “scholarships” from “discounts,” so it is possible there is error in comparing 2017 to 2020.
64% 63% 59%
36% 37% 41%
D A Y C A MP S O V E R N I G H T C A MP S C O MB O C A MP S
SCHOLARSHIPS OFFERED IN 2020Yes No

CAMP COUNTS 2020 26
Average Value of Total Scholarships Awarded Per Camp in 2020, by Nonprofit Affiliation Day Overnight Combo TOTAL
College or university $10,050.00 $75.00 $6,725.00
Faith-based organization $16,744.45 $98,117.27 $14,163.62 $41,360.17
Health organization $725.00 $725.00
K-12 school $22,171.88 $30,000.00 $23,041.67
Local, state, or federal government (e.g., public parks & recreation agency)
$3,725.00 $72,000.00 $26,483.33
Other $6,257.14 $8,890.00 $7,354.17
Youth-serving agency (e.g., YMCA, Girl Scouts, 4-H, CampFire) $14,956.78 $31,027.52 31,388.23 $25,663.35
TOTAL $14,697.94 $39,023.67 $24,791.93 $26,957.27
120
19
61
14
148
2418
8
2430
73 3 4
0
20
40
60
80
100
120
140
160
1-20% 21-40% 41-60% 61-80% 81-100%
Percentage of Campers Receiving Need-Based Scholarships in 2020
Day Camps Overnight Camps Combo Camps

CAMP COUNTS 2020 27
N=162 for day camps, N=226 for overnight camps
Open-ended responses to the question “Please describe changes to your 2020 need-based scholarship/discount offerings included examples such as the following:
We could not serve as many low-income students as we would normally. We didn't have the funds for scholarships, and the local school district canceled all camps that would normally have brought in both low-income and more diverse students.
Fees were increased due to state staffing guidelines, therefore families who needed care couldn't afford it and only a limited amount of financial assistance was available.
We served less campers in 2020 due to COVID-19. We had three age groups from seven to 12 years old and eliminated ages four to six and 13–16 due to capacity and needs.
Average Total Scholarships Awarded 2017 and 2020, by Sector Day
Overnight
2020 2017 % Change 2020 2017 % Change TOTAL AVERAGE
FP $28,134.13 $57,600 -105% $83,291.50 $89,800 -8% $64,825.47
INP $82,735.10 $38,200 54% $94,656.77 $158,100 -67% $86,491.25
Gov $4,466.30 $4,466.30
NP-Affiliated $14,493.13 $40,700 -181% $38,051.97 $145,700 -283% $27,302.09
TOTAL AVERAGE $33,163.63 $40,200 -21% $70,208.71 $118,100 -68% $51,214.69
8% 7% 8% 5%
12%6% 7% 11%
23% 34%22%
27%
18% 13%
18% 9%
38% 39%45% 48%
0%
10%
20%
30%
40%
50%
60%
70%
80%
90%
100%
Percent of Campers receivingscholarships/discounts- Day
Percent of Campers receivingscholarships/discounts- Overnight
Total dollar amount awarded -Day
Total dollar amount awarded -Overnight
Change in Need-Based Scholarships/Discounts
Significantly More Slightly More Same Slightly Less Significantly Less

CAMP COUNTS 2020 28
COVID-19 PREVENTION PRACTICES & OUTCOMES It is difficult to know exactly how many cases happened at camp. It seems from our analysis that potential cases were often identified during pre-camp or start-of-camp screening procedures, and, in these cases, most were sent home. These cases were most likely contracted prior to camp, but may be included in what respondents reported as “confirmed cases.” Overall, our numbers align with data collected on COVID-19 cases from similar organizations, suggesting that in summer 2020, COVID-19 was low in children overall, and the interventions many camps employed appear to have made a difference. What we learned about these interventions are described below.
10
36
25
35
14
21
38
26
35
42
C O V I D - 1 9 T E S T I N G T E MP E R A T U R E C H E C K S
S C R E E N I N G F O R R E C E N T T R A V E L
S C R E E N I N G F O R E XP O S U R E T O
C O V I D - 1 9
S Y MP T O M S C R E E N I N G
AT-HOME SCREENING PROCEDURES — DAY CAMPS
Campers/Guests Staff
19
60 60 62 64
23
64 66 68 69
C O V I D - 1 9 T E S T I N G T E MP E R A T U R E C H E C K S
S C R E E N I N G F O R R E C E N T T R A V E L
S C R E E N I N G F O R E XP O S U R E T O
C O V I D - 1 9
S Y MP T O M S C R E E N I N G
AT-HOME SCREENING PROCEDURES —OVERNIGHT CAMPS
Campers/Guests Staff

CAMP COUNTS 2020 29
Camps that reported offering in-person programming in Summer 2020 were asked about the details of their screening procedures, specifically, whether they implemented COVID-19 testing, temperature checks, screening for recent travel, screening for exposure to COVID-19, and symptoms screening. Camps were asked to report whether these screening procedures were implemented for campers/guests and staff, and whether they took place at home, upon arrival, and/or on a routine basis. Camps had the option of selecting more than one screening procedure.
For both day and overnight camps, the least commonly reported home screening procedure was COVID-19 testing for both campers and staff. Day camps responding to this question most commonly reported symptom screening staff members (42 responses), closely followed by temperature checks (38 responses) and screening for exposure to COVID-19 (35 responses). Campers, on the other hand, were primarily asked to implement temperature checks (36 responses), screening for exposure to COVID-19 (35 responses), and screening for recent travel (25 responses). Overnight camps reported in almost equal measure for both campers and staff temperature checks (60 responses for campers, 64 for staff members), screening for recent travel (60 responses for campers, 66 for staff members), screening for exposure to COVID-19 (62 responses for campers, 68 for staff members), and symptom screening (64 responses for campers, 69 for staff members). Overall, both day and overnight camps appeared to have stricter at-home screening procedures for staff members compared to campers/guests.
Overnight camps were also asked specifically about their quarantining procedures. The most common responses, in almost equal measure were staff quarantined at camp (54 responses), campers quarantined at home (53 responses), and staff quarantined at home (52 responses). Only 13 camps reported asking campers to quarantine at home.
53
13
52 54
60
87
61 57
C A MP E R S Q U A R A N T I N E D A T H O ME
C A MP E R S Q U A R A N T I N E D A T C A MP
S T A F F Q U A R A N T I N E D A T H O ME
S T A F F Q U A R A N T I N E D A T C A MP
QUARANTINE PROCEDURES — OVERNIGHT CAMPS
Yes No
CAMP COUNTS 2020 30
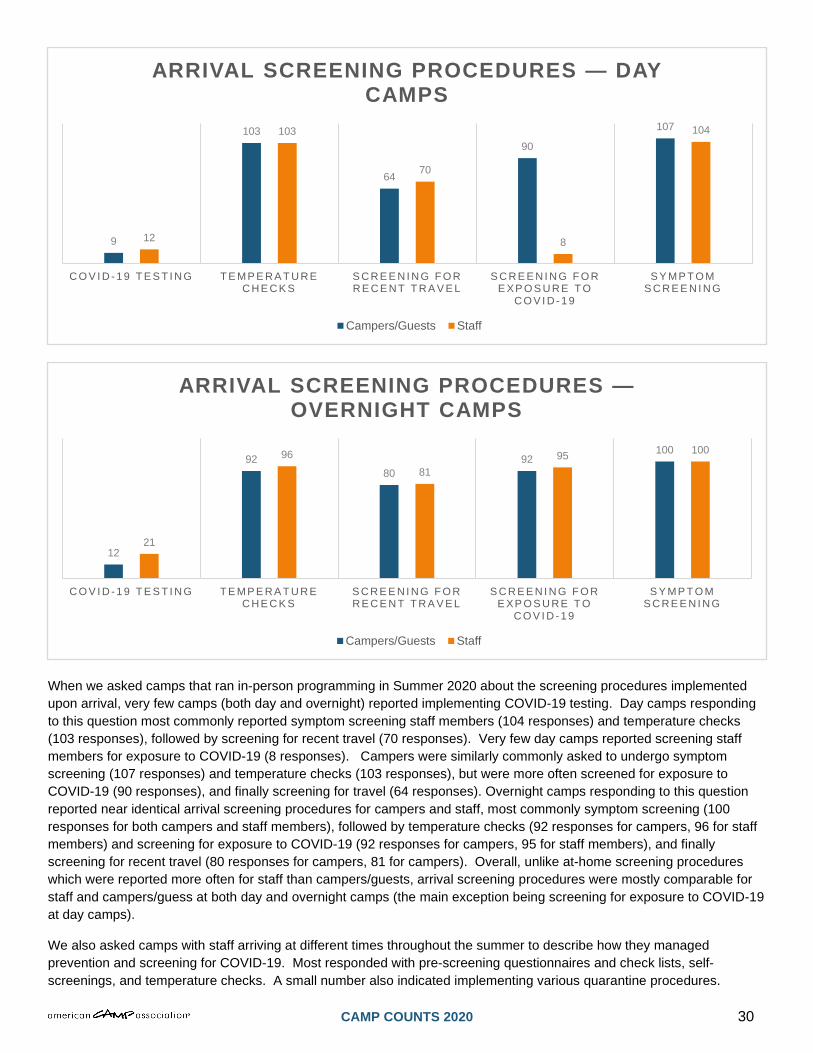
When we asked camps that ran in-person programming in Summer 2020 about the screening procedures implemented upon arrival, very few camps (both day and overnight) reported implementing COVID-19 testing. Day camps responding to this question most commonly reported symptom screening staff members (104 responses) and temperature checks (103 responses), followed by screening for recent travel (70 responses). Very few day camps reported screening staff members for exposure to COVID-19 (8 responses). Campers were similarly commonly asked to undergo symptom screening (107 responses) and temperature checks (103 responses), but were more often screened for exposure to COVID-19 (90 responses), and finally screening for travel (64 responses). Overnight camps responding to this question reported near identical arrival screening procedures for campers and staff, most commonly symptom screening (100 responses for both campers and staff members), followed by temperature checks (92 responses for campers, 96 for staff members) and screening for exposure to COVID-19 (92 responses for campers, 95 for staff members), and finally screening for recent travel (80 responses for campers, 81 for campers). Overall, unlike at-home screening procedures which were reported more often for staff than campers/guests, arrival screening procedures were mostly comparable for staff and campers/guess at both day and overnight camps (the main exception being screening for exposure to COVID-19 at day camps).
We also asked camps with staff arriving at different times throughout the summer to describe how they managed prevention and screening for COVID-19. Most responded with pre-screening questionnaires and check lists, self-screenings, and temperature checks. A small number also indicated implementing various quarantine procedures.
9
103
64
90
107
12
103
70
8
104
C O V I D - 1 9 T E S T I N G T E MP E R A T U R E C H E C K S
S C R E E N I N G F O R R E C E N T T R A V E L
S C R E E N I N G F O R E XP O S U R E T O
C O V I D - 1 9
S Y MP T O M S C R E E N I N G
ARRIVAL SCREENING PROCEDURES — DAY CAMPS
Campers/Guests Staff
12
9280
92100
21
9681
95 100
C O V I D - 1 9 T E S T I N G T E MP E R A T U R E C H E C K S
S C R E E N I N G F O R R E C E N T T R A V E L
S C R E E N I N G F O R E XP O S U R E T O
C O V I D - 1 9
S Y MP T O M S C R E E N I N G
ARRIVAL SCREENING PROCEDURES —OVERNIGHT CAMPS
Campers/Guests Staff

CAMP COUNTS 2020 31
When we asked camps that ran in-person programming in Summer 2020 about the screening procedures implemented on a routine basis, COVID-19 testing was once again the least reported screening procedure for both campers/guests and staff members at both day and overnight camps. Day camps responding to this question reported almost identical routine screening procedures for both campers/guests and staff members. The most commonly reported routine screening procedures were symptom screening (75 responses for campers, 76 for staff members) and temperature checks (71 responses for campers, 70 for staff members), followed by screening for exposure to COVID-19 (57 responses for both) and finally screening for recent travel (42 responses for campers, 47 for staff members). Overnight camps responding to this question were less consistent between campers/guests and staff routine screening procedures, but followed similar trends when compared to day camp routine screening proceedures. Staff members most commonly underwent symptom screening (95 responses) and temperature checks (90 responses). Staff members were less commonly routinely screened for exposure to COVID-19 (48 responses) or recent travel (36 responses). This may be due to the fact that staff were commonly staying onsite, therefore limiting potential exposure and travel opportunities. Overnight camp responses pertaining to campers/guests routine screening procedures followed a similar trend to staff routine screening procedures, with fewer overall responses. Again, campers/guests at overnight camps most commonly underwent symptom screening (77 responses) and temperature checks (74 responses), and were less commonly routinely screened for exposure to COVID-19 (36 responses) or recent travel (34 responses). Overall, for both day and overnight camps and campers/guests and staff members alike, the most common routine screening procedure was symptom screening, closely followed by temperature checks.
9
71
42
57
75
6
70
4757
76
C O V I D - 1 9 T E S T I N G T E MP E R A T U R E C H E C K S
S C R E E N I N G F O R R E C E N T T R A V E L
S C R E E N I N G F O R E XP O S U R E T O
C O V I D - 1 9
S Y MP T O M S C R E E N I N G
ROUTINE SCREENING PROCEDURES — DAY CAMPS
Campers/Guests Staff
6
74
34 36
77
11
90
3648
95
C O V I D - 1 9 T E S T I N G T E MP E R A T U R E C H E C K S
S C R E E N I N G F O R R E C E N T T R A V E L
S C R E E N I N G F O R E XP O S U R E T O
C O V I D - 1 9
S Y MP T O M S C R E E N I N G
ROUTINE SCREENING PROCEDURES —OVERNIGHT CAMPS
Campers/Guests Staff

CAMP COUNTS 2020 32
Additional Screening Procedures We also asked camps that ran in-person programming in Summer 2020 to list any additional COVID-19 screening they did that was not included in the tables above. Responses to this question included calling families to discuss protocols screening, risk tolerances, and their experiences during stay-at-home orders and afterwards. This mirrors screening procedures implemented by a camp director interviewed for ACA’s Camps & COVID qualitative study who noted calling families as one of the most important screening and prevention strategies they implemented because it gave them the opportunity to discuss what their camp defined as quarantine and to remind them “if your child is going to swim practice, then that’s not quarantining.” Several camps reported screening family/household members and sending out screening questionnaires weeks in advance of camp. One respondent indicated testing everyone for antibodies upon arrival.
Camps that ran in in-person programming in Summer 2020 were asked about the frequency (always, often, sometimes, rarely, never, or N/A or Not Sure) of numerous COVID-19 protocols and prevention strategies. The most commonly reported protocols and prevention strategies that day camps always implemented were regular hand hygiene, increased cleaning, decreased camper capacity per person, and cohorts for activities. These results are consistent with common practices described by day camp directors interviewed as part of ACA’s Camps & COVID qualitative study. Other protocols and prevention strategies that day camps commonly reported always implementing were face masks for staff, modified programs, and altered dining. The most commonly reported protocols and prevention strategies that day camps reported never implementing were changed/increased bathroom facilities and face masks for campers.
116
79
111
96
83
125
128
99
42
2
62
15
4
47
12
32
6
9
7
29
49
16
11
6
9
2
5
2
4
27
1
9
2
1
1
1
2
6
3
2
1
2
1
11
22
3
0% 10% 20% 30% 40% 50% 60% 70% 80% 90% 100%
Decreased camper capacity per session
Physical Distancing
Cohorts for activities
Modified programs
Altered dining
Increased cleaning
Regular hand hygiene
Face masks for staff
Face masks for campers
Altered sleeping arrangements
Changed/increased bathroom facilities
Decreased visitors
COVID-19 Protocol Frequencies — Day Camps
Always Often Sometimes Rarely Never

CAMP COUNTS 2020 33
For overnight camps responding to this question, the most commonly reported protocols and prevention strategies that were always implemented were regular hand hygiene, increased cleaning, altered dining, decreased camper capacity per person, and decreased visitors. This was consistent with common practices described by day camp directors interviewed as part of ACA’s Camps & COVID qualitative study. Indeed, one overnight camp director noted one of their greatest successes from the summer was integrating these new protocols into their camp culture, sharing the example of having campers sing a camp song while washing their hands. Other protocols and prevention strategies that overnight camps commonly reported always implementing were cohorts for activities, modified programs, and physical distancing. The most commonly reported protocols and prevention strategies that day camps reported never implementing were face masks for campers and face masks for staff.
Camper Cohort Sizes by Program Type Camp Type Min Max Mean Median
Day Camps 0 50 10.98 10
Overnight Camps 0 80 12.87 10
Combo Camps 0 100 9.04 7
While the reported cohort sizes for day, overnight, and combo camps were extremely variable, ranging from 0-100 campers/guests, the mean range of 9.04-12.87 and median range of 7-10 suggest that the most typical camper cohort size for Summer 2020 in-person programming was probably between 7-13 campers, on average.
91
77
82
80
93
110
112
67
37
70
53
90
3
29
6
20
3
7
3
35
37
7
18
8
3
7
5
6
2
1
1
10
24
3
9
1
2
3
1
3
6
1
4
4
3
2
4
4
1
3
6
6
14
1
0% 10% 20% 30% 40% 50% 60% 70% 80% 90% 100%
Decreased camper capacity per session
Physical distancing
Cohorts for activities
Modified programs
Altered dining
Increased cleaning
Regular hand hygiene
Face masks for staff
Face masks for campers
Altered sleeping arrangements
Changed/increased bathroom facilities
Decreased visitors
COVID-19 Protocol Frequencies- Overnight Camps
Always Often Sometimes Rarely Never

CAMP COUNTS 2020 34
Camps that ran in in-person programming in Summer 2020 were asked to report when campers/guests and staff members were allowed to remove masks/face coverings. Overall, at day camps, campers were more often reportedly allowed to remove masks/face coverings, namely for eating meals or snacks with their cohort (91 responses), water activities (84 responses), and when outdoors with their cohort (74 responses). Staff members were also commonly allowed to remove masks/face coverings for eating meals or snacks with their cohort (97 responses) and water activities (78 responses). No camps reported allowing campers/guests to remove masks/face coverings when indoors with people not in their cohort, and only one reported allowing staff members to do so. Nine day camps reported not requiring masks of campers, and only one reported not requiring masks for staff members.
84
5
10
74
12
50
91
31
9
78
4
4
40
1
9
48
97
20
1
0 20 40 60 80 100 120
Water activities
Sleeping/resting in bed
Indoors with cohort
Outdoors with cohort
Indoors with people not in cohort
Outdoors with people not in cohort
Physically distanced (6ft+)
Eating meals or snacks with cohort
Other
Masks not required
Mask/Face Covering Protocols MASKS NOT REQUIRED — Day Camps, select all that apply, 102 responses
Staff Campers/Guests
CAMP COUNTS 2020 35
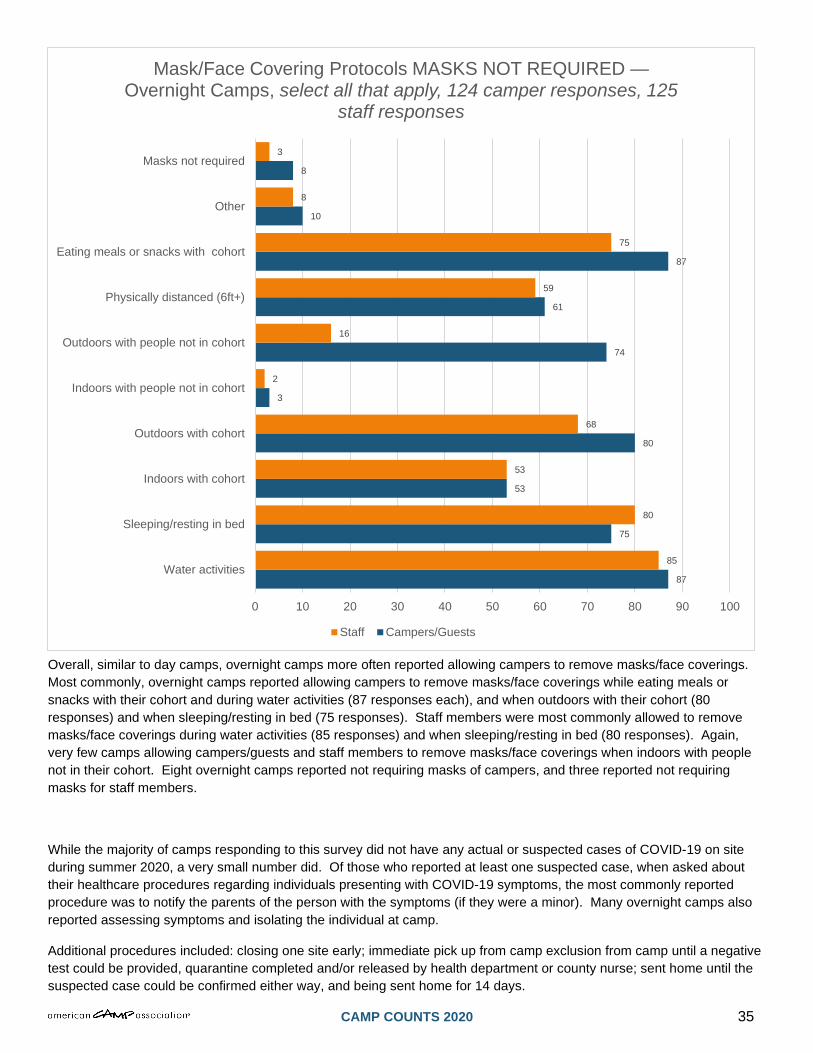
Overall, similar to day camps, overnight camps more often reported allowing campers to remove masks/face coverings. Most commonly, overnight camps reported allowing campers to remove masks/face coverings while eating meals or snacks with their cohort and during water activities (87 responses each), and when outdoors with their cohort (80 responses) and when sleeping/resting in bed (75 responses). Staff members were most commonly allowed to remove masks/face coverings during water activities (85 responses) and when sleeping/resting in bed (80 responses). Again, very few camps allowing campers/guests and staff members to remove masks/face coverings when indoors with people not in their cohort. Eight overnight camps reported not requiring masks of campers, and three reported not requiring masks for staff members.
While the majority of camps responding to this survey did not have any actual or suspected cases of COVID-19 on site during summer 2020, a very small number did. Of those who reported at least one suspected case, when asked about their healthcare procedures regarding individuals presenting with COVID-19 symptoms, the most commonly reported procedure was to notify the parents of the person with the symptoms (if they were a minor). Many overnight camps also reported assessing symptoms and isolating the individual at camp.
Additional procedures included: closing one site early; immediate pick up from camp exclusion from camp until a negative test could be provided, quarantine completed and/or released by health department or county nurse; sent home until the suspected case could be confirmed either way, and being sent home for 14 days.
87
75
53
80
3
74
61
87
10
8
85
80
53
68
2
16
59
75
8
3
0 10 20 30 40 50 60 70 80 90 100
Water activities
Sleeping/resting in bed
Indoors with cohort
Outdoors with cohort
Indoors with people not in cohort
Outdoors with people not in cohort
Physically distanced (6ft+)
Eating meals or snacks with cohort
Other
Masks not required
Mask/Face Covering Protocols MASKS NOT REQUIRED —Overnight Camps, select all that apply, 124 camper responses, 125
staff responses
Staff Campers/Guests