can water resources management alleviate the uncertainty
TRANSCRIPT

Can water resources management alleviate the uncertainty of projected climate change impacts on
river discharge?
A comparative study in two hydrologically similar
catchments with different level of management
Ina Pohle, Anne Gädeke, Hagen Koch, Sabine Schümberg, Christoph Hinz

Cascade of Uncertainty in Climate Change Impact Studies
Emission scenarios
Carbon cycle response
Global climate sensitivity
Regional climate change scenarios
Impacts: natural discharge
Impacts: managed discharge
Modified after IPCC 2001 2

Cascade of Uncertainty in Climate Change Impact Studies
Emission scenarios
Carbon cycle response
Global climate sensitivity
Regional climate change scenarios
Impacts: natural discharge
Impacts: managed discharge
Modified after IPCC 2001
Can water resources management alleviate the
uncertainty?
3

The Schwarze Elster and Spree catchments … similar in hydrology
4
Berlin Warsaw
Prague
Schwarze Elster
Spree
Schwarze Elster: tributary to the Elbe River, A = 5700 km²
Spree: 2nd order tributary to the Elbe River, A = 6200 km² (up to G. Tränke gauge station)
Land cover: mostly cropland + forests
Sandy soils (brown earth, allovial soil, podzol & stagnosol, similar proportions in both catchments)
Climate: humid continental (Dfb),
ann. average (1961-90): T = 8.8 °C, P = 650 mm

Mining influences discharge regime (open cast lignite mining)
Water supply of Berlin strongly depends on the Spree River
Reservoir management: Low flow augmentation
Reduction of overall discharge variability
The Schwarze Elster and Spree catchments … different level of water resources management
Spreewald Biosphere Reserve
Reservoir Planned reservoir
Active mine Closed mine
Power Plant Gauge d Berlin
5

Research questions
1. How did water resources management influence discharge variability in the past?
2. What are potential future climate change impacts on the regional water resources?
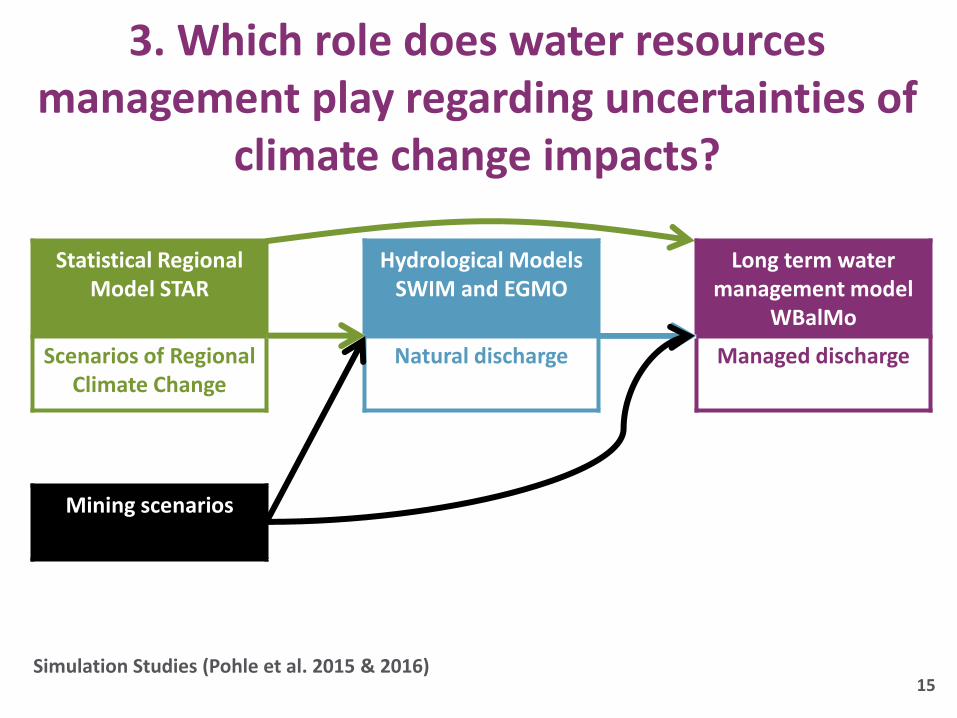
3. Which role does water resources management play regarding uncertainties of climate change impacts?
6

1. How did water resources management influence discharge variability in the past?
Approach
Observed discharge of gauge stations along the Schwarze Elster & Spree
Rivers
Discharge simulated by SWIM (parameterised by regionalisation,
Pohle et al. 2015)
Influenced by natural discharge & water resources management
Natural discharge, no management influence
Comparison of annual values and variability indices
7

Storage Ratio of the Schwarze Elster & Spree
Large reservoirs (main river) Large reservoirs (tributaries)
𝐒𝐭𝐨𝐫𝐚𝐠𝐞 𝐑𝐚𝐭𝐢𝐨 = 𝐒𝐭𝐨𝐫𝐚𝐠𝐞 𝐂𝐚𝐩𝐚𝐜𝐢𝐭𝐲
𝐌𝐐 (Natural MQ as simulated by SWIM
for 5-year-periods)
Flow direction Flow direction
8

Natural and observed discharge (1971/2000, weekly)
Natural (SWIM)
Observed
Observed flow higher than natural flow (mining influence)
Natural discharge of both rivers at the outlets comparable
9 S. Elster [km] Spree [km]
S. Elster [km] Spree [km]

Variability: distribution (1971/2000, weekly)
𝐈𝐧𝐭𝐞𝐫𝐪𝐮𝐚𝐫𝐭𝐢𝐥𝐞 𝐑𝐚𝐭𝐢𝐨 = 𝐐𝟐𝟓 − 𝐐𝟕𝟓
𝐐𝟓𝟎
Observed discharge shows lower variability in the overall distribution compared to natural discharge (especially in and downstream of the mining region)
10
S. Elster [km] Spree [km]

Variability: oscillation (1971/2000, weekly)
Richards Baker Flashiness Index (Baker et al. 2004): 𝑹𝑩𝑰 = 𝑸
𝒊 −𝑸
𝒊−𝟏
𝒏𝒊=𝟏
𝑸𝒊
𝒏𝒊=𝟏
Large reservoirs (of main river) Reservoir (tributaries)
Flashiness of natural discharge decreases along the river course
Sudden decline in flashiness of observed flow after headwater reservoirs
11
S. Elster [km] Spree [km]

1. How did water resources management influence discharge variability in the past?
Comparison of observed discharge and simulated natural discharge helps to distinguish influences of water resource management from other factors (e.g. climate)
Reservoir management Decrease of oscillation (flashiness)
Decrease of overall variability (distribution)
Decrease of seasonality
Decoupling between consecutive gauge stations
Mining water Higher mean discharge
Decrease of overall variability (distribution)
Decrease of seasonality
12

Statistical Regional Model STAR
Hydrological Models SWIM and EGMO
Long term water management model
WBalMo
Scenarios of Regional Climate Change
Natural discharge Managed discharge
Mining scenarios
2. What are potential future climate change impacts on the regional water resources?
Simulation Studies (Pohle et al. 2015 & 2016)
13 WBalMo® is a registered trademark of DHI-WASY Ltd

2. What are potential future climate change impacts on the regional water resources?
Compared to „current“ climatic conditions (S 0K) scenarios with increasing annual temperature and decreasing annual precipitation (S 2K & S 3K) show
Increasing potential ET, but actual ET limited by availability of water
Decreasing natural discharge
Decreasing managed discharge (climate impacts & reduced mining activities)
Lower reservoir volumes
It will take longer to fill the mining pit lakes
More severe mining-related water quality issues
Only small differences between the hydrological models (SWIM & EGMO)
14
Simulation Studies (Pohle et al. 2015 & 2016)
3. Which role does water resources management play regarding uncertainties of
climate change impacts?
15
Statistical Regional Model STAR
Hydrological Models SWIM and EGMO
Long term water management model
WBalMo
Scenarios of Regional Climate Change
Natural discharge Managed discharge
Mining scenarios
Simulation Studies (Pohle et al. 2015 & 2016)
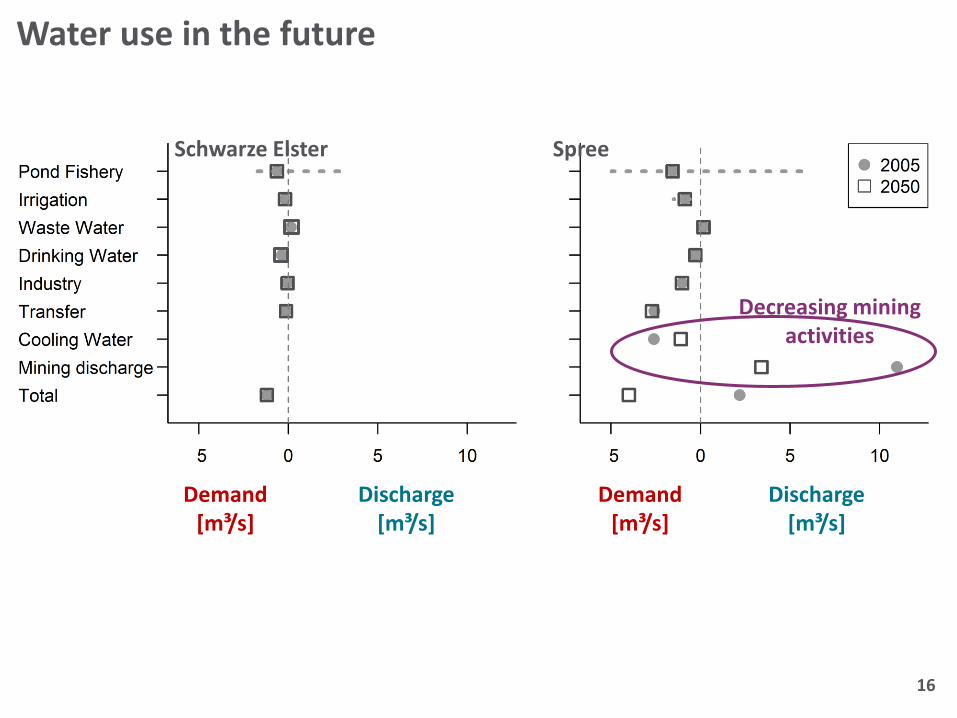
Water use in the future
Schwarze Elster Spree
Decreasing mining activities
16
Demand [m³/s]
Discharge [m³/s]
Demand [m³/s]
Discharge [m³/s]

Changes in storage capacity: “Current” and planned reservoir volumes
Future reservoirs (mining pit lakes)
17

Discharge in scenario STAR 2K (weekly, 2048-2052)
Range of managed discharge much smaller than range of natural discharge
18

Interquartile Ratio and Parde coefficient scenario STAR 2K (weekly, 2048-2052)
Intense water resources management in the Spree catchment reduces interquartile ratio and seasonality
19

Mean annual course and flow duration curve (2048-2052, weekly values from 100 realizations for STAR 2K)
Schwarze Elster
Spree
Required minimum flow 8 m³/s
20

Variability indices of individual realisations (2048-2052, Spree, weekly values from 100 realizations)
21

Contribution of storage and transfer (2048-2052, weekly values from 100 realizations)
Spree Gr. Tränke Bautzen Reservoir Oder-Spree-Canal (managed Q)
Spree Gr. Tränke Bautzen Reservoir Oder-Spree-Canal (managed Q)
22

3. Which role does water resources management play regarding uncertainties of
climate change impacts?
Water resources management can alleviate the uncertainty of projected climate change impacts on river discharge to a certain degree
Effective reservoir management
In the Spree catchment, the highest priorities are on the river discharge – the variability and uncertainty of river discharge is reduced at the expense of water transfers and water users
Yet, due to decreasing reservoir volumes in drought periods, reservoir management alone cannot compensate strong changes in climate conditions over long time periods (this can already be seen by comparing STAR 2K and STAR 3K results).
23

Conclusions
Influence of water resources management is evident when comparing observed discharge and simulated natural discharge
Potential future natural discharge shows high uncertainty related to climate scenarios & realizations
Effective reservoir management reduces discharge variability AND can reduce uncertainty related to climate change impacts
Catchments with a high storage ratio are less vulnerable to changing climate conditions
Reservoir management is a suitable tool for climate change adaptation
24

Outlook
Water management needs to be explicitly considered in climate change impact studies
This is also possible in SWIM & SWAT by using routines for water withdrawals and reservoir management (e.g. the reservoir model of SWIM developed by Koch et al. (2013))
(Water management in the Spree & Schwarze Elster catchments difficult for SWIM
& SWAT due to priority setting, with senior users/water rights downstream prohibiting withdrawals of upstream junior users/water rights)
25

Thank you!
We are grateful to the Potsdam Institute for Climate Impact Research (PIK), the Saxon State Office for the Environment, Agriculture and Geology, and the Landesamt für Umwelt, Gesundheit und Verbraucherschutz for data provision.
The underlying simulation study has been performed in the project INKA BB TP 21 funded by the Federal Ministry of Education and Research (BMBF) and the Lusatian and Central German Mining Management Company (LMBV). We thank all project partners.
We thank C. Jaunich for initial calculations of variability indices in the Spree River Catchment.
26

References IPCC 2001: Working Group II: Impacts, Adaptation and Vulnerability
Kaden, S., Schramm, M., Redetzky, M. (2004) ArcGRM: interactive simulation system for water re- sources planning and management in river basins. In: Xi RZ, Gu WZ, Seiler KP (eds) Research basins and hydrological planning. Taylor & Francis, London, pp 185–192
Koch, H., Liersch, S., Hattermann, F.F. (2013): Integrating water resources management in eco-hydrological modelling. Water Science & Technology 67(7):1525-1533
Krysanova, V., Müller-Wohlfeil, D.I., Becker, A.. 1998. Development and test of a spatially distributed hydrological/water quality model for mesoscale watersheds. Ecol. Modell. 106(2–3): 261–289.
Krysanova, V., Wechsung, F., Arnold, J., Srinivasan, R. and Williams, J. (2000). SWIM (Soil and Water Integrated Model) - User Manual.
Orlowsky, B., F.W. Gerstengarbe, and P.C. Werner. 2008. A resampling scheme for regional climate simulations and its performance compared to a dynamical RCM. Theor. Appl. Climatol. 92(3–4): 209–223.
Pohle, I., Koch, H., Zimmermann, K., Gädeke, A., Claus, T., Uhlmann, W., Kaltofen, M., Redetzky, M., Schramm, M., Müller, F., Schoenheinz, D., Grünewald, U. (2016): Analysis of water quantity and water quality for climate and management scenarios: Development and application of a model cascade for the Spree River catchment. Hydrologie und Wasserbewirtschaftung 60(3): 176-195
Pohle, I., Koch, H., Conradt, T., Gädeke, A., Grünewald, U. (2015): Potential impacts of climate change and regional anthropogenic activities in Central European mesoscale catchments. Hydrological Sciences Journal 60(5): 912-28 27

Can water resources management alleviate the uncertainty of projected climate change impacts on
river discharge?
A comparative study in two hydrologically similar
catchments with different level of management
Ina Pohle, Anne Gädeke, Hagen Koch, Sabine Schümberg, Christoph Hinz

Correlation between discharge of consecutive gauges (weekly, 1971/2000)
Natural discharge between one gauge and the next is highly correlated
Observed discharge: correlation is not pronounced in the presence of reservoirs & the Spreewald Biosphere Reserve between gauges
Large reservoirs (of main river) Reservoir (tributaries) Spreewald Biosphere Reserve
29

Storage ratio 2047-2052 (mean value of 100 realisations each)
Increase of the storage ratio compared to the recent past in the Spree River catchment: • By ca. factor 2 due to increase in reservoir capacity • Additional effects of decreasing natural discharge
30
𝐒𝐭𝐨𝐫𝐚𝐠𝐞 𝐑𝐚𝐭𝐢𝐨 = 𝐒𝐭𝐨𝐫𝐚𝐠𝐞 𝐂𝐚𝐩𝐚𝐜𝐢𝐭𝐲
𝐌𝐐 (Natural MQ as simulated by SWIM)

Influence of a reservoir on discharge dynamics - Bautzen Reservoir (2002/2003, weekly)
Reduction of flood peaks ()
Low flow augmentation ()
Water stored in winter to be released in summer
31

Observed discharge (1971-2000, weekly)
Large reservoirs Mining discharge
32

Variability of observed discharge (1971-2000, weekly)
Large reservoirs Mining discharge
R² & RBI reduced by reservoirs
Parde Range & IQRatio reduced by mining discharge
Slopes of fdc reduced by mining discharge
33

Variability changes over time (pentads, weekly)
1977 – Bautzen Reservoir
RBI & Interquartile ratio in Lieske reduced
1980s highest mining discharges lowest variability of discharge in Cottbus
Declining mining activities after 1990 increasing discharge variability in Cottbus
Cottbus Lieske Bautzen
34

Variability: distribution (1971/2000, weekly)
Slope 1𝟎/25 = slope between the 10th and the 25th quantile of exceedance (standardised by the mean)
Observed discharge shows lower variability in high flows compared to natural discharge (especially in and downstream of the mining region)
35

Climate change & impacts (pentad 2050, weekly values from 100 realisations each)
Schwarze Elster Spree Compared to S 0K (baseline) scenarios S 2K and S 3K show:
• Higher temperature
• Lower precipitation
• Higher PET and more variability in PET
• Similar AET (but less variability of AET)
• Differences between the catchments are not pronounced
36

Climate change & impacts (pentad 2050, weekly values from 100 realisations each)
Schwarze Elster Spree
Required minimum Q for Spree at Gr. Tränke: 8 m³/s
Compared to S 0K (baseline) scenarios S 2K and S 3K show:
• Natural discharge: lower mean and lower range (comparable for both catchments)
• Managed discharge: lower mean
• Schwarze Elster: natural discharge and managed discharge very similar
• Spree: Managed discharge shows very small variation
37

Differences between projected discharge by two conceptually different hydrological models: SWIM and EGMO
SWIM, weekly mean EGMO, weekly mean All realisations
Week of year Week of year
Mean value
Q [
m³/
s]
Q [
m³/
s]
Q [
m³/
s]
In terms of mean values and distributions the choice of the hydrological model adds little uncertainty compared to the climate scenario
Pohle et al. 2016
38

Variability: seasonality (1971/2000)
Pardé Index (Pardé 1947): long term mean monthly / long term mean annual values Range of the Pardé index describes variation of the monthly contributions to flow
In and downstream of the mining region the observed discharge shows smaller seasonality than the natural discharge
39