can we nudge farmers into saving water? evidence from a
TRANSCRIPT
HAL Id: hal-02380993https://hal.archives-ouvertes.fr/hal-02380993
Submitted on 5 Dec 2019
HAL is a multi-disciplinary open accessarchive for the deposit and dissemination of sci-entific research documents, whether they are pub-lished or not. The documents may come fromteaching and research institutions in France orabroad, or from public or private research centers.
L’archive ouverte pluridisciplinaire HAL, estdestinée au dépôt et à la diffusion de documentsscientifiques de niveau recherche, publiés ou non,émanant des établissements d’enseignement et derecherche français ou étrangers, des laboratoirespublics ou privés.
Can we nudge farmers into saving water? Evidence froma randomised experiment
Sylvain Chabe-Ferret, Philippe Le Coent, Arnaud Reynaud, Julie Subervie,Daniel Lepercq
To cite this version:Sylvain Chabe-Ferret, Philippe Le Coent, Arnaud Reynaud, Julie Subervie, Daniel Lepercq. Can wenudge farmers into saving water? Evidence from a randomised experiment. European Review of Agri-cultural Economics, Oxford University Press (OUP), 2019, 46 (3), pp.393-416. �10.1093/erae/jbz022�.�hal-02380993�
European Review of Agricultural Economics Vol 46 (3) (2019) pp. 393–416doi:10.1093/erae/jbz022Advance Access Publication 4 June 2019
Can we nudge farmers into saving water?Evidence from a randomised experiment
Sylvain Chabé-Ferret†, Philippe Le Coent‡,*,Arnaud Reynaud§, Julie Subervie** and Daniel Lepercq†††Toulouse School of Economics, INRA, University of Toulouse Capitole,Toulouse, France; ‡BRGM, Univ. Montpellier, France; §Toulouse Schoolof Economics, INRA, University of Toulouse Capitole, Toulouse, France;**CEE-M, Univ. Montpellier, CNRS, INRA, Montpellier SupAgro,France; ††Compagnie d’Aménagement des Coteaux de Gascogne(CACG), France
Received April 2018; editorial decision February 2019; final version accepted March2019
Review coordinated by Sophie Thoyer and Raphaële Preget
Abstract
We test whether social comparison nudges can promote water-saving behaviouramong farmers as a complement to traditional CAP measures. We conducted a ran-domised controlled trial among 200 farmers equipped with irrigation smart meters inSouth-West France. Treated farmers received weekly information on individual andgroup water consumption over four months. Our results rule out medium to largeeffect-sizes of the nudge. Moreover, they suggest that the nudge was effective atreducing the consumption of those who irrigate the most, although it appears to havereduced the proportion of those who do not consume water at all.
Keywords: nudges, behavioural economics, irrigation water use, public policy
JEL classification: D90, Q25, Q58
1. Introduction
Agricultural production is among the most water-intensive activities in theEuropean Union (EU).1 Water scarcity is already a key challenge in SouthernEurope and it is expected to become even more severe and widespread in thecoming years because of climate change. From 1960 to 2010, renewablefreshwater resources per capita have decreased by 24 per cent in Europe, par-ticularly in southern Europe, and the key objectives of the Seventh
*Corresponding author: E-mail: [email protected]
1 The Agriculture, Forestry and Fishing sector represents 51.4 per cent of total water use in the
European Union. These figures were provided by the website of the European Environment
Agency in 2017.
© Oxford University Press and Foundation for the European Review of Agricultural Economics 2019; all rightsreserved. For permissions, please e-mail: [email protected]
Dow
nloaded from https://academ
ic.oup.com/erae/article-abstract/46/3/393/5510773 by BR
GM
user on 05 Decem
ber 2019
Environment Action Programme concerning the quantitative management ofwater between 2002 and 2014 have not been achieved (EEA, 2017).Improving the efficiency of water use, including the efficiency of irrigation inagriculture, is therefore one of the priorities of the CAP 2014–2020.2
To fulfil the objectives of the EU Water Framework Directive, which estab-lished the principles of a common water policy in Europe in 2000, theEuropean Agricultural Fund for Rural Development (EAFRD) supports twomain types of measures at the European level: investment subsidies for water-efficient technologies and agri-environmental schemes where farmers committo reduce their use of water by substituting leguminous crops for more water-intensive crops in exchange for a predetermined annual payment.3 In this article,we consider a new policy instrument called a nudge, which is based on the find-ings of behavioural sciences and could complement existing CAP measures andcontribute to addressing the problem of water resources in Europe. Nudges usesubtle modifications of decision contexts to trigger pro-environmental beha-viours without altering monetary incentives or the option set itself. A wide var-iety of nudges have been identified in the literature, including those thatleverage individuals’ desires to maintain an attractive self-image and those thatexploit individuals’ inclinations to imitate the behaviour of their peers(Schubert, 2017). This approach is increasingly being adopted in various publicpolicy contexts, like energy conservation or waste reduction. However, it hasreceived little attention with respect to its likely impact on agricultural practices.In this article, we test whether social comparison nudges – reports comparingindividual consumption to the consumption of similar neighbours – can increasewater-saving behaviour among farmers.There has been considerable interest recently in the ability of social com-
parison nudges to trigger changes in pro-environmental behaviours (Crosonand Treich, 2014; Schubert, 2017). Indeed, social comparison nudges can bea cost-effective way to change behaviour even if their effects are smallbecause they can be applied to a large population at a small cost. Moreover,social comparison nudges are likely to work because social comparison isone of the most ubiquitous features of human social life. Indeed, individualsoften look to others as comparison standards for how to behave, think andfeel in order to smoothly coordinate economic exchange, political action andsocial relationships (Baldwin and Mussweiler, 2018). The effect of socialcomparison nudges on the adoption of pro-environmental behaviour relies ontwo different psychological mechanisms. First, a social comparison nudgeinforms about what other people do,4 which can provoke a change in behav-iour that is motivated by a fear of receiving a social sanction (Sunstein,
2 Regulation (EU) No 1305/2013 of the European Parliament and of the Council of 17 December
2013 on support for rural development by the European Agricultural Fund for Rural
Development (EAFRD) and repealing Council Regulation (EC) No 1698/2005.
3 The conditions of the first measure moreover require that farmers possess proof of the author-
isation to withdraw water for irrigation as well as a functioning water meter.
4 This is referred to as the descriptive meaning of the social norm (see Cialdini, Reno and
Kallgren (1990) and references therein).
394 S. Chabé-Ferret et al.
Dow
nloaded from https://academ
ic.oup.com/erae/article-abstract/46/3/393/5510773 by BR
GM
user on 05 Decem
ber 2019
1996) or by a desire to conform based on the perception that the descriptivenorm reflects what is likely to be an effective action to undertake (Thøgersen,2014). Second, by making the behaviour of others more salient at themoment that a decision is being made, a social comparison nudge can influ-ence behaviour through automatic heuristics (Cialdini, Reno and Kallgren,1990).
Most of the empirical evidence described in the environmental economicliterature on green nudges has focused on consumers’ behaviour and hasbeen able to demonstrate significant, albeit small, effects on electricity andwater consumption for example (Allcott, 2011; Ferraro, Miranda and Price,2011; Byerly et al., 2018). It is still unclear though whether social compari-son nudges can influence the behaviour of economic agents in a professionalor income-generating activity such as farming (Messer, Ferraro and William,2015; Ferraro, Messer and Wu, 2017).5 There are good reasons to believethat the responses to nudges of economic agents in a professional contextmight differ from responses of consumers. On the one hand, if the activity tobe nudged is important for the economic agent’s income, they may reactintensely to new information about others’ practices. This assumption is sup-ported by recent studies that highlight the influence of social norms in farm-ers’ pro-environmental decisions (Burton, 2004; Kuhfuss et al., 2016; LeCoent, Préget and Thoyer, 2018). On the other hand, it is also likely thatfarmers have already reached a private optimum and are not likely to changetheir behaviour following a non-monetary incentive. It thus remains anempirical question as to whether social comparison nudges can be efficient inchanging strategic agricultural practices, such as the amount of water usedfor irrigation. This article aims to answer this question. It is, moreover, oneof the first studies to present the results of a Randomised Controlled Trial(RCT) in the European farming context (Behaghel, Macours and Subervie,2019; Dessart, Barreiro-Hurle and van Bavel, 2019).6
This study was carried out in partnership with the Compagnied’Amenagement des Coteaux de Gascogne (CACG), the water distributioncompany in charge of the management of irrigation infrastructure in theNeste river basin in South West France. In this area, secure access to waterirrigation since the 19th century has led to the development of irrigation-dependent crops such as maize and more recently soybean. Due to the pre-vailing weather conditions in this area, the profitability of the production ofthese crops largely depends on access to water. In recent years, the increasedrecurrence of droughts and the emergence of environmental constraints havecalled for the adoption of water-efficient agricultural practices. Strategicchanges, such as the adoption of drought-tolerant crops or new irrigation
5 The literature on the adoption of new agricultural technology showed that farmers may learn
about the characteristics of a new technology from their neighbours’ experiments (Conley and
Udry, 2001).
6 As Behaghel, Macours and Subervie (2019) point out, the implementation of an RCT represents
a real challenge in the European context, where evaluators are generally confronted with many
kinds of technical and political obstacles.
Can we nudge farmers into saving water? 395
Dow
nloaded from https://academ
ic.oup.com/erae/article-abstract/46/3/393/5510773 by BR
GM
user on 05 Decem
ber 2019
equipment, are currently promoted by the CAP. Tactical adjustments, such asmore precise matching of irrigation activity to crop needs or the avoidance ofwasted water, also contribute to conserving the resource.In the summer of 2017, we implemented an RCT among 200 farmers
equipped with smart meters, who were customers of the CACG, to test theeffectiveness of a social comparison nudge to reduce their use of water forirrigation. The use of smart water meters and an automated texting platformmade it possible to send inexpensive weekly text messages that communi-cated information to farmers about their own water use as well as that of theirneighbours. Our analysis of the data does not show any significant impact ofthe treatment on average total consumption. However, the treatment seems tohave decreased the proportion of farmers who consume more than 80 percent of their quota, which suggests that social comparison nudges can beeffective at influencing the behaviour of those who irrigate the most and whoare also presumably more likely to waste water. Our results moreover indi-cate that the intervention triggered unexpected consumption decisions amongthose who would have not consumed any water in the absence of interven-tion, which is referred to as the boomerang effect in the literature.The article is structured as follows. Section 2 reviews several key findings
in the rapidly growing literature on green nudges. Section 3 presents the con-text of the study. Section 4 describes the experimental design and the data.Section 5 presents the results. We discuss these results in Section 6 and con-clude with policy implications in Section 7.
2. Literature on social comparison nudges
A large amount of research in economics and psychology has been devotedto testing the effect of social comparison nudges on pro-environmentalbehaviour using experimental approaches (Farrow, Grolleau and Ibanez,2017). Social comparison nudges, based on a comparison between individualconsumption and collective group consumption, have been shown to have aneffect on the reduction of households’ electricity and water consumption(Nolan et al., 2008; Allcott, 2011; Ferraro, Miranda and Price, 2011; Ayres,Raseman and Shih, 2013; Costa and Kahn, 2013; Ferraro and Price, 2013).Similar results have been obtained on curbside recycling (Schultz, 1999) andguests’ towel reuse in hotels (Goldstein, Cialdini and Griskevicius, 2008).There are, however, contradictory results on whether social comparisonnudges have long term effects, with some authors finding that they do(Ferraro, Miranda and Price, 2011; Allcott and Rogers, 2014) and others thatthey do not (Dolan and Metcalfe, 2015).Several studies have found evidence of a boomerang effect of social com-
parison nudges. Informing households of the behaviour of their peers, forexample, has been shown to drive some households to increase undesirablebehaviours (Cialdini, Kallgren and Reno, 1991). Schultz et al. (2007) findthat providing information on average energy usage produced either desirableenergy savings or on the contrary an increase of energy consumption,
396 S. Chabé-Ferret et al.
Dow
nloaded from https://academ
ic.oup.com/erae/article-abstract/46/3/393/5510773 by BR
GM
user on 05 Decem
ber 2019
depending on whether households were already consuming at a high or a lowrate, respectively. This boomerang effect was, however, eliminated when thesocial information nudge was coupled with an injunctive norm message inthe form of an emoticon (a smiling face when consumption was below aver-age), indicating that a below-average level of energy consumption is sociallydesirable. In a similar way, Ayres, Raseman and Shih (2013) run two RCTsin partnership with utility companies that provide electricity and natural gasand find that treated households that had been in the lowest deciles of energyuse prior to the treatment actually increase their energy usage in response tothe intervention.
Schubert (2017) provides two explanations for the boomerang effect. First,providing information about the descriptive norm may give agents a so-called ‘moral license’ to continue engaging in grey behaviour (Cialdini et al.,2006). Second, the phenomenon may result from what social psychologistsrefer to as ‘normalisation’, or the idea that individuals tend to move closer tothe norm they perceive as currently prevailing among their peers (Sherif,1935). Some studies moreover suggest that heterogeneity in response tosocial comparison nudges may also come from individual preferences. Costaand Kahn (2013) show that social comparison nudges are two to four timesmore effective with political liberals than with conservatives. Goldstein,Cialdini and Griskevicius (2008) highlight that the influence of social com-parison nudges depends on the extent to which individuals identify them-selves with the reference group. Delmas and Lessem (2014) show that socialinformation has an effect only when it is made public.
Our paper contributes to two streams of literature. The first one investi-gates the impact of social norms on farmers’ decisions to adopt pro-environmental practices (Beedell and Rehman, 1999; Fielding et al., 2005;Defrancesco et al., 2008; Allaire, Cahuzac and Simioni, 2009; Willy andHolm-Müller, 2013; Le Coent, Préget and Thoyer, 2018). These papersreveal the influence of the decision and/or the opinion of others on the adop-tion of pro-environmental practices or on participation in agri-environmentalprogrammes, but are limited by weak evidence of causality. All of thesepapers rely on non-experimental approaches and run the risk of confoundingthe effect of social norms with unobserved and spatially correlated confoun-ders. The second stream of literature uses experimental approaches tomanipulate the information that is available to farmers on others’ behaviour,in the form of social comparison nudges, and analyse the resulting impact onfarmers’ decisions. This literature intends both to provide causal evidence ofthe role of social norms on farmers’ pro-environmental decisions and to testthe potential of social comparison nudges for their use agri-environmentalpolicies. Kuhfuss et al. (2016) and Chen et al. (2009) analyse the impact of asocial comparison nudge on intentions to (i) maintain a pro-environmentalpractice at the end of an AES and (ii) re-enrol in an AES programme,respectively. Despite their experimental approaches, these papers evaluate theimpact of social comparison nudges on intentions rather than actual behav-iour, which runs the risk of being affected by hypothetical bias. Other papers
Can we nudge farmers into saving water? 397
Dow
nloaded from https://academ
ic.oup.com/erae/article-abstract/46/3/393/5510773 by BR
GM
user on 05 Decem
ber 2019
have also tackled the impact of social comparison nudges on farmer deci-sions. Peth et al. (2018) conduct an extra-laboratory experiment (Charness,Gneezy and Kuhn, 2013) that tests the impact of a social comparison nudgeon the likelihood of complying with the minimum-distance-to-water rule inGermany. These decisions are, however, made in the context of a compu-terised business management game. Wallander, Ferraro and Higgins (2017)report on the results of a large scale RCT that tests the impact of a socialcomparison nudge on farmer participation in the Conservation ReserveProgramme (CRP), the biggest agri-environmental programme in the UnitedStates. Although participation in the CRP is a measure of actual behaviour, itcannot be considered a pro-environmental agricultural practice per se. To ourknowledge, our paper is therefore one of the first that reports on the effect ofa social comparison nudge on the adoption of pro-environmental practices byfarmers.
3. Context of the experiment
Our social comparison nudge was implemented in the Neste system locatedin South-West France. The Neste system is a system of rivers artificiallyrecharged by upstream reservoirs located in the Pyrenées mountains throughthe 29 km-long Neste canal, which was constructed between 1848 and 1862to overcome low water levels in the rivers of Gascony. The Neste systemcovers an area of 800,000 ha and gathers the catchment areas of 17 mainrivers. The land in this area is mainly dedicated to agriculture, with about5,000 km2 cultivated, of which 50,000 ha are irrigated. The experiment isimplemented in three watersheds: Arros, Baises and Boues.The Neste system is managed by a single operator, the CACG. The pub-
lic service mission of the CACG consists of contributing to the economicdevelopment of the Neste area through land use planning and the manage-ment of water resources. One important task of the CACG is to allocatewater across consumptive uses (domestic consumption, considered as anabsolute requirement, and irrigation, which can be limited in the event of adrought) and quality requirements (ecological flows). The relationshipbetween the CACG and the farmers using the CACG water network isdefined by a formal contract. This contract specifies a discharge rate and aquota associated to each unit of discharge rate a farmer subscribes for.Annual authorisations of water use, a sort of water right, are attributed ineach watershed by the French Single Water Users’ Associations(Organisme Unique de Gestion Collective or OUGCs). The authorisationsare generally attributed on historical grounds (grandfathering) and are nottransferable. The OUGC attributes any extra water extraction rights to, inorder of priority: young farmers, new applications by farmers who do notcurrently possess any water rights and, finally, farmers who wish toincrease the level of their existing water rights.Irrigation metering is mandatory. The water pricing mechanism combines
a fixed per unit price with volumetric pricing that is triggered when a
398 S. Chabé-Ferret et al.
Dow
nloaded from https://academ
ic.oup.com/erae/article-abstract/46/3/393/5510773 by BR
GM
user on 05 Decem
ber 2019
threshold of consumption is reached.7 In addition, for consumption above theallocated quota, the volumetric price is multiplied by a factor of 5–10. Insome watersheds, the first stage of volumetric pricing does not exist. Forexample, in the Arros river, the quota is 1,900 m3/ha. In 2017, farmers paid afixed price of 24€/ha with no volumetric pricing under the quota.8 Water con-sumed above the quota is paid at 0.14€/m3. As a consequence, a farmer whouses 110 per cent of the quota will pay 50.6€/ha on average. The price ofwater is therefore very low when water use remains below the quota, but canbecome very expensive once the quota is reached.
Agriculture is highly dependent on irrigation in the area of the experiment.Maize and soybean represent a large majority of the irrigated crops, followedto a lesser extent by sunflower, other cereals, tobacco and some vegetableproduction. In order to manage their irrigation, farmers have access to weeklytechnical bulletin that provides them with technical advice, information onweather forecasts, crop water needs and the state of water reserves, but noinformation on the irrigation practices of other farmers. The recent evolutionof rainfall patterns and the expected impacts of climate change increase thepressure on water resources and the risk of defaults in the provision of waterto farmers throughout the cropping season. The CACG is therefore trying toidentify ways to reduce water use among farmers. Since 2004, the CACG hasstarted to replace its traditional water meters with smart meters namedCALYPSO meters.
The CALYPSO device is an ultrasonic meter that sends data in real timeto a web-interface. These smart meters have two objectives. First, the CACGcollects data on farmers’ water use in real time and therefore is better able tomanage collective water resources, which occurs through the release of waterfrom dams when farmers require it and the retainment of water when it willnot be used. Second, the information generated by smart meters can be usedto influence individual behaviour. In this paper, we intend to enhance ourknowledge regarding how to achieve this second objective by examining theimpact of the strategic use of the data generated by smart meters to sendsocial comparison nudges to farmers.
4. Experimental design and data
We ran an experiment in which we sent farmers information generated bysmart meters on individual and collective water consumption on a weeklybasis. This information was conveyed via an SMS-based communication sys-tem managed by the CACG. We carried out two experiments in collaborationwith the CACG from July to September 2017 in the three watersheds of theNeste System: Arros, Les Baises and Boues. The protocol of these
7 This threshold is around 80–85 per cent of the quota and the price ranges from 0.02 to 0.03€/m3.
8 Although the term quota is used by the CACG to define its contractual relationship with farmers,
it should be viewed more as a binomial pricing scheme than a quota stricto sensu. Farmers are
indeed allowed to go above their quota, but they may face a significant marginal price increase
in that case.
Can we nudge farmers into saving water? 399
Dow
nloaded from https://academ
ic.oup.com/erae/article-abstract/46/3/393/5510773 by BR
GM
user on 05 Decem
ber 2019
experiments has been registered in the American Economic Association’sregistry for randomised controlled trials (Le Coent, Chabé-Ferret andReynaud, 2017).
4.1. Description of the nudge
In both experiments, we test whether a social comparison nudge delivered byweekly mobile text messages (11 in total) may have an effect on the amountof water that farmers use for irrigation. In both experiments, farmers in thetreatment group received an invitation to optimise their water usage alongwith an estimate of the average amount of water used by their neighbours.The estimate of average water consumption used in the intervention wascomputed using smart meter readings from the previous week. The smartmeter readings are sent to a centralised database, which enabled us to directlyobserve farmers’ decisions and to compute the weekly average of water con-sumption at the watershed level. The water consumption database is inte-grated with an automated SMS platform, which enabled us to craft ourmessages automatically and to send them directly to farmers’ mobile phones.Experiment 1 was run with a sample of 200 farmers equipped with
CALYPSO smart meters. One-hundred and one farmers were randomlyassigned to the control group and 99 to the treatment group. The controlgroup received the following normative message: ‘Hello Mr X. Water conser-vation is important for your watershed. Please continue to optimise your irri-gation.’ In addition to this normative message, farmers in the treatment groupreceived information about their own water consumption as well as the aver-age level of water consumption at the watershed level: ‘As of DD/MM, youhave consumed XX percent of your water quota. The irrigating farmers inyour watershed have used on average XX percent of their quota’. Moreover,for farmers whose water consumption was below average receive a messageof congratulations, inserted in the normative message: ‘As of DD/MM, youhave consumed XX percent of your water quota. CONGRATULATIONS!The irrigating farmers in your watershed have used on average XX percentof their quota’.Experiment 2 was run with a sample of 261 farmers equipped with trad-
itional water meters. The treatment (131 farmers) and control groups receivedthe same message as received by farmers in Experiment 1, except that theywere not provided any feedback on their own consumption (since such infor-mation is not provided by traditional meters).
4.2. Expected effects of the nudge
Our experimental design is aimed at testing the hypothesis that the abovedescribed social comparison nudges can reduce average water consumption.Such a hypothesis is likely to hold if two mechanisms occur simultaneously:farmers who are informed that their consumption is above average will
400 S. Chabé-Ferret et al.
Dow
nloaded from https://academ
ic.oup.com/erae/article-abstract/46/3/393/5510773 by BR
GM
user on 05 Decem
ber 2019
reduce their consumption to conform to the norm, while farmers who areinformed that their consumption is below average will not adjust their con-sumption since they already engage in the desired behaviour. As mentionedin Section 2, reasons for farmers to conform to the norm may be (i) the fearof receiving a social sanction, (ii) the fact that the norm reveals what is likelyto be effective behaviour and (iii) automatic heuristics.
In the context of a shared water resource, a social comparison nudge mayalso exacerbate the risk of over-consumption. Indeed, irrigation systems are atypical common-pool resource (Ostrom, 1992) and it is well known that the‘tragedy of the commons’ may occur in highly valued open-access commons(Hardin, 1968). By learning that the average consumption of the watershed islow (at least lower than their own consumption), farmers can deduce thatlarge quantities of water are available and therefore choose to increase theirconsumption. This strategic effect is the opposite of the intended social normeffect and no prior evidence enables us to anticipate which of the two willprevail.
4.3. Specific features of the nudge
Our design has six important features. First, sending messages to the controlgroup enables us to avoid Hawthorne effects, i.e. behavioural changes thatresult simply from an awareness that one is being observed. In most experi-ments on electricity consumption the control group did not receive any mes-sage, which has led to criticisms that the social information effects detectedmay only be due to Hawthorne effects (Schwartz et al., 2013).
Second, we measure water consumption as a share of the water quotarather than the volumetric consumption. Water consumption expressed as ashare of the quota can be used to compare water consumption for farms ofdifferent sizes and producing different crops. Providing consumption infor-mation in terms of share of the quota also reduces the cognitive burden asfarmers also pay for their water use according to this same indicator ofconsumption.
Third, the social information on water use is provided at the watershedlevel (and for the Arros river, also at the province level). We consider thatthe reference level of water consumption should be associated with a groupthat shares a similar social identity (Goldstein, Cialdini and Griskevicius,2008) or a similar production context.
Fourth, we exclude farmers with zero consumption when computing theaverage consumption (in percentage of the quota) for each geographicalgroup of farmers equipped with CALYPSO smart meters. With this decision,we wanted to avoid confusing farmers by confounding decisions made on theintensive and extensive margins.
Fifth, farmers whose water consumption is below average receive a‘Congratulations’ message that aims to neutralise a possible ‘boomerang’effect (Schultz et al., 2007).
Can we nudge farmers into saving water? 401
Dow
nloaded from https://academ
ic.oup.com/erae/article-abstract/46/3/393/5510773 by BR
GM
user on 05 Decem
ber 2019
Sixth, we do not send the ‘congratulations’ message to farmers who havenot used any water at all, as we assume that this may not be the result of aparticular effort but rather characterises farmers that are not using their waterrights due to their choices of crops for that year.
4.4. Sampling and data
In both experiments, the treatment group was determined using a stratifiedrandom sampling method. In Experiment 1, the strata were defined by (i) col-lective or individual irrigation facility9; (ii) river basin; (iii) province; (iv)size of the quota and (v) initial consumption at the beginning of the experi-ment (null or positive). In Experiment 2, the strata were defined by: (i) col-lective or individual irrigation facility10; (ii) river basin; (iii) size of the quotaand (iv) consumption as a share of the quota in 2016.We were informed just before the start of the experiment that some smart
meters did not communicate results properly. In order to control for thisproblem, farmers with defective smart meters were included in a strata.11 Inwhat follows, we report the results only for the 152 farmers who had func-tioning smart meters during the whole period. For this subset of farmers, wehave 11 water consumption observations (including the one collected beforethe experiment started). In Experiment 2, data collection was lengthier, asCACG staff were required to travel to the farms in order to read the waterconsumption on the meters. For this experiment we have only one observa-tion: cumulative water consumption as of February 12, from 239 out of the261 farmers who were initially part of the experiment. This is due to the clos-ure of 22 contracts during the season.After randomisation, the balance between the treatment and control groups
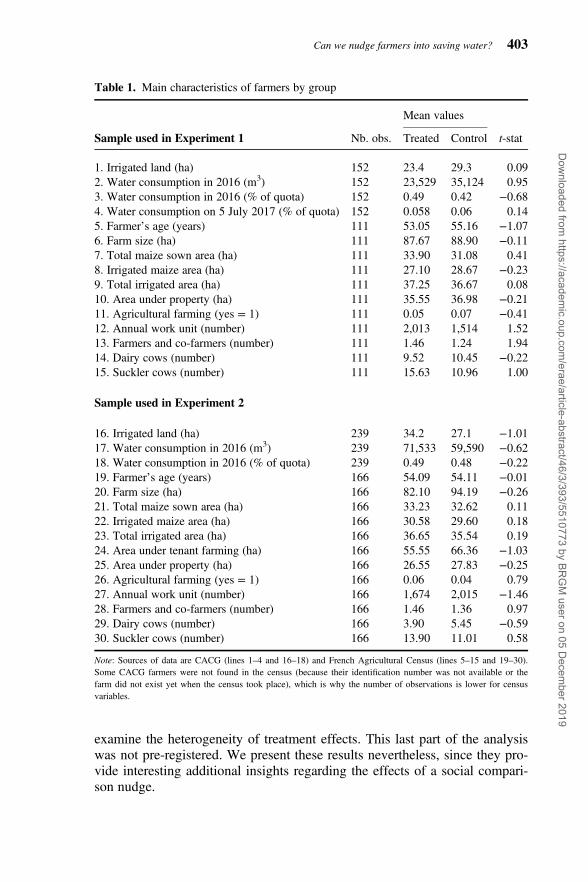
was tested regarding water quota, water consumption in 2016 (in volume),water consumption in 2016 (as a share of quota) and water consumption in2017 before the start of the experiment (as a share of quota). We moreovercrossed the data set with the 2010 Agricultural Census and were able toexamine the balance regarding several additional variables, as shown inTable 1.
5. Results
We first examine the effect of the social comparison nudges on total waterconsumption in each experiment. This analysis was pre-registered. We then
9 Collective irrigation facility, or ASA, group several farmers. There were initially four ASAs in
Experiment 1. ASAs, although they represent several farmers, are considered as single observa-
tions in our sample since we do not have information on the consumption of individual farmers.
In the interest of simplicity, we refer to water users as farmers throughout the text. Only ASA
leaders received the weekly text messages.
10 There are 19 ASAs in Experiment 2.
11 These farmers received the same information as farmers of Experiment 2 for the beginning of
the experiment. Beginning on 22 August 2017, 30 farmers had their smart meters repaired and
started receiving complete information.
402 S. Chabé-Ferret et al.
Dow
nloaded from https://academ
ic.oup.com/erae/article-abstract/46/3/393/5510773 by BR
GM
user on 05 Decem
ber 2019
examine the heterogeneity of treatment effects. This last part of the analysiswas not pre-registered. We present these results nevertheless, since they pro-vide interesting additional insights regarding the effects of a social compari-son nudge.
Table 1. Main characteristics of farmers by group
Mean values
Sample used in Experiment 1 Nb. obs. Treated Control t-stat
1. Irrigated land (ha) 152 23.4 29.3 0.092. Water consumption in 2016 (m3) 152 23,529 35,124 0.953. Water consumption in 2016 (% of quota) 152 0.49 0.42 −0.684. Water consumption on 5 July 2017 (% of quota) 152 0.058 0.06 0.145. Farmer’s age (years) 111 53.05 55.16 −1.076. Farm size (ha) 111 87.67 88.90 −0.117. Total maize sown area (ha) 111 33.90 31.08 0.418. Irrigated maize area (ha) 111 27.10 28.67 −0.239. Total irrigated area (ha) 111 37.25 36.67 0.0810. Area under property (ha) 111 35.55 36.98 −0.2111. Agricultural farming (yes = 1) 111 0.05 0.07 −0.4112. Annual work unit (number) 111 2,013 1,514 1.5213. Farmers and co-farmers (number) 111 1.46 1.24 1.9414. Dairy cows (number) 111 9.52 10.45 −0.2215. Suckler cows (number) 111 15.63 10.96 1.00
Sample used in Experiment 2
16. Irrigated land (ha) 239 34.2 27.1 −1.0117. Water consumption in 2016 (m3) 239 71,533 59,590 −0.6218. Water consumption in 2016 (% of quota) 239 0.49 0.48 −0.2219. Farmer’s age (years) 166 54.09 54.11 −0.0120. Farm size (ha) 166 82.10 94.19 −0.2621. Total maize sown area (ha) 166 33.23 32.62 0.1122. Irrigated maize area (ha) 166 30.58 29.60 0.1823. Total irrigated area (ha) 166 36.65 35.54 0.1924. Area under tenant farming (ha) 166 55.55 66.36 −1.0325. Area under property (ha) 166 26.55 27.83 −0.2526. Agricultural farming (yes = 1) 166 0.06 0.04 0.7927. Annual work unit (number) 166 1,674 2,015 −1.4628. Farmers and co-farmers (number) 166 1.46 1.36 0.9729. Dairy cows (number) 166 3.90 5.45 −0.5930. Suckler cows (number) 166 13.90 11.01 0.58
Note: Sources of data are CACG (lines 1–4 and 16–18) and French Agricultural Census (lines 5–15 and 19–30).Some CACG farmers were not found in the census (because their identification number was not available or thefarm did not exist yet when the census took place), which is why the number of observations is lower for censusvariables.
Can we nudge farmers into saving water? 403
Dow
nloaded from https://academ
ic.oup.com/erae/article-abstract/46/3/393/5510773 by BR
GM
user on 05 Decem
ber 2019
5.1. Impact on total and weekly water consumption
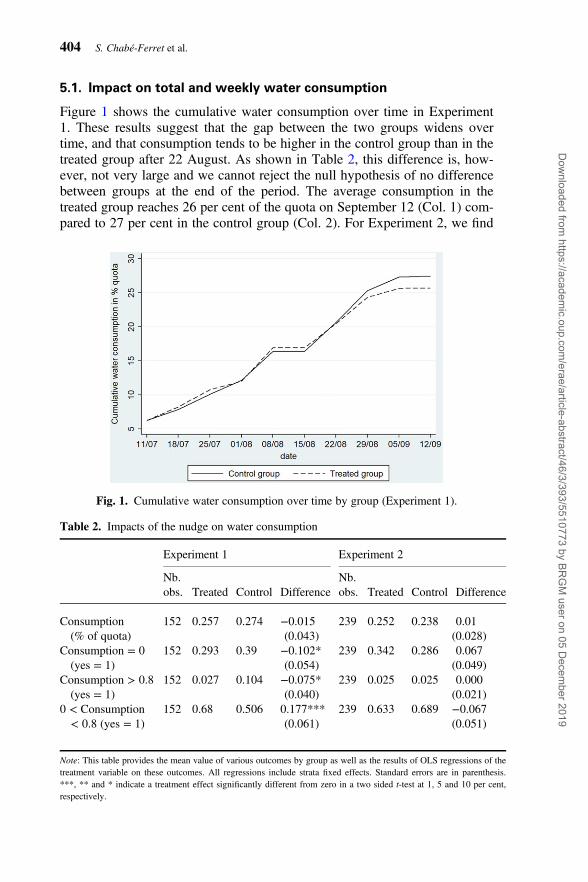
Figure 1 shows the cumulative water consumption over time in Experiment1. These results suggest that the gap between the two groups widens overtime, and that consumption tends to be higher in the control group than in thetreated group after 22 August. As shown in Table 2, this difference is, how-ever, not very large and we cannot reject the null hypothesis of no differencebetween groups at the end of the period. The average consumption in thetreated group reaches 26 per cent of the quota on September 12 (Col. 1) com-pared to 27 per cent in the control group (Col. 2). For Experiment 2, we find
Fig. 1. Cumulative water consumption over time by group (Experiment 1).
Table 2. Impacts of the nudge on water consumption
Experiment 1 Experiment 2
Nb.obs. Treated Control Difference
Nb.obs. Treated Control Difference
Consumption(% of quota)
152 0.257 0.274 −0.015(0.043)
239 0.252 0.238 0.01(0.028)
Consumption = 0(yes = 1)
152 0.293 0.39 −0.102*(0.054)
239 0.342 0.286 0.067(0.049)
Consumption > 0.8(yes = 1)
152 0.027 0.104 −0.075*(0.040)
239 0.025 0.025 0.000(0.021)
0 < Consumption< 0.8 (yes = 1)
152 0.68 0.506 0.177***(0.061)
239 0.633 0.689 −0.067(0.051)
Note: This table provides the mean value of various outcomes by group as well as the results of OLS regressions of thetreatment variable on these outcomes. All regressions include strata fixed effects. Standard errors are in parenthesis.***, ** and * indicate a treatment effect significantly different from zero in a two sided t-test at 1, 5 and 10 per cent,respectively.
404 S. Chabé-Ferret et al.
Dow
nloaded from https://academ
ic.oup.com/erae/article-abstract/46/3/393/5510773 by BR
GM
user on 05 Decem
ber 2019
that 25 per cent of the quota is used in the treated group (Col. 4) and 24 percent is used in the control group (Col. 5).12 Again, the null hypothesis of noimpact cannot be rejected.
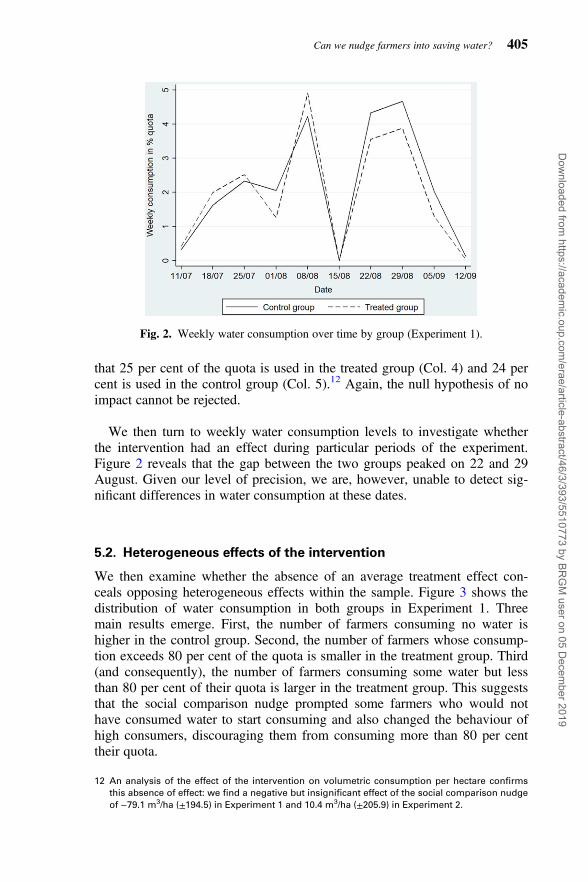
We then turn to weekly water consumption levels to investigate whetherthe intervention had an effect during particular periods of the experiment.Figure 2 reveals that the gap between the two groups peaked on 22 and 29August. Given our level of precision, we are, however, unable to detect sig-nificant differences in water consumption at these dates.
5.2. Heterogeneous effects of the intervention
We then examine whether the absence of an average treatment effect con-ceals opposing heterogeneous effects within the sample. Figure 3 shows thedistribution of water consumption in both groups in Experiment 1. Threemain results emerge. First, the number of farmers consuming no water ishigher in the control group. Second, the number of farmers whose consump-tion exceeds 80 per cent of the quota is smaller in the treatment group. Third(and consequently), the number of farmers consuming some water but lessthan 80 per cent of their quota is larger in the treatment group. This suggeststhat the social comparison nudge prompted some farmers who would nothave consumed water to start consuming and also changed the behaviour ofhigh consumers, discouraging them from consuming more than 80 per centtheir quota.
Fig. 2. Weekly water consumption over time by group (Experiment 1).
12 An analysis of the effect of the intervention on volumetric consumption per hectare confirms
this absence of effect: we find a negative but insignificant effect of the social comparison nudge
of −79.1 m3/ha (±194.5) in Experiment 1 and 10.4 m3/ha (±205.9) in Experiment 2.
Can we nudge farmers into saving water? 405
Dow
nloaded from https://academ
ic.oup.com/erae/article-abstract/46/3/393/5510773 by BR
GM
user on 05 Decem
ber 2019
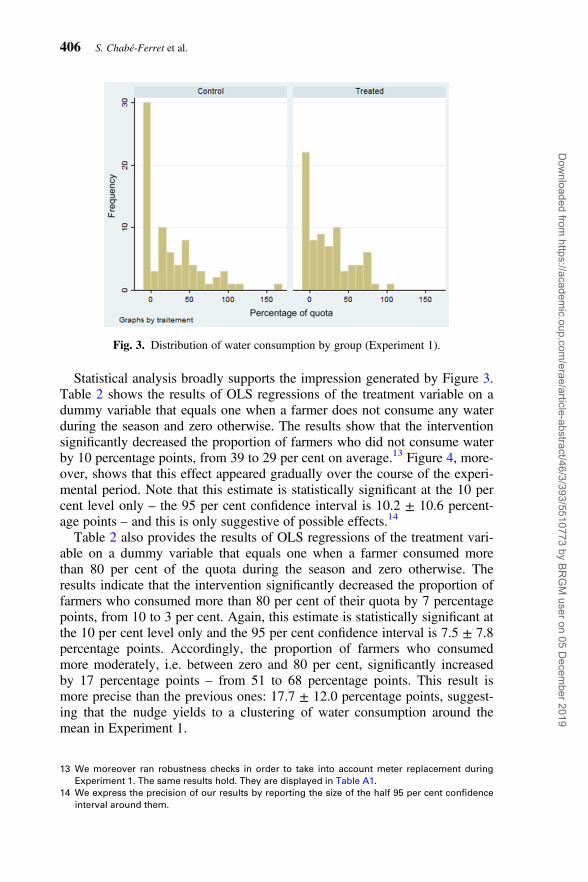
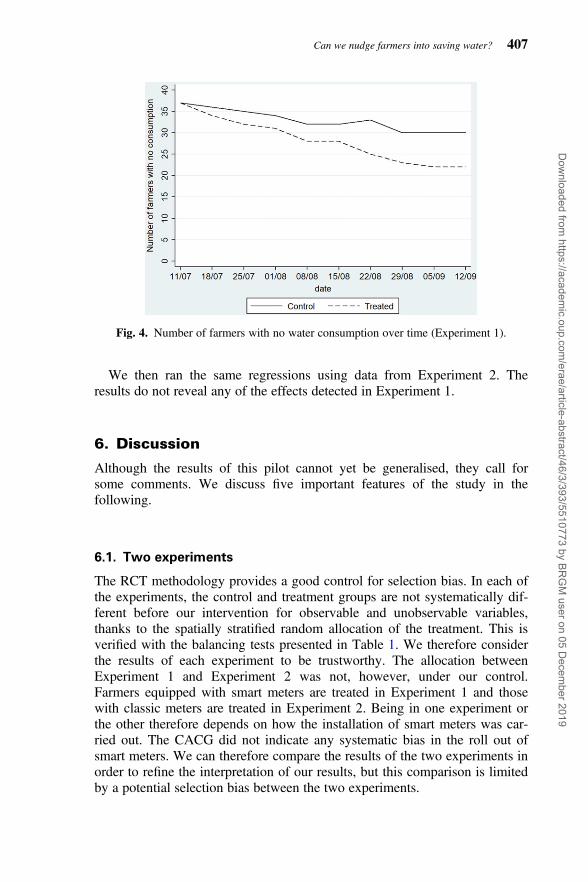
Statistical analysis broadly supports the impression generated by Figure 3.Table 2 shows the results of OLS regressions of the treatment variable on adummy variable that equals one when a farmer does not consume any waterduring the season and zero otherwise. The results show that the interventionsignificantly decreased the proportion of farmers who did not consume waterby 10 percentage points, from 39 to 29 per cent on average.13 Figure 4, more-over, shows that this effect appeared gradually over the course of the experi-mental period. Note that this estimate is statistically significant at the 10 percent level only – the 95 per cent confidence interval is 10.2 ± 10.6 percent-age points – and this is only suggestive of possible effects.14
Table 2 also provides the results of OLS regressions of the treatment vari-able on a dummy variable that equals one when a farmer consumed morethan 80 per cent of the quota during the season and zero otherwise. Theresults indicate that the intervention significantly decreased the proportion offarmers who consumed more than 80 per cent of their quota by 7 percentagepoints, from 10 to 3 per cent. Again, this estimate is statistically significant atthe 10 per cent level only and the 95 per cent confidence interval is 7.5 ± 7.8percentage points. Accordingly, the proportion of farmers who consumedmore moderately, i.e. between zero and 80 per cent, significantly increasedby 17 percentage points – from 51 to 68 percentage points. This result ismore precise than the previous ones: 17.7 ± 12.0 percentage points, suggest-ing that the nudge yields to a clustering of water consumption around themean in Experiment 1.
Fig. 3. Distribution of water consumption by group (Experiment 1).
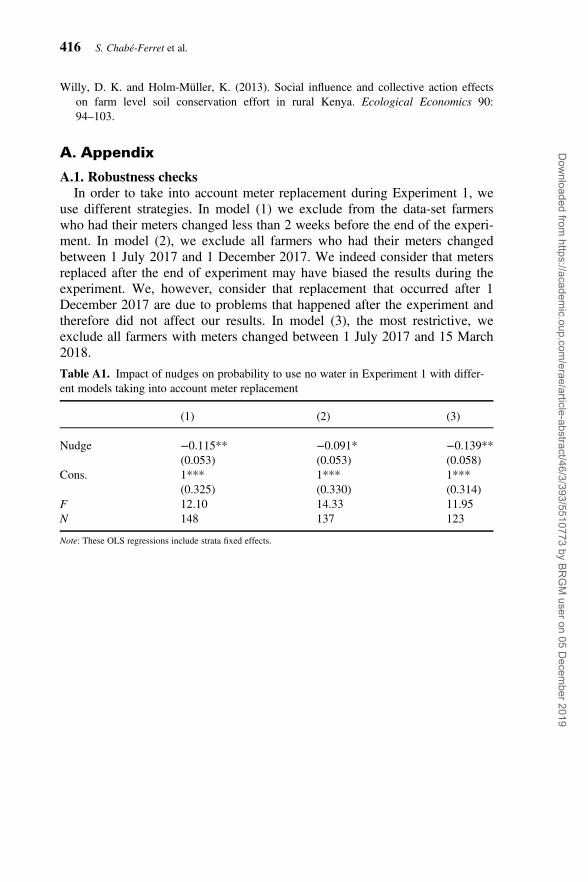
13 We moreover ran robustness checks in order to take into account meter replacement during
Experiment 1. The same results hold. They are displayed in Table A1.
14 We express the precision of our results by reporting the size of the half 95 per cent confidence
interval around them.
406 S. Chabé-Ferret et al.
Dow
nloaded from https://academ
ic.oup.com/erae/article-abstract/46/3/393/5510773 by BR
GM
user on 05 Decem
ber 2019
We then ran the same regressions using data from Experiment 2. Theresults do not reveal any of the effects detected in Experiment 1.
6. Discussion
Although the results of this pilot cannot yet be generalised, they call forsome comments. We discuss five important features of the study in thefollowing.
6.1. Two experiments
The RCT methodology provides a good control for selection bias. In each ofthe experiments, the control and treatment groups are not systematically dif-ferent before our intervention for observable and unobservable variables,thanks to the spatially stratified random allocation of the treatment. This isverified with the balancing tests presented in Table 1. We therefore considerthe results of each experiment to be trustworthy. The allocation betweenExperiment 1 and Experiment 2 was not, however, under our control.Farmers equipped with smart meters are treated in Experiment 1 and thosewith classic meters are treated in Experiment 2. Being in one experiment orthe other therefore depends on how the installation of smart meters was car-ried out. The CACG did not indicate any systematic bias in the roll out ofsmart meters. We can therefore compare the results of the two experiments inorder to refine the interpretation of our results, but this comparison is limitedby a potential selection bias between the two experiments.
Fig. 4. Number of farmers with no water consumption over time (Experiment 1).
Can we nudge farmers into saving water? 407
Dow
nloaded from https://academ
ic.oup.com/erae/article-abstract/46/3/393/5510773 by BR
GM
user on 05 Decem
ber 2019

6.2. Specificity of the context
The results of each experiment are specific to each of their specific contexts,especially regarding weather conditions. The winter of 2017 was very dry,which led to a limited water reserve in the dams at the beginning of the grow-ing season. Water quotas had already been reduced at the onset of the seasonin anticipation of a water shortage. Nevertheless, the growing season wasmarked by regular rainfall that eased the fear of water restrictions andreduced the use of irrigation. There is therefore a need to replicate theseexperiments in different contexts in order to explore the extent to which ourresults can be generalised. It is possible, for example, that the reduction inwater use among high consumers observed in Experiment 1 would be of alower magnitude in a dryer year because the marginal cost of complying withthe norm (i.e. by reducing irrigation) would be larger. Similar trade-offsbetween social or cultural norms and economic incentives have already beenfound with respect to fertility decisions (Chabé-Ferret, 2016).
6.3. Farmers versus consumers
Our results suggest that professional farmers do not seem to react much moreto social comparison nudges than consumers do. Previous results indeedshow that the effect of social comparison nudges on electricity or water con-sumption by households are very small, in terms of Cohen’s d (Baguley,2009).15 We reject large and medium effects of the social comparison nudgein both of our experiments. For water consumption, the Cohen’s d corre-sponding to the extreme of the 95 per cent confidence interval of the impactof the nudge is −0.29 in Experiment 1 and −0.13 in Experiment 2. Ourresults nevertheless leave open the possibility that farmers respond slightlymore than households to social comparison nudges. It remains to be seenwhether farmers react in the same way as consumers (with very smallresponses), more (with small responses) or not at all. Larger, more preciseexperiments will be needed in order to answer this question.
6.4. Boomerang effect
The results of Experiment 1 provide evidence of a boomerang effect of asocial comparison nudge among professional economic agents. We believethat some farmers who had not originally planned to use water ended upusing some after receiving the nudge. One explanation for this result mightbe that some farmers who did not plan to use water nonetheless decided touse some on crops that usually do not require much water, such as sun-flowers, or that can grow without irrigation (which comes at a cost in terms
15 A large effect is defined as a Cohen’s d of the order of 0.8. A medium effect is defined as a
Cohen’s d of the order of 0.5. A small effect is defined as a Cohen’s d above 0.2 and a very small
effect as Cohen’s d of the order of 0.01. Cohen’s d is computed by dividing the treatment effect
by the standard deviation of outcomes in the control group.
408 S. Chabé-Ferret et al.
Dow
nloaded from https://academ
ic.oup.com/erae/article-abstract/46/3/393/5510773 by BR
GM
user on 05 Decem
ber 2019
of yields), such as soybeans. Two features of our experiment may have com-bined to generate a boomerang effect at the extensive margin. First, we didnot add the ‘congratulations’ message for farmers with zero consumptionsince we were unsure how they would interpret this message. Second, weonly computed average water consumption for farmers who consumed astrictly positive amount of water, in order not to confuse farmers about inten-sive versus extensive margins of water consumption. We tried to make thisclear in the message by saying that the average consumption is computed forfarmers that do irrigate. But if interpreted incorrectly as an unconditionalaverage, and in combination with the absence of a ‘Congratulations’ moder-ator, this may well have given the impression to farmers who were not con-suming water that everybody else was consuming water and that we wereencouraging them to do so too.
The results from Experiment 2 may help to shed some light on the reasonsfor the boomerang effect. The results from Experiment 2 do not provide evi-dence in favour of a boomerang effect. Because Experiment 2 only differsfrom Experiment 1 insofar as farmers in the former are not sent informationon their own consumption, we see at least four possible explanations for thelack of treatment effect in Experiment 2. First, comparing their own con-sumption with that of their neighbours might have triggered those who previ-ously consumed no water to begin consuming water. This interpretation is abit contrived since one may assume that farmers who do not consume anywater are already aware of this. Although we do not provide any additionalinformation to these farmers in Experiment 1 as compared to Experiment 2,we do increase the salience of the comparison between their own lack of con-sumption and the positive consumption of others. This difference in saliencebetween experiments may therefore help to explain the boomerang effectobserved in Experiment 1.
Second, it is possible that receiving information on their own consumptiondoes not in fact impact farmers consuming no water. If this is the case, theprovision of this information in Experiment 1 but not in Experiment 2 cannotbe a source of the difference in treatment effects observed, and may insteadonly be the result of sampling noise (given that the confidence intervals inboth experiments overlap) or of differences in the samples betweenExperiments 1 and 2.
A third possible interpretation is that farmers who received informationthat they have not used their quota every week may have felt scrutinised bythe CACG for their absence of water consumption, despite owning the rightsto do so. They may even have felt the threat of losing their water quota forthe following year, which could have led them to use some water in order toavoid this threat.
Fourth, a final possibility is that receiving information regarding their ownconsumption revealed to farmers in Experiment 1 that they had dysfunctionalsmart meters. If farmers in the treatment group that had consumed somewater received information that their registered consumption was actuallyzero, they may have called the CACG and requested a new smart meter,
Can we nudge farmers into saving water? 409
Dow
nloaded from https://academ
ic.oup.com/erae/article-abstract/46/3/393/5510773 by BR
GM
user on 05 Decem
ber 2019
thereby increasing their registered consumption. Since only the treated farm-ers in Experiment 1 were able to compare their registered consumption withtheir actual consumption, this behaviour might have generated a spuriousboomerang effect. After further investigation, however, we discard this possi-bility: we do not find significantly more smart meter replacements in the trea-ted sample of Experiment 1 than in the control sample (16 vs. 13), and thesame boomerang effect holds when removing farmers whose smart metershad been replaced from the sample, as shown in Appendix A. More researchwill be needed in order to estimate this potential boomerang effect with moreprecision and to investigate whether sending a ‘Congratulations’ messagewould make this undesirable effect disappear.
6.5. Strategic behaviour
The third takeaway from this work is that the hypothesis that strategic behav-iour leads to the tragedy of the commons cannot alone explain the data.Indeed, while the boomerang effect among low water consumers observed inExperiment 1 is compatible with a tragedy of the commons narrative, thedecrease in consumption at the top of the distribution is not. On the contrary,a tentative interpretation of this result is that the farmers who consume themost reduced their consumption in order to conform to the prevailing norm.We cannot, however, disentangle whether farmers follow this norm out offear of receiving a social sanction, because the nudge provided informationregarding behaviour that is likely to be effective, or through automatic heuris-tics. There is also another possible interpretation of the reduction of largeconsumption: it might be due to treated farmers being more aware of the pre-cise level of their consumption of their quota and stopping their use of waterbefore going above the quota. This is a real possibility, since it is not easyfor farmers to keep track of the share of their quota that they have alreadyconsumed. More research will be needed in order to explore the robustnessof this effect as well.
7. Conclusion
Although improving efficiency of water use in agriculture has been a clearobjective of the European CAP for a long time, water scarcity remains a crit-ical issue in Europe, especially in the Mediterranean regions. Agriculturemust therefore both contribute to the mitigation of this problem and adapt tothe expected increase in droughts. This situation provides an opportunity todesign and implement new tools to encourage water conservation amongfarmers. Among these tools, nudges are considered to be a promising policytool that is able to complement the other tools already used by European pub-lic authorities (EESC, 2017). Nudges also constitute a lower-cost interventionthan can potentially be applied to all farmers, unlike other CAP instruments,which are generally based on voluntary participation.
410 S. Chabé-Ferret et al.
Dow
nloaded from https://academ
ic.oup.com/erae/article-abstract/46/3/393/5510773 by BR
GM
user on 05 Decem
ber 2019
In this paper, we report on an experiment designed to test whether a socialcomparison nudge can contribute to promote water-saving behaviour in agri-culture. Although our results do not reveal a large or even moderate reductionin average water use, they are nevertheless compatible with the small to verysmall effects that have been found with respect to the household consumerbehaviour. We detect indications of reduction in water consumption amongthe largest water users, but at the same time the intervention appeared tohave stimulated water consumption among farmers who did not previouslyuse any water. The absence of a medium to large treatment effect, as well asindications of an undesirable boomerang effect, calls for (i) larger-scaleexperiments to be conducted in order to be able to detect effects of a smallermagnitude and (ii) a careful testing of nudges before scaling up their use.More research is therefore needed to strengthen our conclusions on the inter-est of nudges and avoid potential undesirable effects.
The first direction for further research is to improve the precision of themeasured impact of social comparison nudges on water consumption. We areclearly in need of experiments with greater power, with sample sizes in theorder of thousands of farmers, in order to be able to detect potentially smalleffects. One possibility would be to run a large experiment, or to combineseveral similar experiments, across several EU countries that suffer fromwater scarcity and where farmers are equipped with smart meters.
The second direction for further research is to improve the targeting ofnudges in order to avoid the boomerang effect. Simple strategies such as notsending messages to individuals who use below-average levels of water arepossible. More complex strategies might involve the use of MachineLearning methods to determine which farmers react the most to a nudge.
A third direction for further research is to try to improve the effectivenessof the message itself. One way to do this would be to tailor the referencegroup used to compute average consumption to make it closer to the profileof each farmer. The effectiveness of social comparison nudges depends onwhether farmers identify themselves with the reference group used in thenudge (Goldstein, Cialdini and Griskevicius, 2008). In our experiment, weendeavoured to use a ‘valid’ reference group by communicating the averageconsumption of farmers in the same department and watershed, i.e. ‘neigh-bour’ farmers. The use of the consumption in terms of percentage of quotawas also chosen in order to ensure comparable values among farmers withdifferent size farms. Ideally, providing more tailored reference groups forfarmers of the same type (for example, maize growers/soya growers) wouldlikely be more effective. However, water consumption by farmer type is cur-rently not available. Another approach would be to express social compari-sons in monetary terms instead of the percentage of the quota that has beenused.16
A fourth direction for further research would be to try to find ways to testfor strategic interactions with respect to water consumption. One interesting
16 We thank an anonymous referee for this suggestion.
Can we nudge farmers into saving water? 411
Dow
nloaded from https://academ
ic.oup.com/erae/article-abstract/46/3/393/5510773 by BR
GM
user on 05 Decem
ber 2019
possibility offered by smart meters and SMS technologies is the ability tomonitor each other’s consumption so that enforcing a cooperative equilibriummight become easier if punitive actions such as public sanctions can be used.A fifth direction for further research is to test how nudges interact with
other types of information, such as information on alternative irrigation tech-niques or weather forecasts, or with other policies, such as peak pricing.Some recent work indeed suggests that there are conditions under whichnudges and taxes should coexist (Farhi and Gabaix, 2017). As a case in point,it might be optimal for the CACG to implement a positive price for the firstunits of water consumption in order to decrease the magnitude of the boom-erang effect.If more evidence confirms that social comparison nudges can curb farmers’
water consumption, an important question nevertheless remains: how couldthis type of nudge be concretely implemented and how it could be incorpo-rated in the CAP? A first task would be to determine which institution wouldbe responsible for implementing such nudges. Authorities in charge of watermanagement at the local scale could be the appropriate institutional setting.In France, OUGCs could be the appropriate structures. These water user asso-ciations are indeed in charge of managing and distributing water quotasamong farmers over a given territory. Their relatively small size and the factthat all farmers belong to the same territory could make social comparisonnudges effective tools for agricultural water management at this scale.Similar institutions also exist in other European countries (i.e. Water UserAssociations in Spain, Greece and Italy). The reform of the CAP could theninclude actions targeted at promoting the use of nudges in agricultural wateruser associations. Since implementing nudges requires some technical expert-ise that may not be available in agricultural water user associations, somefinancial aid for a nudge training programme could be considered for thepost-2020 CAP.A second prerequisite for using this type of nudge is the metering of agri-
cultural water use. The social comparison nudge we developed and assessedin our experimental setting should then be viewed as a complement to watermetering. Water metering is already a policy tool included in the CAP. Moreprecisely, the new Rural Development Regulation for the 2014–2020 pro-gramming period contains particular safeguards with respect to support forinvestments in irrigation, specifically, linking it to water metering. In add-ition, the EU (2011) explicitly mentions smart metering in the portfolio ofwater efficiency measures to be included in the road map to a resource effi-cient Europe. Some mechanisms to subsidy investments in smart watermeters could then be included in the new CAP 2021–2028. This is in linewith the 1 June 2018 legislative proposals on the common agricultural policy(CAP) beyond 2020 presented by the European Commission. This proposalstresses the fact that the reform of the CAP should encourage increasedinvestment in innovation, which is essential for a smart, resilient and sustain-able agricultural sector. Smart water meters could be part of these innovativeinvestments.
412 S. Chabé-Ferret et al.
Dow
nloaded from https://academ
ic.oup.com/erae/article-abstract/46/3/393/5510773 by BR
GM
user on 05 Decem
ber 2019
Acknowledgements
The authors are grateful to the audiences at a number of seminars in theCenter for Environmental Economics of Montpellier, Toulouse School ofEconomics, and the 6th World Congress of Environmental and ResourceEconomists. This work is a part of the C4EAU project (‘Compteurs d’eauCommunicants et Changement de Comportement des irrigants pour une ges-tion durable des ressources en EAU’ R&S 2017 C4EAU DF-000008) fundedby the region Occitanie within the programme Recherche et Société(e)s –
2017. More information on this project in available at https://c4eau.wordpress.com/. This work has also received financial support from the French NationalResearch Agency (ANR) through the PENSEE (‘Payments for ENvironmentalServices: an Evidence-based Evaluation’) and the AMEP (‘AdvancingMethods for Evaluating Environmental/health Policy and wealth’) projects.
References
Allaire, G., Cahuzac, E. and Simioni, M. (2009). Contractualisation et diffusion spatialedes mesures agro-environnementales herbagères. Revue d’Etudes en Agriculture etEnvironnement 90: 23–50.
Allcott, H. (2011). Social norms and energy conservation. Journal of Public Economics95: 1082–1095.
Allcott, H. and Rogers, T. (2014). The short-run and long-run effects of behavioral inter-ventions: experimental evidence from energy conservation. American EconomicJournal 104: 3003–3037.
Ayres, I., Raseman, S. and Shih, A. (2013). Evidence from two large field experimentsthat peer comparison feedback can reduce residential energy usage. The Journal ofLaw, Economics, and Organization 29: 992–1022.
Baguley, T. (2009). Standardized or simple effect size: what should be reported?’. BritishJournal of Psychology 100: 603–617.
Baldwin, M. and Mussweiler, T. (2018). The culture of social comparison. Proceedings ofthe National Academy of Sciences of the United States of America 115: E9067–E9074.
Beedell, J. and Rehman, T. (1999). Explaining farmers’ conservation behaviour: why dofarmers behave the way they do?’. Journal of Environmental Management 57:165–176.
Behaghel, L., Macours, K. and Subervie, J. (2019). How can randomized controlled trialshelp improve the design of the common agricultural policy? European Review ofAgricultural Economics this issue.
Burton, R. J. (2004). Seeing through the ‘good farmer’s’ eyes: towards developing anunderstanding of the social symbolic value of ‘productivist’ behaviour. SociologiaRuralis 44: 195–215.
Byerly, H., Balmford, A., Ferraro, P. J., Wagner, C. H., Palchak, E., Polasky, S., Ricketts,T. H., Schwartz, A. J. and Fisher, B. (2018). Nudging pro-environmental behavior:evidence and opportunities. Frontiers in Ecology and the Environment, 16(3): 159–168.
Chabé-Ferret, B. (2016). Adherence to cultural norms and economic incentives: evidencefrom fertility timing decisions. IZA Working Paper No. 10269, IZA.
Can we nudge farmers into saving water? 413
Dow
nloaded from https://academ
ic.oup.com/erae/article-abstract/46/3/393/5510773 by BR
GM
user on 05 Decem
ber 2019
Charness, G., Gneezy, U. and Kuhn, M. A. (2013). Experimental methods: extra-laboratory experiments-extending the reach of experimental economics. Journal ofEconomic Behavior & Organization 91: 93–100.
Chen, X., Lupi, F., He, G. and Liu, J. (2009). Linking social norms to efficient conserva-tion investment in payments for ecosystem services. Proceedings of the NationalAcademy of Sciences of the United States of America 106: 11812–11817.
Cialdini, R. B., Demaine, L. J., Sagarin, B. J., Barrett, D. W., Rhoads, K. and Winter, P.L. (2006). Managing social norms for persuasive impact. Social Influence 1: 3–15.
Cialdini, R. B., Kallgren, C. A. and Reno, R. R. (1991). A focus theory of normative con-duct: a theoretical refinement and reevaluation of the role of norms in human behavior.Advances in Experimental Social Psychology, 24: 201–234.
Cialdini, R. B., Reno, R. R. and Kallgren, C. A. (1990). A focus theory of normative con-duct: recycling the concept of norms to reduce littering in public places. Journal ofPersonality and Social Psychology 58: 1015–1026.
Conley, T. and Udry, C. (2001). Social learning through networks: the adoption of newagricultural technologies in Ghana. American Journal of Agricultural Economics 83:668–673.
Costa, D. L. and Kahn, M. E. (2013). Energy conservation ‘nudges’ and environmentalistideology: evidence from a randomized residential electricity field experiment. Journalof the European Economic Association 11: 680–702.
Croson, R. and Treich, N. (2014). Behavioral environmental economics: promises andchallenges. Environmental and Resource Economics 58: 335–351.
Defrancesco, E., Gatto, P., Runge, F. and Trestini, S. (2008). Factors affecting farmers’participation in agri-environmental measures: a northern Italian perspective. Journal ofAgricultural Economics 59: 114–131.
Delmas, M. and Lessem, N. (2014). Saving power to conserve your reputation? Theeffectiveness of private versus public information. Journal of EnvironmentalEconomics and Management 67(3): 353–370.
Dessart, F., Barreiro-Hurle, J. and van Bavel, R. (2019). Behavioural factors affecting theadoption of sustainable farming practices: a policy-oriented review. European Reviewof Agricultural Economics, this issue.
Dolan, P. and Metcalfe, R. (2015). Neighbors, Knowledge, and Nuggets: Two NaturalField Experiments on the Role of Incentives on Energy Conservation. BeckerFriedman Institute for Research in Economics Working Paper No. 2589269.
EEA (2017). Indicator Assessment–Data and maps: use of freshwater resources.Copenhagen, Denmark: European Environment Agency.
EESC (2017). Opinion of the European Economic and Social Committee on ‘Towardsapplying Nudge Thinking to EU Policies’. Official Journal of the European Union,pp. 28–32.
EU (2011). Roadmap to a Resource Efficient Europe. European Commission, COM/2011/0571 final.
Farhi, E. and Gabaix, X. (2017). Optimal taxation with behavioral agents. NationalBureau of Economic Research Working Paper No. 21524.
Farrow, K., Grolleau, G. and Ibanez, L. (2017). Social norms and pro-environmentalbehavior: a review of the evidence. Ecological Economics 140: 1–13.
Ferraro, P., Messer, K. D. and Wu, S. (2017). Applying behavioral insights to improvewater security. Choices 32 (4): 1–6
Ferraro, P. J., Miranda, J. J. and Price, M. K. (2011). The persistence of treatment effectswith norm-based policy instruments: evidence from a randomized environmental pol-icy experiment. The American Economic Review 101: 318–322.
414 S. Chabé-Ferret et al.
Dow
nloaded from https://academ
ic.oup.com/erae/article-abstract/46/3/393/5510773 by BR
GM
user on 05 Decem
ber 2019
Ferraro, P. J. and Price, M. K. (2013). Using nonpecuniary strategies to influence behav-ior: evidence from a large-scale field experiment. The Review of Economics andStatistics 95: 64–73.
Fielding, K. S., Terry, D. J., Masser, B. M., Bordia, P. and Hogg, M. A. (2005).Explaining landholders’ decisions about riparian zone management: the role of behav-ioural, normative, and control beliefs. Journal of Environmental Management 77:12–21.
Goldstein, N. J., Cialdini, R. B. and Griskevicius, V. (2008). A room with a viewpoint:using social norms to motivate environmental conservation in hotels. Journal ofConsumer Research 35: 472–482.
Hardin, G. (1968). The tragedy of the commons. Science (New York, N.Y.) 162:1243–1248.
Kuhfuss, L., Préget, R., Thoyer, S., Hanley, N., Coent, P. L. and Désolé, M. (2016).Nudges, social norms, and permanence in agri-environmental schemes. LandEconomics 92: 641–655.
Le Coent, P., Chabé-Ferret, S. and Reynaud, A. (2017). Effect of social information onfarmers’ irrigation decisions. AEA RCT Registry.
Le Coent, P., Préget, R. and Thoyer, S. (2018). Do farmers follow the herd? The influenceof social norms in the participation to agri-environmental schemes. CEEM WorkingPaper 2018-02.
Messer, K. D., Ferraro, P. D. and William, A. (2015). Behavioral nudges in competitiveenvironments: a field experiment examining defaults and social comparisons in a con-servation contract auction. Paper presented at the Agricultural & Applied EconomicsAssociation (AAEA) Annual Meeting, San Franciso, CA, 26–28 July.
Nolan, J. M., Schultz, P. W., Cialdini, R. B., Goldstein, N. J. and Griskevicius, V. (2008).Normative social influence is underdetected. Personality and Social PsychologyBulletin 34: 913–923.
Ostrom, E. (1992). Crafting Institutions for Self-governing Irrigation Systems. A publica-tion of the International Center for Self-governance, ICS Press, San Francisco, 111 p.
Peth, D., Musshoff, O., Funke, K. and Hirschauer, N. (2018). Nudging farmers to complywith water protection rules: experimental evidence from Germany. EcologicalEconomics 152: 310–321.
Schubert, C. (2017). Green nudges: do they work? Are they ethical? EcologicalEconomics 132: 329–342.
Schultz, P. W. (1999). Changing behavior with normative feedback interventions: a fieldexperiment on curbside recycling. Basic and Applied Social Psychology 21: 25–36.
Schultz, P. W., Nolan, J. M., Cialdini, R. B., Goldstein, N. J. and Griskevicius, V. (2007).The constructive, destructive, and reconstructive power of social norms. PsychologicalScience 18: 429.
Schwartz, D., Fischhoff, B., Krishnamurti, T. and Sowell, F. (2013). The Hawthorneeffect and energy awareness. Proceedings of the National Academy of Sciences of theUnited States of America 110: 15242–15246.
Sherif, M. (1935). A Study of Some Social Factors in Perception. Archives of Psychology.New York City: Columbia University, 187. 60p.
Sunstein, C. R. (1996). Social norms and social roles. Columbia Law Review 96: 903.Thøgersen, J. (2014). The mediated influences of perceived norms on pro-environmental
behavior. Revue D Economie Politique 124: 179–193.Wallander, S., Ferraro, P. and Higgins, N. (2017). Addressing participant inattention in
federal programs: a field experiment with the conservation reserve program. AmericanJournal of Agricultural Economics 99: 914–931.
Can we nudge farmers into saving water? 415
Dow
nloaded from https://academ
ic.oup.com/erae/article-abstract/46/3/393/5510773 by BR
GM
user on 05 Decem
ber 2019
Willy, D. K. and Holm-Müller, K. (2013). Social influence and collective action effectson farm level soil conservation effort in rural Kenya. Ecological Economics 90:94–103.
A. Appendix
A.1. Robustness checksIn order to take into account meter replacement during Experiment 1, we
use different strategies. In model (1) we exclude from the data-set farmerswho had their meters changed less than 2 weeks before the end of the experi-ment. In model (2), we exclude all farmers who had their meters changedbetween 1 July 2017 and 1 December 2017. We indeed consider that metersreplaced after the end of experiment may have biased the results during theexperiment. We, however, consider that replacement that occurred after 1December 2017 are due to problems that happened after the experiment andtherefore did not affect our results. In model (3), the most restrictive, weexclude all farmers with meters changed between 1 July 2017 and 15 March2018.
Table A1. Impact of nudges on probability to use no water in Experiment 1 with differ-ent models taking into account meter replacement
(1) (2) (3)
Nudge −0.115** −0.091* −0.139**(0.053) (0.053) (0.058)
Cons. 1*** 1*** 1***(0.325) (0.330) (0.314)
F 12.10 14.33 11.95N 148 137 123
Note: These OLS regressions include strata fixed effects.
416 S. Chabé-Ferret et al.
Dow
nloaded from https://academ
ic.oup.com/erae/article-abstract/46/3/393/5510773 by BR
GM
user on 05 Decem
ber 2019