can you trust your data? software measurement … · · 2013-08-12failing to account for ranges...
TRANSCRIPT

This material is approved for public release. Distribution is limited by the Software Engineering Institute to attendees.
Sponsored by the U.S. Department of Defense© 2006 by Carnegie Mellon University
page 1
Pittsburgh, PA 15213-3890
Can You Trust Your Data? Software Measurement Infrastructure Diagnosis

© 2006 by Carnegie Mellon University page 2
OutlineThe Need for Diagnosing the Measurement Infrastructure• Measurement errors and their impact
Elements of a Diagnostic• Process Diagnosis: Using CMMI as a reference model
• Data Quality Diagnosis:- Integrity Checks- Quantifying Measurement Error
• Customer Satisfaction
Notional Activities and Schedule for a Diagnostic Event
© 2006 by Carnegie Mellon University page 3
Possible Measurement ErrorsThe measure represents a performance “grade”.
– Team invents a process to make the grade.Different people/groups have different definitions.
– Defect severity or type, LOC definitionFailing to account for ranges of skill in estimating.
– Assumed highest skill is available.Missing data is reported as “0”. Effort data collection is owned by Accounting.
– Overtime is not tracked.– Effort is tracked only to highest level of WBS.
Measurement system skips problem areas.– “Unhappy” customers are not surveyed

© 2006 by Carnegie Mellon University page 4
Impacts of Poor Data QualityProducts that fail to live up to customer expectations
Products that are painful and costly to use within real-life usage profiles
Improper architecture and design decisions driving up the lifecycle cost and reducing the useful life of the product
Inability to manage the quality and performance of the actual software during development
Ineffective and inefficient testing causing issues with time to market, field quality and development costs
Loss of Customer Satisfaction, Loyalty and Market Share due to unresponsiveness to field issues

© 2006 by Carnegie Mellon University page 5
Why a Measurement DiagnosticQuality of data is important
• Basis for decision making and action
• Erroneous data can be dangerous or harmful
Cannot go back and correct data once it is collected –opportunity/information lost
Measurement practices should be piloted and then evaluated periodically• But what are the criteria?

© 2006 by Carnegie Mellon University page 6
Measurement Infrastructure Elements to be EvaluatedData
Data definitions (meta-data)
Data collection procedures and instruments (including training on their use)
Reports, Analyses, Charts
Evaluations and Feedback on Measurement Activities and Products

© 2006 by Carnegie Mellon University page 7
Criteria for Measurement Infrastructure- 1Data• Data integrity• Amount of missing data• Variance of collected data
- Accuracy- Precision
Data Definitions• Availability and accuracy of definitions• Common language among practitioners
Data collection• Reliability of instrumentation (manual/automated)• Reliability of data collection (actual behavior of collectors)• Training in data collection methods (y/n)• Ease/cost of collecting data• Storage (raw vs summarized/processed)

© 2006 by Carnegie Mellon University page 8
Criteria for Measurement Infrastructure- 2
Data analysis• Data used for analysis vs. data collected but not used• Appropriateness of analytical techniques used• Inventory of analyses performed
Reporting• Types of reports produced• Coverage of audiences addressed• Timing of reports produced
Stakeholder Satisfaction• Survey of stakeholders regarding the costs and benefits
realized in relation to the measurement system

© 2006 by Carnegie Mellon University page 9
Methods of a Measurement Infrastructure Diagnostic (MID)Process Diagnostic• Focus on measurement process in CMMI context
Data Quality• Assessment of Integrity
- Characterization of distribution- Missing data- Accuracy
• Assessment of measurement reliability- Repeatability & Reproducibility
Stakeholder Satisfaction• Right info in the right format at the right time for
decision makers• Ease on data producers

© 2006 by Carnegie Mellon University page 10
1: Measurement Process Diagnosis
CMMI Measurement and Analysis-Related Practices as a Reference Model
Presence of Expected Artifacts (Indicator Template)• Data definitions, collection instruments and procedures• Measurement goals and analysis guidance• Improvement planning for measurement system
Infrastructure for measurement support• People and skills for development of measures• Data repositories• Processes for timely reporting

© 2006 by Carnegie Mellon University page 11
ObjectiveQuestionsVisual Display
Input(s)Data Elements
Responsibility for Reporting
Form(s)
DefinitionsData Collection
HowWhen/How OftenBy Whom
Data Reporting
By/To Whom
Indicator Name/Title
How Often
Date
80
204060
100
Perspective
Communicate Results
CollectData
SpecifyData
CollectionProcedures
EstablishMeasurement
Objectives
SpecifyMeasures
CommunicateResults
X-reference
Interpretation
Evolution
Assumptions
Probing Questions
Algorithm
Analysis
Feedback Guidelines
Data StorageWhereHowSecurity
Analyze Data
SpecifyAnalysis
Procedures
Store Data & Results
CMMI Measurement Practices Mapped to Indicator Template

© 2006 by Carnegie Mellon University page 12
Measurement Goals and Objectives
Project Planning• Estimates and the data and analyses upon which they
are based
Project Monitoring and Control• Effort, schedule, size, and defect tracking• Requirements and change management reports• Quality assurance reports
Process Management• Process performance characterizations (e.g.,
histograms, distribution parameters and confidence intervals, SPC charts)

© 2006 by Carnegie Mellon University page 13
2: Quality Assessment of Data and Data Collection
Data Integrity
Measurement System Evaluation• Accuracy• Precision

© 2006 by Carnegie Mellon University page 14
Data Integrity: Checklist for Screening Data1. Inspect univariate descriptive statistics for accuracy of input• Out of range values• Plausible means and dispersions• Coefficient of variation
2. Evaluate number and distribution of missing data3. Identify and address outliers• Univariate• Multivariate
4. Identify and address skewness in distributions• Locate skewed variables• Transform them• Check results of transformation
5. Identify and deal with nonlinearity and heteroscedasticity6. Evaluate variable for multicollinearity and singularity
Tabachnick and Fidel, 1983

© 2006 by Carnegie Mellon University page 15
Data Integrity Tools & MethodsHistograms or frequency tables• Identify valid and invalid values• Identify proportion of missing data• Nonnormal distributions• Checking sums
Run charts• Identify time oriented patterns
Crosstabulations and Scatterplots• Unusual/unexpected relationships between two variables
Apply the above to particular segments (e.g., projects, products, business units, time periods, etc…)
© 2006 by Carnegie Mellon University page 16
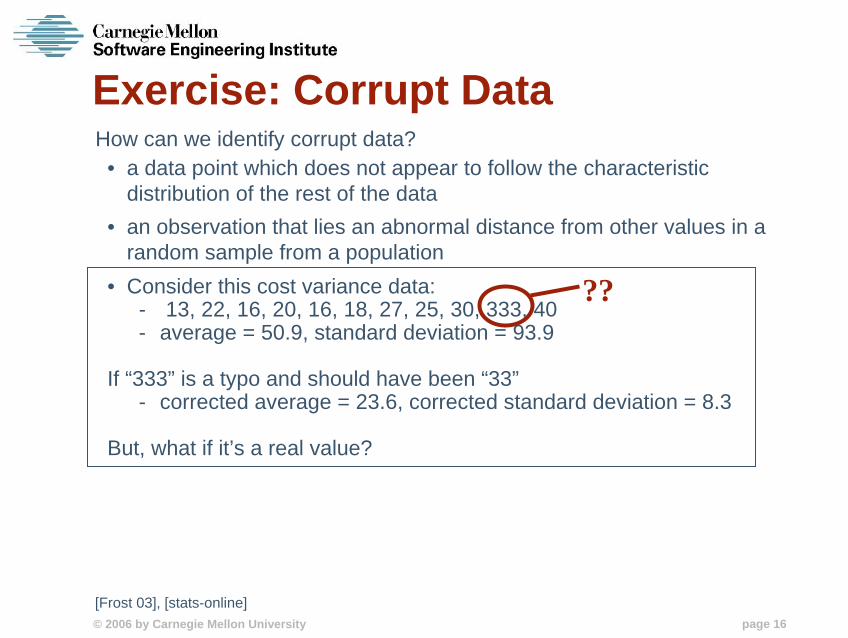
Exercise: Corrupt DataHow can we identify corrupt data?
• a data point which does not appear to follow the characteristic distribution of the rest of the data
• an observation that lies an abnormal distance from other values in a random sample from a population
• Consider this cost variance data: - 13, 22, 16, 20, 16, 18, 27, 25, 30, 333, 40- average = 50.9, standard deviation = 93.9
If “333” is a typo and should have been “33”- corrected average = 23.6, corrected standard deviation = 8.3
But, what if it’s a real value?
??
[Frost 03], [stats-online]

© 2006 by Carnegie Mellon University page 17
Measurement System Evaluation
What is Measurement System Evaluation (MSE)?
• A formal statistical approach to characterizing the
accuracy and precision of the measurement system
What can MSE tell you?
• The accuracy of the measures
• The magnitude of variation in the process due to the
measurement system vs true process variation

© 2006 by Carnegie Mellon University page 18
Sources of Variation
Measurement System
Variability
Process Variability
Total Variability
M1M2 M3
= +
σ2Total σ2
Process σ2MS
Process variability = true process variationMeasurement system variability = measurement error

© 2006 by Carnegie Mellon University page 19
Accuracy (Bias)Accuracy: The closeness of (average) reading to the correct value or accepted reference standard.
Compare the average of repeated measurements to a known reference standard (may use fault seeding for inspections and test processes).
Statistical tool: one-to-standardHo: μ = known valueHa: μ known value≠
Accurate Not accurate

© 2006 by Carnegie Mellon University page 20
PrecisionSpread refers to the standard deviation of a distribution. The standard deviation of the measurement system distribution is called the precision, σMS.
Precision is made up of two sources of variation or components: repeatability and one called reproducibility.
Precision σ2 MS = +Reproducibility
σ2 rpdRepeatability
σ2 rpt
σ2Measurement System = σ2
RPD + σ2RPT
% 100xGRRTotal
MS
σσ
=

© 2006 by Carnegie Mellon University page 21
RepeatabilityRepeatability is the inherent variability of the measurement system.
Measured by σRPT, the standard deviation of the distribution of repeated measurements.
The variation that results when repeated measurements are made under identical conditions:• same inspector, analyst• same set up and measurement procedure• same software or document or dataset• same environmental conditions• during a short interval of time

© 2006 by Carnegie Mellon University page 22
ReproducibilityReproducibility is the variation that results when different conditions are used to make the measurement:• different software inspectors or analysts• different set up procedures, checklists at different sites• different software modules or documents• different environmental conditions;
Measured during a longer period of time.
Measured by σRPD.

© 2006 by Carnegie Mellon University page 23
How Much Variation is Tolerable?
If the percentage variation (GRR) is…
Then measurement error is…
<10% acceptable
between 10% and 30%unacceptable for “critical”
measurements(You should improve the measurement process.)
>30% unacceptable.

© 2006 by Carnegie Mellon University page 24
An Approach to a Simple MSE• Have 10 objects to measure (projects to forecast, modules of
code to inspect, tests to run, etc…; variables data involved!).
• Have 3 appraisers (different forecasters, inspectors, testers, etc…).
• Have each person repeat the measurement at least 2 times for each object.
• Measurements should be made independently and in random order.
• Calculate the MSE metrics to determine acceptability of the measurement system.

© 2006 by Carnegie Mellon University page 25
Gold Standard: Accuracy and Precision
Accuratebut not precise
Precisebut not accurate
Both accurateand precise
( σ ) ( μ )

© 2006 by Carnegie Mellon University page 26
3: Stakeholder Satisfaction
Who are the Stakeholders? – Managers, engineers, process improvement practitioners, external customers, quality auditors, etc….
Survey
Interviews
Focus Groups
Methods and ToolsDo they get what they need?
Is it timely?
Is it understandable?
Are there better alternatives?
Topics

© 2006 by Carnegie Mellon University page 27
MID Process Findings and Corrective ActionsMissing or Inadequate• Processes and procedures• Measurement definition and indicator specification
Incomplete stakeholder participation
Failure to address important measurement goals
Develop needed processes procedures and definitions
Involve additional stakeholders
Address additional measurement goals

© 2006 by Carnegie Mellon University page 28
MID Data Quality Findings and Corrective ActionsFrequently encountered problems include the following:• wrong data• missing data
Map the data collection process.• Know the assumptions associated with the data.
Look at indicators as well as raw measures.• Ratios of bad data still equal bad data!
Data systems you should focus on include:• manually collected or transferred data • categorical data• startup of automated systems
• skewed or biased data• outliers

© 2006 by Carnegie Mellon University page 29
MID Stakeholder Findings and Corrective ActionsInformation not used
Data too hard to collect
Mistrust of how data will be used
Check content, format, and timing of indicators and reports
Automate and simplify data collection• Tools and templates• Training
Visible and appropriate use of data

© 2006 by Carnegie Mellon University page 30
Notional Activities and Schedule
Approximately 6 to 10 weeks duration
© 2006 by Carnegie Mellon University page 31
SummaryLike production processes, measurement processes contain multiple sources of variation:
• Not all variation due to process performance• Some variation due to choice of measurement
procedures and instrumentation
Measurement Infrastructure Diagnostic:• Characterizes performance of measurement system• Identifies improvement opportunities:
- In measurement processes- Data quality- Based on stakeholder feedback

© 2006 by Carnegie Mellon University page 32
Questions?