canadian fuels association - annual review 2011
TRANSCRIPT

FuelsFOR
A Discussion on Canada’sTransportation energy Choices
March 2012
lIFe


FUELS FOR LIFE — A Discussion on Canada’s Transportation Energy Choices i
About CPPI
CPPI is an association of major companies involved in the refining, distribution and marketing of transportation fuels and other petroleum products in Canada.
The sector operates through an infrastructure with close to 100,000 employees. The industry’s infrastructure in Canada includes 19 refineries in eight provinces, a complex network of 21 primary fuel distribution terminals, 50 regional terminals and 12,000 retail service stations.
Acknowledgements
Richard Laszlo, an Energy and Sustainability professional, contributed substantial content to the document. Richard has previously worked as an Energy Program Manager at Pollution Probe and a Senior Policy Advisor, Green Energy at Ontario’s Ministry of the Environment. He is currently Director of Research and Education at QUEST Canada.
CPPI would also like to acknowledge the following readers who kindly agreed to review this document for errors or omissions, and accuracy of the factual information presented, and its proper sourcing. The readers also provided valuable insights and suggestions to make the paper a balanced and solid resource.
Not all the readers’ comments have been included in the final document and CPPI assumes full responsibility for its contents.
Michael J. Ervin, Principal of MJ Ervin & Associates, a division of The Kent Group
Barry Bower, Energy consultant, Barry Bower Consulting
Mike Cleland, Consultant and Nexen Executive-in-Residence at the Canada West Foundation

FUELS FOR LIFE — A Discussion on Canada’s Transportation Energy Choicesii
Dear Reader:
The Canadian Petroleum Products Institute has published this document in the interests of an informed dialogue on Canada’s future transportation fuel choices. Transportation is a vital component of our economy. The mobility of people and goods underpins our quality of life. As a country and as individuals, we face important choices as we strive to ensure the security, convenience, quality and affordability of our transportation fuel supply, while at the same time significantly reducing environmental impacts.
Much of the decision-making around these choices in the next few years will fall on the shoulders of those who shape and develop transportation, energy and environmental public policy. This document is primarily intended for public policy-makers. However, all who have an interest in the future of transportation fuels may find it informative.
Sound policy-making demands a thorough understanding of all the options and their implications, including unintended consequences. Can alternative fuels meet consumer expectations for availability, safety, reliability and performance? Can they be supplied in the timeframe needed, in the volumes needed and at reasonable cost? What is their true environmental footprint? Are alternatives suitably sustainable to be used broadly as a full replacement for fossil fuels or as “drop in” fuels to petroleum products? These issues are the focus of this document.
Fuels for Life is not about championing gasoline and diesel to the exclusion of all other transportation fuels — Canada’s petroleum fuel providers acknowledge that the future transportation fuel mix will be much more diverse than it is today. Indeed, they are already among the largest liquid biofuel producers and distributors in the country. This paper is about stimulating and facilitating the rigorous due diligence that Canadians expect and deserve from their policy-makers.
Given the complexity of the issues involved, we have taken the liberty to include a suggested checklist for policy-makers when they are making important choices about Canada’s transportation fuel future.
Enjoy your reading. I am confident that you will find the resource material provided here informative, maybe even surprising. I welcome your constructive feedback.
Peter BoagPresident

FUELS FOR LIFE — A Discussion on Canada’s Transportation Energy Choices 1
Table OF COnTenTs
EXECUTIVE SUMMARY ..............................................................................................................................3
INTRODUCTION ........................................................................................................................................12
1 CANADA’S TRANSPORTATION ENERgY SYSTEM: WhERE WE ARE TODAY AND hOW WE gOT hERE ......................................................................14
1.1 Transportation energy demand ...............................................................................................161.2 Markets have determined the best energy sources to meet transportation demands ...........171.3 A growing focus on alternatives to petroleum-based fuels ......................................................19
2 ASSESSINg ThE AlTERNATIVES ....................................................................................................202.1 Understanding the environmental issues ................................................................................202.2 Understanding the commercial/consumer issues ...................................................................232.3 Petroleum fuels (gasoline and diesel) ....................................................................................242.4 Liquid biofuels (ethanol, biodiesel and HDRD) .......................................................................302.5 Natural gas ..............................................................................................................................372.6 Electricity .................................................................................................................................40
3 COMPARINg ThE AlTERNATIVES ...................................................................................................45
4 CONClUSION — IMPlICATIONS FOR POlICY-MAkERS ..............................................................514.1 A suggested checklist for policy-makers .................................................................................524.2 A final word .............................................................................................................................54
APPENDIX .................................................................................................................................................55
Table OF FIGuResFigure 1: Energy density comparison of alternative fuels compared to gasoline ......................................4
Figure 2: GHG reductions from electric vehicles .......................................................................................5
Figure 3: Light Duty Vehicles (LDV) life-cycle GHG emissions for various transportation fuels ................6
Figure 4: Heavy Duty Vehicles (HDV) life-cycle GHG emissions for various transportation fuels .............7
Figure 5: GHG abatement potential and incremental purchase price comparison (per cent, euros) ........7
Figure 6: LDV life-cycle air pollutant emission changes for various transportation fuels compared to gasoline baseline ..................................................................................................8
Figure 7: HDV life-cycle air pollutant emission changes for various transportation fuels compared to petroleum diesel baseline .....................................................................................8
Figure 8: Qualitative Comparison of commercial/consumer issues relative to gasoline/diesel .................9
Figure 9: Energy use in economic sectors, Natural Resources Canada, 2009 .......................................14

FUELS FOR LIFE — A Discussion on Canada’s Transportation Energy Choices2
Figure 10: Energy use by transportation mode, Natural Resources Canada, 2009 ..................................15
Figure 11: Ground transportation fuels used in Canada ...........................................................................15
Figure 12: Ground transportation fuels used in Canada ...........................................................................16
Figure 13: Energy density comparison of alternative fuels compared to gasoline ....................................17
Figure 14: Canada’s greenhouse gas emissions by category ...................................................................22
Figure 15: Canadian ground transportation and other sources of air pollution .........................................22
Figure 16: Well-to-wheels CO2 emissions from various sources of crude ................................................25
Figure 17: Fuel efficiency and emissions of gasoline-powered vehicles ...................................................25
Figure 18a: On-road vehicle emission inventories, NOx emissions, 1985–2030, Environment Canada ......... 27
Figure 18b: On-road vehicle emission inventories,SOx emissions, 1985–2030, Environment Canada .......... 27
Figure 18c: On-road vehicle emission inventories, total PM2.5, 1985–2030, Environment Canada ................ 28
Figure 19: Comparison of pump prices in eight countries, January 2012 .................................................29
Figure 20: Range of estimated GHG savings from selected liquid biofuel pathways ...............................32
Figure 21: Biodiesel vs. regular diesel, 2009–2011 (CANADA) ................................................................35
Figure 22: Ethanol vs. regular unleaded gasoline, 2009–2011 (U.S.) .......................................................35
Figure 23: Energy content comparisons (U.S. Department of Energy) .....................................................36
Figure 24: Ratio of low-sulphur light crude oil price to Henry Hub natural gas price on an energy equivalent basis, 2009–2035 .............................................................................38
Figure 25: GHG reductions from electric vehicles .....................................................................................41
Figure 26: Charging times for Battery Electric Vehicles (BEVs) and plug in hybrid electric vehicles (PHEVs) .........................................................................................................43
Figure 27: Energy density comparison by weight and volume of alternative fuels compared to gasoline ...............................................................................................................45
Figure 28: LDV life-cycle GHG emissions for various transportation fuels ...............................................46
Figure 29: HDV life-cycle GHG emissions for various transportation fuels ...............................................46
Figure 30: LDV life-cycle air pollutant emissions for various transportation fuels .....................................47
Figure 31: HDV life-cycle air pollutant emissions for various transportation fuels .....................................48
Figure 32: Incremental 2035 retail price comparison of future propulsion technologies ($U.S. 2007) ......48
Figure 33: Incremental 2035 retail price comparison of future propulsion technologies ($U.S. 2007) ......49
Figure 34: GHG abatement potential and incremental purchase price comparison ..................................49
Figure 35: Qualitative comparison of commercial/consumer issues relative to gasoline/diesel ................50

FUELS FOR LIFE — A Discussion on Canada’s Transportation Energy Choices 3
eXeCuTIVe suMMaRY
The future strength of Canada’s economy depends on a reliable supply of quality transportation fuels available to Canadians at competitive prices, without causing irreparable harm to the environment. Sound policy-making requires a thorough under-standing of the options for Canada’s transportation system, including unintended consequences.
This paper assesses petroleum fuels, biofuels, natural gas and electricity from two perspectives:
• Environmental performance: Greenhouse gas (GHG) and conventional air pollutant (CAP) emissions
• Commercial/consumer issues: Availability, cost, performance and vehicle fleet/technology/ infrastructure issues
Petroleum fuels (gasoline and diesel)
Gasoline and diesel are widely available across Canada, run smoothly in all conditions, and are energy dense, making them ideal for mobile use. As Figure 1 (overleaf) shows, gasoline and diesel have the highest energy densities by volume, while batteries have the lowest energy density. Gasoline and diesel are among the most affordable fuels on the market.
Fuel formulations have evolved over the years, delivering improvements in vehicle and environmental performance, significantly reducing vehicle emissions of conventional air pollutants. Vehicle emissions of smog and acid rain related emissions have been reduced by more than 90 per cent in the past 10 years. Continuing
Overview
Petroleum fuels currently supply 95 per cent of Canada’s transportation needs; on a daily basis, Canadians pump about 200 million litres of petroleum-based fuels into their cars and trucks, or enough to fill 80 Olympic-sized swimming pools. Supplying and delivering the volumes of fuels demanded by Canadian consumers and businesses at an affordable price is a challenging task. The petroleum industry has invested billions of dollars to develop a reliable and efficient fuel production and delivery network.
In recent years, there has been a growing focus on alternative transportation fuels, principally advanced as a means to reduce environmental impacts associated with petroleum fuel use. Three alternative transportation fuels receive most of the attention today:
• Biofuels, including ethanol, biodiesel and renewable diesel. Ethanol is primarily produced from corn and wheat, while biodiesel and renewable diesel are produced from a variety of animal and vegetable fats.
• Natural gas, is used in compressed form (CNG) in several niche applications and can also be used in a liquefied form (LNG).
• Electricity, generated from a variety of energy sources. Electricity can power hybrid electric vehicles (HEVs), such as the Toyota Prius, second generation plug-in hybrids (PHEVs) like the Chevy Volt and battery electric vehicles (BEVs) such as the Nissan Leaf.
Mobility is vital to the economy and Canadians’ high standard of living. It underpins virtuallyeverythingwedo.Asecureandreliablesupplyofaffordable,fit-for-purpose fuels to enable our mobility is equally vital — transportation fuels account for nearly 30 per cent of Canada’s total energy consumption. It is important that we make informed decisions about our transportation energy future. Rigorous due diligence and a thorough understanding of fuel options and their implications are necessary to achieve a reliable, affordable and environmentally sustainable transportation system. The purpose of this paper is to promote an informed dialogue on Canada’s transportation energy future.

FUELS FOR LIFE — A Discussion on Canada’s Transportation Energy Choices4
properties that pose costly seasonal operational challenges in Canada.
Natural gas
Natural gas can be used as a vehicle fuel in both passenger cars and heavy trucks. On a full life-cycle analysis, natural gas offers a reduction in GHG emissions of 20 to 30 per cent compared to gasoline and diesel. Life-cycle emissions of conventional air pollutants from natural gas are also lower than those of either gasoline or diesel.
Natural gas is in abundant supply in North America, and on an energy equivalent basis costs less than gasoline and diesel.
CNG has about one quarter of the energy content of gasoline on a volume-equivalent basis, limiting the driving range. Although LNG has a higher energy density, it is a more expensive alternative due to the cost of the cryogenic system enabling its liquefaction.
There are currently only 12,000 natural gas powered vehicles in Canada. Refuelling infrastructure is limited to a few public CNG refuelling sites in major cities and a smaller number of private sites. The upfront capital cost premium
innovation is expected to drive further improvements in fuels and vehicles well into the future, including significant reductions in GHG and conventional air pollutant (CAP) emissions.
Biofuels
Biofuels are blended with petroleum-based fuels — ethanol with gasoline, and biodiesel with petroleum diesel. Vehicle technology generally limits ethanol-gasoline blends to no more than 10 per cent ethanol (E10), and biodiesel-petroleum diesel blends to no more than five per cent biodiesel (B5).
While calculating the life-cycle GHG emissions of biofuels is complex and requires consideration of a wide range of processes and practices including the impacts of land use change, biofuels, particularly those produced from non-food biomass sources, offer significant potential to reduce life-cycle GHG emissions. Biofuel production and use results in conventional air pollutant emissions comparable to those associated with the production and use of gasoline and diesel.
Biofuels can’t replace gasoline and diesel because of scalability, resource and technical impediments. Lower energy density is a significant performance issue for ethanol. Biodiesel has poor low temperature
FIgURE 1: ENERgY DENSITY COMPARISON OF AlTERNATIVE FUElS COMPARED TO gASOlINE
Fuel Energy density by volume Energy density by weightkWh/litre vs. gasoline % kWh/kg vs.gasoline %
Gasoline 9.7 100.00 13.20 100.00Diesel 10.7 110.00 12.70 96.00Ethanol 6.4 66.00 7.90 60.00Biodiesel 9.6 100.00 10.50 80.00CNG 2.5 25.00 13.50 103.00LNG 7.0 70.00 15.00 115.00NiMH Battery 0.1–1.3 2.10 0.10 0.80Lithium-ion battery (present) 0.2 2.10 0.14 1.10Lithium-ion battery (future) 0.28 2.10Source: American Physical Society and U.S. Department of Energy.

FUELS FOR LIFE — A Discussion on Canada’s Transportation Energy Choices 5
Electricity is widely available in Canada, but our electricity system will require significant new infrastructure investment to meet projected demand. Demand growth for electricity as a transportation fuel will likely increase this investment requirement. Electricity is cheaper than gasoline, especially given its favourable tax treatment.
The limited range on a full battery charge and the time it takes to recharge the battery are significant performance challenges for electric powered vehicles. The range of most electric vehicles is less than 160 kilometres, and decreases over time with cycling (charging and discharging). Range is also reduced in cold weather conditions. Current technologies require a charging time considerably longer than the time needed to refuel an internal combustion engine vehicle. Few public charging stations currently exist, and charging infrastructure will take time and funding to develop and deploy. A typical home charging station currently costs about $2,000.
for NG vehicles and refuelling infrastructure is a significant challenge to increased use of natural gas as a transportation fuel, particularly for personal vehicles.
Electricity
Electric vehicles include hybrids (HEV) like the Toyota Prius, “plug-in” hybrids (PHEV) like the Chevy Volt, and battery electric vehicles (BEV) like the Nissan Leaf. Vehicles powered by electricity are unique in that they have no tailpipe emission of GHGs or smog-forming conventional air pollutants. All emissions result from electricity generation, which vary by province depending on the energy sources (e.g. hydro, nuclear, coal) used to produce the electricity. The chart below indicates the reduction in GHG emissions that can be achieved by vehicles powered by electricity compared to an equivalent gasoline powered vehicle. Vehicles powered by electricity generated by coal produce higher GHG emissions than a gasoline powered vehicle.
-90
-80
-70
-60
-50
-40
-30
-20
-10
0
10
EV Can
ada*
EV B.C
./Yuk
on
EV Alberta
EV Sas
katch
ewan
EV Man
itoba
EV Onta
rio
EV Que
bec
EV Atlanti
c reg
ion
PHEV – 50
/50 C
anad
a*
Diesel
hybri
d
Gasoli
ne hy
brid
% change in gm/km life-cycle GHG emissions from gasoline baseline
Source: GHGenius 3.19 a.
*Canada average generation mix.
FIgURE 2: ghg REDUCTIONS FROM ElECTRIC VEhIClES

FUELS FOR LIFE — A Discussion on Canada’s Transportation Energy Choices6
ghg emissions performance
Alternatives to gasoline and diesel can offer improved GHG emissions performance. However, the primary energy source and the specific fuel production processes can cause significant variations in GHG emissions performance, to the point that some alternatives (e.g. electricity generated from coal, some biofuels) emit more GHGs than either gasoline or diesel. Comparisons of GHG emissions for various fuels used in light and heavy duty vehicles are shown below.
According to the International Energy Agency (IEA), when it comes to cost-effectiveness of GHG emissions abatement alternatives, making efficiency improvements to the internal combustion engine is the most cost-effective opportunity for reducing emissions in the transportation sector. An analysis by McKinsey & Company arrived at the same conclusions as shown in Figure 5.
Vehicle price (more than double that of a comparable gasoline powered vehicle) is a significant barrier to consumer acceptance of electric vehicles. Independent analysts cite the cost of ownership, range anxiety, recharge times, lack of support infrastructure, power and performance, limited battery life and battery replacement costs as major consumer acceptance challenges to significant market penetration of electric vehicles.
Comparing the alternatives
When fuel alternatives are compared side by side, two key observations emerge. One, all fuel alternatives create environmental impacts — there is no perfectly “clean” fuel. Clean energy is a relative, not an absolute term. Two, alternatives to petroleum fuels have characteristics that make them more or less suitable for use as a transportation fuel, and there is no single metric by which they can be assessed.
-70
-60
-50
-40
-30
-20
-10
0
BEVCanada*
PHEV50/50
Canada*
Dieselhybrid
Gasolinehybrid
Naturalgas
B5DieselE10
Source: GHGenius 3.19 a.
*Canada average generation mix.
% reduction in gm/km life-cycle GHG emissions from gasoline baseline
FIgURE 3: lIghT DUTY VEhIClES (lDV) lIFE-CYClE ghg EMISSIONS FOR VARIOUS TRANSPORTATION FUElS

FUELS FOR LIFE — A Discussion on Canada’s Transportation Energy Choices 7
Conventional air pollutants emissions performance
Alternatives to gasoline and diesel, with the exception of biofuels, also offer lower life-cycle emissions of conventional air pollutants that contribute to smog formation and acid rain. While specific changes vary by pollutant and alternative fuel, and while the percentage decreases can appear high, since vehicle emissions are already very low, the absolute reductions achieved by alternative fuels are actually quite small. For light duty vehicles, switching from gasoline to diesel power achieves reductions near comparable to those achieved by switching to natural gas and electricity. Gasoline and diesel hybrids are among the top light duty performers. For heavy duty vehicles, natural gas is the top emissions performer.
-35
-30
-25
-20
-15
-10
-5
0
Diesel hybridNatural gasB5Source: GHGenius 3.19 a.
% reduction in gm/km life-cycle GHG emissions from diesel baseline
FIgURE 4: hEAVY DUTY VEhIClES (hDV) lIFE-CYClE ghg EMISSIONS FOR VARIOUS TRANSPORTATION FUElS
Vehicle Abatement potential
Incremental purchase price
over base vehicle
Gasoline — base vehicle n.a. n.a.Gasoline — maximum ICE* improvement
39 1,600
Gasoline — full hybrid 44 1,800Gasoline — plug-in hybrid 38–62 3,500Diesel — base vehicle n.a. n.a.Diesel — maximum improvement
35 900
Diesel — full hybrid 46 1,800Diesel — plug-in hybrid 38–63 2,800Compressed natural gas 66 1,900Electric vehicles 22–97 5,800Source: McKinsey and Company.
*ICE=Internal combustion engine.
FIgURE 5: ghg ABATEMENT POTENTIAl AND INCREMENTAl PURChASE PRICE COMPARISON (PER CENT, EUROS)

FUELS FOR LIFE — A Discussion on Canada’s Transportation Energy Choices8
-100
-80
-60
-40
-20
0
20
PMVOCsSOxNOx
EV*PHEV50/50*
Dieselhybrid
Gasolinehybrid
Natural gas(CNG)
B5DieselE10
Source: GHGenius 3.19 a.
*Hydro generated electricity.
% change in gm/km life-cycle air pollutant emissions from gasoline baseline
FIgURE 6: lDV lIFE-CYClE AIR POllUTANT EMISSION ChANgES FOR VARIOUS TRANSPORTATION FUElS COMPARED TO gASOlINE BASElINE
-80-70-60-50-40-30-20-10
0102030
Natural gas (CNG)Diesel hybridB5
PMVOCsSOxNOx
Source: GHGenius 3 19a.
% change in gm/km life-cycle air pollutant emissions from diesel baseline
FIgURE 7: hDV lIFE-CYClE AIR POllUTANT EMISSION ChANgES FOR VARIOUS TRANSPORTATION FUElS COMPARED TO PETROlEUM DIESEl BASElINE

FUELS FOR LIFE — A Discussion on Canada’s Transportation Energy Choices 9
Commercial/consumer issues comparisons
Quantitative comparisons of the full range of commercial and consumer aspects and implications for future fuel choice alternatives are not possible. Hence, a qualitative assessment comparing alternative fuels to gasoline and diesel was undertaken, using a “traffic light” approach. These comparisons span the full range of commercial/
consumer issues discussed in this report. For each criterion, alternatives were assessed as either comparable to or better than gasoline and/ or diesel (green), offering modest disadvantages/impediments compared to gasoline and/or diesel (yellow), or posing significant disadvantages/impediments compared to gasoline and/or diesel (red). These comparisons are shown in the chart below.
Fuels Availability Fuel Cost Performance Infrastructure and Vehicle Implications
Petroleum Gasoline Commercially available
Baseline for cost comparison
Fuel of choice for millions of vehicles
Established infrastructure, wide vehicle choice
Diesel Commercially available
Baseline for cost comparison
Fuel of choice for millions of vehicles
Established infrastructure, wide vehicle choice
Liquid Biofuels
1st Generation Ethanol (corn, wheat, etc.)
Commercially available at 5–10% volume of gasoline)
~50% premium over gasoline
Lower energy content — more frequent fill-ups
Minimal implications at blends up to 10%
2nd Generation Ethanol (cellulosic)
Not yet commercially available
Uncertain costs as not yet available commercially
Lower energy content — more frequent fill-ups
Minimal implications at blends up to 10%
Biodiesel (FAME)
Commercially available in limited volumes
~30–50% premium over petroleum diesel
Poor low temperature properties
Some infrastructure issues associated with cold flow properties
2nd Generation Renewable Diesel (HDRD)
No production in Canada
>30–50% premium over petroleum diesel
Broadly substitutable for petroleum diesel
Minimal implications
Natural Gas
CNG Commercially available
Less expensive on a per km basis
Broadly substitutable for gasoline and diesel
Large infrastructure and vehicle investments needed
LNG Limited availability Less expensive on a per km basis
Broadly substitutable for gasoline and diesel
Large infrastructure and vehicle investments needed
Electricity Hybrid (HEV) Commercially available
Less expensive on a per km basis
Good performance Modest vehicle cost premium
Plug-in Hybrid (PHEV)
Limited vehicle availability
Less expensive on a per km basis
Limited vehicle range on electricity only
Infrastructure and high vehicle cost premium
Battery Electric (BEV)
Limited vehicle availability
Less expensive on a per km basis
Very limited vehicle range
Infrastructure and high vehicle cost premium
FIgURE 8: QUAlITATIVE COMPARISON OF COMMERCIAl/CONSUMER ISSUES RElATIVE TO gASOlINE/DIESEl
Green Comparable to or better than gasoline and/or diesel.Yellow Modest disadvantages/impediments compared to gasoline and/or diesel.Red Significant disadvantages/impediments compared to gasoline and/or diesel.
FUELS FOR LIFE — A Discussion on Canada’s Transportation Energy Choices10
Conclusion
Transportation, and the essential mobility of people and goods it delivers, is vital to our economic and social well-being. Canadians are among the highest per capita consumers of transportation fuels in the world. This should come as no surprise as we live in the second largest country in the world, with a relatively small population stretched over more than nine million square kilometres.
Making choices about Canada’s future transportation fuels is complex. There is no quick fix for fuelling a reliable, affordable, and environmentally sustainable transportation system in the coming years. The goals of reliability, affordability and environmental sustainability can be in conflict. Competing demands mean that prioritization and trade-offs will be required.
Gasoline and diesel, our principal transportation fuels, have served us well for the past 100 years and continue to do so today. Markets have determined them to be the best energy sources to meet our transportation demands. They are safe, convenient, reliable and affordable fuels that deliver on a demanding set of expectations related to engine/vehicle performance. The environmental performance of these fuels, and that of the processes by which they are produced, have steadily improved.
Alternatives to gasoline and diesel all have characteristics that make them more or less suited to use as a transportation fuel. There is no single metric by which they can be assessed. The issues are complex and multifaceted. Many factors come into play in determining the relative merits of alternative fuels.
Policy choices should be made based on clearly stated policy objectives, and these choices should be based on objective, science-based data. There is a real need for better data comparing all transportation fuels on a full life-cycle basis to allow for choices based on scientific fact.
More efficient use of current fuel resources and fuel conservation should not be overlooked as solutions to the environmental challenges of transportation, especially GHG emissions. Optimizing the efficiency of conventional vehicles is potentially the lowest cost alternative to reducing GHG emissions.

FUELS FOR LIFE — A Discussion on Canada’s Transportation Energy Choices 11
Suggested checklist for policy-makers
In the interest of assisting policy-makers in making important choices about Canada’s transportation fuel future, the Paper offers the following checklist — a series of questions adapted from the Nine Challenges of Alternative Energy1 specific to the assessment of fuel choices for Canada’s future.
1. Scalability and Timing• Is the new energy source scalable?• Can it be produced in large enough
quantities to satisfy consumer demand and in a timely fashion?
2. Commercialization• At what pace can Canada transform
the transportation fuels supply mix?• Is the reliability of supply jeopardized?• Will consumer confidence be undermined?• Will the changes impose unaffordable
costs on consumers?• How much will the new fuel delivery
infrastructure cost and how long will it take to build?
3. Substitutability• Will the alternative fuel meet consumer
expectations for performance, availability and affordability?
• Will it be safe, reliable and convenient?• Will the alternative fuel require a radically
different vehicle fleet and/or a new fuel distribution infrastructure?
4. Material Input Requirements• Will the type and volume of the
resources and energy needed limit the scalability and affect the cost and feasibility of an alternative?
• Can greatly increased demand for this alternative be accommodated?
• At what cost?
5. Environmental Impacts• What is the true environmental footprint
of the alternative fuel?• Can the alternative deliver better
environmental performance on a full life-cycle basis?
• Have impacts on air, water, land and biodiversity been assessed?
• Is the alternative suitably sustainable to be used broadly as a partial or full replacement for fossil fuels?
6. Costs• Have benefits and costs been
adequately considered?• Do benefits outweigh costs?• Is this the most cost-effective method
to achieve the desired outcomes?
7. Efficiency and Conservation• What is the relative importance of new
energy supplies versus more efficient use of current energy resources and energy conservation?
1 The Nine Challenges of Alternative Energy, The Post Carbon Reader Series: Energy, Post Carbon Institute, 2010.

FUELS FOR LIFE — A Discussion on Canada’s Transportation Energy Choices12
InTRODuCTIOn
issues, including price increases and price volatility affecting consumers and the economy, as well as environmental stresses resulting from greenhouse gas emissions, and air and water quality impacts.
Alternative transportation fuels have been promoted as a means to alleviate, or in some cases even completely eliminate, the negative impacts attributed to the use of petroleum fuels. The reliance of the Canadian economy and consumer on affordable and readily available supplies of fuel warrants a careful assessment of the advantages and disadvantages of potential alternatives.
What are these alternatives? While there are a wide variety of fuels that can physically power our vehicles, three major alternative transportation energy sources are often suggested as supplements or potential near-term replacements to gasoline and diesel.
liquid biofuels include ethanol, biodiesel and hydrogen derived renewable diesel (HDRD). The Government of Canada and several provinces require that gasoline, on average, contains a minimum content of ethanol (generally five per cent). This ethanol is primarily produced from corn and wheat, grown in Canada and the United States specifically for the purpose of producing fuel. Biodiesel and HDRD are produced from a variety of vegetable and animal fats.
Canadians rely on transportation so much that moving all those people and goods is the second largest demand for energy in the country — nearly 30 per cent of the energy used provides for transportation — only the industrial sector uses more. And today, almost all of that transportation energy is supplied via petroleum based fuels.
Petroleum fuels supply 95 per cent of Canada’s transportation needs.
Some 80 per cent of Canadian households have at least one car, and there are 18 million passenger vehicles registered in Canada — a country with a population of 34 million.2 We also travel a great deal in our vehicles. In 2008, the typical Canadian travelled between 11,000 and 20,000 kilometres for a total of 325 billion kilometres. Over 200 million litres of gasoline and diesel are pumped into fuel tanks across the country on a daily basis —75 billion litres a year.
Supplying and delivering the volumes demanded by Canadian motorists and businesses day after day at affordable prices is not a simple task. The petroleum industry has developed a reliable, extensive and efficient fuel production and delivery network over decades, representing billions of dollars of investment.
In recent years, there has been much public policy attention focused on fossil fuels, and especially the future role of petroleum-based transportation fuels. These fuels have been associated with several
2 National Energy Board of Canada, January 2009.
The transportation sector is a critical contributor to Canada’s economy and the quality of life of all Canadians. Every day, millions of Canadians commute to work, go shopping for groceries and visit with friends and family. And every day, hundreds of millions of dollars of goods are shipped by truck, by boat, by rail and by air, within and between cities, across borders and to customers in every corner of the country. The movement of people and goods is essential to our economy and way of life.

FUELS FOR LIFE — A Discussion on Canada’s Transportation Energy Choices 13
The purpose of this document is to provide a balanced perspective on the advantages and disadvantages of the transportation fuel options available to Canada in the coming years. Good public policy requires the careful consideration of all the facts and consequences, intended and unintended, of various policy options.
Transportation is too important to our economy and way of life for decisions and policy to be made lightly.
A reliable, affordable and environmentally sustainable transportation system is the policy objective “lens” through which this document should be viewed. It has been written primarily for policy-makers and those engaged in emerging transportation fuel policy discussions. CPPI acknowledges that other policy objectives can drive government policy on fuels, such as income support for farmers and agricultural operations, and other national, regional and economic development objectives. These are important considerations for policy-makers, but are beyond the scope of this document. Similarly, other debates around fuel policy — for example, the food for fuel debate — are not topics for this document.
Natural gas is currently used in compressed form in several niche applications, such as taxis, public transportation and return-to-base commercial vehicle fleets. It can also be used in liquefied form. (Propane can also be used as a transportation fuel.)
Electricity is used by Canadians to power dishwashers, televisions and lights. Electricity isn’t a physical substance the same way as gasoline, diesel, natural gas and liquid biofuels. Electricity doesn’t combust in engines the way other fuels do. But electricity can be used to power vehicles, using very different technology and infrastructure than liquid or gaseous fuels. Although not a fuel per se but rather an energy source, for simplification electricity will be considered an alternate fuel in this document.
All transportation fuels have benefits and disadvantages for the Canadian consumer, the economy and the natural environment.
All these fuels can potentially be used to power vehicles to provide for the essential transportation of people and goods. They have their own physical characteristics and each relies on specific technologies and infrastructure.

FUELS FOR LIFE — A Discussion on Canada’s Transportation Energy Choices14
Transportation energy use in Canada3
Nearly one third (30 per cent) of total energy use in the country powers the movement of people and goods. This makes transportation the second-largest sector in terms of energy consumption.
Eighty-three per cent of the energy used in transportation is for ground transportation, including cars, passenger trucks and various public transportation vehicles such as buses, light rail and trains for moving people, as well as heavy duty trucks and trains for moving goods. The remaining 17 per cent of total transportation energy in Canada is used to fuel aircraft, ships and off-road vehicles/equipment.
The transportation sector is different than other energy-consuming sectors of Canada’s economy, such as industry, residential and commercial sectors, in that the supply of energy is currently dominated by a single energy source: petroleum-based fuels. Gasoline, diesel and other petroleum fuels provide more than 95 per cent of the energy that fuels transportation vehicles.4 Light duty vehicles (passenger cars) are generally fuelled by gasoline. Medium and heavy duty vehicles (trucks and buses) are generally fuelled by diesel.
CanaDa’s TRanspORTaTIOn eneRGY sYsTeM: WheRe We aRe TODaY anD hOW We GOT heRe1
3 Natural Resources Canada, Energy end-use Database, accessed April 2011.4 Ibid.
largely as a result of its very large land-mass and widespread population centres combined with our prosperous economy, Canada uses a lot of energy for transportation. Canada is among the highest per-capita users of energy for transportation in the world, nearly the same level as the United States and higher than other developed countries.
IndustrialTransportationResidentialCommericalAgriculture
37%17%
30%
2%
14%
FIgURE 9: ENERgY USE IN ECONOMIC SECTORS,
NATURAl RESOURCES CANADA, 2009

FUELS FOR LIFE — A Discussion on Canada’s Transportation Energy Choices 15
CanaDa’s TRanspORTaTIOn eneRGY sYsTeM: WheRe We aRe TODaY anD hOW We GOT heRe
Figure 11 notes: • Gasoline, diesel, electricity and natural gas values from NRCan energy use database, 2008 • Ethanol based on assumed three per cent of gasoline consumption in 2008 • Assumed zero per cent biodiesel in 2008
53%
25%10%
4%3%3%
2%0%
CarsTrucksMotorcyclesBuses/Urban transitAirRailMarineOff-road
1.5%
Diesel for roadGasoline for road
Diesel for railEthanol for roadElectricity for road (mass transit)Natural gas for road/railPropane
0.1%0.5%
Source: NRCan, 2008.
61%33%
4%
0.1%
FIgURE 10: ENERgY USE BY TRANSPORTATION MODE,
NATURAl RESOURCES CANADA, 2009
FIgURE 11: gROUND TRANSPORTATION FUElS USED IN CANADA

FUELS FOR LIFE — A Discussion on Canada’s Transportation Energy Choices16
The U.S. Energy Information Administration (EIA) in its International Energy Outlook 2011 indicates that most of the projected growth in global transportation energy demand over the next 25 years will occur in the developing, non-OECD nations. Their share of world transportation energy demand will rise from 40 per cent in 2008 to 54 per cent in 2035 — a significant shift in the global demand picture. Consumption among the OECD nations will remain near flat or even decline.
The U.S. EIA projects that U.S. transportation sector energy demand will grow annually by 0.5 per cent from 2008 to 2035. During that same timeframe, Canada’s total transportation energy use is projected to increase by a mere 0.2 per cent per year.6 This is a significant departure from earlier projections by Natural Resources Canada7 and the National Energy Board8 that projected transportation annual demand growth rates greater than one per cent.
1.1 Transportation energy demand
Growth in economic activity and population increases are key factors that determine changes in demand for transportation energy. In Canada, transportation energy has been increasing over the past 20 years as the chart below indicates.5
Demand for transportation energy will continue to grow in the coming years, but at a slower rate than in the past. Changing demographics, improved light duty vehicle fuel economy, and saturation of personal travel demand are key factors behind slowing demand growth. This is consistent with what is occurring in other OECD nations with similar demographics, mature transportation sectors and established infrastructure networks.
5 NRCan end-use database.6 International Energy Outlook, U.S. Energy Information Agency, September 2011.7 Canada’s Energy Outlook: The Reference Case 2006, Natural Resources Canada, 2006.8 Canada’s Energy Future: The Reference Case and Scenarios to 2030, National Energy Board, 2007.
0
500
1,000
1,500
2,000
2,500
3,000
2008
2007
2006
2005
2004
2003
2002
2001
2000
1999
1998
1997
1996
1995
1994
1993
1992
1991
1990
Petaj
oules
Total transportationGround transportation
Source: Natural Resources Canada energy end-use database.
FIgURE 12: gROUND TRANSPORTATION FUElS USED IN CANADA

FUELS FOR LIFE — A Discussion on Canada’s Transportation Energy Choices 17
their performance, wide availability and affordability compared to the alternatives. Fuel density, cost, convenience and reliability are key determinants in the usage of petroleum-based fuels.
The high energy density and affordability of gasoline and diesel, combined with the performance of the internal combustion engine, are the reasons petroleum-based fuels replaced steam and electric powered vehicles at the turn of the 20th century.
1.2 Markets have determined the best energy sources to meet transportation demands
Today, Canada’s transportation system is dominated by petroleum fuels, but this wasn’t always the case. The first train locomotives in the 18th century employed engines powered by coal-generated steam, and some of the first automobiles designed in the 19th century used steam or electricity as an energy source.
That all changed with the introduction of the internal combustion engine (ICE) that ran on gasoline or diesel. Gasoline and diesel are energy dense — they store large amounts of energy in relatively small volumes, making them ideal for mobile use. They are safe, reliable fuels that deliver on a demanding set of expectations related to engine/vehicle performance.
Since the beginning of the motor car industry in the late 19th century, petroleum fuels — gasoline and diesel — have been the fuels of choice for vehicle manufacturers. Consumer demand for these fuels has grown exponentially since then, based on
FIgURE 13: ENERgY DENSITY COMPARISON OF AlTERNATIVE FUElS COMPARED TO gASOlINE
Fuel Energy density by volume Energy density by weightkWh/litre vs. gasoline % kWh/kg vs.gasoline %
Gasoline 9.7 100.00 13.20 100.00Diesel 10.7 110.00 12.70 96.00Ethanol 6.4 66.00 7.90 60.00Biodiesel 9.6 100.00 10.50 80.00CNG 2.5 25.00 13.50 103.00LNG 7.0 70.00 15.00 115.00NiMH battery 0.1–1.3 2.10 0.10 0.80Lithium-ion battery (present) 0.2 2.10 0.14 1.10Lithium-ion battery (future) 0.28 2.10Source: American Physical Society and U.S. Department of Energy.

FUELS FOR LIFE — A Discussion on Canada’s Transportation Energy Choices18
Gasoline and diesel have served us well and the market rationale for ICE powered vehicles fuelled by gasoline or diesel has remained strong. Key to this has been the near constant, evolutionary improvements to the integrated vehicle-fuel system. Over the years, fuel providers and vehicle manufacturers have worked together, often in collaboration with government regulators, to achieve coordinated fuel/vehicle performance improvements, especially with respect to fuel efficiency and environmental footprint. Market forces and new regulatory requirements have driven substantial change in vehicle and fuel performance. Continuing innovation is expected to drive further improvements well into the future.
The development of an extensive petroleum fuels production and distribution infrastructure contributed to petroleum-based transportation fuels becoming the predominant fuels used in Canada and across the world.
Other fuels have made only minor inroads, generally in niche applications. Revolutionary changes to vehicles and fuels have been attempted in the past. However, to date and despite claims of significant vehicle performance and/or environmental benefits, revolutionary changes to vehicles, propulsion systems and fuels have met with little success. Overestimating the performance and underestimating the cost of revolutionary fuel/vehicle system technologies are underlying impediments to revolutionary change.
Moreover, promised performance improvements often fail to account for the evolutionary progress being achieved in increasing ICE vehicle fuel efficiency and in reducing vehicle emissions. As well, fuel cost comparisons often underestimate the supply of economically recoverable hydrocarbon resources from which gasoline and diesel are produced.
Globally, trillions of dollars have been invested to match supply to steadily increasing demand and establish the comprehensive and complex distribution infrastructure that ensures fuels are available when and where they are needed. This infrastructure includes facilities that refine crude oil into usable fuels and then distribute them through pipelines, distribution terminals, bulk plants, transportation assets (railcars, ships and trucks), and retail service stations. The system continues to evolve to meet the needs of consumers, meeting new challenges in very practical yet innovative ways.

FUELS FOR LIFE — A Discussion on Canada’s Transportation Energy Choices 19
Whatever the rationale, alternative fuels are a significant policy focus for governments in Canada and around the world. Knowledge, reason and fact should underpin policy-making. There are no quick fixes to achieve a reliable, affordable and sustainable transportation system. Good transportation fuels policy will require a rigorous assessment of the physical, technological and economic characteristics, challenges and implications of all fuels.
Alternative transportation fuels have their attributes but all fuels have drawbacks — policy must assess all the facts and consequences.
1.3 A growing focus on alternatives to petroleum-based fuels
The pursuit of alternatives to gasoline and diesel as transportation fuels has strengthened in recent years, driven by a number of factors. Topping the list are environmental concerns, in particular the challenge of reducing GHG emissions related to climate change. In Canada, transportation activities contribute 27 per cent of total GHG emissions. Urban air quality is another environmental concern. Some believe alternatives offer more energy security through diversity, and an opportunity to mitigate or lower the rising costs of petroleum-based fuels. Others seek to create new business opportunities. Some proponents view alternatives as a supplement for gasoline and diesel, while others view alternatives as complete replacements for petroleum fuels.

FUELS FOR LIFE — A Discussion on Canada’s Transportation Energy Choices20
2 assessInG The alTeRnaTIVes
9 There are other potential transportation fuels, including liquid petroleum gases, liquid fuels derived from natural gas and coal,
and hydrogen. Apart from ethanol, other alcohols, such as methanol, are not considered as part of this paper as they are widely understood as having very limited or niche potential as transportation fuels.
This paper examines gasoline and diesel and three other broad categories of alternative fuels that are the current focus of policy-makers: liquid biofuels, natural gas and electricity.9 Each of these fuels has particular characteristics, and each has its own production processes and systems for transportation and delivery. Each will be examined from two perspectives: environmental performance and commercial/consumer implications.
2.1 Understanding the environmental issues
There are a variety of transportation fuels that can be used in vehicles, and all these fuels have varying environmental impacts. The most noticeable emissions from vehicles are the direct emissions resulting from combustion of fuel in the engine and exhaust from the tailpipe. (Evaporative emissions from vehicles also have an impact and are regulated.) But the environmental impacts are not just related to tailpipe emissions. There are also environmental impacts resulting from the production and processing of fuels, as well as distributing fuels to the consumer. Considering these impacts along with the emissions from the vehicle’s tailpipe, is referred to as the full life-cycle analysis of the impacts of the fuel — or “well-to-wheels”.
The purpose of this paper is to explore the unique characteristics of all transportation fuels and to equip policy-makers with solid data to develop smart policy.
The assessment of environmental performance will focus on air emissions — GHGs and conventional smog-causing emissions known as Conventional Air Pollutants (CAP) — the dominant environmental policy focus of governments today. This assessment will examine well-to-tank emissions — those associated with the production, processing and delivery of fuels, and tank-to-wheels emissions — those associated with the actual consumption of fuel in vehicles.
Commercial/consumer issues included in this paper are associated with the practicality and commercial viability of using alternative fuels at the scales required to meet Canadians’ essential transportation needs. This includes the availability of the fuel, vehicle and infrastructure implications, and costs to both the consumer and the economy.
The cost/economics of addressing transportation fuels is becoming a more important consideration; society has to be able to “afford” transformative changes in transportation.

FUELS FOR LIFE — A Discussion on Canada’s Transportation Energy Choices 21
life-cycle analysis (lCA)
Calculating the impacts of a fuel over its entire life-cycle can be challenging. Each transportation fuel is produced and delivered in its own way, using different technologies and infrastructure. To help with the calculation and comparison, life-cycle impacts are often split into segments. “Well-to-tank” (WtT) impacts refer to all the impacts associated with the production of a fuel from naturally occurring energy sources. The “well” refers to a petroleum well where the crude oil is originally extracted, while the “tank” refers to the gas tank in a vehicle. However, for biofuels, produced in a field, “field-to-tank” (FtT) impacts cover those from production of the energy source, through processing and distribution through to a vehicle’s tank. “Tank-to-wheels” (TtW) impacts refer to the impacts associated with the actual vehicle performance, based on fuel combustion in the vehicle. Life-cycle analysis is a developing science, with considerable complexity and uncertainty.
greenhouse gases (ghgs)
Carbon dioxide (CO2) is the dominant greenhouse gas (GHG). GHG emissions are produced from the production of transportation fuels, distribution systems and combustion in vehicles. Transportation accounted for 27 per cent of Canadian GHG emissions in 2009. More than a third of the increase in Canadian GHG emissions from 1990 to 2008 was a result of transportation.10
Conventional Air Pollutants (CAPs)
The production and combustion of fuels produces varying quantities of several compounds other than CO2 — principally carbon monoxide (CO), oxides of nitrogen (NOx) and depending on the fuel, sulphur oxides (SOx), volatile organic compounds (VOCs) and particulate matter (PM). These pollutants are collectively called conventional air pollutants (CAPs) and are associated with air quality issues, including smog and acid rain.
Environmental issues associated with transportation fuels are not limited to greenhouse gases or conventional air pollutants. Other notable environmental concerns include water consumption, water quality and the impact of land-use change on biodiversity. Any comprehensive assessment and comparison of the impacts of transportation fuels should consider these issues on a full life-cycle basis. At this time however, there is no readily available data to enable a credible “apples to apples” comparison. Complications and large uncertainties left this task for a subsequent initiative.
Life-Cycle Analysis (LCA) modelsOver the years, numerous models have been created to assess the environmental life-cycle impacts of fuels. The GHGenius model has been developed for Natural Resources Canada over the past ten years. It is based on the 1998 version of Lifecycle Emissions Model (LEM) originally developed in the United States. GHGenius is capable of analyzing the emissions of many contaminants associated with the production and use of traditional and alternative transportation fuels. While GHGenius has become the LCA tool of choice in Canada, other models, like the Greenhouse Gases, Regulated Emissions and Energy Use in Transportation (GREET) model, developed by the U.S. Department of Energy Argonne National Laboratory, are also referenced in this document.
10 Natural Resources Canada, Energy Efficiency Trends in Canada 1990 to 2007, April 2010.

FUELS FOR LIFE — A Discussion on Canada’s Transportation Energy Choices22
Stationary energyTransport
Fugitive sourcesIndustrial processes
Millio
n ton
nes C
O 2
0
100
200
300
400
500
600
700
800
1990
1991
1992
1993
1994
1995
1996
1997
1998
1999
2000
2001
2002
2003
2004
2005
2006
2007
2008
AgricultureWaste disposal
0
5,000
10,000
15,000
20,000
COVOCsNOxSOxPM
Total groundtransportation (ppm)
Other humansources (ppm)
Source: Environment Canada, 2009.
FIgURE 15: CANADIAN gROUND TRANSPORTATION AND OThER SOURCES OF AIR POllUTION
Sources: Environment Canada; The Conference Board of Canada
FIgURE 14: CANADA’S gREENhOUSE gAS EMISSIONS BY CATEgORY

FUELS FOR LIFE — A Discussion on Canada’s Transportation Energy Choices 23
Availability
For alternative fuels to successfully displace gasoline or diesel, they must be readily available at scales that can serve significant portions of the fuels market. This requires adequate feedstock, production capacity and a distribution infrastructure. The system required to produce and distribute a secure and constant supply of fit for purpose fuels is large, complex and costly. The current Canadian gasoline and diesel distribution infrastructure has developed and evolved over more than a century. It is an integrated, continental system, encompassing fuels and vehicles, that enables seamless transportation across North America.
Cost
The ability for Canadians to get around and access goods and services is a big part of our quality of life. Similarly, the performance of the Canadian economy depends on the efficient movement of goods across the country. The cost of transportation fuels has a direct impact on both individual Canadians, who must pay for the fuel they consume, as well as the affordability of goods in general, as these must be transported to market. The affordability of transportation fuels is a concern for all Canadians as it directly impacts our standard of living and economic strength. Beyond the cost of the fuel itself, cost assessments and comparisons of alternative fuels must include the cost of a new fuel distribution infrastructure and incremental costs of new vehicle technology to make these fuels compatible with the vehicles they will power.
Figure 15 shows the share of air pollutants emitted by the transportation sector compared to Canadian totals resulting from human activity (does not include natural emissions from plants and other sources).
2.2 Understanding the commercial/consumer issues
All fuels have unique characteristics that make them more or less suitable as a transportation fuel choice. Gasoline and diesel are the fuels of choice because they are readily available, safe, convenient and affordable. Their high energy density (large amounts of energy can be stored in a relatively small space) and liquid form makes them ideally suited for mobile use. The scale for transportation fuels’ supply is huge — 200 million litres of petroleum-based fuels are used every day in Canada.
The future strength of Canada’s economy depends on a reliable supply of quality transportation fuels available to Canadians at competitive prices, without causing irreparable harm to the natural environment.
Accordingly, alternatives to gasoline and diesel face a number of challenges to full commercialization and consumer acceptance. Is the new energy source scalable — can it be produced in large enough quantities to satisfy consumer demand and in a timely fashion? What kind of fuel production and delivery infrastructure will be required, how long will it take to build, and how much will it cost? Will it be safe, reliable and convenient? Are there technological limitations that could impact vehicle performance? Will it be as affordable as gasoline and diesel? Will it require a radically different vehicle fleet? To help answer these questions and simplify the analysis, this paper looks at commercial/consumer issues from four perspectives: availability, performance, cost and vehicle fleet, technology and infrastructure issues.

FUELS FOR LIFE — A Discussion on Canada’s Transportation Energy Choices24
2.3 Petroleum fuels (gasoline and diesel)
gasoline is the fuel designed for spark-ignition internal combustion engines (ICEs) most commonly found in personal vehicles, such as cars and passenger light trucks. Gasoline is a mixture of hydrocarbons refined from petroleum (crude oil), with small amounts of additives to improve performance.
Diesel is the fuel designed for compression ignition engines commonly used in trucks and buses, as well as locomotives, farm equipment, portable generators and other off-road applications. Diesel contains more energy and greater power density than gasoline or alternative fuels.
Gasoline and diesel are produced and distributed through a complex network of refineries, fuel distribution terminals, pipelines, distribution assets (trucks, trains, ships) and retail outlets.
2.3.1 Environmental performance
ghg emissions
GHG emissions from the production and use of gasoline and diesel are generally well understood. Typically, the well-to-tank emissions component (crude extraction, refining and transportation) accounts for between 15 and 25 per cent of the full well-to-wheel life-cycle GHG emissions from gasoline and diesel use.
Crude oils, from which gasoline and diesel are produced, can originate from several sources and can be of varying type and quality that result in different GHG emission profiles from production and refining. The two major categories of crude oil are conventional and unconventional (e.g. oil sands derived crude). Oil sands derived crude is growing in importance as feedstock for Canadian refineries and much attention has been focused on its higher GHG emissions footprint. On a full life-cycle basis, GHG emissions from fuels produced from oil sands
Performance
Transportation fuels must perform in a variety of vehicles, over a wide range of temperatures and climate conditions, in numerous applications. Petroleum-based fuels’ broad acceptance is based on their versatility and ability to perform in numerous applications, from powering personal scooters to fuelling the heaviest transport trucks. To successfully displace gasoline and diesel, liquid biofuels, natural gas and electricity must be able to perform as transportation fuels in a safe, reliable manner, while delivering high levels of convenience and performance. Transportation fuels must continue to evolve and stay aligned with the vehicle fleet and consumer preferences.
Vehiclefleet/technology/ infrastructure issues
Vehicles and the transportation fuels that power them work as an integrated system. Without appropriate fuel, a vehicle does not operate. Without a vehicle to power, a transportation fuel offers no value. Thus any assessment of alternative fuels must consider the implications on the vehicle fleet, including the pace of vehicle technology development and deployment, fleet turnover rates, incremental costs of new vehicles and infrastructure required to fuel vehicles.

FUELS FOR LIFE — A Discussion on Canada’s Transportation Energy Choices 25
Tank-to-wheel (tailpipe) emissions components typically account for 75 to 85 per cent of the full well-to-wheel (life-cycle) GHG emissions from gasoline and diesel consumption. Gasoline fuelled vehicles emit 2.3 kg of CO2 for every litre of gasoline they consume.12
FIgURE 17: FUEl EFFICIENCY AND EMISSIONS OF
gASOlINE-POWERED VEhIClES
GasolineFuel Efficiency(litres/100 km)
Emissions (kgCO2/year)
Compact car 8.2 3,800Full-size sedan 10.7 5,000Passenger trucks, SUVs and vans
11.5 5,200
Source: Natural Resources Canada Fuel Consumption Guide 2011.
Assuming an average fuel economy for a compact car in Canada of 8.2 litres/100 km, a gasoline powered vehicle traveling 20,000 km a year will emit about 3,800 kg of CO2, or 3.8 tonnes. Full size vehicles and trucks and vans have lower fuel efficiency and correspondingly higher emissions.
crude are in the mid-range of the emissions associated with the global crude sources currently utilized in North America (figure 16 above). Regulations aimed at reducing GHG emissions from the oil sands will continue to decrease its environmental footprint.
Refineries account for two per cent of total Canadian GHGs.11 Since 1996, refinery CO2 emissions have been reduced by nearly 10 per cent. This has been achieved despite an increase in processing intensity to improve the environmental performance of gasoline and diesel; for example, the removal of sulphur which requires additional processing and energy inputs.
0 100 200 300 400 500 600
Middle Eastheavy
Californiaheavy
Nigeria light
Oil sands — mining upgraded
Oil sands — in situ
Venezuela — Bachaquero
Mexico — Maya
Saudi Medium(ave)
End-use combustionProduction, refiningand oil transportation
Source: Cambridge Energy Research Associates, 2010.
kg CO2 per barrel of refined products
FIgURE 16: WEll-TO-WhEElS CO2 EMISSIONS FROM VARIOUS SOURCES OF CRUDE
11 NPRI data.12 Natural Resources Canada, Fuel Consumption Guide 2011.

FUELS FOR LIFE — A Discussion on Canada’s Transportation Energy Choices26
Gasoline and diesel are the products of years of continuous improvement to enhance vehicle performance and reduce the smog formation potential and toxicity of unburned fuel.
The advances in vehicle technology combined with the continuous improvement in fuel formulation have reduced vehicle smog and acid rain related emissions by more than 90 per cent over the past 10 years.
One notable example of improving fuel formulation was the complete elimination of lead, which drastically reduced the toxicity of gasoline. Desulphurization is another significant development. Today, all diesel produced or imported into Canada for on or off-road use is less than 15 parts per million (ppm) sulphur. The average sulphur content of gasoline has been reduced to less than 30 ppm. The removal of sulphur from fuels enables the use of advanced emission control devices that substantially reduce tailpipe emissions of conventional air pollutants. The reductions in air emissions achieved through changes in fuel composition and vehicle technology can be seen in the following charts.
Diesel-fuelled vehicles emit 2.7 kg of CO2 for every litre of diesel they consume. The diesel engine is inherently more efficient (30–35 per cent) than gasoline-powered internal combustion engines, resulting in 20 per cent lower GHG emissions than a gasoline-powered vehicle of comparable size and power.13
Conventional air pollutant emissions
Refinery operations produce emissions of a variety of conventional air pollutants, principally sulphur oxides (SOx), nitrous oxides (NOx), and volatile organic compounds (VOCs). In spite of more processing intensity to meet stringent new product specifications, refiners have made impressive gains in improving refinery air emissions performance. Since 1998, SOx emissions are down 45 per cent, NOx have decreased by 10 per cent and VOCs are down 66 per cent. Total reportable releases of government designated substances are down 40 per cent since 1993.
Combustion of gasoline and diesel produces emissions of SOx, NOx, VOCs, carbon monoxide (CO), and particulate matter (PM).
13 Natural Resources Canada, Fuel Consumption Guide 2011.

FUELS FOR LIFE — A Discussion on Canada’s Transportation Energy Choices 27
2.3.2 Commercial/consumer issues
0
200,000
400,000
600,000
800,000
1,000,000
1,200,000
1,400,000
2030
2029
2028
2027
2026
2025
2024
2023
2022
2021
2020
2019
2018
2017
2016
2015
2014
2013
2012
2011
2010
2009
2008
2007
2006
2005
2004
2003
2002
2001
2000
1999
1998
1997
1996
1995
1994
1993
1992
1991
1990
1989
1988
1987
1986
1985
Light duty vehicles
Heavy duty vehicles
Total heavy and light duty vehicles
NOx t
onne
s per
year
Source: Environment Canada.
% reduction: (1985–2030) = 85%; (2005–2030) = 79%
FIgURE 18A: ON-ROAD VEhIClE EMISSION INVENTORIES, NOX EMISSIONS, 1985–2030, ENVIRONMENT CANADA
0
10,000
20,000
30,000
40,000
50,000
60,000
70,000
80,000
2030
2029
2028
2027
2026
2025
2024
2023
2022
2021
2020
2019
2018
2017
2016
2015
2014
2013
2012
2011
2010
2009
2008
2007
2006
2005
2004
2003
2002
2001
2000
1999
1998
1997
1996
1995
1994
1993
1992
1991
1990
1989
1988
1987
1986
1985
SOx to
nnes
per y
ear
Light duty vehicles
Heavy duty vehicles
Total heavy and light duty vehicles
Source: Environment Canada.
% reduction: (1985–2030) = 94%; (2005–2030) = 69%
FIgURE 18B: ON-ROAD VEhIClE EMISSION INVENTORIES, SOX EMISSIONS, 1985–2030, ENVIRONMENT CANADA

FUELS FOR LIFE — A Discussion on Canada’s Transportation Energy Choices28
Canada’s gasoline and diesel production capacity exceeds our domestic requirements. Canada is a net exporter of gasoline and diesel fuels. Canada’s refining industry has undergone a significant restructuring over the past 30 years. Since the 1970s, the number of operating refineries has fallen from 40 to just 19 today. However, over this same time, output from Canada’s refining industry has expanded through increased capacity at remaining refineries and increased operating efficiencies to meet consumer demand.
Cost
Gasoline and diesel are among the most affordable fuels on the market. Four main factors affect the price at the pump: crude oil prices; wholesale prices for refined products such as gasoline; the retail mark-up; and taxes. Each factor is subject to unique influences that determine pump prices. Canadians benefit from a competitive
2.3.2 Commercial/consumer issues
Availability
Gasoline and diesel are by far the most widely used transportation fuels in Canada. A complex and extensive supply and distribution infrastructure provides a reliable supply of fit for purpose fuels and is readily available.
On a daily basis, approximately 200 million litres of petroleum-based fuels are pumped into car and truck fuel tanks across Canada.
On rare occasions, supply disruptions can occur resulting in distribution and retail inconveniences. These inconveniences are usually short term in nature and local or regional in scope.
05,000
10,000
15,000
20,000
25,000
30,000
35,000
40,000
45,000
50,000
2030
2029
2028
2027
2026
2025
2024
2023
2022
2021
2020
2019
2018
2017
2016
2015
2014
2013
2012
2011
2010
2009
2008
2007
2006
2005
2004
2003
2002
2001
2000
1999
1998
1997
1996
1995
1994
1993
1992
1991
1990
1989
1988
1987
1986
1985
Total
PM 2
.5 ton
nes p
er ye
ar
Light duty vehicles
Heavy duty vehicles
Total heavy and light duty vehicles
Source: Environment Canada.
% reduction: (1985–2030) = 87%; (2005–2030) = 57%
FIgURE 18C: ON-ROAD VEhIClE EMISSION INVENTORIES, TOTAl PM2.5, 1985–2030, ENVIRONMENT CANADA

FUELS FOR LIFE — A Discussion on Canada’s Transportation Energy Choices 29
Fuel formulations have evolved over the years to deliver constantly improving vehicle performance, across the full spectrum of Canadian climate conditions. Vehicles fuelled by gasoline and diesel start easily when cold, warm up rapidly, and run smoothly under all conditions. Today’s fuels are formulated to reduce harmful engine deposits and engine wear, and prevent contamination or corrosion of the fuel system. They provide the necessary power, with steadily increasing fuel economy and improved environmental performance.
According to the U.S. Department of Energy, only about 14 to 26 per cent of the energy from the fuel you put in your tank gets used to move your car down the road, depending on the drive cycle (e.g. city vs. highway, high speed vs. low speed). The rest of the energy is lost to engine and driveline inefficiencies or used to power accessories like air conditioners. Cars and trucks sold today are much more technically efficient than those sold two decades ago. However, the fuel economy
refined petroleum products market and pay pump prices that are among the lowest in the western world (see chart below).
Taxes (federal, provincial and municipal) make up a significant component of the pump price — nearly one third of the total price paid at Canadian gas pumps in January 2012. T-ax differences are one reason why pump prices differ across Canada — and indeed, are a key reason why pump prices are generally lower in the U.S. Canadians pay on average, more than 35 cents per litre in fuel taxes at the pump.
Performance
Gasoline and diesel are energy dense products with a demanding set of performance expectations. They are ideal for use as a transportation fuel — they store large amounts of energy in relatively small volumes.
0
50
100
150
200
250
TaxPrice excluding tax
UnitedKingdom
ItalyGermanyFranceJapan*SpainCanada*UnitedStates
90.511.0
122.9
37.2
Pump price 177.8188.5
85.4 82.6
201.9 207.1222.8
113.1 118.8 130.8
92.0
209.6
126.1
79.5 85.7 92.4 105.9 88.8 88.3 83.5
Cent
s/litr
e
Source: Kent Marketing Services and EIA.
*Indicates regular unleaded, all others mid-grade.
FIgURE 19: COMPARISON OF PUMP PRICES IN EIghT COUNTRIES, JANUARY 2012

FUELS FOR LIFE — A Discussion on Canada’s Transportation Energy Choices30
2.4 liquid biofuels (ethanol, biodiesel and hDRD)
Biofuels include a range of fuels, including the three main ones discussed in this paper: ethanol, biodiesel and HDRD, or hydrogenation derived renewable diesel.
Ethanol
Ethanol is an alcohol suitable for use with gasoline in spark ignition engines. The primary source of ethanol is the fermentation of starches and sugars contained in crops like corn, wheat, sugar cane, etc. In Canada, ethanol is produced primarily from corn (in Eastern Canada) and wheat (in Western Canada). Ethanol can also be produced from cellulosic feedstock, like switchgrass, wood waste, rice straw, etc. — commonly referred to as second generation ethanol. Commercial production of cellulosic ethanol faces a number of technical barriers. At this time, no commercial scale facilities exist and there is no large scale cultivation of cellulosic biomass for fuel production purposes.
Ethanol fuel for transportation purposes is blended with gasoline. Blends with 10 per cent ethanol are commonly referred to as “E10” and are suitable for most cars on the road today. Fuel blends containing 85 per cent ethanol are referred to as “E85” and can only be used with specially equipped vehicles, called Flexible Fuel Vehicles. Currently, E85 is only available at a few public stations in Canada.
The government of Canada currently requires that gasoline at the pump contain an average of five per cent ethanol. Some provinces require a higher percentage.
improvements that could have been gained from this technology over the last two decades have been used to increase vehicle size and weight (minivans and SUVs), horsepower, and to add amenities. Consequently, car and truck fuel economy levels have been flat for about two decades.
Canadians’ preference for heavier vehicles has offset significant improvements in internal combustion engine design and fuel efficiency improvements.
The potential to improve vehicle fuel efficiency with advanced technologies is substantial. Governments in Canada and the U.S. have now established new light duty (passenger) vehicle fuel efficiency/ emissions standards for the 2011–2016 model years that are expected to deliver significant improvements in fleet vehicle fuel consumption and GHG emissions. They have also stated their intent to establish more stringent requirements for the 2017 model year and beyond. New efficiency/ emission standards are also under development for heavy duty vehicles.
Innovative engine technologies could increase fuel efficiency by approximately 40 per cent from current average levels for new vehicle fleets.14
Vehiclefleet/technology/ infrastructure issues
Today’s vehicles are designed for optimal performance using gasoline and diesel fuels. Fuel providers and vehicle manufactures work closely together on research to ensure that fuels will be available to meet the needs of emerging vehicle and fuels technologies. An extensive fuel distribution network already exists for these fuels.
14 Powering Autos to 2020. The Era of the Electric Car?, Boston Consulting Group, July 2011.

FUELS FOR LIFE — A Discussion on Canada’s Transportation Energy Choices 31
fate of co-products. A further complication is the issue of land use and land use change. Direct land use change occurs through conversion of native ecosystems, such as grassland, forests and peat land, to energy crop lands, or by returning abandoned croplands to production. Indirect land use change occurs when existing food cropland is diverted to energy crops, inducing conversion of native ecosystems in another location to food production to meet total demand. Currently, most Life-Cycle Analysis (LCA) models, including GHGenius, the LCA model predominantly used in Canada, do not estimate GHG emissions from indirect land use change.
While assessing the emissions associated with indirect land use change is a complex process with many uncertainties, it is reasonable to assume that increasing production of liquid biofuels from agricultural crops will increase the amount of land used for agricultural production. The Institute for European Environmental Policy (IEEP) concluded that promoting the use of liquid biofuels with no consideration of indirect land use change has the potential to increase the EU’s greenhouse gas emissions beyond those that would arise from the continued use of conventional fossil fuels.15
LCA models used to estimate GHG emissions from first generation ethanol and biodiesel production and use, relative to gasoline and diesel, offer a range of results. In 2009, the Scientific Committee on Problems of the Environment (SCOPE) of the International Council for Science (ICSU) established the International SCOPE Biofuels Project to provide a comprehensive and objective, science-based analysis of the effects of liquid biofuels on the environment.16
hDRD and biodiesel
Biodiesel is the most common form of renewable diesel. Biodiesel is a mixture of FAMEs (fatty acid methyl esters). It is typically manufactured from soybeans, canola, vegetable oils or animal fats, and can be mixed with conventional diesel fuel to produce a biodiesel blend, such as B5 (five per cent). Second generation “renewable” diesel is made by processing vegetable and animal oils directly in traditional refinery processes. Second generation renewable diesel may be referred to as “hydrogenation derived renewable diesel” (HDRD) or Neste type renewable diesel. Most diesel engine manufacturers limit diesel blends to five per cent biodiesel content (B5). However, second generation renewable diesel does not have this same limit.
The federal government and some provinces mandate between two per cent and four per cent average renewable diesel blends.
2.4.1 Environmental performance
ghg emissions
Liquid biofuels are generally considered carbon neutral when burned, because they only release the CO2 that was absorbed from the atmosphere and sequestered in the plant through photosynthesis. However, “field-to-tank” emissions created in all the agricultural and liquid biofuel production processes can be considerable.
Calculating the greenhouse gases resulting from the production of liquid biofuels is a complex task because it requires the consideration of a wide range of feedstock and agricultural practices/ technologies, conversion/production technologies and processes, process fuels, the presence or absence of co-generation, and the presence and
15 The Indirect Land Use Change Impact of Biofuels in the EU, Institute for European Environmental Policy, November 2011. 16 Biofuels: Environmental Consequences and Interactions with Changing Land-Use, Proceedings of the Scientific Committee
on Problems of the Environment (SCOPE) International Biofuels Project Rapid Assessment, 2009.

FUELS FOR LIFE — A Discussion on Canada’s Transportation Energy Choices32
Second generation liquid biofuels produced from non-food crops and waste biomass (e.g. cellulosic ethanol), and emerging technologies like biodiesel from algae hold considerable promise for dramatically reduced life-cycle GHG emissions.
The SCOPE project found, in general, considerable net improvements in GHG emissions from second generation liquid biofuel technologies, like cellulosic ethanol from non-food crops and waste materials. For these technologies, GHG emissions improvements in general range from 10 per cent to just over 100 per cent. However, the study also concluded that the issue of land use change of agricultural biomass needs further clarity.
GHG emissions data for biofuels calculated using GHGenius are consistent with the general findings of the SCOPE project. GHGenius estimates that a 10 per cent ethanol blend (E10) reduces life-cycle GHG emissions by four to seven per cent compared to gasoline, depending on the feedstock used to produce the ethanol.18 GHGenius estimates that a five per cent biodiesel/renewable diesel blend reduces GHG emissions by three to five per cent compared to diesel, depending on the feedstock used to produce the biodiesel/renewable diesel.
The study examined various life-cycle models and found that results for corn ethanol range from a five per cent increase in emissions to a 35 per cent decrease. Results for wheat ethanol estimate an emissions decrease from 18 to 90 per cent. Results for canola-based biodiesel estimate an emissions decrease from 20 to 85 per cent. Results for soybean-based biodiesel range from a 17 per cent increase in emissions to a 110 per cent decrease. None of these wide ranging estimates consider the emissions impact of indirect land use changes.
According to the International Energy Agency (IEA), most conventional liquid biofuels such as ethanol produced from purpose-grown corn and biodiesel made from oilseed crops will have to significantly improve the efficiency of land use and ramp up the processing efficiency to achieve any substantial reduction in greenhouse gas emissions.17
Indirect land-use impactsOne example showing the complicated nature of assessing the life-cycle impacts are “indirect land use changes” associated with biofuel production. As biofuel production increases, new lands are required to grow crops for both food and as feedstock for biofuel production. As natural lands, including rainforest and grassland, are converted to grow crops, the carbon sequestered in the soil and in the natural vegetation is released. While indirect land-use changes result in greenhouse gas emissions, estimating the magnitude of these emissions is a challenge full of uncertainty. Most LCA models do not include indirect land use change as part of their assessment.
17 World Energy Outlook 2010, International Energy Agency, November 2010.18 GHG Genius version 3 19.a.
FIgURE 20: RANgE OF ESTIMATED ghg SAVINgS FROM SElECTED
lIQUID BIOFUEl PAThWAYS
Fuel (feedstock) GHG emissions reductionEthanol (corn) Less than 5%–35%Ethanol (wheat) 18%–90%Biodiesel (canola) 20%–85%Biodiesel (soybean) Less than 17%–110%Cellulosic ethanol (switchgrass) 88%–98%Cellulosic ethanol (poplar, switchgrass, forest residue)
10%–102%
Cellulosic ethanol (wheat straw)
84%–98%
Source: SCOPE, 2009

FUELS FOR LIFE — A Discussion on Canada’s Transportation Energy Choices 33
U.S. Environmental Protection Agency (EPA) research further confirms little overall material difference in conventional air pollutant emissions between biofuels and conventional petroleum fuels.21
2.4.2 Commercial/consumer issues
Availability
Almost all ethanol usage in Canada today is first generation ethanol made from corn or wheat. Ethanol produced in Canada isn’t sufficient to meet domestic demand created by provincial and federal mandates, therefore Canada imports corn-based ethanol from the United States (about 20 per cent of ethanol blended in Canada in 2010 was imported from the U.S.).
Scalability and resource issues mean that first generation ethanol could never replace gasoline. If 100 per cent of Canada’s corn crop was diverted to ethanol production, it would replace about 6.5 per cent of Canada’s gasoline demand. If 100 per cent of Canada’s wheat crop was used to produce ethanol, it would satisfy about 14 per cent of Canada’s gasoline demand.22
Second generation liquid biofuels, particularly cellulosic ethanol produced from cellulosic biomass — wood wastes from forestry and agriculture, municipal solid wastes, and some grasses — are a promising technology based on initial research and demonstration projects. While considerable progress has been made, there are no commercial scale facilities in existence and no current large scale cultivation of cellulosic biomass for fuel production purposes. Cellulosic ethanol producers continue to work on a number of technical barriers for this option to become economically viable, work continues toward full commercialization.
Conventional air pollutant emissions
The production and use of liquid biofuels produce a range of emissions from agricultural and industrial processes and vehicle combustion. Typical emissions include SOx, NOx, VOCs, CO and PM. Since liquid biofuels are produced from different crops with different agricultural practices and conversion processes that produce different fuels, the type and quantity of air emissions from the production and use of specific liquid biofuels can vary widely.
The SCOPE project also examined life-cycle emissions for various liquid biofuel pathways using the Greenhouse Gases, Regulated Emissions, and Energy Use in Transportation (GREET) life-cycle analysis model developed by the United States Department of Energy Argonne National Laboratory.19 For most pollutants, life-cycle emissions from biofuels were found to be slightly higher than those of gasoline. However, considering the small magnitude of the differences, the large variations in data, uncertainty and different feedstock and fuel production processes, the differences are not considered to be material. There are a few instances where biofuels had a small emissions advantage over petroleum fuels.
The GREET results are consistent with those estimated using the GHGenius LCA model. For E10 Blends, GHGenius estimates only minor differences (some increases, and some decreases) in conventional air pollutant emissions compared to gasoline. Health Canada has concluded that a change to E10 in Canada “would not substantially change the level of pollutants found in ambient air”.20
For biodiesel blends, GHGenius estimates generally higher emissions of NOx and PM (typically 20 to 30 per cent), and generally lower emissions of SOx and VOCs (typically two and three per cent lower), compared to petroleum diesel.
19 SCOPE, 2009.20 Health Risks and Benefits Associated with the Use of 10% Ethanol blended Gasoline, Health Canada, 2010.21 Regulatory Impact Analysis: Renewable Fuel Standard Program, U.S. EPA, 2007.22 Statistics Canada, 2011.

FUELS FOR LIFE — A Discussion on Canada’s Transportation Energy Choices34
Biodiesel (B100) also sells at premium to petroleum diesel. This premium varies over time, over the last three years it has typically been between 30 and 50 per cent, net of any tax and subsidy considerations.25 HDRD, which can be manufactured to have better low temperature properties, generally sells at an even higher premium.
Cost benefit analyses associated with the introduction of the federal Renewable Fuels Regulations are instructive on this point. The federal government estimates the net cost to the Canadian economy of the federal five per cent ethanol requirement to be $1.3 billion (present value) over 25 years.26 It estimates the net cost of the federal two per cent renewable diesel requirement to be $2.4 billion (present value) over 25 years.27
Performance
Liquid biofuels are rarely used as a stand-alone fuel; instead they are blended with gasoline or diesel. Since the properties of liquid biofuels are different from those of gasoline and diesel, the base gasoline and diesel blendstocks need to be carefully reformulated to ensure the resulting mix delivers the required fuel performance. Special handling and shipping are also required because of the chemical properties of liquid biofuels. Gasoline blendstocks suitable for ethanol blending are not marketable on their own. A minor disruption in the ethanol supply chain can result in the temporary loss of the entire gasoline pool.
Biodiesel production is a developing industry in Canada. Current Canadian production capacity is about 220 million litres per year.23 Most biodiesel produced in Canada today is produced from rendered animal fat. Recently implemented provincial and federal renewable diesel mandates as well as the increasing U.S. EPA RFS-2 mandate will drive expansion in Canadian biodiesel production capacity, especially from oil crops like canola. Hydrogen derived renewable diesel (HDRD) currently is not produced in Canada.
Cost
On an energy equivalent basis, ethanol is more expensive than gasoline. In 2009, 2010 and 2011, ethanol (E100) was typically priced at about a 75 per cent premium to gasoline, net of any tax and subsidy consideration,24 and the premium has at times been higher than 100 per cent. At low ethanol concentrations, the additional cost for gasoline would be modest. However, if ethanol was substituted for gasoline at higher volumes, costs to consumers per kilometre travelled would increase (because a litre of fuel would not contain as much energy as the gasoline it was displacing) and fill-ups would be more frequent.
According to the 2012 Fuel Consumption Guide produced by Natural Resources Canada, a 2012 Buick Lacrosse driven 20,000 kilometres in one year consumes 1,980 litres of gasoline. Driving that car 20,000 kilometres with E85 consumes 2,780 litres. The additional annual fuel cost for E85, at current retail prices (Ottawa, February 2012, totals $924.
About one third of the corn grown and harvested in the United States is destined as feedstock for ethanol production.
23 Canadian Renewable Fuels Association, 2010.24 Energy Management Institute Alternative Fuels Index. Note: This is U.S. price data. No corresponding data for Canadian ethanol
prices is collected on a regular basis. However, given the open trade in ethanol between Canada and the U.S., this U.S. price data is considered highly representative of Canadian ethanol prices.
25 Energy Management Institute Alternative Fuels Index.26 Federal Renewable Fuels Regulations, Canada Gazette Part II, Vol. 144, no 18, 1 September 2010.27 Regulations Amending the Federal Renewable Fuels Regulations, Canada Gazette Part II, Vol. 145, no 15, 20 July 2011.

FUELS FOR LIFE — A Discussion on Canada’s Transportation Energy Choices 35
0.0
0.5
1.0
1.5
2.0
2.5
3.0
3.5
4.0
4.5
5.0
Jul 2
1/11
Jun 9
/11
Apr 21
/11
Mar 10
/11
Jan 2
7/11
Dec 9/
10
Oct 21
/10
Sept 9
/10
Jul 2
9/10
Jun 1
7/10
May 6/
10
Mar 25
/10
Feb 11
/10
Dec 17
/09
Oct 29
/09
Sept 1
7/09
Aug 6/
09
June
25/09
May 14
/09
April 2
/09
Feb 19
/09
Jan.
8/09
Price
(U.S
. doll
ars/g
allon
)
B100 #2 Diesel B2
Note: Prices are weekly averages and are wholesale values posted by suppliers that include only freight. No tax or subsidy considerations are made.
Source: Energy Management Institutes Alternative Fuels Index.
FIgURE 21: BIODIESEl VS. REgUlAR DIESEl, 2009–2011 (CANADA)
0.0
0.5
1.0
1.5
2.0
2.5
3.0
3.5
4.0
4.5
5.0
Jul 2
1/11
Jun 9
/11
Apr 21
/11
Mar 10
/11
Jan 2
7/11
Dec 9/
10
Oct 21
/10
Sept 9
/10
Jul 2
9/10
Jun 1
7/10
May 6/
10
Mar 25
/10
Feb 11
/10
Dec 17
/09
Oct 29
/09
Sept 1
7/09
Aug 6/
09
June
25/09
May 14
/09
April 2
/09
Feb 19
/09
Jan.
8/09
Price
(U.S
. doll
ars/g
allon
)
E100 Regular unleaded gasoline Gasoline equivalent price
Note: Prices are weekly averages and are wholesale values posted by suppliers that include only freight. No tax or subsidy considerations are made. Gasoline Equivalent Price: converts the price of fuels to BTU-equivalent price of that fuel (i.e. how much money would it cost to buy enough ethanol to equal the energy in a gallon of gasoline.
Source: Energy Management Institutes Alternative Fuels Index.
FIgURE 22: EThANOl VS. REgUlAR UNlEADED gASOlINE, 2009–2011 (U.S.)

FUELS FOR LIFE — A Discussion on Canada’s Transportation Energy Choices36
low sulphur diesel (lSD) and biodiesels at 24°C and -9.64°C
Ethanol contains about two thirds of the energy content of an equivalent volume of gasoline (see chart for energy density comparisons). This means more frequent fill-ups. Biodiesel has only a slightly lower volumetric energy density than petroleum diesel, but has technical feasibility issues associated with its inherently poor low temperature properties. When it is cooled, crystals form and eventually it will gel, solidify and clog fuel lines and filters. This poses significant operational challenges in Canada’s climate, with costly implications for fuelling infrastructure and choice of diesel blendstock. The infrastructure challenges for biodiesel in Canada were highlighted in the federal government-led National Renewable Diesel Demonstration Initiative.28
28 National Renewable Diesel Initiative Infrastructure Project, Eco Resources Consultants, 2010.
0
20,000
40,000
60,000
80,000
100,000
120,000
140,000
160,000
B100DieselE85E100Gasoline
Ener
gy co
nten
t (Bt
u/gall
on)
FIgURE 23: ENERgY CONTENT COMPARISONS (U.S. DEPARTMENT OF ENERgY)

FUELS FOR LIFE — A Discussion on Canada’s Transportation Energy Choices 37
CNG is formed by compressing natural gas to pressures in the range of 3,000 to 3,600 pounds per square inch (psi).30 This compression reduces the volume by a factor of 300 compared with natural gas at normal temperature and pressure.
On board a vehicle CNG is stored in cylinders, and passes through a pressure regulator into a spark ignited or compression ignition engine.
LNG is made by cooling the natural gas to -162oC. This process reduces the volume by a factor of 600 compared with natural gas at normal temperature and pressure.31 LNG is stored on vehicles in a double walled steel tank and vapourized before injection into the engine.
2.5.1 Environmental performance
ghg emissions
Natural gas processing requires only the removal of impurities, thus it is less energy intensive to produce than the refining of gasoline and diesel. Natural gas is composed predominantly of methane, which has the lowest carbon content of any fossil fuel, resulting in lower CO2 tailpipe emissions compared to gasoline and diesel.
Overall CNG offers a GHG emissions reduction potential similar to that of hybrid vehicles at similar cost.32
Typically, natural gas offers a 20–30 per cent reduction in GHG emissions compared to gasoline and diesel, on a full well-to-wheels basis.
Vehiclefleet/technology/ infrastructure issuesBecause liquid biofuels are blended in gasoline and diesel for use in existing vehicles, there are few vehicle fleet, technology and infrastructure challenges associated with their expanded use.
Most vehicles are limited to gasoline blends containing a maximum of 10 per cent ethanol (E10). Specially equipped vehicles designated as Flex Fuel Vehicles can use blends containing up to 85 per cent ethanol (E85).
Most diesel engine manufacturers allow FAME biodiesel blends up to five per cent. Newer engines can generally run on higher blends but many older vehicles cannot. The cold flow properties of biodiesel create challenges for biodiesel blending. Fuel suppliers will generally only blend it in the warmer months. Even then it requires significant infrastructure investment in special heated storage and blending facilities to ensure biodiesel blends meet consumer fuel quality expectations and operational requirements.
2.5 Natural gas
Natural gas, which is predominantly methane, can be compressed (CNG) or liquefied (LNG) for use as a vehicle fuel. While there are more than 10 million natural gas powered vehicles on the road around the world, the use of natural gas as transportation fuel accounts for only one per cent of total vehicle fuel consumption worldwide.29
29 Natural Gas Use in the Canadian Transport Sector, Deployment Roadmap, Canadian Natural Gas Vehicle Alliance (CNGVA), 2010. 30 CNGVA, 2010.31 Fuel Choices for Advanced Vehicles, American Petroleum Institute (API), 2006. 32 Powering Autos to 2020: The Era of the Electric Car?, The Boston Consulting Group, July 2011.

FUELS FOR LIFE — A Discussion on Canada’s Transportation Energy Choices38
2.5.2 Commercial/consumer issues
Availability and cost
Natural gas is in abundant supply in North America, and on an energy-equivalent basis costs less than gasoline and diesel. Recent advances in drilling technology and the promise of releasing natural gas from shale formations suggest that this price discount will continue for the foreseeable future.34 As shown in the chart below, the U.S. EIA projects that natural gas will cost less than a third of crude oil on an energy equivalent basis through 2035.
Performance
Natural gas has a high octane rating and can be used in spark-ignition engines for both light duty and heavy duty vehicle applications. Natural gas can also be used as a fuel for compression ignition engines. Dedicated natural gas vehicles run only on natural gas. Dual fuel vehicles can run on either
Conventional Air Pollutants (CAP) emissions
The life-cycle emissions of conventional air pollutants from natural gas used as a transportation fuel are lower than those of both gasoline and diesel. For light duty vehicle emissions compared to gasoline, emissions are reduced by four per cent for NOx, 78 per cent for SOx, 87 per cent for VOCs and 33 per cent for PM. 33
For diesel powered, heavy duty trucks and buses, natural gas delivers emissions reductions of 60 per cent for NOx, 75 per cent for SOx, 38 per cent for VOCs and 82 per cent for PM.
33 GHGenius version 3 19a. 34 CNGVA, 2011.
2009History Projections
2035
2025
2015
2009
2000
1990
0
1
2
3
4
Source: Annual Energy Outlook 2011, U.S. EIA, April 2011.
FIgURE 24: RATIO OF lOW-SUlPhUR lIghT CRUDE OIl PRICE TO hENRY hUB NATURAl gAS PRICE ON AN ENERgY EQUIVAlENT BASIS, 2009–2035

FUELS FOR LIFE — A Discussion on Canada’s Transportation Energy Choices 39
There are no original equipment manufacturer (OEM) cars and light duty truck NGVs currently available in Canada. Conversion packages from U.S. “upfitters” cost $12,000 to $15,000. Natural gas engines are available as options from an estimated 15 North American truck and bus manufacturers; the number of models available to end users is limited and come at a price premium of $35,000 to $60,000.
In its recent assessment of the prospects of alternative vehicles, The Conference Board of Canada concluded that “the outlook for greater take-up of NGVs in the light duty segment of the market is limited”.37 The Board does not expect NGVs to play more than a modest role in the light duty market segment in the foreseeable future. Work completed by the Natural Gas Use in Transportation Roundtable38 found medium to heavy duty vehicles that operate in return-to-base fleets or in specific high density transportation corridors offer the most potential for fuel switching to natural gas. Operating risks associated with costs and technology performance, high upfront vehicle costs, a lack of widespread infrastructure, and other non-economic issues represent significant challenges to greater NGV deployment in Canada.
natural gas or conventional fuel. Dedicated natural gas vehicles perform better because their engines are optimized to operate on natural gas. The Centre for Climate and Energy Solutions (formerly the Pew Centre on Global Climate Change) estimates that a dedicated CNG vehicle will obtain about the same fuel economy, on a gasoline equivalent basis, as an otherwise identical gasoline fuelled vehicle.35
On an equivalent volume basis, CNG stored in a vehicle tank has about one-quarter the energy content of gasoline, which limits driving range compared to a gasoline vehicle. LNG is denser and has greater energy content (about 70 per cent of gasoline by volume). LNG is a much more expensive application because of the cost of the cryogenic system and the safety risks associated with venting the tank when the vehicle is parked for extended periods of time. LNG applications are generally limited to heavy-duty trucks and buses.
Vehiclefleet/technology/ infrastructure issues
There are only about 12,000 natural gas powered vehicles in use today in Canada.36 About 9,450 are light duty cars and trucks; 2,450 are forklifts and ice rink re-surfacers; 300 are heavy-duty trucks.
The existing refuelling infrastructure is limited to a few public CNG refuelling sites in major cities (e.g. 50 in Vancouver and Toronto) and a smaller number of private fleet CNG refuelling facilities. Currently there are no dedicated vehicle LNG fuelling facilities in Canada.
The upfront capital costs for vehicles and refuelling infrastructure represent a significant challenge for expansion of natural gas as a transportation fuel in Canada.
35 Reducing Greenhouse Gas Emissions from U.S. Transportation, Pew Center on Global Climate Change, 2011. 36 Are We Ready to Step Off the Gas? Preparing for the Impacts of Alternate Fuel Vehicles, Conference Board of Canada (CBoC), 2011.37 CBoC, 2011. 38 CNGVA, 2011.
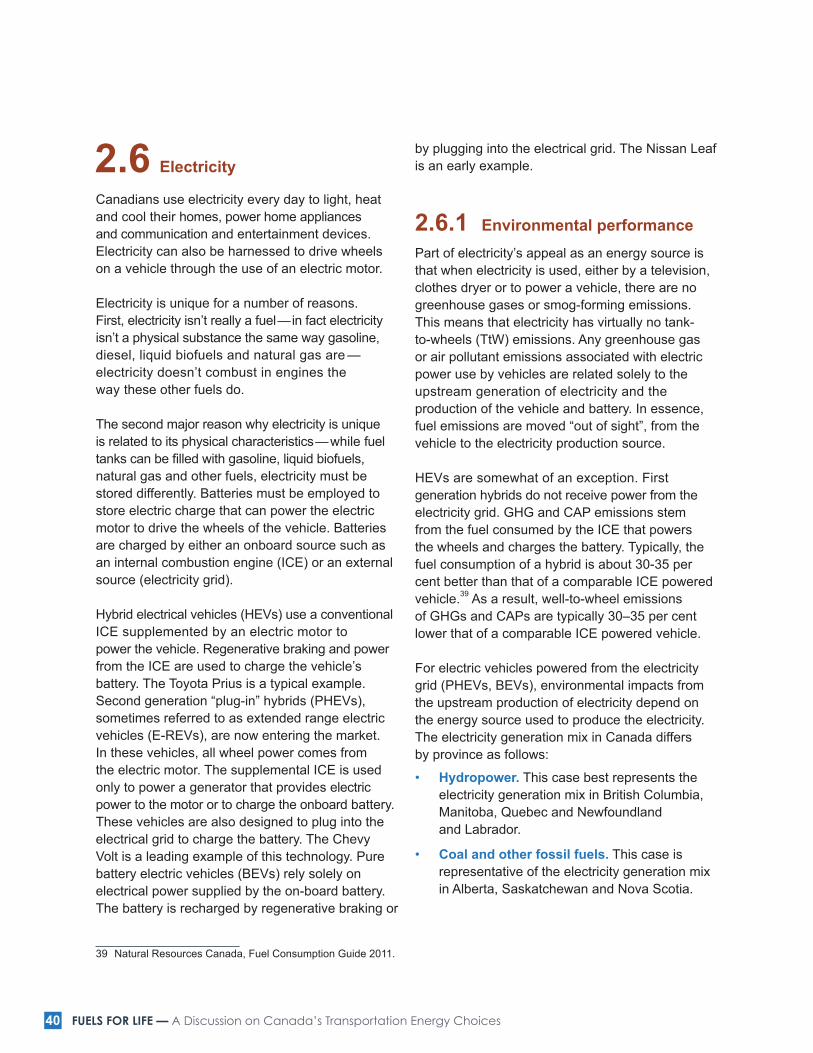
FUELS FOR LIFE — A Discussion on Canada’s Transportation Energy Choices40
by plugging into the electrical grid. The Nissan Leaf is an early example.
2.6.1 Environmental performancePart of electricity’s appeal as an energy source is that when electricity is used, either by a television, clothes dryer or to power a vehicle, there are no greenhouse gases or smog-forming emissions. This means that electricity has virtually no tank-to-wheels (TtW) emissions. Any greenhouse gas or air pollutant emissions associated with electric power use by vehicles are related solely to the upstream generation of electricity and the production of the vehicle and battery. In essence, fuel emissions are moved “out of sight”, from the vehicle to the electricity production source.
HEVs are somewhat of an exception. First generation hybrids do not receive power from the electricity grid. GHG and CAP emissions stem from the fuel consumed by the ICE that powers the wheels and charges the battery. Typically, the fuel consumption of a hybrid is about 30-35 per cent better than that of a comparable ICE powered vehicle.39 As a result, well-to-wheel emissions of GHGs and CAPs are typically 30–35 per cent lower that of a comparable ICE powered vehicle.
For electric vehicles powered from the electricity grid (PHEVs, BEVs), environmental impacts from the upstream production of electricity depend on the energy source used to produce the electricity. The electricity generation mix in Canada differs by province as follows:
• hydropower. This case best represents the electricity generation mix in British Columbia, Manitoba, Quebec and Newfoundland and Labrador.
• Coal and other fossil fuels. This case is representative of the electricity generation mix in Alberta, Saskatchewan and Nova Scotia.
2.6 Electricity
Canadians use electricity every day to light, heat and cool their homes, power home appliances and communication and entertainment devices. Electricity can also be harnessed to drive wheels on a vehicle through the use of an electric motor.
Electricity is unique for a number of reasons. First, electricity isn’t really a fuel — in fact electricity isn’t a physical substance the same way gasoline, diesel, liquid biofuels and natural gas are — electricity doesn’t combust in engines the way these other fuels do.
The second major reason why electricity is unique is related to its physical characteristics — while fuel tanks can be filled with gasoline, liquid biofuels, natural gas and other fuels, electricity must be stored differently. Batteries must be employed to store electric charge that can power the electric motor to drive the wheels of the vehicle. Batteries are charged by either an onboard source such as an internal combustion engine (ICE) or an external source (electricity grid).
Hybrid electrical vehicles (HEVs) use a conventional ICE supplemented by an electric motor to power the vehicle. Regenerative braking and power from the ICE are used to charge the vehicle’s battery. The Toyota Prius is a typical example. Second generation “plug-in” hybrids (PHEVs), sometimes referred to as extended range electric vehicles (E-REVs), are now entering the market. In these vehicles, all wheel power comes from the electric motor. The supplemental ICE is used only to power a generator that provides electric power to the motor or to charge the onboard battery. These vehicles are also designed to plug into the electrical grid to charge the battery. The Chevy Volt is a leading example of this technology. Pure battery electric vehicles (BEVs) rely solely on electrical power supplied by the on-board battery. The battery is recharged by regenerative braking or
39 Natural Resources Canada, Fuel Consumption Guide 2011.

FUELS FOR LIFE — A Discussion on Canada’s Transportation Energy Choices 41
As the chart shows, electric vehicles do have the potential to reduce full life-cycle greenhouse gas emissions from vehicles, except for jurisdictions like Alberta that rely on coal and other fossil fuels for their electricity generation.
A vehicle powered by electricity generated predominantly from coal produces higher life-cycle GHG emissions than a comparable gasoline powered vehicle.
Conventional air pollutants
As with greenhouse gases, there are no smog-forming emissions resulting from vehicle operation — rather the emissions occur upstream, from electricity generation and from production of the battery. While electricity generation from hydropower does not result in any significant emissions of
• A mix of fuels. This case represents the electricity generation mix in Ontario and New Brunswick, where a variety of generation technologies, including nuclear, hydropower, fossil fuels, solar and wind are employed.
The extent to which electric vehicles can achieve environmental gains is dependent on the emissions profile of the electricity system.
ghgs
Figure 25 shows the achievable GHG emissions (% reductions of grams of CO2 per kilometre) from gasoline baseline for HEVs, PHEVs and EVs. The PHEV reduction is based on the average overall Canadian generation mix. For EVs reductions are shown by region/province and the average overall Canadian generation mix.
-90
-80
-70
-60
-50
-40
-30
-20
-10
0
10
EV Can
ada*
EV B.C
./Yuk
on
EV Alberta
EV Sas
katch
ewan
EV Man
itoba
EV Onta
rio
EV Que
bec
EV Atlanti
c reg
ion
PHEV – 50
/50 C
anad
a*
Diesel
hybri
d
Gasoli
ne hy
brid
% change in gm/km life-cycle GHG emissions from gasoline baseline
Source: GHGenius 3.19 a.
*Canada average generation mix.
FIgURE 25: ghg REDUCTIONS FROM ElECTRIC VEhIClES

FUELS FOR LIFE — A Discussion on Canada’s Transportation Energy Choices42
For the Chevy Volt, EPA data shows a city/ highway combined electricity consumption of 22.3 kWh/100 km.45 This equates to a fuel cost of between $2.35 and $2.55 to drive 100 kilometres (in electric only mode). This compares with a Canadian average cost of $7.05 to drive 100 kilometres in a gasoline powered compact (calculated using 2011 Canadian average gasoline price when taxes are equalized).
Federal and provincial gasoline taxes are a significant portion of the retail price of gasoline. Comparable taxes are not currently levied on electricity. Unless governments are prepared to forgo substantial tax revenue in the future, any significant electrification of the vehicle fleet will likely lead to new taxes on electricity, which will narrow the gap between gasoline and electricity as a vehicle fuel.
Performance
Battery performance is the most significant performance issue for electricity powered vehicles. There are two dimensions to battery performance — the distance that can be travelled on a full battery charge (range) and the time it takes to recharge the battery. While not an issue for HEVs, both dimensions are important to PHEVs (where the intent is to use power from the electric grid) and vital to BEVs (where the electric grid is the only source of electricity).
Today’s battery technology, coupled with trade-offs involving battery size and vehicle weight, means the range of most electric vehicles, either already on or coming to market, is under 160 kilometres.46 The U.S. EPA’s 2011 fuel economy ratings show a fully charged battery range for the Nissan Leaf and Chevy Volt of 117 km and 56 km, respectively.47
smog-forming pollutants or toxics, emissions from coal plants are the largest single source of mercury emissions.40 Coal-fired plants are also among the largest sources of NOx, SOx and particulate matter emissions.41
2.6.2 Commercial/consumer issues
Availability and cost
Electricity is widely used in Canada — only very remote communities are not connected to local or regional electricity distribution grids. Therefore, electricity has significant advantages compared to liquid biofuels or even natural gas, which have much more limited distribution channels.
Electricity demand growth caused by increased reliance on electricity as a transportation energy source carries with it implications for electricity supply. Over the last 20 years, there has been little expansion or development of Canada’s electricity supply. Transportation electricity demand growth would exacerbate an estimated need for $240 billion in electricity infrastructure investment by 2030 to renew and replace aging infrastructure and to meet future demand.42
Canada has some of the lowest electricity prices in the world, but prices vary by province and municipality. Data compiled by Manitoba Hydro shows a 2011 Canadian average electricity cost of about $0.105/kWh and $0.115/kWh, depending on monthly consumption.43
U.S. EPA data shows a city/highway combined electricity consumption of 21 kWh/100 km for the Nissan Leaf.44 This equates to a fuel cost of between $2.25 and $2.40 to drive 100 kilometres.
40 Pollution Probe Mercury Primer.41 National Pollutant Release Inventory, Environment Canada, 2009.42 International Energy Agency, World Energy Outlook 2008.43 Manitoba Hydro, Utility Rate Comparisons, May 2011.44 U.S. EPA Fuel Economy Ratings, 2011.45 Ibid.46 Pollution Probe, Electric Mobility Masterplan for the City of Toronto, October 2010.47 U.S. EPA Fuel Economy Ratings.

FUELS FOR LIFE — A Discussion on Canada’s Transportation Energy Choices 43
Vehiclefleet/technology/ infrastructure issues
Few electric vehicles are on the road today in Canada. While first generation hybrids (HEVs) have been available for 10 years or more, today they comprise less than one per cent of the Canadian light duty vehicle fleet. PHEVs and BEVs are only now entering the market — the Chevy Volt and Nissan Leaf were released in Canada in 2011, but a limited number will be available for purchase in the near term. Typical fleet turnover rates suggest significant market penetration of electric vehicles will take years. Industry analyst J.D. Power & Associates forecasts combined global sales of hybrids and electrical vehicles will be 7.3 per cent of total global passenger vehicle sales in 2020.49
Significant market penetration of electricity as a transportation fuel faces major challenges, largely consumer acceptance. In a recent report,50 J.D. Power & Associates confirmed the following consumer acceptance hurdles for electric vehicles:
• Range anxiety
• Support infrastructure
• Power and performance
• Fuel economy
• Limited battery life and replacement costs
• Overall cost of ownership
• Extensive time required to recharge battery packs
Current electric vehicle acquisition costs are high — as much as double that of a comparable conventional ICE vehicle (e.g Chevy Cruze Eco — $20,000, vs. Chevy Volt — $41,000).51 And while this price premium is expected to drop in coming years, looking ahead to 2030 the International Energy Agency and McKinsey & Company still see HEVs, PHEVs and BEVs
The issue of battery range is complicated further by the fact that batteries deteriorate over time and with cycling (charging and discharging of the battery). As such, the rated range of a vehicle at the time of purchase could decrease over the lifetime of the battery.
Battery performance and vehicle range is also affected by temperatures and climate conditions, which is particularly relevant to Canada. In cold weather conditions for example, battery performance is reduced, compounding the increased use of the battery for heating of the interior passenger cabin.48 Batteries in electric vehicles also operate air conditioning, power steering, defrosting and defogging windows, radios, GPS and other electrically operated components.
With respect to charging duration, current technology requires a recharging time significantly longer than that needed to refuel an internal combustion engine vehicle with gasoline. Generally, charging duration for BEVs is longer than that required for PHEVs. Using 220 volt household current cuts the charging time in half or less compared to charging using 110 volt household current (see chart below).
FIgURE 26: ChARgINg TIMES FOR BATTERY ElECTRIC VEhIClES
(BEVS) AND PlUg IN hYBRID ElECTRIC VEhIClES (PhEVS)
Vehicle 110 volts, standard household outlet
220 volts, available at households
Battery electric vehicle
21.0 7.5
Plug-in hybrid electric vehicle
6.0 3.0
Source: Ford Motor Company
Conference Board of Canada, 2011.
48 CBoC, 2011.49 Future Demand for Hybrid and Battery Electric Vehicles May be Over-Hyped: Wild Card is China, J.D. Power & Associates, 2010.50 Drive Green, J.D. Power & Associates, 2010.51 CBoC, 2011.

FUELS FOR LIFE — A Discussion on Canada’s Transportation Energy Choices44
Some governments (e.g. Ontario, B.C. and Quebec) currently offer rebates or tax incentives to purchasers of electric vehicles. However, the incentives fall short of eliminating the price premium consumers face when considering an electric vehicle purchase.
Charging infrastructure will also take time and funding to develop and deploy. While there is a robust electricity distribution network throughout Canada, there is little actual infrastructure for charging vehicles. A typical home charging station currently costs $2,000 or more.56 Few public charging stations currently exist. The costs of establishing a network of public charging stations will be significant.
costing, respectively, $2,500, $4,900 and $8,100 more than comparable conventional ICE powered vehicles (Euro converted to $CDN at 1.4).52
The International Energy Agency offers a more aggressive scenario, suggesting significant growth in the sales of electric vehicles after 2015, and a near 90 per cent market share of new vehicle sales for new technology vehicles by 2050.53
The Boston Consulting Group concludes the electric car faces substantial market challenges based on its high total cost of operation and questions about battery durability and the establishment of the required charging infrastructure.54
According to a 2012 KPMG poll, auto executives expect electric car sales will not exceed 16 per cent of annual global auto sales before 2025.55 Industry executives in the United States and Western Europe expect even lower adoption rates, projecting electric vehicles will only account for six to 10 per cent of global annual auto sales. Adam Jonas, a Morgan Stanley analyst, concluded that EVs were “not ready for prime time,” and reduced his expectation of their market penetration in 2025 to 4.5 per cent from 8.6 per cent before.
52 Pathways to a Low Carbon Economy, McKinsey & Company, 2009.53 Technology Roadmap, Electric and plug-in hybrid electric vehicles, International Energy Agency, 2011.54 Powering Autos to 2020: The Era of the Electric Car?, The Boston Consulting Group, July 2011.55 Global Automotive Executive Survey 2012, KPMG.56 Consumer Reports, September 3, 2010.

Fuels FOR lIFe — A Discussion on Canada’s Transportation Energy Choices 45
Sound policy-making demands a thorough understanding of the options and their implications. This section provides a summary analysis to enable the reader to do a side-by-side comparison of the different fuels.
COMpaRInG The alTeRnaTIVes3
ghg emissions comparison
On a full life-cycle basis, all transportation fuel use produces some GHG emissions. Figures 28 and 29 (light duty vehicles and heavy duty vehicles respectively) provide GHG emissions comparisons for the fuels that are the focus of this document. For light duty vehicles (passenger cars and light trucks), Figure 28 shows the per cent reduction in grams per kilometre of GHG emissions compared to gasoline. For heavy duty vehicles (trucks and buses), Figure 29 shows the per cent reduction in grams per kilometer of GHG emissions compared to petroleum diesel. Data for the charts is derived from GHGenius. For fuels with multiple feedstock/production pathways (e.g. ethanol, biodiesel) an average reduction is provided. PHEV and EV emissions reductions are based on the average overall Canadian electricity generation mix.
Energy density comparison
Energy density can be expressed as density by unit of volume (volumetric), or by unit of mass (gravimetric). Energy density is an important attribute for transportation fuels. The higher the energy density of the fuel, the more energy may be stored or transported for the same amount of volume and/or mass. For vehicles, the volumetric measure of energy density is generally more important because the space taken up by the fuel takes away from the space that can be used for passengers and and/or transporting goods.
0
2
4
6
8
10
12
14
16
Lithium-ionbattery(future)
Lithium-ionbattery
(present)
NiMHbattery
LNGCNGBiodieselEthanolDieselGasoline
kWh/kg (gravimetric) kWh/litre (volumetric)
Gasoline – kWh/kg
Gasoline – kWh/litre
Source: American Physical Society and U.S. Department of Energy.
FIgURE 27: ENERgY DENSITY COMPARISON BY WEIghT AND VOlUME OF AlTERNATIVE FUElS COMPARED TO gASOlINE

FUELS FOR LIFE — A Discussion on Canada’s Transportation Energy Choices46
-70
-60
-50
-40
-30
-20
-10
0
BEVCanada*
PHEV50/50
Canada*
Dieselhybrid
Gasolinehybrid
Naturalgas
B5DieselE10
Source: GHGenius 3.19 a.
*Canada average generation mix.
% reduction in gm/km life-cycle GHG emissions from gasoline baseline
-35
-30
-25
-20
-15
-10
-5
0
Diesel hybridNatural gasB5Source: GHGenius 3.19 a.
% reduction in gm/km life-cycle GHG emissions from diesel baseline
FIgURE 28: lDV lIFE-CYClE ghg EMISSIONS FOR VARIOUS TRANSPORTATION FUElS
FIgURE 29: hDV lIFE-CYClE ghg EMISSIONS FOR VARIOUS TRANSPORTATION FUElS

FUELS FOR LIFE — A Discussion on Canada’s Transportation Energy Choices 47
emissions. Accordingly, the PHEV and HEV emission reductions are for hydro-generated electricity only and thus overestimate the reductions for regions/provinces that rely on other generation modes for part of all of their electricity generation. Figure 31 shows the per cent change (increase or decrease) in grams per kilometre of emissions for heavy duty vehicles (HDV) of the four most relevant pollutants, compared to petroleum diesel.
Conventional Air Pollutants (CAP) comparisons
Figures 30 and 31 use data from GHGenius to compare conventional air pollutant emissions for various fuel options. Figure 30 shows the per cent change (increase or decrease) in grams per kilometre of emissions for light duty vehicles (LDV) for the four most relevant pollutants, compared to gasoline. No regional/provincial electricity generation mix data is available for conventional air pollutant
-100
-80
-60
-40
-20
0
20
PMVOCsSOxNOx
EV*PHEV50/50*
Dieselhybrid
Gasolinehybrid
Natural gas(CNG)
B5DieselE10
Source: GHGenius 3.19 a.
*Hydro generated electricity.
% change in gm/km life-cycle air pollutant emissions from gasoline baseline
FIgURE 30: lDV lIFE-CYClE AIR POllUTANT EMISSIONS FOR VARIOUS TRANSPORTATION FUElS

FUELS FOR LIFE — A Discussion on Canada’s Transportation Energy Choices48
(and fuels). The charts (Figure 32, Figure 33 and Figure 34) are examples of available cost comparisons. Figure 34 compares costs in the context of GHG emissions reduction potential.
Comparison on commerical/ consumer implications
Quantitative comparisons of the full range of commercial and consumer aspects and implications for future fuel choice alternatives are not possible. Quantitative comparisons are available with respect to relative costs for vehicles utilizing different propulsion technologies
-80-70-60-50-40-30-20-10
0102030
Natural gas (CNG)Diesel hybridB5
PMVOCsSOxNOx
Source: GHGenius 3 19a.
% change in gm/km life-cycle air pollutant emissions from diesel baseline
FIgURE 31: hDV lIFE-CYClE AIR POllUTANT EMISSIONS FOR VARIOUS TRANSPORTATION FUElS
Vehicle Type Car Light TruckGasoline ICE retail price $21,600 $23,400Diesel $23,300 $25,500Turbo Gasoline $22,300 $24,200Hybrid $26,600 $26,600Plug-in Hybrid $27,500 $31,700Battery Electric $36,000 $45,500Source: On the Road in 2035, MIT, 2008.
FIgURE 32: INCREMENTAl 2035 RETAIl PRICE COMPARISON OF FUTURE PROPUlSION TEChNOlOgIES ($U.S. 2007)

FUELS FOR LIFE — A Discussion on Canada’s Transportation Energy Choices 49
0
5,000
10,000
15,000
20,000
25,000
30,000
35,000
40,000
45,000
50,000
Light truckCar
Battery electricPlug-in hybridHybridTurbo gasolineDiesel
Gasoline ICE retail price – light truck
Gasoline ICE retail price – car
2007$
FIgURE 33: INCREMENTAl 2035 RETAIl PRICE COMPARISON OF FUTURE PROPUlSION TEChNOlOgIES ($U.S. 2007)
Vehicle Abatement potential Incremental purchase price over base vehicle
Gasoline — base vehicle n.a. n.a.Gasoline — maximum ICE improvement 39 1,600Gasoline — full hybrid 44 1,800Gasoline — plug-in hybrid 38–62 3,500Diesel — base vehicle n.a. n.a.Diesel — maximum improvement 35 900Diesel — full hybrid 46 1,800Diesel — plug-in hybrid 38–63 2,800Compressed natural gas 66 1,900Electric vehicles 22–97 5,800Source: Are we Ready to Step Off the Gas? Preparing for the Impacts of Alternate Fuel Vehicles, Conference Board of Canada, 2011
FIgURE 34: ghg ABATEMENT POTENTIAl AND INCREMENTAl PURChASE PRICE COMPARISON

FUELS FOR LIFE — A Discussion on Canada’s Transportation Energy Choices50
alternatives were assessed as either comparable to or better than gasoline and/or diesel (green), offering modest disadvantages/ impediments compared to gasoline and/or diesel (yellow), or posing significant disadvantages/ impediments compared to gasoline and/or diesel (red). These comparisons are shown in Figure 35 below.
For those criteria for which reliable quantitative comparisons were not possible, qualitative assessments comparing alternative fuels to gasoline and diesel were undertaken, using a “traffic light” approach. These comparisons span the full range of commercial/consumer issues discussed in this report. For each criterion,
Fuels Availability Fuel Cost Performance Infrastructure and Vehicle Implications
Petroleum Gasoline Commercially available
Baseline for cost comparison
Fuel of choice for millions of vehicles
Established infrastructure, wide vehicle choice
Diesel Commercially available
Baseline for cost comparison
Fuel of choice for millions of vehicles
Established infrastructure, wide vehicle choice
Liquid Biofuels
1st Generation Ethanol (corn, wheat, etc.)
Commercially available at 5–10% volume of gasoline)
~50% premium over gasoline
Lower energy content — more frequent fill-ups
Minimal implications at blends up to 10%
2nd Generation Ethanol (cellulosic)
Not yet commercially available
Uncertain costs as not yet available commercially
Lower energy content — more frequent fill-ups
Minimal implications at blends up to 10%
Biodiesel (FAME)
Commercially available in limited volumes
~30–50% premium over petroleum diesel
Poor low temperature properties
Some infrastructure issues associated with cold flow properties
2nd Generation Renewable Diesel (HDRD)
No production in Canada
>30–50% premium over petroleum diesel
Broadly substitutable for petroleum diesel
Minimal implications
Natural Gas
CNG Commercially available
Less expensive on a per km basis
Broadly substitutable for gasoline and diesel
Large infrastructure and vehicle investments needed
LNG Limited availability Less expensive on a per km basis
Broadly substitutable for gasoline and diesel
Large infrastructure and vehicle investments needed
Electricity Hybrid (HEV) Commercially available
Less expensive on a per km basis
Good performance Modest vehicle cost premium
Plug-in Hybrid (PHEV)
Limited vehicle availability
Less expensive on a per km basis
Limited vehicle range on electricity only
Infrastructure and high vehicle cost premium.
Battery Electric (BEV)
Limited vehicle availability
Less expensive on a per km basis
Very limited vehicle range
Infrastructure and high vehicle cost premium.
FIgURE 35: QUAlITATIVE COMPARISON OF COMMERCIAl/CONSUMER ISSUES RElATIVE TO gASOlINE/DIESEl
Green Comparable to or better than gasoline and/or diesel.Yellow Modest disadvantages/impediments compared to gasoline and/or diesel.Red Significant disadvantages/impediments compared to gasoline and/or diesel.

FUELS FOR LIFE — A Discussion on Canada’s Transportation Energy Choices 51
What are the implications of all this information for policy-makers?
First, the stakes are high. Transportation, and the essential mobility of people and goods it delivers, is vital to our economic and social well-being. Canadians are among the highest per capita consumers of transportation fuels in the world, second only to the United States. This should come as no surprise as we live in the second largest country in the world, with a relatively small population stretched over more than nine million square kilometres. It’s important that we make the right policy and regulatory choices.
COnClusIOn — IMplICaTIOns FOR pOlICY-MakeRs4
Fifth, policy choices should be made based on clearly stated policy objectives, and these choices should be based on objective, science-based data. There is a real need for better data comparing all transportation fuels on a full life-cycle basis to allow for choices based on scientific fact.
Sixth, more efficient use of current fuel resources and fuel conservation should not be overlooked as solutions to the environmental challenges of transportation, especially GHG emissions. Optimizing the efficiency of conventional vehicles is potentially the lowest cost alternative to reducing transportation GHG emissions.
Second, making choices about Canada’s future transportation fuels is complex. There is no quick-fix solution for fuelling a reliable, affordable, and environmentally sustainable transportation system in the coming years. The goals of reliability, affordability and environmental sustainability can be in conflict. Competing demands mean that prioritization and trade-offs will be required.
Third, gasoline and diesel, our principal transportation fuels, have served us well for the past 100 years and continue to do so today. Markets have determined them to be the best energy sources to meet our transportation demands and they will likely represent a large portion of the transportation fuel mix for years to come. They are safe, convenient, reliable and affordable fuels that deliver on a demanding set of expectations related to engine/vehicle performance. The environmental performance of these fuels, and that of the processes by which they are produced, have steadily improved.
Fourth, alternatives to gasoline and diesel all have characteristics that make them more or less suited to use as a transportation fuel. There is no single metric by which they can be assessed. The issues are complex and multifaceted. Many factors come into play in determining the relative merits of alternative fuels.

FUELS FOR LIFE — A Discussion on Canada’s Transportation Energy Choices52
4.1 A suggested checklist for policy-makers
Given the complexity of the issue, we thought it might be helpful to have a “checklist” readily available to help simplify the policy-making process. This is a user friendly series of questions adapted from the Nine Challenges of Alternative Energy57 specific to the assessment of fuel choices for Canada’s future.
Scalability and timing of alternative fuels
¨ Is the new energy source scalable? Example: Cellulosic ethanol producers continue to work on a number of technical barriers for this option to become economically viable. While considerable progress has been made, there are no commercial scale facilities in existence and no large scale cultivation of cellulosic biomass for fuel production purposes as yet. The promise of cellulosic ethanol at the scale required to substantially displace gasoline is years away.
¨ Can it be produced in large enough quantities to satisfy consumer demand and in a timely fashion?
Commercialization
¨ At what pace can Canada transform the transportation fuels supply mix?
Example: In the 1990s California legislators attempted to force zero emission vehicles (ZEV) into the market through regulation. The effort failed because electric vehicle technologies upon which the ZEV standard was based were far from being commercially viable.
¨ Is the reliability of supply jeopardized?
¨ Will consumer confidence be undermined?
¨ Will the changes impose unaffordable costs on consumers?
¨ How much will the new fuel delivery infrastructure cost and how long will it take to build?
Substitutability
¨ Will the alternative fuel meet consumer expectations for performance, availability, sustainability and affordability?
Example: Ideally, an alternative transportation fuel would integrate directly into the fuel system as a “drop-in” substitute for either gasoline or diesel. Fuel switching to natural gas and/or electricity will require significant changes to the vehicle fleet, deployment of new fuelling and/or recharging infrastructure, and for electricity growth in generation and transmission facilities to supply the additional electricity demand. Electric vehicles also face significant hurdles with respect to consumer expectations of vehicle/battery performance and vehicle cost of ownership.
¨ Will it be safe, reliable and convenient?
¨ Will the alternative fuel require a radically different vehicle fleet and/or a new fuel distribution infrastructure?
Those tasked with taking Canada’s future transportation energy policy forward have a difficult challenge ahead. CPPI acknowledges this and as an important player and committed contributor to Canada’s energy future, we have prepared “Fuels for Life” to help assist and guide policy-makers as they confront the challenges in ensuring Canada continues to move ahead in both an economic and sustainable way. It is our hope that “Fuels for Life” will become a valuable “tool” for policy experts. The stakes are high and CPPI shares the responsibility in helping government find the best way forward to assuring Canada’s future transportation needs.
57 The Nine Challenges of Alternative Energy, The Post Carbon Reader Series: Energy, Post Carbon Institute, 2010.

FUELS FOR LIFE — A Discussion on Canada’s Transportation Energy Choices 53
Material input requirements
¨ Will the type and volume of the resources and energy needed limit the scalability and affect the cost and feasibility of an alternative?
Example: A consequence of low energy density is that larger amounts of material resources are required for the same amount of energy as a denser material or fuel. The main alternatives to gasoline and diesel are lower in energy density. Large scale deployment of alternative fuels poses significant land use challenges. If 100 per cent of Canada’s wheat crop was used to produce ethanol, it would satisfy about 14 per cent of Canada’s gasoline demand.
¨ Can greatly increased demand for this alternative be accommodated?
¨ At what cost?
Environmental impacts
¨ What is the complete environmental footprint of the alternative fuel?
Example: This document has focussed on air emissions — both GHGs and conventional air pollutants. However, fuel production and use creates other environmental impacts. A full environmental sustainability assessment of fuel choices must include all impacts. For example, the extraction and processing of oil sands crude, increasingly used as feedstock to produce gasoline and diesel, is often targeted by environmental interests for its water, land and biodiversity impacts. Yet, the production of biofuels consumes far more water than that required to produce gasoline or diesel. Moreover, the impacts on land from biofuel feedstock production and the corresponding impact on water, soil quality, and biodiversity are likely not insignificant and should be accurately quantified.
¨ Can the alternative deliver better environmental performance on a full life-cycle basis?
¨ Have impacts on air, water, land and biodiversity been assessed?
¨ Is the alternative suitably sustainable to be used broadly as a partial or full replacement for fossil fuels?
Costs
¨ Have benefits and costs been adequately considered?
Example: The Regulatory Impact Analysis Statement (RIAS) for the recently implemented federal Renewable Fuel Regulations calculates a net cost to the economy of $3.7 billion over 25 years. Based on the projected GHG emissions avoided, this equates to a GHG emission avoidance cost of $80/tonne for the ethanol component and $125/tonne for the renewable diesel component. Each of these avoidance costs is substantially higher than the projected price of carbon is envisaged in various carbon pricing systems under consideration in various Canadian and international jurisdictions.
¨ Do benefits outweigh costs?
¨ Is this the most cost-effective method to achieve the desired outcomes?
Efficiencyandconservation
¨ What is the relative importance of new energy supplies versus more efficient use of current energy resources and energy conservation?
Example: Research suggests that at constant performance and size, a 30–50 per cent reduction in fuel consumption (and emissions) of conventional light duty vehicles (cars) is feasible over the next 20–30 years.58 (Fuel consumption is mandated in the U.S. and Canada.) The Conference Board of Canada determined that optimizing the efficiency of conventional vehicles provides the lowest cost alternative for GHG emissions reductions for personal automobiles.59
58 On the Road in 2035: Reducing Transportation’s Petroleum Consumption and GHG Emissions, Laboratory for Energy
and Environment, Massachusetts Institute of Technology, July 2008.59 CBoC, 2011.

FUELS FOR LIFE — A Discussion on Canada’s Transportation Energy Choices54
4.2 Afinalword
Mobility is a vital enabler of economic activity and Canadians’ high standard of living. Moving people and goods underpins virtually everything we do — it is a fundamental enabler of economic activity, and an integral component of our social fabric that provides our citizens access to jobs, healthcare, education, recreation, goods and services and enables contacts with friends and family. This is true for any nation but especially true for Canada with our vast geography and dispersed population.
Since mobility is a vital feature of economic and social well-being, then it stands to reason the fuels that enable our mobility are equally vital. Ships, planes, trains, trucks and automobiles rely on a secure and reliable supply of affordable, fit-for- purpose fuels. Transportation accounts for nearly 30 per cent of Canada’s total energy consumption.
It’s important that we make the right choices about our transportation energy future. These choices also include consumer preferences and behaviours. Fragmented policies developed from a narrow point of view are no substitute for rigorous due diligence and a thorough understanding of fuel options and their implications, including unintended consequences. Our destination — a reliable, affordable and environmentally sustainable transportation system — is too important to be reached without detailed consideration.

FUELS FOR LIFE — A Discussion on Canada’s Transportation Energy Choices 55
appenDIX
Powering Autos to 2020. The Era of the Electric Car?The Boston Consulting Group, July 2011.
PrimeronAutomobileFuelEfficiency and EmissionsPollution Probe, November 2009.
Rapid Assessment on Biofuels and the EnvironmentScientific Committee on Problems of the Environment (SCOPE)International Council for Science, 2009.
World Energy Outlook 2011International Energy Agency, November 2011.
Suggested further reading
Are We Ready to Step Off the gas? Preparing for the Impacts of Alternative Fuel VehiclesEnergy, Environment and Transportation PolicyConference Board of Canada, April 2011.
Drive greenJ.D. Power & Associates, 2010.
Fuel Choices for Advanced VehiclesAmerican Petroleum Institute, 2006.
Natural gas Use in the Canadian Transportation Sector: Deployment RoadmapCanadian Natural Gas Vehicle Alliance, December 2010.
Nine Challenges of Alternative EnergyThe Post Carbon Reader Series: EnergyPost Carbon Institute, 2011.
On the Road in 2035: Reducing Transportation’s Petroleum Consumption and ghg EmissionsLaboratory for Energy and the EnvironmentMassachusetts Institute of Technology, July 2008.
Pathways to a low-carbon EconomyMcKinsey & Company, 2009.

cppi.ca
Contact Us:
NationalOffice:1000–275 Slater StreetOttawa, ON K1P 5H9Tel: 613-232-3709