canadian labour market and skills researcher network working paper no. 119 - veall.pdf · canadian...
TRANSCRIPT
Canadian Labour Market and Skills Researcher
Network
Working Paper No. 119
CLSRN is funded by the Social Sciences and Humanities Research Council of Canada (SSHRC) under its Strategic Knowledge Clusters Program. Research activities of CLSRN are carried out with support of Human Resources and Skills Development Canada (HRSDC). All opinions are
those of the authors and do not reflect the views of HRSDC or the SSHRC.
Estimating the Number of Guaranteed Income Supplement Recipients Who Have Mistakenly
Saved in Registered Retirement Savings Plans and Registered Pension Plans
Michael R. Veall
McMaster University
April 2013

Estimating the Number of Guaranteed Income Supplement Recipients Who Have Mistakenly Saved in Registered Retirement Savings Plans and Registered Pension Plans Final Report By: Michael R. Veall For: Human Resources and Skills Development Canada

Estimating the Number of Guaranteed Income Supplement Recipients Who Have Mistakenly Saved in Registered Retirement Savings Plans and Registered Pension Plans Final Report By: Michael R. Veall For: Human Resources and Skills Development Canada

The author wishes to thank Human Resources and Skills Development Canada for financial support for this research. The views expressed in this paper are those of the author and do not necessarily reflect the views of Human Resources and Skills Devlopment Canada or of the federal government.
Abstract: Richard Shillington (1999, 2003) estimates that one-third of near-seniors have made Registered Retirement Savings Plans (RRSP) contributions in error as their asset holdings are low enough to suggest that they will likely be Guaranteed Income Supplement (GIS) recipients. Hence they are likely to make RRSP withdrawals at age 65 or older that will be subject to GIS phaseouts. These can make the realized RRSP rate of return low or even negative. This paper reconsiders the Shillington estimate, noting that for an individual age 64 likely to receive GIS, it would appear under many scenarios that the dominating strategy is to cash out the RRSP immediately. Taxfiler data from the Longitudinal Administrative Database is used to examine RRSP withdrawals that actually are subject to GIS phaseouts. The available data, while imperfect, suggest that in part because there are significant RRSP withdrawals during the ages 60 to 64, the Shillington estimate is too high by perhaps a factor of two. However, this is still a large number of seniors. Registered Pension Plan contributions could also arguably be considered as subject to this issue, although relatively few Defined Benefit RPPs allow for cashout at age 64. Some policy implications are considered.

Key words: Guaranteed Income Supplement phaseouts; effective return on Registered Retirement Savings Plan contributions; effective return on Registered Pension Plan contributions JEL Code: J26, E21, D31 Acknowledgments: I thank Habib Saani of Statistics Canada for his work on the LAD data set and Brian Murphy for his help in facilitating access and overall counsel. I also thank Habib as well as Marllena Ifrim and Joe Wilkinson for access to their unpublished series on Registered Retirement Income flows and to David Gray and Ross Finnie for permission to cite their unpublished work. A number of colleagues from HRSDC, especially Alex Grey and Nathalie Martel, made useful comments along with participants at a CLSRN workshop in Waterloo in October, 2011 and the CSLRN/HRSDC conference “Challenges for Canada’s Retirement Income System” in Ottawa in April, 2012. Helpful comments were also received from Deb Fretz. Steve Bonnar, Ross Finnie, Alan Macnaughton and Paul Thompson provided perspectives in related discussions. Finally I am grateful to Qing Li and Wei Yang for research assistance.
Table of Contents
Executive Summary……….…………………………………………..vi
1. Introduction………………………………………………………..
2. Methodology………………………………………………………
3. Are we sure such RRSP saving is a mistake? Some scenarios…….
4. The Longitudinal Administrative Database……………………….
5. Some Empirical Results: Annual………………………………… 6. Some Empirical Results: Longitudinal…………………………..
7. Conclusions………………………………………………………… Appendix
List of Figures Figure 1 Percentage of GIS Households with RRSP Income……………………….. Figure 2 Percentage of GIS Households Receiving RRSP Income and Paying Personal Income Tax…………………………………………………………. Figure 3: RRSP Income of GIS Recipients as a Percentage of GIS Income…………. Figure 4: Personal Income Taxes of GIS Recipients with RRSP Income as a Percentage of GIS Income……………………………………………………………. Figure 5: Percentage of GIS Recipients who Receive Pension or RRIF Income………………………………………………………………………………… Figure 6: Percentage of GIS Recipients who Receive Pension or RRIF Income and Pay Personal Income Tax………………………………………………………… Figure 7: Pension and RRIF Income Received by GIS Recipients as a Percentage of GIS Income…………………………………………………………………………….. Figure 8: Personal Income Taxes of GIS Recipients with Pension or RRIF Income as a Percentage of GIS Income…………………………………………………................... Figure 9: Percentage of GIS Recipients who Receive RRIF, RRSP or RPP Income….. Figure 10: Percentage of GIS Recipients who Receive RRIF, RRSP or RPP Income and Pay Personal Income Tax………………………………………………………………. Figure 11: GIS Recipient RRIF + RRSP + RPP Income as a Percentage of GIS Income…………………………………………………………………………………... Figure 12: Personal Income Taxes of GIS Recipients with RRIF, RRSP or RPP Income as a Percentage of GIS Income………………………………………………………….. Figure 13: Incorporating Estimates of RRIF Participation and Income…………………
List of Tables Table 1: Percentages of 2008 GIS Recipients by Current Age who Received RRSP Income at Various Ages……………………………………. Table 2: Percentages of Seniors in 2008 by Current Age Who Received RRSP Income > $500 in the Same Year as GIS Income > $500 at Various Ages…………….. Table 3: Percentages of Seniors in 2008 by Current Age Who Received RRSP Income > $2000 in the Same Year as GIS Income > $2000 at Various Ages…………. Table 4: Percentages of Seniors in 2008 by Current Age Who Received RRSP, RRIF or RPP Income in the Same Year as GIS Income at Various Ages……………. Table A1: Minimum Holding Period in Years After Age 64 for RRSP Advantage with GIS Phaseout and Immediate Withdrawal…………………………………. Table A2: Minimum Total Holding Period in Years After Age 64 for RRSP Advantage with GIS Phaseout and RRIF Scenario I …………………………………… Table A3: Minimum Holding Period in Years After Age 64 for RRSP Advantage with GIS Phaseout and RRIF Scenario II…………………………………………
Executive Summary
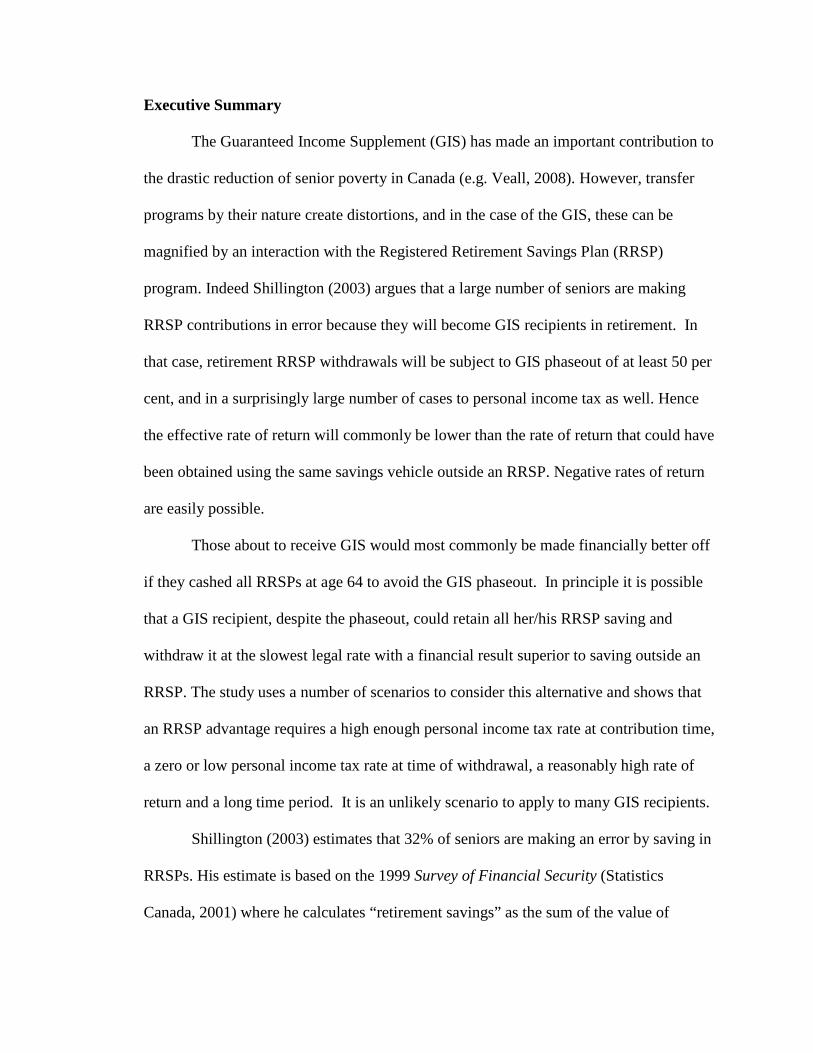
The Guaranteed Income Supplement (GIS) has made an important contribution to
the drastic reduction of senior poverty in Canada (e.g. Veall, 2008). However, transfer
programs by their nature create distortions, and in the case of the GIS, these can be
magnified by an interaction with the Registered Retirement Savings Plan (RRSP)
program. Indeed Shillington (2003) argues that a large number of seniors are making
RRSP contributions in error because they will become GIS recipients in retirement. In
that case, retirement RRSP withdrawals will be subject to GIS phaseout of at least 50 per
cent, and in a surprisingly large number of cases to personal income tax as well. Hence
the effective rate of return will commonly be lower than the rate of return that could have
been obtained using the same savings vehicle outside an RRSP. Negative rates of return
are easily possible.
Those about to receive GIS would most commonly be made financially better off
if they cashed all RRSPs at age 64 to avoid the GIS phaseout. In principle it is possible
that a GIS recipient, despite the phaseout, could retain all her/his RRSP saving and
withdraw it at the slowest legal rate with a financial result superior to saving outside an
RRSP. The study uses a number of scenarios to consider this alternative and shows that
an RRSP advantage requires a high enough personal income tax rate at contribution time,
a zero or low personal income tax rate at time of withdrawal, a reasonably high rate of
return and a long time period. It is an unlikely scenario to apply to many GIS recipients.
Shillington (2003) estimates that 32% of seniors are making an error by saving in
RRSPs. His estimate is based on the 1999 Survey of Financial Security (Statistics
Canada, 2001) where he calculates “retirement savings” as the sum of the value of
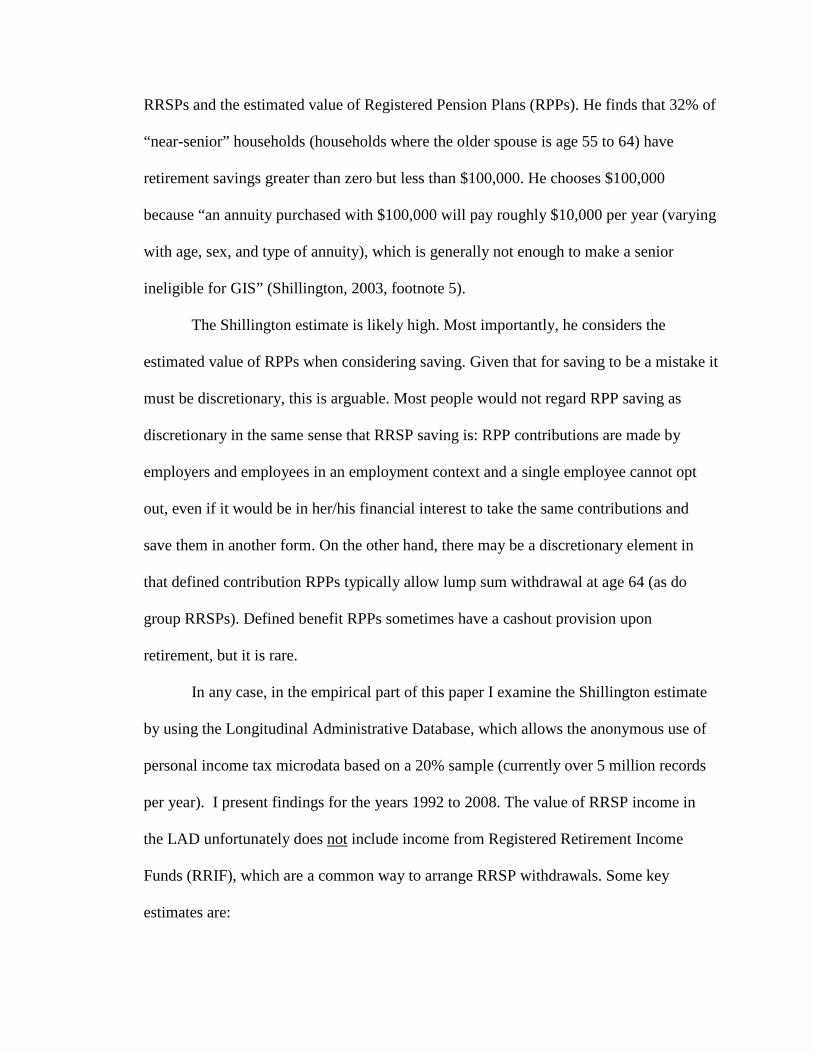
RRSPs and the estimated value of Registered Pension Plans (RPPs). He finds that 32% of
“near-senior” households (households where the older spouse is age 55 to 64) have
retirement savings greater than zero but less than $100,000. He chooses $100,000
because “an annuity purchased with $100,000 will pay roughly $10,000 per year (varying
with age, sex, and type of annuity), which is generally not enough to make a senior
ineligible for GIS” (Shillington, 2003, footnote 5).
The Shillington estimate is likely high. Most importantly, he considers the
estimated value of RPPs when considering saving. Given that for saving to be a mistake it
must be discretionary, this is arguable. Most people would not regard RPP saving as
discretionary in the same sense that RRSP saving is: RPP contributions are made by
employers and employees in an employment context and a single employee cannot opt
out, even if it would be in her/his financial interest to take the same contributions and
save them in another form. On the other hand, there may be a discretionary element in
that defined contribution RPPs typically allow lump sum withdrawal at age 64 (as do
group RRSPs). Defined benefit RPPs sometimes have a cashout provision upon
retirement, but it is rare.
In any case, in the empirical part of this paper I examine the Shillington estimate
by using the Longitudinal Administrative Database, which allows the anonymous use of
personal income tax microdata based on a 20% sample (currently over 5 million records
per year). I present findings for the years 1992 to 2008. The value of RRSP income in
the LAD unfortunately does not include income from Registered Retirement Income
Funds (RRIF), which are a common way to arrange RRSP withdrawals. Some key
estimates are:
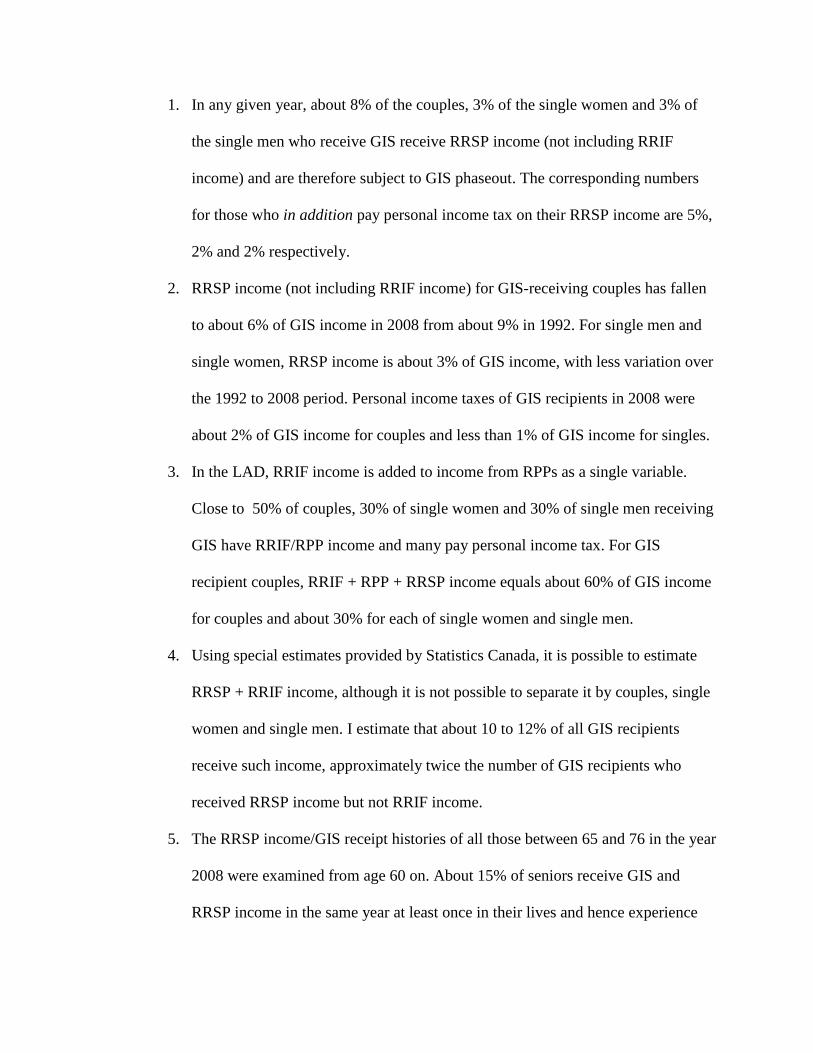
1. In any given year, about 8% of the couples, 3% of the single women and 3% of
the single men who receive GIS receive RRSP income (not including RRIF
income) and are therefore subject to GIS phaseout. The corresponding numbers
for those who in addition pay personal income tax on their RRSP income are 5%,
2% and 2% respectively.
2. RRSP income (not including RRIF income) for GIS-receiving couples has fallen
to about 6% of GIS income in 2008 from about 9% in 1992. For single men and
single women, RRSP income is about 3% of GIS income, with less variation over
the 1992 to 2008 period. Personal income taxes of GIS recipients in 2008 were
about 2% of GIS income for couples and less than 1% of GIS income for singles.
3. In the LAD, RRIF income is added to income from RPPs as a single variable.
Close to 50% of couples, 30% of single women and 30% of single men receiving
GIS have RRIF/RPP income and many pay personal income tax. For GIS
recipient couples, RRIF + RPP + RRSP income equals about 60% of GIS income
for couples and about 30% for each of single women and single men.
4. Using special estimates provided by Statistics Canada, it is possible to estimate
RRSP + RRIF income, although it is not possible to separate it by couples, single
women and single men. I estimate that about 10 to 12% of all GIS recipients
receive such income, approximately twice the number of GIS recipients who
received RRSP income but not RRIF income.
5. The RRSP income/GIS receipt histories of all those between 65 and 76 in the year
2008 were examined from age 60 on. About 15% of seniors receive GIS and
RRSP income in the same year at least once in their lives and hence experience

the phaseout. Robustness analysis suggests that this number might be
approximately halved if we only considered those who received $2000 of GIS and
$2000 of RRSP income in the same year. But the numbers would be larger if
RRIF income were included and indeed would about double if RRSP, RRIF and
RPP income were included. These values approach the Shillington estimate,
although to emphasize it is not clear that RPP contributions and incomes in most
cases are sufficiently discretionary as to indicate that an individual can have made
an error by saving in such form.
Should the system be changed, to mitigate the consequences of RRSP saving in
error? Some would argue that it has with the introduction of Tax Free Savings Accounts
(TFSAs), income from which does not lead to GIS phaseout. But given there are existing
RRSPs, possible policy options include:
1. Sending information to all those approaching age 65 with an explanation
about the GIS, its possible adverse interaction with RRSP withdrawals
and the alternative of TFSAs.
2. Consideration of an annual exemption of some RRSP income and perhaps
RPP income from the GIS calculation. The study provides a very rough
estimate that an RRSP/RRIF exemption of $1000 per year could cost the
federal treasury $100m, a significant sum although a small fraction of the
total annual cost of GIS of roughly $9b. This estimate is not offered for its
accuracy but rather as a ballpark magnitude to help determine whether a
more accurate calculation is worthwhile using HRSDC administrative
data, which are far better suited to this task.
1
1. Introduction
Shillington (2003; “New poverty traps: Means-testing and modest-income seniors”), in a C.
D. Howe Institute Backgrounder entitled more provocatively on the author’s website “How
lower-income Canadians are defrauded by RRSP’s”1, argues that many Canadians are engaged
in “futile” saving because they cannot hope to have retirement incomes, including RRSP income,
that will exceed the upper limit of the GIS phaseout. Hence every dollar of RRSP income will be
offset by a 50 cent reduction in their GIS payments and, in some cases, by federal and provincial
income tax as well.
Shillington notes that a number of individuals have no savings at all but writes, “our real
sympathy should be for the 32 percent who have fallen for the bad advice coming from
governments and the financial community: that everyone should save in an RRSP. These
households have sacrificed current consumption to accumulate, on average, $23,000 in an RRSP
... The primary beneficiary of this saving will be the federal and provincial governments because
most of the income from it will be confiscated by income-tested programs and income taxes. To
the extent that these households were misled, they have been defrauded.”2
To fix ideas, here is a simple example that explains that RRSP saving can be a mistake in this
context. Suppose individual A contributes $1,000 to an RRSP for the first time at age 64. A has a
marginal tax rate of 30% and so receives a personal income tax refund associated with the RRSP
contribution of $300. A saves the $300. Interest rates are 5% so that one year later at age 65 A
1 http://www.shillington.ca/ as accessed August 16, 2011. 2 Shillington’s position shares similarities with Kesselman and Poschmann (2001) and a number of Canadian financial commentators of whom the most familiar is probably Malcolm Hamilton. For example, in Globe and Mail (2009) (http://www.theglobeandmail.com/report-on-business/retirement/malcolm-hamilton-offers-retirement-planning-advice/article1325008/ (accessessed August 16, 2011) an oral interview with Hamilton (particularly answer 8) includes the advice that it usually does not make sense for those nearing retirement with low incomes and few assets to save.
2
has $1,050 inside the RRSP and $315 from saving the refund (assuming the interest on that
saving is untaxed).
Suppose A is a GIS recipient at age 65 and withdraws the RRSP holding that year. Because
the RRSP withdrawal will count as income for GIS purposes, it will be subject to the GIS
phaseout of 50%. Hence A will have 50% left from the $1,050 or $525 plus the $315 from saving
the refund. The total of $525 and $315 is $840, less than the $1000 original contribution. The
effective rate of return to A on the RRSP contribution was minus 16%.
The negative rate of return is because RRSP withdrawals are counted as income for the GIS
phaseout. But a large part of the withdrawal ($1000 in this case) is not really income but a
deferral. The deferral leads to a refund at the time of contribution but is taxed at time of
withdrawal. Because the GIS phaseout rate of 50% exceeds the marginal personal income tax
rate at the time of contribution, a negative rate of return is possible. In any case, the contribution
was clearly a mistake. Saving outside an RRSP would have yielded a better return than inside the
RRSP.
The Shillington estimate derives from observations on what he describes as “near-senior
households”, that is households where the older spouse is age 55 to 64. Of these, Shillington
calculates using the 1999 Survey of Financial Security (Statistics Canada, 2001), some 32% have
retirement savings greater than zero but less than $100,000. Retirement savings are defined as
the sum of the value of the RRSPs and the estimated value of RPPs. The number $100,000 is
chosen because “an annuity purchased with $100,000 will pay roughly $10,000 per year (varying
with age, sex, and type of annuity), which is generally not enough to make a senior ineligible for
GIS” (Shillington, 2003, footnote 5). That is, Shillington argues that those with total registered
saving less than $100,000 had likely mis-saved in RRSPs (and RPPs to the extent that RPP
3
saving could be controlled), because they would likely end up receiving GIS in retirement and
hence their RRSP withdrawals/RPP payments would be subject to GIS phaseout.
That 32% of a cohort may be making what seems such a bad economic decision is a striking
assertion.3 In this study, I parse this assertion in a number of a ways. Section 2 examines the
methodology as to how to consider the Shillington approach and how to consider whether saving
was in error, both from theoretical scenario and real data perspectives. Section 3 employs a
theoretical scenario approach to consider the possibility that such saving may not be a bad
financial decision because the advantage of tax-free accumulation offsets the phaseout effect.
The main scenario revolves around the option of withdrawing all RRSP savings at age 64 to
avoid the phaseout versus continuing saving at age 65, in one scenario for as long as legally
possibility. It turns out it is possible for RRSP saving to be advantageous in some of these
scenarios, but it is unlikely. In Section 4, I briefly introduce the Longitudinal Administrative
Database (LAD) used in the paper. In Section 5, I directly estimate the prevalence of GIS
phaseout related to income derived from an RRSP, RRIF or RPP on an annual basis. Section 6
explores a longitudinal aspect of the analysis. It concludes that about 15 % of seniors face GIS
phaseout associated RRSP income, not counting RRIF income, which is below Shillington’s
estimate but still a very significant percentage. While isolating RRIF income is not possible in
the LAD, the calculations in Sections 5 and 6 suggest that incorporating RRIF income would
lead to an estimate closer to Shillington’s, although still not as high. However including RPP
income in the calculation leads to an estimate very similar to Shillington’s, although it should be
3 It may be worth reiterating that not all the 32% are making RRSP contributions: the 32% Shillington refers to have positive retirement savings less than $100,000 but in some cases those savings are entirely registered pension plans (RPPs). There will be some discussion in Section 2 as to whether RRSP saving should be thought of differently than RPP saving in this context.
4
noted that neither RPP contributions nor RPP income is as discretionary as RRSP contributions
and income. Section 7 provides a brief conclusion and sketches some policy implications.
To complete this section, note two things that this study is not. First, it is not a commentary
on the size of the phaseout rate per se. However, I mention in passing that a high rate of phaseout
can be consistent with optimal taxation models with a redistribution motive because it allows
greater targeting of low- income families. For example Diamond and Saez write (2011, p. 13)
regarding the implications of the standard Mirrlees (1971) model of choosing a nonlinear
personal tax/personal transfer system for a given distribution of earning abilities, labour/leisure
choice and a social welfare function:
“The intuition is that a high phase-out rate allows the government to target transfers to the
most disadvantaged families. A high phase-out rate does reduce earnings for low income
families, because they reduce hours worked. However, because earnings of those in the phaseout
range are small to start with, this elasticity applies to a low income base. Therefore, increasing
the maximum benefit (to those with no earnings) and increasing the phase-out rate is desirable
for redistribution and the behavioral responses create modest fiscal costs relative to the
redistributive gains, as long as the phase-out rate is not too high. Hence, the Mirrlees model of
optimal income taxation generates traditional welfare where benefits are concentrated on non-
earners with high phaseout rates on low-income workers.”
Diamond and Saez are concentrating in this passage on pre-retirement families and labour
earnings. However, the same logic essentially applies for saving for retirement, provided it is
accepted that capital income should be taxed. 4
4 The issue of the degree to which capital income should be taxed differently from labour income is too large to consider here. In any case it is not fully relevant to a discussion of the GIS-
5
Second this study does not consider Tax Free Savings Accounts (TFSAs) because its data
period ends in 2008 and TFSAs were introduced in the 2008 budget, coming into effect January
1, 2009. However, when the 2009 data including TFSA data become available, the research in
this study may provide a starting place to examine whether the introduction of TFSAs had an
impact on the use of RRSPs by low-income individuals.
2. Methodology As mentioned, Shillington notes that the Survey of Financial Security found that 32% of
those aged 55 to 64 in 1999 had RRSPs plus the estimated value of RPPs with total value greater
than zero but less than $100,000. He argues that such savings will not yield an annuity which
will exceed the maximum income for GIS eligibility and hence such individuals will be subject
to the GIS phaseout of 50% on the resulting RRSP income. His view is that such a phaseout rate
phaseout rate that should applied to RRSP savings which include deferred labour income plus the returns to saving that labour income. In the pre-retirement labour income case, Diamond and Saez consider both the extensive elasticity (with respect to the decision of whether to participate in the labour market) and the intensive elasticity (with respect to the decision of how much to work, conditional upon participation). For regular labour income, they note that the extensive elasticity is estimated by empirical studies to be large relative to the intensive elasticity for those with low incomes. The larger the extensive elasticity, the smaller should be the initial phaseout rate. Indeed in many cases the optimum will be a negative rate (i.e. a work incentive) applied to an initial amount of labour income to provide an encouragement to labour market participation. In such cases, the optimum will also include substantial positive phaseout rates applied to higher levels of income. With respect to retirement saving, Engelhardt and Kumar (2007) use estimates of the response rates to 401(k) match rates in the United States to estimate that the extensive elasticity there is very small i.e. between 0.02 and 0.07. The estimated combined intensive and extensive elasticity is only 0.12. These low values are consistent with the optimality of high GIS phaseout rates from an optimal taxation perspective in a Mirrlees model. It is also consistent with much of what has been found in the behavioural economics literature regarding the low relevance of rates of return to the saving decisions of many individuals. See for example O’Donoghue and Rabin (1999), Madrian and Shea (2001) and Veall (2001).
6
makes the saving inherently “futile”, especially when the possibility of additional personal
income tax on the RRSP income is considered.
Let us consider a number of issues at this stage:
1. Is Shillington correct to restrict consideration to financial saving (saving in cash, bank
accounts or financial instruments) and to emphasize registered retirement saving in RRSPs
and RPPs? My answer on both counts is yes. Other forms of saving, such as in housing
equity, do not yield returns that are subject to GIS phaseout or to personal income tax, and
phaseout/tax rates are the key issue here. And while the realized returns to all financial
saving are subject to the GIS phaseout in retirement, an important difference between other
types of saving and saving for RRSPs and RPPs is that in the RRSP/RPP case, the
withdrawal of principal is also subject to GIS phaseout.
2. Even though much of his discussion concerns “futile” RRSP saving, Shillington includes the
estimated value of RPPs when determining who may have saved in the “futile” range. But RPPs
are different from RRSPs. In the Shillington context, someone may make a voluntary
contribution to an RRSP that turns out to have a very low (possibly even negative) return to the
contributor because the ensuing withdrawals lead to GIS phaseout. I expect a very common
reaction would be that this was unfortunate and that it would have been desirable if the person
had understood in advance that the GIS system would have this effect or understood that it would
have been wise to withdraw the RRSP assets before GIS eligibility. But it is similarly possible
that an RPP contribution, particularly made close to retirement, will turn out to have a low or
negative return to the contributor because the corresponding pension benefits lead to GIS
phaseout. In these cases, it would have been better for the individual not to make her/his
contribution (and take in cash the contributions on her/his behalf by the employer), perhaps save
7
them outside a registered plan and accept a lower pension payment.5 While this situation is in
some ways analogous to the RRSP case, I expect that many people would think of it differently.
Perhaps this is because of the mandatory, rules-based nature of a pension plan so that there is not
the element of the individual making a mistake in a voluntary RRSP decision, a mistake
Shillington argues is induced by advertising and information provided by government. Also
many may feel that a pension plan comes as one desirable element in a job compensation
package. Naturally, such a package will not be optimal or even close to optimal for all
employees.
Hence much of this study will concentrate on RRSPs. We will provide separate estimates for
RPPs.
3. Shillington essentially defines “futile” RRSP saving as saving that will yield income subject to
the GIS phaseout. We instead will define RRSP saving as having been in error if it would have
been better to save in the same financial instruments outside an RRSP6.
4. It may be that some of the near-senior saving observed by Shillington may not have been in
error because it was based on ex ante expectations earlier in life that other retirement income
would be higher, GIS would not be received and hence GIS phaseout would not be applicable.
Alternatively it may have been (a) precautionary or (b) designed to take maximum advantage of
the tax free compounding that the RRSP program provides. Our methodology will consider these
possibilities in two ways. First we will examine scenarios analytically, in particular the scenario
5 As will be discussed further below, in some pension plans there may be the possibility of cashing out the pension prior to GIS eligibility. Fretz, Macnaughton and Veall (2002) discuss more generally the interaction of the pension plans and the OAS/GIS system. 6 An alternative definition could be that “futile” RRSP saving reduces lifetime utility from consumption, perhaps because the funds should had been directed towards immediate consumption and not saved at all. However implementing such a definition would require knowledge of household preferences.
8
that a near-senior will save in an RRSP until age 64 (at which point she/he has good information
about her/his retirement income) and then cash out that RRSP to avoid the GIS phaseout (as
discussed e.g. in Fretz and Veall, 2000). This would be the natural, mistake-free solution if
retirement income had been overestimated or in the precautionary case (a). It seems also likely
but not certain that it will be the mistake-free solution under (b), as our scenario analysis will
confirm. Second, we will examine actual empirical RRSP behaviour using the Longitudinal
Administrative Base. Particular attention will be paid to the extent of RRSP withdrawals in the
years immediately before age 65 and RRSP income at age 65 and older when GIS eligibility has
been attained. We note that this latter approach will also take some of the uncertainty out of the
Shillington approach (i.e. the inaccuracy associated with using $100,000 as the cutoff) although
we should also note that the LAD data will prove imperfect for our purposes, which will make
our own estimates inaccurate in some respects.
3. Are we sure such RRSP saving is a mistake? Some scenarios Suppose an individual saves in an RRSP in a way that generates RRSP income subject to the
GIS phaseout. In particular, the individual has chosen not to cash out her/his RRSP at age 64 to
avoid the phaseout. Has the individual necessarily made an error?
Possibly not. It may have been that the individual acted reasonably but an unanticipated
negative income shock in retirement led to GIS eligibility. However, as the shock would need to
be sudden so as not to give the individual time to cash out her/his RRSP holdings, this seems
likely to be a rare event.
The other possibility is that the individual is gaining such advantage from the ability of
RRSPs to shelter cumulative investment gains that it is not financially an error to contribute to
9
RRSPs even if withdrawal is subject to GIS phaseout. In the Appendix, a number of scenarios
along these lines are worked out in detail.
Perhaps the most reasonable scenario to discuss here is the one where an individual who will
be a GIS recipient is choosing between complete RRSP withdrawal at age 64 and saving the
money while paying tax on its annual rate of return or keeping the money in the RRSP and
maximizing the tax shelter value by following minimum legal withdrawal. This scenario seems
biased towards the RRSP approach (because the GIS recipient needs the money so little as to be
able to leave the money in the RRSP to maximize the tax shelter aspect and because the non-
RRSP strategy used for comparison does not allow saving in equities to gain the dividend tax
credit or the tax advantages of capital gains). Even in this case, perhaps the best-case example
has an annual rate of return of 5 %, a marginal tax rate at age 64 of 0.3 and no personal income
taxes after age 64. That requires a minimum holding period of 18 years. Lower personal income
tax rates at age 64 (which seem likely in many cases for those about to receive the GIS), lower
rates of return or higher rates of personal income tax after age 64 all would lengthen the required
period. Hence the presumption is that the holding of an RRSP by a GIS recipient is likely a
mistake, at least ex post. 7
Given that RRSP saving can be a mistake, can RPP saving also be a mistake? Yes, in the
sense that there are some employees who will be GIS recipients at age 65 who would be better
off financially if they could receive the value of their pensions at age 64. There is no publicly-
available data that I know of regarding this but informal responses from experts to me have
7 While we do not investigate this scenario, in some cases it can even be advantageous to contribute to an RRSP after age 65 (when eligible) in order to maximize GIS payments. See e.g. Banerjee (2012) http://www.theglobeandmail.com/globe-investor/personal-finance/preet-banerjee/how-rrsp-payments-can-help-seniors-with-benefits/article2347562/ (accessed June 27, 2012)
10
indicated that such a provision would be common for defined contribution RPPs (and group
RRSPs) but rare for defined benefit RPPs.
4. The Longitudinal Administrative Database The Longitudinal Adminstrative Database is an anonymized, annual 20% sample of taxfilers
for Canada from 1982 to 2009. The analysis in this study begins in 1992, the first year all
required variables (particularly the variable including GIS receipt) were available and ends in
2008, the last year available when the calculations for this study were completed). LAD coverage
also increases substantially in 1990 as the introduction of the GST credit and Child Tax Benefit
increased the number of taxfilers. Coverage is therefore very close to complete and there is no
attrition except for example from death or international emigration. All records are linked
longitudinally. There is also household linkage: couples will include common-law couples in this
study. In some cases LAD does this by address matching.
Finnie and Gray (2012) discuss how GIS benefits are reported in the LAD as the sum of
GIS and spouse’s allowance (the latter now called the Allowance and paid to those aged 60 to 64
whose spouse is 65 or over and a GIS recipient). We clarify that in this study, GIS recipients
include recipients of the Allowance or the Allowance for the Survivor, which is the Allowance
extended for someone 60 to 64, who has received the Allowance and whose spouse has died.
Recipients in the Allowance programs also faced phaseouts, in many cases at a rate of 75%
rather than 50%. Finnie and Gray also note that GIS receipt may be underreported in the LAD
before age 67. Accordingly some of our estimates of the effect of phaseout will be
underestimates.
11
5. Some Empirical Results: Annual This section will use the LAD to examine by year from 1992 to 2008 how many couples,
currently single females and currently single males8 have received GIS9 and RRSP income in the
same year (and hence were subject to the GIS phaseout). A significant data problem with this
approach is that the LAD data does not include RRIF income in the RRSP income variable,
T4RSP, which only includes direct RRSP withdrawals and RRSP annuity income. 10 RRIF
income is included in the LAD variable SOP4A, a variable that also includes RPP income.
Accordingly, we will also repeat this analysis using SOP4A and in addition make some estimates
as to what portion of SOP4A for GIS recipients is likely RRIF income. This approach will also
examine whether individuals paid personal income taxes while receiving GIS and RRSP, RRIF
or RPP income. It will also consider the dollar amounts.
8 The analysis throughout excludes from any yearly count or sum those who die that year or those whose spouse has died that year. Anyone not currently married or currently in a common-law relationship is treated as single. 9 Throughout the empirical part of this paper, any reference to GIS includes the Allowance and the Allowance for the Survivor. 10 RRSP income comes from line 129 of the general income tax return and consists of T4RSP slip entries Box 16 (RRSP annuity payments), Box 18 (refund of payments), Box 28 (payments triggered by such circumstances as the acquisition of an ineligible investment within an RRSP or by using property within an RRSP as a loan), Box 20 (withdrawal of excessive premiums), Box 22 (withdrawal) and Box 26 (payments upon deregistration). It also includes Box 34 (amounts deemed or received upon death) but this should not matter here as those who die during the year, or whose spouses die during the year, have been excluded from the sample.

12
Figure 1 is derived from LAD data and shows the percentage of households that are GIS
recipients who also received RRSP income (not including RRIF income) and hence were subject
to GIS phaseout. It can be seen that about 8% of couples that receive GIS have at least one
member receiving RRSP income, and that this value has been relatively stable over the period
examined. The percentage of single women and single men in a similar situation is smaller but
has been rising, and is currently about 4%. 11
11 As part of the calculations, this analysis was re-done with thresholds to check whether there was an inordinately large clustering at small values. Taking 2008 values for illustration, of those who received GIS, about 82% of couples received at least $2000 and about 90% of single males and females received at least $1000. Of those households who received GIS and RRSP income, more than 95% of couples received at least $200 RRSP income and more than 97% of singles received at least $100 RRSP income, and about 93% of couples and singles received at least $500 RRSP income.
0.00%1.00%2.00%3.00%4.00%5.00%6.00%7.00%8.00%9.00%
10.00%
1992 1993 1994 1995 1996 1997 1998 1999 2000 2001 2002 2003 2004 2005 2006 2007 2008
Figure 1: Percentage of GIS Households with RRSP Income: Couples, Single Women and Single Men
Couples Single women Single men
13
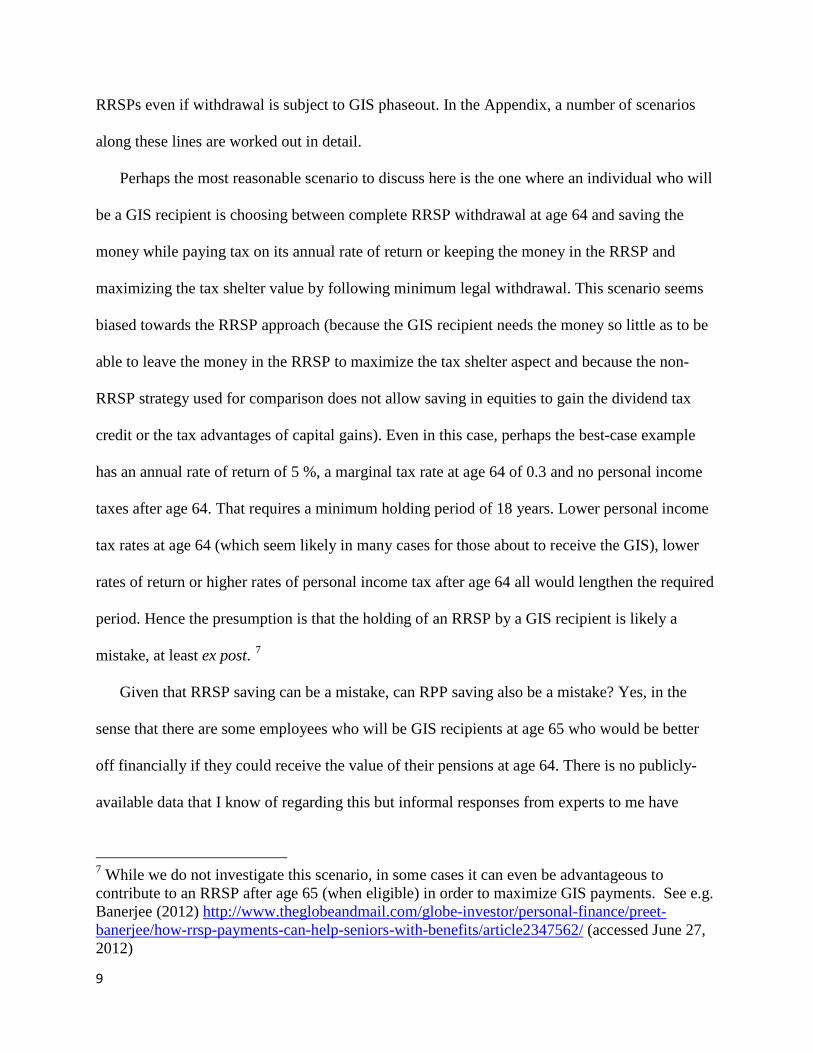
Figure 2 considers those households that receive GIS and RRSP income and pay positive
personal income tax so that RRSP income is subject to both GIS phaseout and personal income
tax rates. The number of such households is calculated as a percentage of the number of
households who receive GIS. It can be seen that about 5% of couples who receive GIS and about
2% of both single women and single men who receive GIS received both RRSP income and paid
positive personal income tax. These figures are all based on the sum of federal and provincial
personal income taxes being positive. The percentages are only slightly smaller if only
provincial or only federal personal income taxes are used. Note also that these numbers mean
that more than half of households who receive both GIS and RRSP income are paying personal
income tax. Many of the affected households face both GIS phaseout and personal income tax.
0.00%1.00%2.00%3.00%4.00%5.00%6.00%7.00%
Figure 2: Percentage of GIS Households Receiving RRSP Income and Paying Personal Income Tax:
Couples, Single Women and Single Men
Couples Single women Single men
14
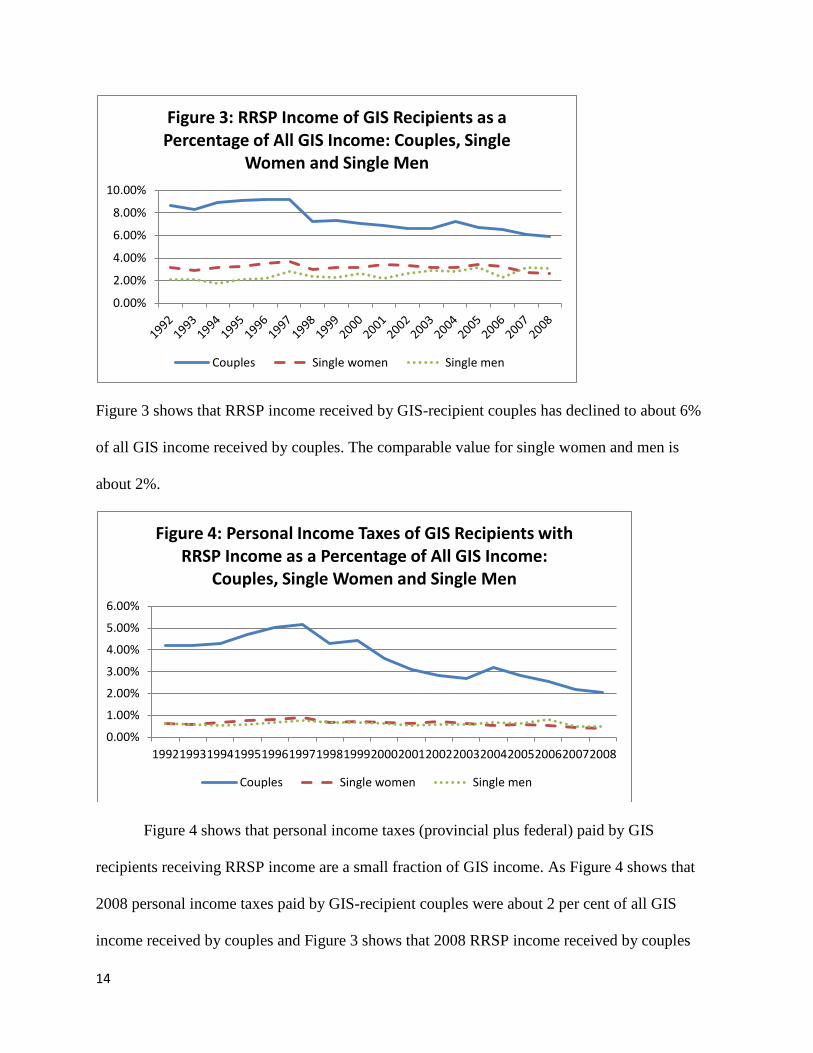
Figure 3 shows that RRSP income received by GIS-recipient couples has declined to about 6%
of all GIS income received by couples. The comparable value for single women and men is
about 2%.
Figure 4 shows that personal income taxes (provincial plus federal) paid by GIS
recipients receiving RRSP income are a small fraction of GIS income. As Figure 4 shows that
2008 personal income taxes paid by GIS-recipient couples were about 2 per cent of all GIS
income received by couples and Figure 3 shows that 2008 RRSP income received by couples
0.00%
2.00%
4.00%
6.00%
8.00%
10.00%
Figure 3: RRSP Income of GIS Recipients as a Percentage of All GIS Income: Couples, Single
Women and Single Men
Couples Single women Single men
0.00%
1.00%
2.00%
3.00%
4.00%
5.00%
6.00%
19921993199419951996199719981999200020012002200320042005200620072008
Figure 4: Personal Income Taxes of GIS Recipients with RRSP Income as a Percentage of All GIS Income:
Couples, Single Women and Single Men
Couples Single women Single men
15
was about 6 per cent of all GIS income received by couples, it follows that in 2008 personal
income taxes paid by GIS-recipient couples were about one-third of RRSP income received by
couples. A similar calculation would yield a value of one-sixth for both single women and single
men.
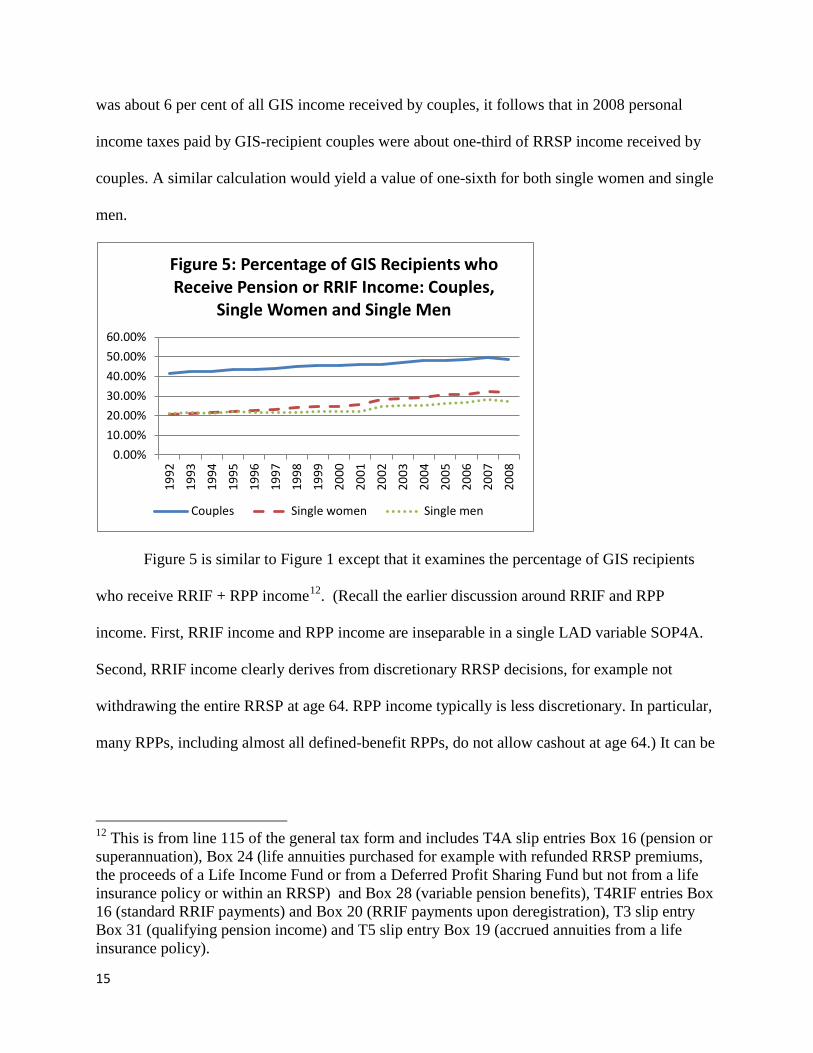
Figure 5 is similar to Figure 1 except that it examines the percentage of GIS recipients
who receive RRIF + RPP income12. (Recall the earlier discussion around RRIF and RPP
income. First, RRIF income and RPP income are inseparable in a single LAD variable SOP4A.
Second, RRIF income clearly derives from discretionary RRSP decisions, for example not
withdrawing the entire RRSP at age 64. RPP income typically is less discretionary. In particular,
many RPPs, including almost all defined-benefit RPPs, do not allow cashout at age 64.) It can be
12 This is from line 115 of the general tax form and includes T4A slip entries Box 16 (pension or superannuation), Box 24 (life annuities purchased for example with refunded RRSP premiums, the proceeds of a Life Income Fund or from a Deferred Profit Sharing Fund but not from a life insurance policy or within an RRSP) and Box 28 (variable pension benefits), T4RIF entries Box 16 (standard RRIF payments) and Box 20 (RRIF payments upon deregistration), T3 slip entry Box 31 (qualifying pension income) and T5 slip entry Box 19 (accrued annuities from a life insurance policy).
0.00%10.00%20.00%30.00%40.00%50.00%60.00%
1992
1993
1994
1995
1996
1997
1998
1999
2000
2001
2002
2003
2004
2005
2006
2007
2008
Figure 5: Percentage of GIS Recipients who Receive Pension or RRIF Income: Couples,
Single Women and Single Men
Couples Single women Single men

16
seen that on an annual basis, almost half of all GIS-receiving couples and about 30 % of singles
receive some amount of SOP4A income.
Figure 6 shows that about 20% of all GIS recipient couples and about 10% of GIS
recipient single women and single men receive pension or RRIF income pay income tax. In each
case this is a little less than half of those GIS recipients who receive pension or RRIF income.
0.00%
5.00%
10.00%
15.00%
20.00%
25.00%
30.00%
35.00%
Figure 6: Percentage of GIS Recipients who Receive Pension or RRIF Income and Pay Personal Income
Tax: Couples, Single Women and Single Men
Couples Single women Single men
0.00%
20.00%
40.00%
60.00%
80.00%
Figure 7: Pension and RRIF Income Received by GIS Recipients as a Percentage of All GIS
Income: Couples, Single Women and Single Men
Couples Single women Single men
17
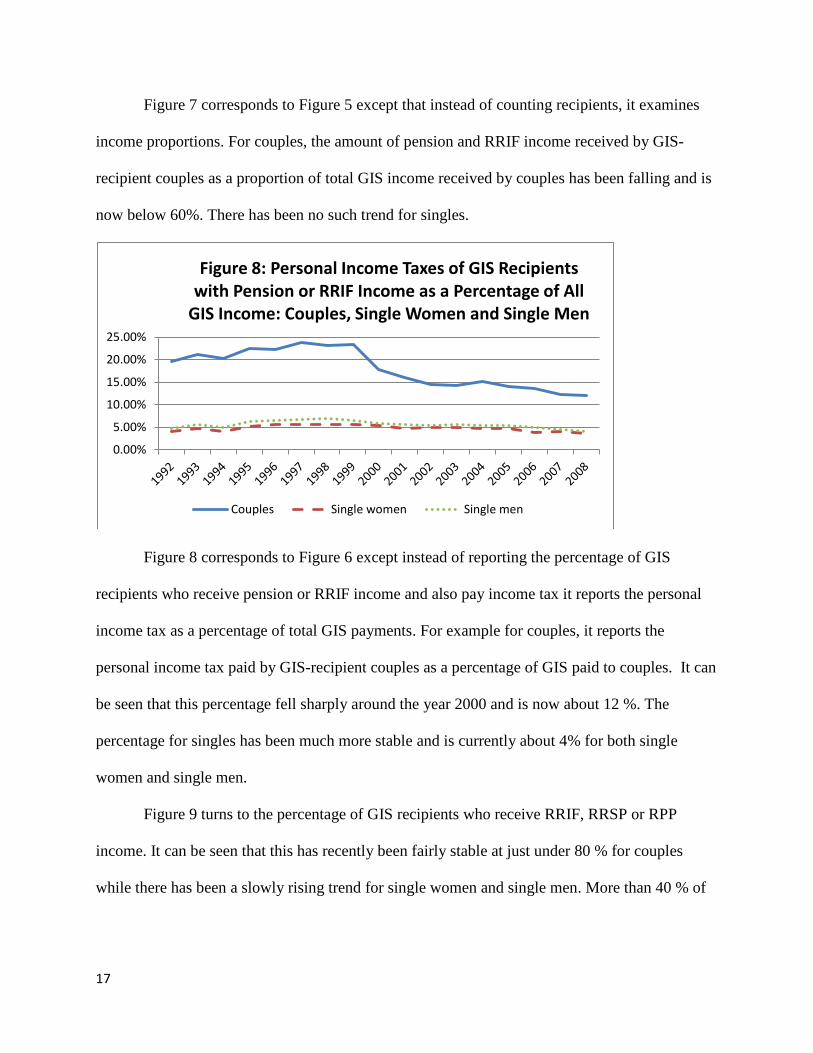
Figure 7 corresponds to Figure 5 except that instead of counting recipients, it examines
income proportions. For couples, the amount of pension and RRIF income received by GIS-
recipient couples as a proportion of total GIS income received by couples has been falling and is
now below 60%. There has been no such trend for singles.
Figure 8 corresponds to Figure 6 except instead of reporting the percentage of GIS
recipients who receive pension or RRIF income and also pay income tax it reports the personal
income tax as a percentage of total GIS payments. For example for couples, it reports the
personal income tax paid by GIS-recipient couples as a percentage of GIS paid to couples. It can
be seen that this percentage fell sharply around the year 2000 and is now about 12 %. The
percentage for singles has been much more stable and is currently about 4% for both single
women and single men.
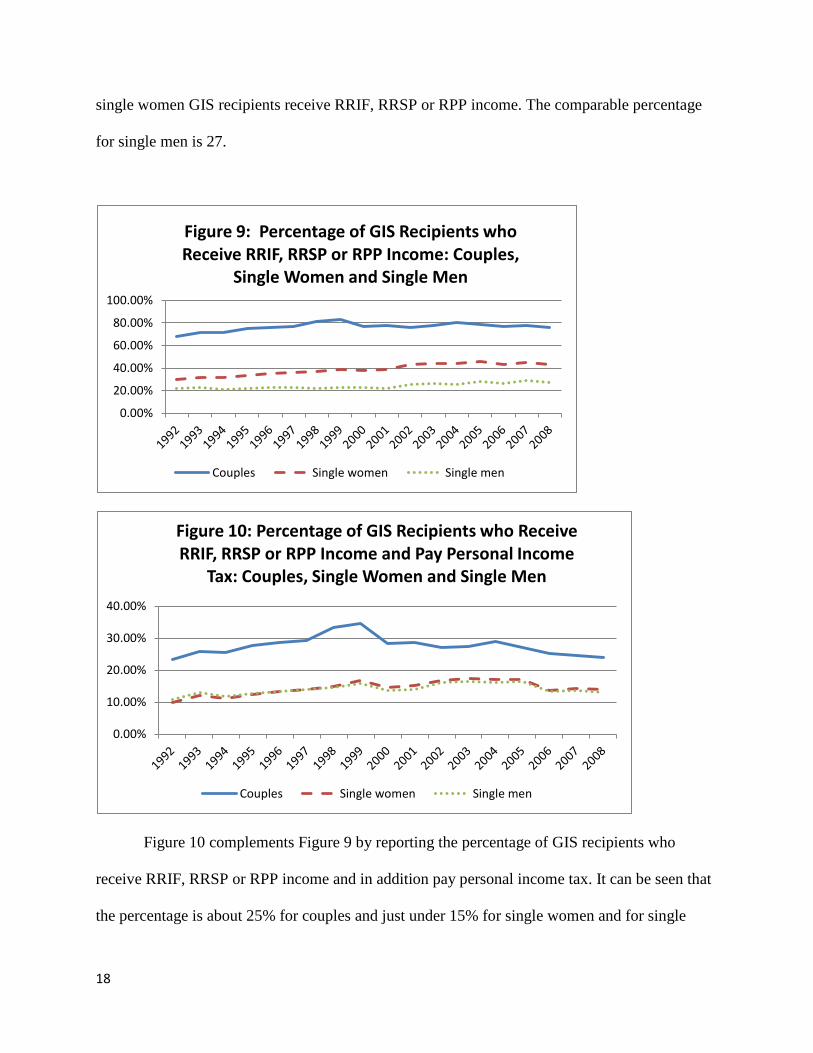
Figure 9 turns to the percentage of GIS recipients who receive RRIF, RRSP or RPP
income. It can be seen that this has recently been fairly stable at just under 80 % for couples
while there has been a slowly rising trend for single women and single men. More than 40 % of
0.00%
5.00%
10.00%
15.00%
20.00%
25.00%
Figure 8: Personal Income Taxes of GIS Recipients with Pension or RRIF Income as a Percentage of All
GIS Income: Couples, Single Women and Single Men
Couples Single women Single men
18
single women GIS recipients receive RRIF, RRSP or RPP income. The comparable percentage
for single men is 27.
Figure 10 complements Figure 9 by reporting the percentage of GIS recipients who
receive RRIF, RRSP or RPP income and in addition pay personal income tax. It can be seen that
the percentage is about 25% for couples and just under 15% for single women and for single
0.00%
20.00%
40.00%
60.00%
80.00%
100.00%
Figure 9: Percentage of GIS Recipients who Receive RRIF, RRSP or RPP Income: Couples,
Single Women and Single Men
Couples Single women Single men
0.00%
10.00%
20.00%
30.00%
40.00%
Figure 10: Percentage of GIS Recipients who Receive RRIF, RRSP or RPP Income and Pay Personal Income
Tax: Couples, Single Women and Single Men
Couples Single women Single men
19
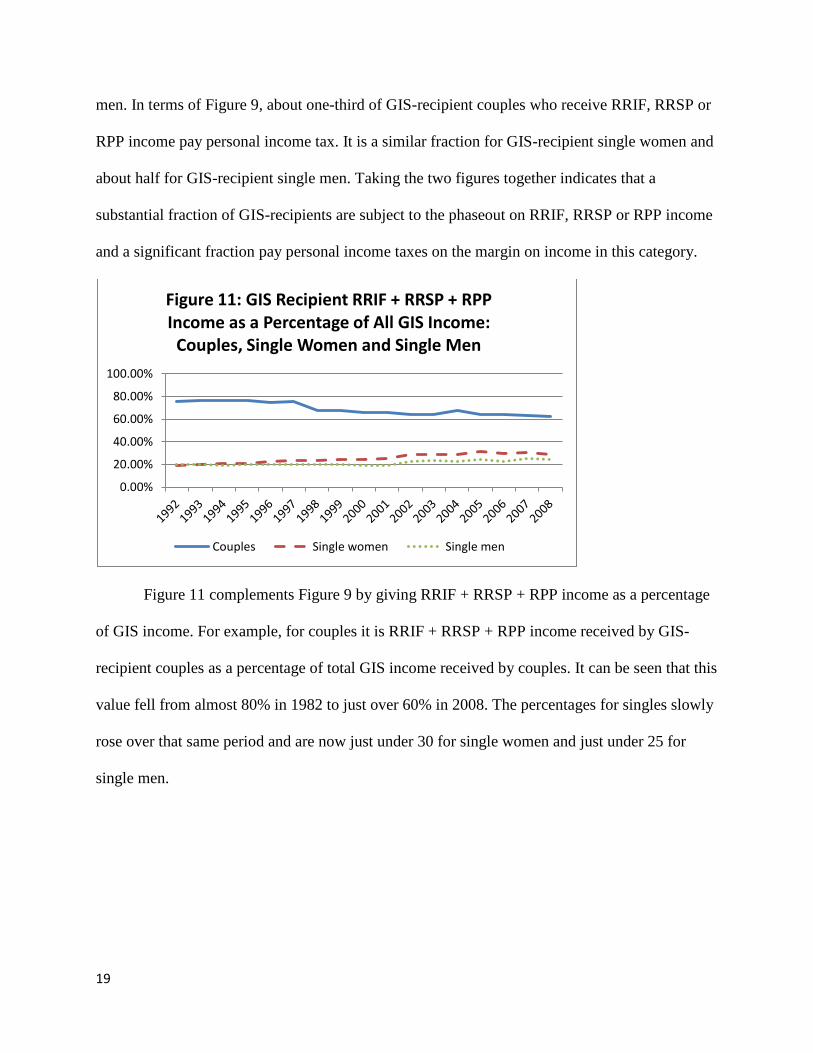
men. In terms of Figure 9, about one-third of GIS-recipient couples who receive RRIF, RRSP or
RPP income pay personal income tax. It is a similar fraction for GIS-recipient single women and
about half for GIS-recipient single men. Taking the two figures together indicates that a
substantial fraction of GIS-recipients are subject to the phaseout on RRIF, RRSP or RPP income
and a significant fraction pay personal income taxes on the margin on income in this category.
Figure 11 complements Figure 9 by giving RRIF + RRSP + RPP income as a percentage
of GIS income. For example, for couples it is RRIF + RRSP + RPP income received by GIS-
recipient couples as a percentage of total GIS income received by couples. It can be seen that this
value fell from almost 80% in 1982 to just over 60% in 2008. The percentages for singles slowly
rose over that same period and are now just under 30 for single women and just under 25 for
single men.
0.00%
20.00%
40.00%
60.00%
80.00%
100.00%
Figure 11: GIS Recipient RRIF + RRSP + RPP Income as a Percentage of All GIS Income:
Couples, Single Women and Single Men
Couples Single women Single men

20
Figure 12 complements Figure 10 by giving personal income taxes of GIS recipients with
RRIF, RRSP or RPP income as a percentage of GIS income. For example for couples it is the
personal income taxes of GIS recipients who receive RRIF, RRSP or RPP income as a
percentage of the GIS income received by all couples. It can be seen this is much like Figure 8
which only examined RRIF or RPP income. Hence the percentage for couples has fallen to
about 12 % while the percentage for single women and single men is less than 5.
0.00%5.00%
10.00%15.00%20.00%25.00%30.00%
Figure 12: Personal Income Taxes of GIS Recipients with RRIF, RRSP or RPP Income as a Percentage of All GIS Income: Couples, Single Women and Single Men
Couples Single women Single men

21
In Figure 13 I try to abstract from RPP income and estimate the percentage of GIS
recipients who receive RRSP + RRIF income and RRSP + RRIF income as a percentage of total
GIS income. I do this using unpublished estimates of total RRIF outflows.13 I estimate the
number of GIS recipients who have RRIF income by assuming that the ratio of the number of
GIS recipients with RRIF income to GIS recipients with RRSP income is the same as the overall
ratio of RRIF income recipients (from the unpublished estimates, where those who have died are
excluded) to RRSP income recipients (available in the LAD). I use a similar technique to
estimate the RRIF income received by GIS recipients by assuming that the ratio of GIS-recipient
RRIF income to GIS-recipient RRSP income is the same as the overall ratio of RRIF income
(from the unpublished estimates) to RRSP income (available in the LAD). It is not possible using
this method to differentiate couples, single women and single men, so estimates are based on
total individuals.
13 These were kindly provided to me by Marllena Ifrim, Habib Saani and Joe Wilkinson of Statistics Canada.
0.00%
2.00%
4.00%
6.00%
8.00%
10.00%
12.00%
14.00%
16.00%
Figure 13: Incorporating Estimates of RRIF Participation and Income
Estimated % of GIS Recipients with RRSP or RRIF Income
Estimated GIS-Recipient RRSP + RRIF Income as a % of GIS Income

22
In any case, the estimates in Figure 13 indicate that on an annual basis about 12% of all
GIS recipients receive either RRSP or RRIF income. This may be an overestimate because the
method unavoidably double counts those who have both RRSP and RRIF income. However it is
unlikely that the value is much below 10% as RRSP and RRIF income to GIS recipients totals
about 10% of GIS payments. Hence I estimate the range as 10% to 12%. This is about double the
estimate based on RRSP income alone from Figure 1. (Converting the couple and single figures
from Figure 1 yields an estimate that about 5% of all GIS recipients (singles or those in couples)
receive RRSP income.)
To summarize so far, with respect to RRSP income (remembering this does not include
RRIF income), on an annual basis the GIS phaseout issue appears to affect about 8% of couples
receiving GIS and 3% of singles receiving GIS, or in total about 5% of all GIS recipients. More
than half of these individuals face personal income tax in addition to the GIS phaseout
(comparing Figure 2 with Figure 1). Also I estimate that including RRIF income in these
calculations roughly doubles the number of individuals subject to GIS phaseout. If one considers
the number of individuals subject to GIS phaseout due to RRSP + RRIF + RPP income, this is
close to 80 % of GIS-recipient couples (with about one-third paying personal income taxes), over
40 % of single women GIS recipients (with about one-third paying personal income taxes) and
over 25 % of all single men GIS recipients (with about one-half paying personal income taxes).
This is roughly 50% of all GIS recipients with roughly 20% of all GIS recipients subject to both
GIS phaseout and personal income tax on RRSP + RRIF + RPP income. It is important to
emphasize that all these estimates are on an annual basis.
23
6. Some Empirical Results: Longitudinal
The Shillington estimate suggests that 32% of all seniors will be affected by GIS
phaseout on registered saving. But that does not mean that they will be affected on an annual
basis, just once during their retirement. GIS recipients may withdraw their RRSP savings all at
once or slowly: in either case the phaseout is relevant.
Hence to explore the Shillington estimate further, Table 1 uses the longitudinal feature of
the LAD to look at the RRSP income history back to age 60 of all seniors (not necessarily GIS
recipients) who were aged 65 to 76 in 2008 and who had filed continually.14 (The cutoff of age
76 was used as a compromise between the length of history and attrition.) Again recall the caveat
that RRSP income does not include RRIF income.
The second column of the table gives the percentage of those by age between 65 and 76
in 2008 who, during at least one year when they were age 60 to 64, received both RRSP and GIS
income in the same year. There are two possibilities for GIS receipt at this age. First, recall that
for this paper, “GIS Income” includes both the Allowance and the Allowance for the Survivor,
which is available to those age 60 to 64 who have a spouse who is receiving GIS or who are the
widow/widower of such a spouse. Second, this would include individuals who are not receiving
the Allowance but who have a spouse who is receiving GIS. In either case, the RRSP income
received by these individuals was subject to GIS phaseout.
14 If the requirement for continual filing is dropped, the values in Table 1 fall slightly, with the largest difference being the age 76 value in the fourth column, which falls from 13.6 to 11.9.
24
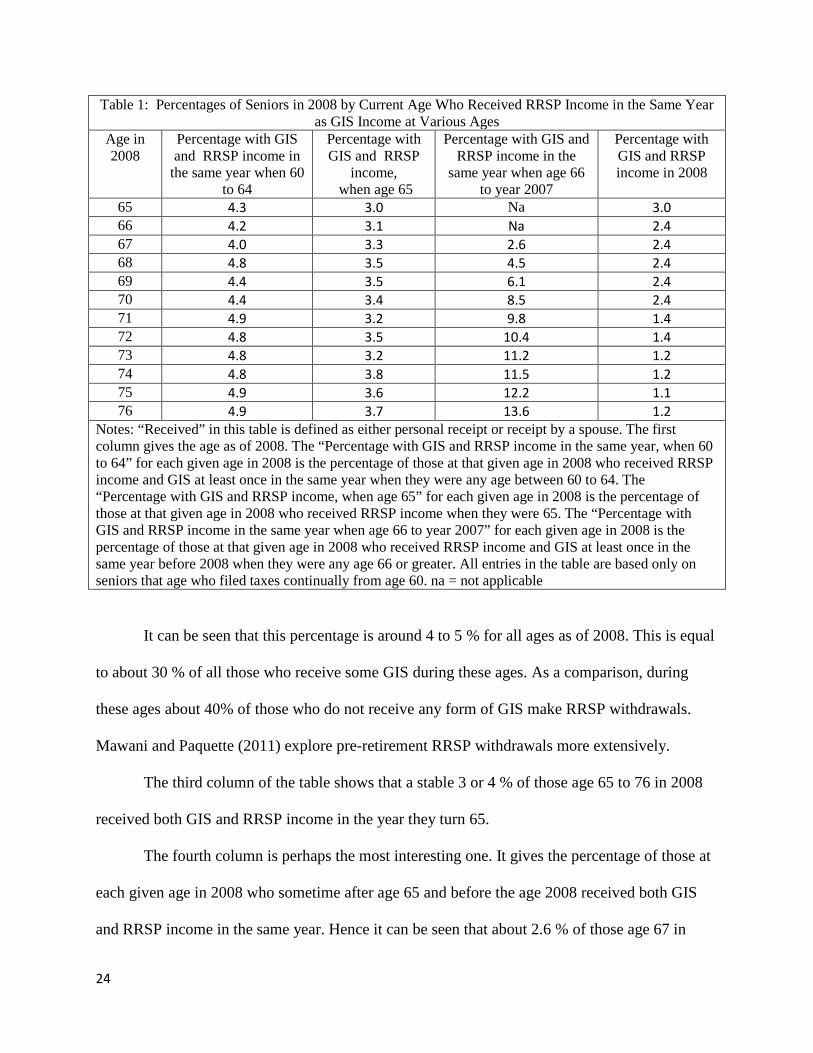
Table 1: Percentages of Seniors in 2008 by Current Age Who Received RRSP Income in the Same Year as GIS Income at Various Ages
Age in 2008
Percentage with GIS and RRSP income in
the same year when 60 to 64
Percentage with GIS and RRSP
income, when age 65
Percentage with GIS and RRSP income in the
same year when age 66 to year 2007
Percentage with GIS and RRSP income in 2008
65 4.3 3.0 Na 3.0 66 4.2 3.1 Na 2.4 67 4.0 3.3 2.6 2.4 68 4.8 3.5 4.5 2.4 69 4.4 3.5 6.1 2.4 70 4.4 3.4 8.5 2.4 71 4.9 3.2 9.8 1.4 72 4.8 3.5 10.4 1.4 73 4.8 3.2 11.2 1.2 74 4.8 3.8 11.5 1.2 75 4.9 3.6 12.2 1.1 76 4.9 3.7 13.6 1.2
Notes: “Received” in this table is defined as either personal receipt or receipt by a spouse. The first column gives the age as of 2008. The “Percentage with GIS and RRSP income in the same year, when 60 to 64” for each given age in 2008 is the percentage of those at that given age in 2008 who received RRSP income and GIS at least once in the same year when they were any age between 60 to 64. The “Percentage with GIS and RRSP income, when age 65” for each given age in 2008 is the percentage of those at that given age in 2008 who received RRSP income when they were 65. The “Percentage with GIS and RRSP income in the same year when age 66 to year 2007” for each given age in 2008 is the percentage of those at that given age in 2008 who received RRSP income and GIS at least once in the same year before 2008 when they were any age 66 or greater. All entries in the table are based only on seniors that age who filed taxes continually from age 60. na = not applicable
It can be seen that this percentage is around 4 to 5 % for all ages as of 2008. This is equal
to about 30 % of all those who receive some GIS during these ages. As a comparison, during
these ages about 40% of those who do not receive any form of GIS make RRSP withdrawals.
Mawani and Paquette (2011) explore pre-retirement RRSP withdrawals more extensively.
The third column of the table shows that a stable 3 or 4 % of those age 65 to 76 in 2008
received both GIS and RRSP income in the year they turn 65.
The fourth column is perhaps the most interesting one. It gives the percentage of those at
each given age in 2008 who sometime after age 65 and before the age 2008 received both GIS
and RRSP income in the same year. Hence it can be seen that about 2.6 % of those age 67 in

25
2008 received GIS and RRSP income when they were 66. About 4.5 % of those aged 68 in 2008
received GIS and RRSP income either when they were 66 or 67. About 6.1% of those aged 69 in
2008 received GIS and RRSP income either when they were 66, 67 or 68. This value continues
to increase towards the bottom of the column such that for those who were 76 in 2008, about
13.6 % received RRSP income at least once between 1998 when they were ages 66 to 75
inclusive.
The final column shows that 1.2 % of those age 76 in 2008 received both GIS and RRSP
income. This is about 3% of all those who received GIS that year.
Hence at least 13.6% of all seniors received RRSP in the same year as GIS income at
least once. Since we stopped at age 75 and have not included occurrences when age 65, it seems
likely that the lifetime estimate is higher. I will conservatively set it at 15%.
Are the amounts significant? Table 2 shows that the values in Table 1 do fall off
somewhat when the restriction that both GIS income and RRSP income must exceed $500 is
added. Still 11.6 % of those age 76 received at least $500 of GIS and $500 of RRSP income in
the same year sometime when they were older than 65 and younger than 76.

26
Table 2: Percentages of Seniors in 2008 by Current Age Who Received RRSP Income > $500 in the Same Year as GIS Income > $500 at Various Ages
Age in 2008
Percentage with GIS and RRSP income both > $500 in the same year
when 60 to 64
Percentage with GIS and RRSP
income both > $500 when age 65
Percentage with GIS and RRSP income both > $500 in the same year
when age 66 to year 2007
Percentage with GIS and RRSP income both > $500 in 2008
65 3.6 2.1 Na 2.1 66 3.7 2.3 Na 2.0 67 3.7 2.5 2.2 2.1 68 4.1 2.4 3.7 2.0 69 3.9 2.6 5.1 2.2 70 4.0 2.5 7.0 1.9 71 4.1 2.4 8.3 1.2 72 4.3 2.6 8.8 1.1 73 4.2 2.4 9.4 1.0 74 4.3 2.5 10.0 1.0 75 4.4 2.6 10.3 1.0 76 4.3 2.6 11.6 1.0
Notes to Table 1 apply except that for an individual to be counted as a GIS and RRSP recipient in this table, both GIS and RRSP income had to exceed $500 for at least one year during the range of ages considered in each column.
Table 3: Percentages of Seniors in 2008 by Current Age Who Received RRSP Income > $2000 in the Same Year as GIS Income > $2000 at Various Ages
Age in 2008
Percentage with GIS and RRSP income both >
$2000 in the same year when 60 to 64
Percentage with GIS and RRSP income
both > $2000 when age 65
Percentage with GIS and RRSP income both >
$2000 in the same year when age 66 to year 2007
Percentage with GIS and RRSP income both > $2000 in 2008
65 2.5 0.9 Na 0.9 66 2.6 1.0 na 0.9 67 2.5 1.0 1.1 1.0 68 2.9 1.0 2.0 0.9 69 2.7 1.1 3.0 1.0 70 2.8 1.0 4.2 0.8 71 2.8 1.0 5.1 0.4 72 3.0 1.1 5.4 0.4 73 2.9 1.0 6.0 0.3 74 3.0 1.0 6.3 0.3 75 3.1 1.0 6.4 0.3 76 2.9 1.0 6.9 0.3
Notes to Table 1 apply except that for an individual to be counted as a GIS and RRSP recipient in this table, both GIS and RRSP income had to exceed $2000 for at least one year during the range of ages considered in each column.
27
Is $500 enough to be significant? Table 3 raises the threshold amount to $2000. The
phaseout on $2000 would be at least $1000, which is surely a meaningful sum for a typical GIS
recipient. It can be seen that adding this threshold cuts the values still further. Of those age 76 in
2008, 6.9 % received $2000 in GIS income and RRSP income in the same year at least once.
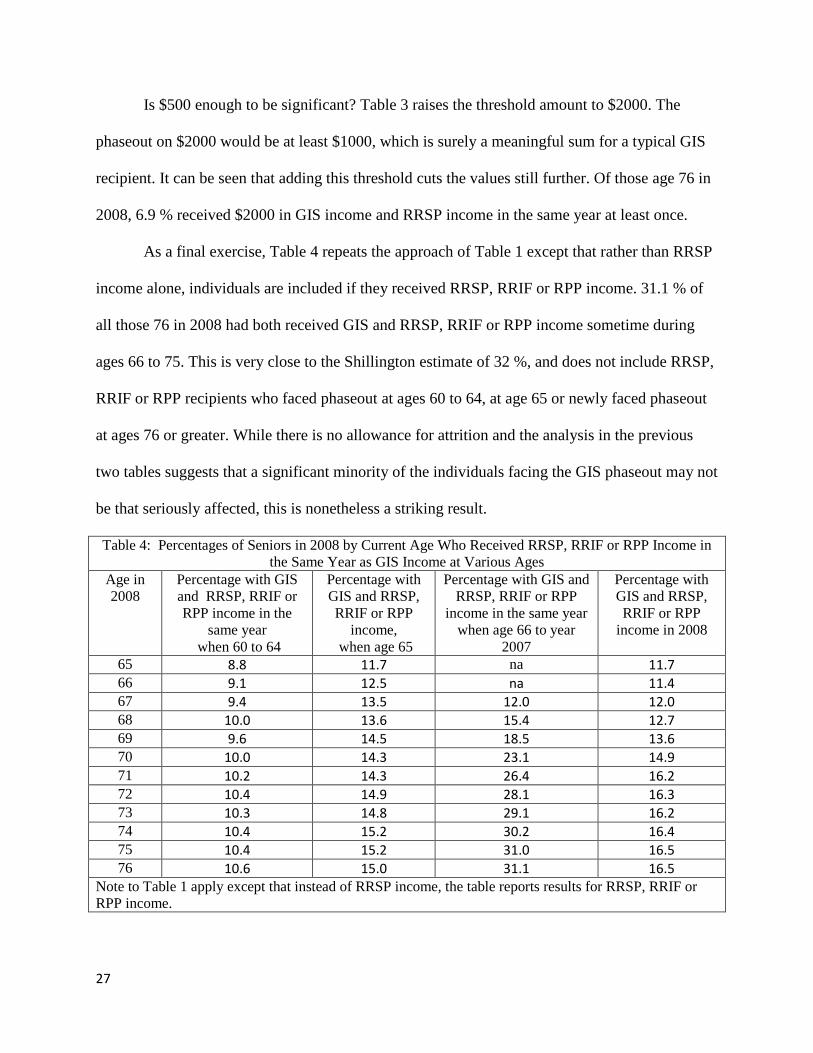
As a final exercise, Table 4 repeats the approach of Table 1 except that rather than RRSP
income alone, individuals are included if they received RRSP, RRIF or RPP income. 31.1 % of
all those 76 in 2008 had both received GIS and RRSP, RRIF or RPP income sometime during
ages 66 to 75. This is very close to the Shillington estimate of 32 %, and does not include RRSP,
RRIF or RPP recipients who faced phaseout at ages 60 to 64, at age 65 or newly faced phaseout
at ages 76 or greater. While there is no allowance for attrition and the analysis in the previous
two tables suggests that a significant minority of the individuals facing the GIS phaseout may not
be that seriously affected, this is nonetheless a striking result.
Table 4: Percentages of Seniors in 2008 by Current Age Who Received RRSP, RRIF or RPP Income in the Same Year as GIS Income at Various Ages
Age in 2008
Percentage with GIS and RRSP, RRIF or RPP income in the
same year when 60 to 64
Percentage with GIS and RRSP, RRIF or RPP
income, when age 65
Percentage with GIS and RRSP, RRIF or RPP
income in the same year when age 66 to year
2007
Percentage with GIS and RRSP, RRIF or RPP
income in 2008
65 8.8 11.7 na 11.7 66 9.1 12.5 na 11.4 67 9.4 13.5 12.0 12.0 68 10.0 13.6 15.4 12.7 69 9.6 14.5 18.5 13.6 70 10.0 14.3 23.1 14.9 71 10.2 14.3 26.4 16.2 72 10.4 14.9 28.1 16.3 73 10.3 14.8 29.1 16.2 74 10.4 15.2 30.2 16.4 75 10.4 15.2 31.0 16.5 76 10.6 15.0 31.1 16.5
Note to Table 1 apply except that instead of RRSP income, the table reports results for RRSP, RRIF or RPP income.
28
Hence I estimate, I believe conservatively, that about 15 % of seniors will have GIS
phaseout applied to their RRSP income (not including RRIF income) sometime during their
lives. Earlier results suggest that these numbers would be larger if RRIF income were included
but as noted, it is difficult it is difficult to identify separately in the LAD. However if we include
RRSP, RRIF and RPP income, I estimate that over 30 % of seniors will have GIS phaseout
applied, very close to the Shillington estimate.
7. Conclusions
Richard Shillington (2003) estimated that 32% of near-seniors were saving for retirement
in what he describes as a futile way, in particular by saving in RRSPs when RRSP withdrawals
would likely be subject to GIS phaseout as well as potentially to personal income tax. Could
such saving not be in error but simply individuals gaining so much from tax-free accumulation
within RRSPs as to offset the phaseout? This paper considers a variety of scenarios and
concludes that this is an unlikely explanation for many individuals, particularly when
considering the alternative of cashing out an RRSP at age 64 to avoid the phaseout.
The paper also conducts a number of empirical checks in the LAD, somewhat hampered
by the fact that the LAD does not provide direct information on RRIF income. My conclusion is
that if one interprets the Shillington estimate as regarding RRSP saving, the 32% figure is likely
too high currently. My estimate, which I argue may be conservative, is about 15%.. While
including RRIF income is difficult as mentioned, this would raise the number above 15%.
Compared to RRSP/RRIF income, RPP income is often much less discretionary (as
many RPPs including almost all defined-benefit RPPs do not allow a cashout before retirement).
If RPP income is included in the analysis, the implied estimate is only slightly lower than
29
Shillington’s. There are many RRSP and RPP savers who end up being subject to GIS phaseout
in ways that strongly suggest a financial planning error has been made.
The policy implications of this research are greatly affected by the presence of Tax Free
Savings Accounts, introduced in 2009, after the data period for this study and not yet included in
the LAD. Nonetheless, I would suggest two lines of consideration:
1. It is difficult to know how far the government should be involved in financial planning.
Nevertheless, this is a case where a group not usually thought of as a prime target for financial
planning could benefit greatly from such advice because they face large effective tax rates. There
may be a significant number of near-seniors who are likely to be GIS recipients contributing to
RRSPs. They should be investing in TFSAs. In any case, consideration should be given to the
government distribution of information to taxpayers, particularly as they approach retirement,
about the relative benefits of RRSP and TFSA saving, with mention of the interaction.15
2. Consideration should also be given to a small exemption of RRSP and RRIF
income16 and perhaps RPP income for the purposes of GIS calculation, analogous to the $3500
15 A switch from RRSP to TFSA contribution has an immediate positive effect on government revenues, although Robbins and Veall (2002) argue that this is misleading. 16 There is the possibility that some individuals are constructing their own de facto exemption, although this cannot be confirmed without access to HRSDC information. The application for GIS http://www.servicecanada.gc.ca/eforms/forms/sc-isp-3025(11-12)(2011-11-15)e.pdf (accessed June 27, 2012) allows an adjustment (section F) for an expected fall in pension income, apparently under the provisions of the Old Age Security Act 14(4) http://laws-lois.justice.gc.ca/eng/acts/O-9/page-10.html#h-13 (accessed June 27, 2012). Section D, Block 2 makes it clear that RRIF income is such pension income although “RRSP income” is not (as per the Instructions to complete the form, http://www.servicecanada.gc.ca/eforms/forms/sc-isp-3025-3026a(2011-11-15)e.pdf, Section D, Block 9, accessed June 27, 2012). This raises the possibility that someone could withdraw all the funds from the RRIF in one year, paying applicable taxes but with no immediate phaseout applied because GIS is calculated for July 1 to June 30 based on the income of the previous complete year. Then in the next year, that individual could submit a new income statement indicating that pension income will now be lower. If GIS payments were based on that estimated income, the GIS phaseout would have been avoided. I have heard an oral anecdote of this strategy being applied successfully but have no hard
30
exemption that has been given labour income earned during retirement. Unfortunately, because
the GIS program is large, even a small exemption could reduce federal government revenues
substantially. The best data for such a calculation would be HRSDC administrative data but as a
very rough calculation, it is estimated about 200,000 GIS recipients (12% of the total of 1.8 m
GIS and Allowance recipients, using Figure 13) receive RRSP or RRIF income. A $1000
exemption is worth $500 to each individual and hence it would cost the federal treasury $500
×200,000 = $100m. Everyone would not use the $1000 exemption, as Table 2 would suggest, but
there would also be a good argument for extending the exemption to RPP income. In any case
this is not offered as a solid number for policy analysis but rather as a preliminary figure to
permit judgment as to whether a firmer estimate should be pursued.
information and was unable to find reference to it on the internet (unlike the strategies of cashout at age 64 or using income splitting, about which there are many posts). Throughout this paper I have assume that the 14(4) is not being used in this manner.

31
References Banerjee, Preet (2012), “How RRSP Payments Can Help Seniors with Benefits”, Globe and Mail, February 24, 2012, http://www.theglobeandmail.com/globe-investor/personal-finance/how-rrsp-payments-can-help-seniors-with-benefits/article548651/ (accessed June 27, 2012) Diamond, Peter and Emmanuel Saez (2011), “The Case for a Progressive Tax: From Basic Research to Policy Recommendations,” CESIFO Working Paper No. 3548, August. Engelhardt, Gary V. and Anil Kumar (2007)“Employer Matching and 401(k) Saving: Evidence from the Health and Retirement Study,” Journal of Public Economics 91:10 (November) 2007: 1920-1943. Finnie, Ross and David Gray (2012) “Guarenteed Income Supplement (GIS) Status Amongst the Retired Population – An Analysis of the Incidence and the Dynamics”, Draft paper prepared for HRSDC/ CLSRN project “Challenges for Canada’s Retirement Income System”. Fretz, Deborah and Michael R. Veall (2000), “The effect of the tax-transfer system on retirement savings", in Frank T. Denton, Deborah Fretz and Byron G. Spencer (eds.) Independence and Economic Security in Old Age, University of British Columbia Press, pp. 346-372. D. Fretz, A. Macnaughton and M. R. Veall (2002), "Policy Approaches to Promote Private and Occupational Old-Age Provision in Canada," Bertelsmann Foundation, Vorsorgestudien, 4. Globe and Mail (2009), (http://www.theglobeandmail.com/report-on-business/retirement/malcolm-hamilton-offers-retirement-planning-advice/article1325008/, posted on October 15, 2009, updated on October 23, 2009, accessed on November 2, 2009. Kesselman, Jonathan and Finn Poschmann (2001), “A new option for retirement savings: Tax-prepaid savings plans” C.D. Howe Institute Commentary 149. Madrian, Brigitte C., and Dennis F. Shea (2001), “The Power of Suggestion: Inertia in 401(k) Participation and Savings Behavior,” Quarterly Journal of Economics 116 : 1149-87. Mawani, Amin and Suzanne Paquette (2011), “Pre-Retirement RRSP Withdrawals”, Canadian Tax Journal, 59: 183-219. Mirrlees, James A. (1971) "An Exploration in the Theory of Optimal Income Taxation." Review of Economic Studies, 38, 175-208. O’Donoghue, Ted, and Matthew Rabin (1999) “Doing It Now or Later.” American Economic Review 89: 103-124. J. Robbins, and M. R. Veall (2002), "Registered Saving Plan Holdings as a Government Asset," C.D. Howe Institute Backgrounder No. 63.
32
Shillington, Richard (1999), “The Dark Side of Targeting: Retirement Saving for Low-Income Canadians”, C.D. Howe Institute Commentary Number 130, September. Shillington, Richard (2003), “New Poverty Traps: Means-Testing and Modest-Income Seniors; C.D. Howe Institute, Backgrounder #65, April. M. R. Veall (2001), "Did Tax Flattening Affect RRSP Contributions?" Canadian Journal of Economics, 120-131. Veall, Michael R. (2008), "Canadian Seniors and the Low-Income Measure", Canadian Public Policy/Analyse de Politiques, November, 47-58.

33
Appendix
While it will turn out that much of the focus will be on withdrawing RRSP assets at age
64, we will begin our discussion with the more conventional scenario under which RRSP
contributions are contributed before retirement and then withdrawn during retirement after age
65. We consider only GIS recipients and hence the GIS phaseout is applicable. We consider only
the GIS phaseout rate of 50% and not the 75% possibility (applicable under the Allowance and
since July 1, 2011 on a certain range of incomes). Nor do we consider interaction with other
programs such as the Ontario Guaranteed Annual Income System (GAINS). For simplicity we
begin with case where withdrawal is immediate upon retirement and then consider the case
where withdrawal is over a longer period of time.17
Considering the immediate withdrawal case, let r be the pre-tax rate of return of the
underlying saving instrument, which is assumed to be constant. Let n be the number of years in
the holding period between the RRSP contribution decision and retirement/withdrawal. Let tc be
the personal income tax rate applicable at the time of contribution which for simplicity is
assumed to hold up until withdrawal. Let tw be the personal income tax rate applicable upon
RRSP withdrawal.
Under these assumptions, switching $1 from consumption to RRSP saving will yield an
additional
.5(1 – tw) (1 + r)n / (1 – tc) (1)
in after-tax retirement savings. The .5 value incorporates the GIS phaseout. The 1 – tw nets out
any personal income taxes applicable upon withdrawal. The 1 – tc in the denominator accounts 17 All of these comparisons focus on the analytic question as to what form of saving a given dollar yields the greatest financial return. It does not consider that the presence of RRSPs may have a behavioural influence on whether the dollar will be saved in the first place, e.g. by helping to give households the self-control to make saving decisions they subsequently value or encouraging households to make the effort to invest more effectively (e.g. in finding assets with better rates of return).

34
for the tax-deductibility of RRSP contributions: the contributor makes a contribution 1/ (1 – tc) >
1, but there is a tax refund of tc /(1 – tc ) so the net consumption sacrifice is exactly 1.
Switching $1 from consumption to non-RRSP saving (with a taxable annual return) will
yield an additional
(1 + r (1 – tc))n (2)
in after-tax retirement savings.
The holding period n* such that the RRSP rate of return equals the non-RRSP rate of
return is determined by
n* = [log(1 – tc) - log(1 – tw) – log .5]/[log(1 + r) – log (1 + r (1 – tc)] (3)
where log is the natural logarithm. If the holding period longer than n*, the RRSP strategy will
dominate. If the holding period is shorter than n*, the non-RRSP strategy will be better. I would
argue that this comparison is likely biased towards the RRSP strategy because in the non-RRSP
strategy, the saving is taxed fully and annually as if saving is entirely in certificates of deposit or
bonds and not at all in equities (which have the advantage of the dividend tax credit and special
treatment of capital gains).
As discussed in the text, the decision to save using an RRSP for age 65 and beyond
logically embeds the decision as to whether or not to withdraw all RRSP assets at age 64 and
avoid the GIS phaseout on the withdrawal. Hence we frame this decision around age 64 and
think of n* (and the holding periods we will discuss under alternate scenarios below) as being the
number of years past age 64.
Now consider gradual withdrawal. Under Registered Retirement Income Fund (RRIF)
Scenario I, after the initial holding period of n years (as in expression (1)), 10% of the current

35
balance is withdrawn at the beginning of each year until the end of year T at which the remainder
is withdrawn. The present value at the end of the year of this stream of withdrawals18 is:
.5A(1 – tw) (1 + r)n / (1 – tc) (4)
where A = .9T (1 + r) T + Σ (0.1)(1 + r)i-1 (1 + r (1 – tw – 0.5))T-i where Σ represents a
summation in i that runs from 1 to T. Expression (4) is expression (1) multiplied by A: A
accounts for the gradual withdrawal.
The comparable present value for the non-RRSP strategy is:
(1 + r (1 – tc))n (1 + r (1 – tw – 0.5))T (5)
where compounding after the holding period is at a return subject both to the personal income tax
rate tw and the GIS phaseout of 50%.
With gradual withdrawal, the pre-withdrawal holding period nG* - 9 that makes the RRSP
and non-RRSP strategies have equal returns is set by
nG* - 9 = [log(1–tc) –log(1–tw)–log .5A +Tlog (1+r (1–tw–0.5)]/[log(1 + r)–log (1+r (1–tc)] (6)
where note that nG* - 9 is the number of years before withdrawal begins. Because the
withdrawals take 10 years, the year of the last withdrawal is nG* years after age 64.
The first two scenarios (immediate withdrawal and RRIF Withdrawal Scenario I) are
reasonably simple to describe analytically but do not comply with the law. In 2008, it was legally
required to begin RRSP withdrawals at age 70 by withdrawing 5 % and with percentage
withdrawals in each subsequent year of 7.38, 7.48, 7.59, 7.71, 7.85, 7.99, 8.15, 8.33, 8.53, 8.75,
8.99, 9.27, 9.58, 9.93, 10.33, 10.79, 11.33, 11.96, 12.71, 13.62, 14.73, 16.12 and 17.92 which is
up to age 93. After age 93 a straight 20 % per year withdrawal was required. In RRIF
Withdrawal Scenario II, this minimum withdrawal strategy (with no withdrawals prior to age 70) 18 The present value needs to be calculated to provide a comparison with the non-RRSP saving alternative. The present value in year T is the accumulative value obtained by assuming that each withdrawal in the stream is then saved at annual rate of return r subject to tw, the personal income tax rate as well as the 50% GIS phaseout rate.
36
is simulated up to age 93. It is assumed that as funds are withdrawn they are invested at the same
rate of interest outside the RRSP but with full, annual taxation. Again the comparison is against
the alternative strategy of cashing out the RRSP completely at age 64 and then investing at the
same rate of return that is taxable annually and fully.
Now let us consider the three scenarios numerically. Table A1 considers immediate one-
shot withdrawal. It gives the minimum holding period required for the tax-free cumulation
feature in RRSPs to be strong enough to offset the negative effect of the GIS phaseout and any
differential in taxes. The tax rate at time of contribution and in all periods prior to withdrawal, tc,
is given the four possible values (0, 0.1, 0.2,0.3,0.4), where it is unlikely that someone who has a
marginal tax rate higher than 0.4 at age 64 will eventually receive GIS. The tax rate at time of
withdrawal, tw, is given three possible values (0,0.1,0.2,0.3), where 0.4 is omitted because it is
too high to be coincident with GIS phaseout. (In any case tw = 0.4 implies very long holding
periods.) Three possible rates of return r are considered: (0,0.05,0.10).
Whenever tc = 0 (i.e. the tax rate at time of contribution and in all periods prior to
withdrawal is zero), the table states that there can be no holding period long enough such that
saving in an RRSP is advantageous relative to saving outside an RRSP. Such a situation is
denoted by “∞” in the table. The logic is that with tc = 0, there can be no tax-free cumulation to
offset the effect of the GIS phaseout. As tc increases, the value of tax-free cumulation increases
so the minimum holding period falls.
It can also be seen from Table A1 that as the tax rate at time of withdrawal tw increases,
so does the minimum holding period as RRSP saving becomes less advantageous. When the rate
of return r = 0, there can be no holding period long enough to make RRSP saving advantageous,
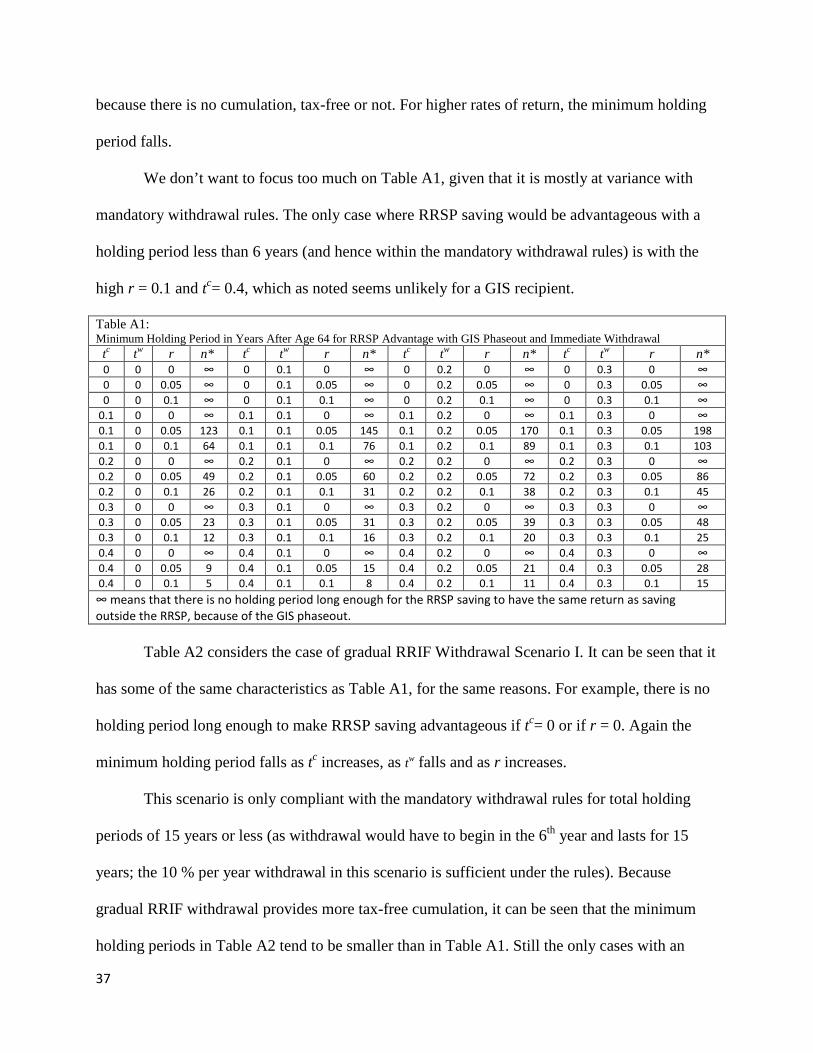
37
because there is no cumulation, tax-free or not. For higher rates of return, the minimum holding
period falls.
We don’t want to focus too much on Table A1, given that it is mostly at variance with
mandatory withdrawal rules. The only case where RRSP saving would be advantageous with a
holding period less than 6 years (and hence within the mandatory withdrawal rules) is with the
high r = 0.1 and tc= 0.4, which as noted seems unlikely for a GIS recipient.
Table A1: Minimum Holding Period in Years After Age 64 for RRSP Advantage with GIS Phaseout and Immediate Withdrawal
tc tw r n* tc tw r n* tc tw r n* tc tw r n* 0 0 0 ∞ 0 0.1 0 ∞ 0 0.2 0 ∞ 0 0.3 0 ∞ 0 0 0.05 ∞ 0 0.1 0.05 ∞ 0 0.2 0.05 ∞ 0 0.3 0.05 ∞ 0 0 0.1 ∞ 0 0.1 0.1 ∞ 0 0.2 0.1 ∞ 0 0.3 0.1 ∞
0.1 0 0 ∞ 0.1 0.1 0 ∞ 0.1 0.2 0 ∞ 0.1 0.3 0 ∞ 0.1 0 0.05 123 0.1 0.1 0.05 145 0.1 0.2 0.05 170 0.1 0.3 0.05 198 0.1 0 0.1 64 0.1 0.1 0.1 76 0.1 0.2 0.1 89 0.1 0.3 0.1 103 0.2 0 0 ∞ 0.2 0.1 0 ∞ 0.2 0.2 0 ∞ 0.2 0.3 0 ∞ 0.2 0 0.05 49 0.2 0.1 0.05 60 0.2 0.2 0.05 72 0.2 0.3 0.05 86 0.2 0 0.1 26 0.2 0.1 0.1 31 0.2 0.2 0.1 38 0.2 0.3 0.1 45 0.3 0 0 ∞ 0.3 0.1 0 ∞ 0.3 0.2 0 ∞ 0.3 0.3 0 ∞ 0.3 0 0.05 23 0.3 0.1 0.05 31 0.3 0.2 0.05 39 0.3 0.3 0.05 48 0.3 0 0.1 12 0.3 0.1 0.1 16 0.3 0.2 0.1 20 0.3 0.3 0.1 25 0.4 0 0 ∞ 0.4 0.1 0 ∞ 0.4 0.2 0 ∞ 0.4 0.3 0 ∞ 0.4 0 0.05 9 0.4 0.1 0.05 15 0.4 0.2 0.05 21 0.4 0.3 0.05 28 0.4 0 0.1 5 0.4 0.1 0.1 8 0.4 0.2 0.1 11 0.4 0.3 0.1 15 ∞ means that there is no holding period long enough for the RRSP saving to have the same return as saving outside the RRSP, because of the GIS phaseout.
Table A2 considers the case of gradual RRIF Withdrawal Scenario I. It can be seen that it
has some of the same characteristics as Table A1, for the same reasons. For example, there is no
holding period long enough to make RRSP saving advantageous if tc= 0 or if r = 0. Again the
minimum holding period falls as tc increases, as tw falls and as r increases.
This scenario is only compliant with the mandatory withdrawal rules for total holding
periods of 15 years or less (as withdrawal would have to begin in the 6th year and lasts for 15
years; the 10 % per year withdrawal in this scenario is sufficient under the rules). Because
gradual RRIF withdrawal provides more tax-free cumulation, it can be seen that the minimum
holding periods in Table A2 tend to be smaller than in Table A1. Still the only cases with an

38
RRSP savings advantage and total holding periods of less than 15 years are some of those with
tc= 0.3 with the very high interest rate of r = 0.1 and some of those with tc= 0.4, which as noted
is a high tax rate at age 64 for someone who will be a GIS recipient.
Table A2: Minimum Total Holding Period in Years After Age 64 for RRSP Advantage with GIS Phaseout and RRIF Scenario I
tc tw r nG* tc tw r nG* tc tw r nG* tc tw R nG* 0 0 0 ∞ 0 0.1 0 ∞ 0 0.2 0 ∞ 0 0.3 0 ∞ 0 0 0.05 ∞ 0 0.1 0.05 ∞ 0 0.2 0.05 ∞ 0 0.3 0.05 ∞ 0 0 0.1 ∞ 0 0.1 0.1 ∞ 0 0.2 0.1 ∞ 0 0.3 0.1 ∞
0.1 0 0 ∞ 0.1 0.1 0 ∞ 0.1 0.2 0 ∞ 0.1 0.3 0 ∞ 0.1 0 0.05 102 0.1 0.1 0.05 117 0.1 0.2 0.05 136 0.1 0.3 0.05 157 0.1 0 0.1 42 0.1 0.1 0.1 46 0.1 0.2 0.1 52 0.1 0.3 0.1 60 0.2 0 0 ∞ 0.2 0.1 0 ∞ 0.2 0.2 0 ∞ 0.2 0.3 0 ∞ 0.2 0 0.05 43 0.2 0.1 0.05 51 0.2 0.2 0.05 60 0.2 0.3 0.05 70 0.2 0 0.1 19 0.2 0.1 0.1 21 0.2 0.2 0.1 24 0.2 0.3 0.1 28 0.3 0 0 ∞ 0.3 0.1 0 ∞ 0.3 0.2 0 ∞ 0.3 0.3 0 ∞ 0.3 0 0.05 22 0.3 0.1 0.05 27 0.3 0.2 0.05 34 0.3 0.3 0.05 41 0.3 0 0.1 11 0.3 0.1 0.1 12 0.3 0.2 0.1 14 0.3 0.3 0.1 17 0.4 0 0 ∞ 0.4 0.1 0 ∞ 0.4 0.2 0 ∞ 0.4 0.3 0 ∞ 0.4 0 0.05 11 0.4 0.1 0.05 15 0.4 0.2 0.05 19 0.4 0.3 0.05 25 0.4 0 0.1 9 0.4 0.1 0.1 9 0.4 0.2 0.1 9 0.4 0.3 0.1 11 Under RRIF Withdrawal Scenario I, beginning year nG*- 9, there is a withdrawal of 10% of the balance for 9 years, with the remaining balance withdrawn in the tenth year. ∞ means that there is no holding period long enough for the RRSP saving to have the same return as saving outside the RRSP.
Table A3: Minimum Holding Period in Years After Age 64 for RRSP Advantage with GIS Phaseout and RRIF Scenario II
tc tw r N tc tw R n tc tw r n tc tw R n 0 0 0 ∞ 0 0.1 0 ∞ 0 0.2 0 ∞ 0 0.3 0 ∞ 0 0 0.05 ∞ 0 0.1 0.05 ∞ 0 0.2 0.05 ∞ 0 0.3 0.05 ∞ 0 0 0.1 22 0 0.1 0.1 25 0 0.2 0.1 >29 0 0.3 0.1 >29
0.1 0 0 ∞ 0.1 0.1 0 ∞ 0.1 0.2 0 ∞ 0.1 0.3 0 ∞ 0.1 0 0.05 ∞ 0.1 0.1 0.05 ∞ 0.1 0.2 0.05 ∞ 0.1 0.3 0.05 ∞ 0.1 0 0.1 16 0.1 0.1 0.1 19 0.1 0.2 0.1 23 0.1 0.3 0.1 27 0.2 0 0 ∞ 0.2 0.1 0 ∞ 0.2 0.2 0 ∞ 0.2 0.3 0 ∞ 0.2 0 0.05 >29 0.2 0.1 0.05 >29 0.2 0.2 0.05 >29 0.2 0.3 0.05 ∞ 0.2 0 0.1 12 0.2 0.1 0.1 14 0.2 0.2 0.1 17 0.2 0.3 0.1 21 0.3 0 0 ∞ 0.3 0.1 0 ∞ 0.3 0.2 0 ∞ 0.3 0.3 0 ∞ 0.3 0 0.05 18 0.3 0.1 0.05 >29 0.3 0.2 0.05 >29 0.3 0.3 0.05 >29 0.3 0 0.1 8 0.3 0.1 0.1 11 0.3 0.2 0.1 13 0.3 0.3 0.1 16 0.4 0 0 ∞ 0.4 0.1 0 ∞ 0.4 0.2 0 ∞ 0.4 0.3 0 ∞ 0.4 0 0.05 8 0.4 0.1 0.05 14 0.4 0.2 0.05 22 0.4 0.3 0.05 >29 0.4 0 0.1 6 0.4 0.1 0.1 6 0.4 0.2 0.1 6 0.4 0.3 0.1 6 Under RRIF Withdrawal Scenario II, there is no withdrawal until age 70 at which point the minimum legal withdrawals are maintained annually. As the RRSP advantage is being compared to complete withdrawal at age 64, the minimum holding period is 70 – 64 = 6 years. These results were calculated by a simulation run over the ages 64 to 93. As 93 – 64 = 29, >29 means that the simulation suggested that there would be a period longer than 29 years at which there would be an RRSP advantage as compared to saving outside an RRSP after age 64. ∞ means that the simulation suggested that there would be no holding period long enough for the RRSP saving to have the same return as saving outside the RRSP.

39
Finally, Table A3 considers RRIF Scenario II, which is the minimum withdrawal
schedule compliant with the rules. This holding period can be either longer or shorter than that in
RRIF Scenario I, depending upon the parameters. However if consideration is restricted to the
more reasonable rate of return of r = 0.05, it can be seen that with tc = 0.3 and tw = 0, a holding
period of 18 years is enough. Aside from that only cases with tc= 0.4 have reasonable holding
periods.
Overall, it would seem that while not universally true, for the most likely cases an
individual who will be a GIS recipient will likely be better off by cashing out any RRSPs at age
64, before GIS eligibility. This view is strenghtened by the LAD calculations in the text of this
paper that many GIS recipients who receive RRSP income are paying personal income tax as
well as facing GIS phaseout. These calculations have been based on very simple savings
strategies in bonds or guaranteed income certificates. The disadvantage of saving in RRSPs past
age 64 would be greater for saving instruments such as Canadian equities because of the
dividend tax credit and the tax treatment of capital gains.