cancers caused by occupation in great britain
DESCRIPTION
Cancers Caused by Occupation in Great Britain. L Rushton 1 , T. Brown 2 , R Bevan 3 , J Cherrie 4 , L Fortunato 1 , S Bagga 3 , P Holmes 3 , S Hutchings 1 , R Slack 3 , M Van Tongeren 4 , C Young 2 1 Dept. of Epidemiology and Public Health, Imperial College London ; [email protected] - PowerPoint PPT PresentationTRANSCRIPT

Cancers Caused by Occupation in Great Britain
L Rushton1, T. Brown2, R Bevan3, J Cherrie4, L Fortunato1, S Bagga3, P Holmes3, S Hutchings1, R Slack3, M Van Tongeren4, C Young2
1 Dept. of Epidemiology and Public Health, Imperial College London; [email protected] Health and Safety Laboratory, Buxton, Derbyshire3 Institute of Environment and Health, Cranfield University4 Institute of Occupational Medicine
This study was funded by the Health and Safety Executive
Why Try and Estimate the Burden of Occupational Cancer?
• Identification of major risk factors
• Identification of high risk populations
• Provide ‘performance’ indicators for monitoring
• Support decisions on priority actions for risk reduction
• Facilitate planning for future needs
• Foster priority-setting in health research
Aims of the overall study
• Current Burden of Occupational Cancer:– Estimate size of current burden based on past exposures at work– to identify important cancer sites– to identify industries and occupations for targeting for reduction
measures– Estimation carried out for all substances and circumstances (e.g.
work as a painter or welder) in the workplace defined by International Agency for Research on Cancer as definite (group 1) and probable (group 2A) human carcinogens
• Prediction of Future Burden of Occupational Cancer– Estimate size of future burden based on current and past
exposures– Identify cancer sites, carcinogens and industry sectors where the
burden is greatest– Demonstrate effects of measures to reduce exposure
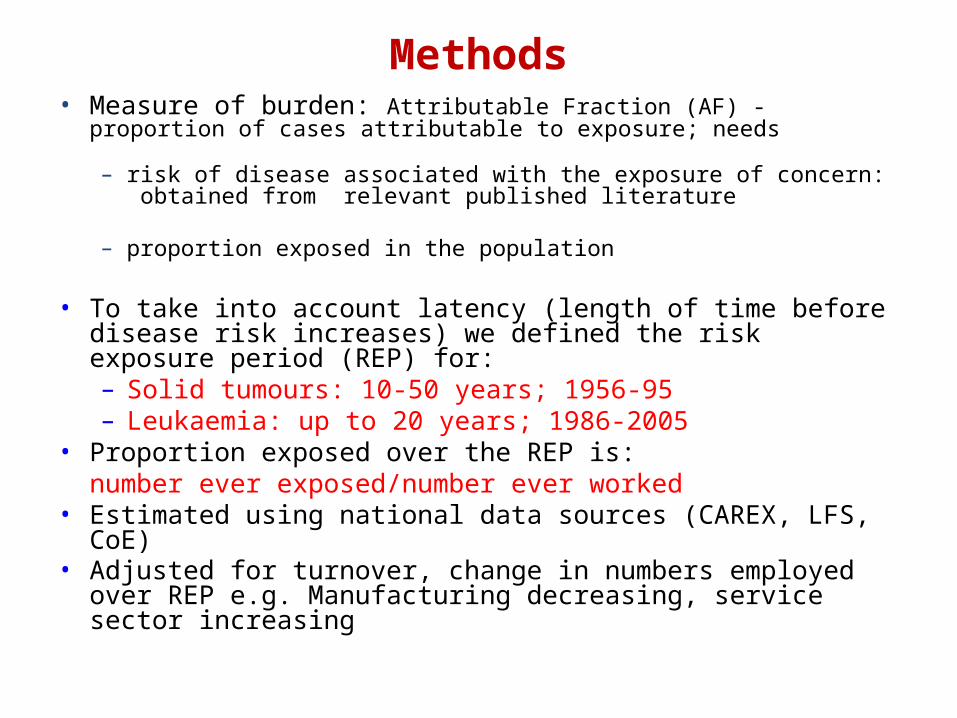
Methods• Measure of burden: Attributable Fraction (AF) - proportion of cases
attributable to exposure; needs
– risk of disease associated with the exposure of concern: obtained from relevant published literature
– proportion exposed in the population
• To take into account latency (length of time before disease risk increases) we defined the risk exposure period (REP) for:– Solid tumours: 10-50 years; 1956-95– Leukaemia: up to 20 years; 1986-2005
• Proportion exposed over the REP is:number ever exposed/number ever worked
• Estimated using national data sources (CAREX, LFS, CoE)• Adjusted for turnover, change in numbers employed over REP
e.g. Manufacturing decreasing, service sector increasing

Cancer site: Attributable Fraction(%) Attrib Deaths (2005) Attrib. Registrations (2004)
Male Female Total Male Female Total Male Female TotalBladder 7.1 1.9 5.3 215 30 245 496 54 550Bone 0.0 0.0 0.0 0 0 0 0 0 0Brain 0.5 0.1 0.3 10 1 11 12 2 14Breast 4.6 4.6 555 555 1,969 1,969Cervix 0.7 0.7 7 7 18 18Kidney 0.04 0.04 0.04 1 1 1 2 1 3Larynx 2.9 1.6 2.6 17 3 20 50 6 56Leukaemia 0.9 0.5 0.7 18 5 23 30 9 38Liver 0.2 0.1 0.2 4 2 5 4 1 5Lung 21.1 5.3 14.5 4,020 725 4,745 4,627 815 5,442Lympho-haematopoietic 0.004 0.002 0.003 0 0 0 0 0 0Melanoma (eye) 2.9 0.4 1.6 1 0 1 6 1 6Mesothelioma 97.0 82.5 94.9 1,699 238 1,937 1,699 238 1,937Multiple Myeloma 0.4 0.1 0.3 5 1 6 8 2 10Nasopharynx 10.8 2.4 8.0 7 1 8 14 1 15NHL 2.1 1.1 1.7 43 14 57 102 39 140
NMSC 6.9 1.1 4.5 20 2 23 2,513 349 2,862
Oesophagus 3.3 1.1 2.5 156 28 184 159 29 188Ovary 0.5 0.5 23 23 33 33Pancreas 0.02 0.01 0.01 1 0 1 1 0 1Sinonasal 43.3 19.8 32.7 27 10 38 95 31 126Soft Tissue Sarcoma 3.4 1.1 2.4 11 3 13 22 4 27
Stomach 3.0 0.3 1.9 101 6 108 149 9 157Thyroid 0.12 0.02 0.05 0 0 0 1 0 1
Total 8.2 2.3 5.3 6,355 1,655 8,010 9,988 3,611 13,598Total GB cancers 15+yrs 77,912 72,212 150,124 175,399 168,184 343,583
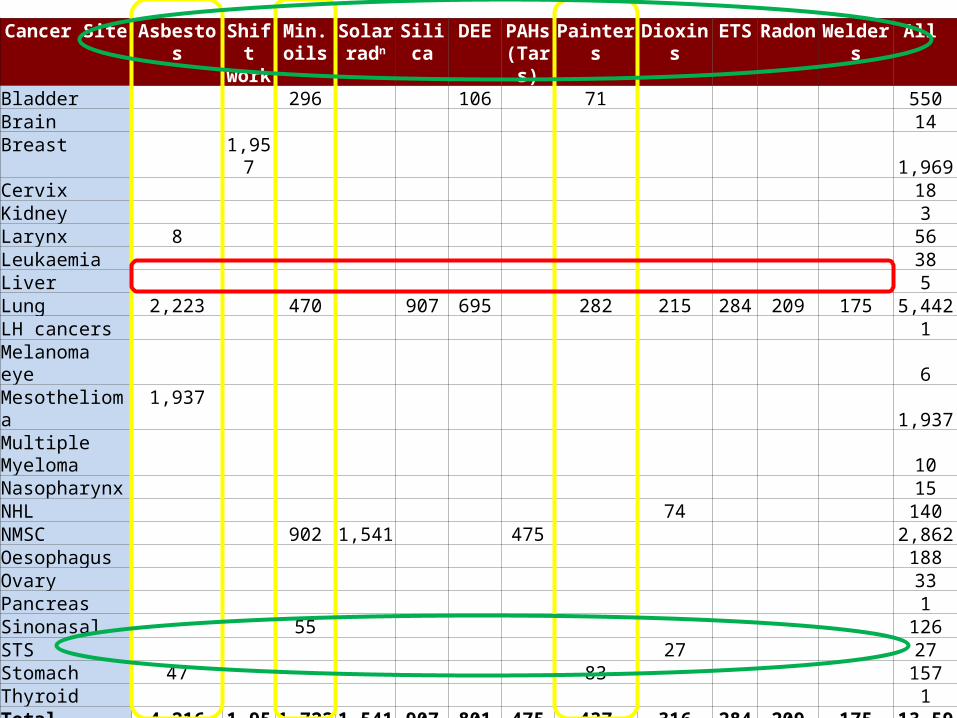
Cancer Site Asbestos Shift work
Min. oils
Solar radn
Silica DEE PAHs (Tars
)
Painters Dioxins ETS Radon Welders All
Bladder 296 106 71 550Brain 14Breast 1,957 1,969Cervix 18Kidney 3Larynx 8 56Leukaemia 38Liver 5Lung 2,223 470 907 695 282 215 284 209 175 5,442LH cancers 1Melanoma eye 6Mesothelioma 1,937 1,937Multiple Myeloma
10
Nasopharynx 15NHL 74 140NMSC 902 1,541 475 2,862Oesophagus 188Ovary 33Pancreas 1Sinonasal 55 126STS 27 27Stomach 47 83 157Thyroid 1Total Attrib. Registrations
4,216 1,957 1,722 1,541 907 801 475 437 316 284 209 175 13,598
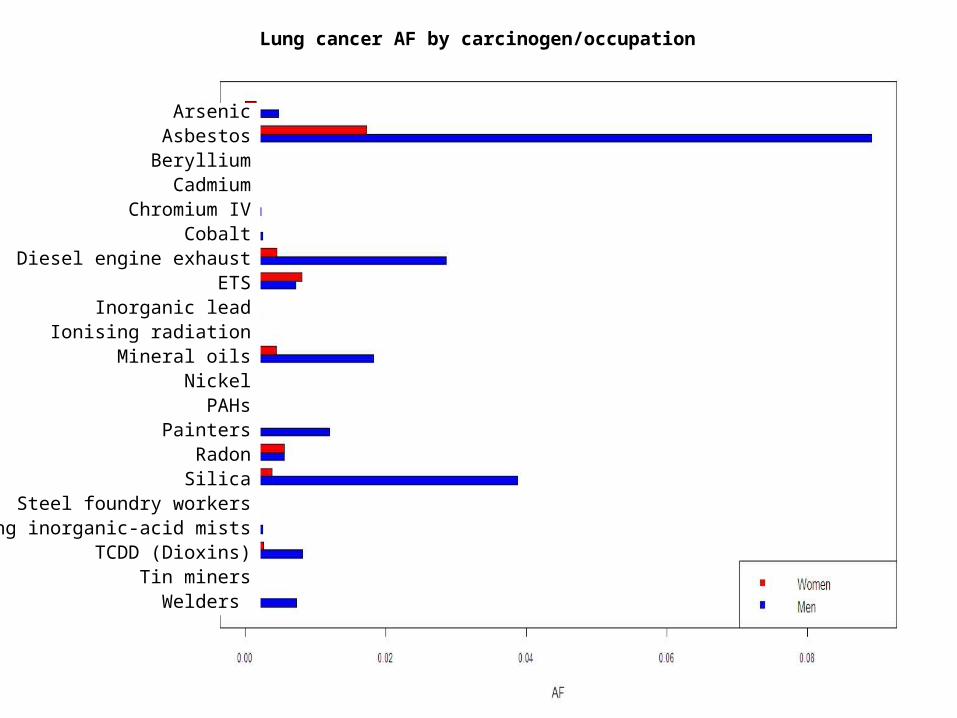
ArsenicAsbestosBerylliumCadmium
Chromium IVCobalt
Diesel engine exhaustETS
Inorganic leadIonising radiation
Mineral oilsNickelPAHs
PaintersRadon
SilicaSteel foundry workers
Strong inorganic-acid mistsTCDD (Dioxins)
Tin minersWelders
Lung cancer AF by carcinogen/occupation
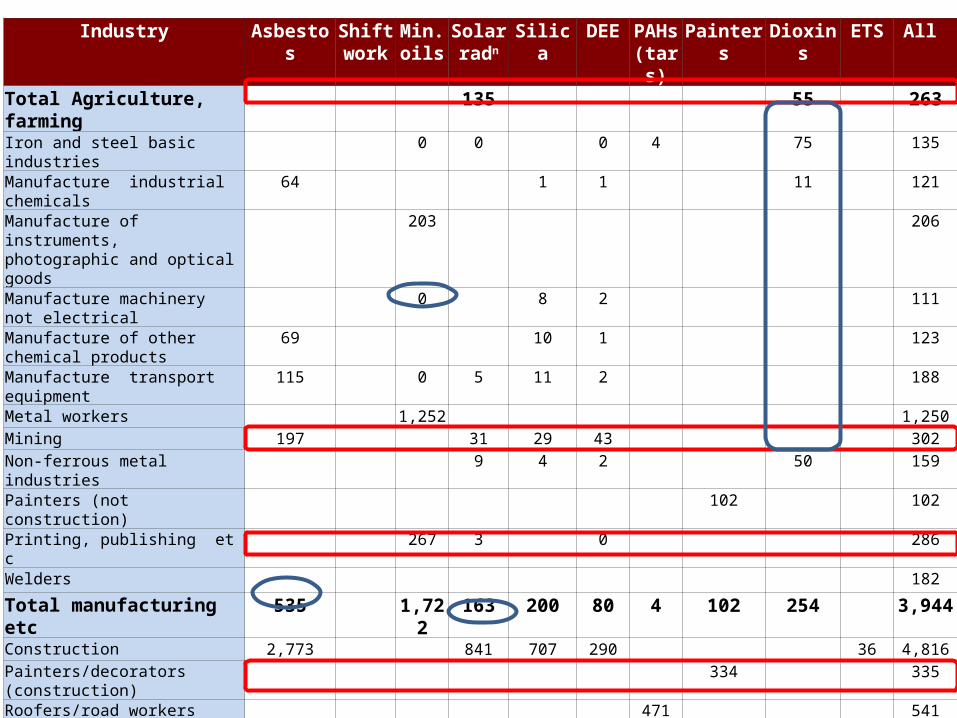
Industry Asbestos Shift work
Min. oils
Solar radn
Silica DEE PAHs (tars)
Painters Dioxins ETS All
Total Agriculture, farming 135 55 263Iron and steel basic industries 0 0 0 4 75 135Manufacture industrial chemicals 64 1 1 11 121Manufacture of instruments, photographic and optical goods
203 206
Manufacture machinery not electrical
0 8 2 111
Manufacture of other chemical products
69 10 1 123
Manufacture transport equipment
115 0 5 11 2 188
Metal workers 1,252 1,250Mining 197 31 29 43 302Non-ferrous metal industries 9 4 2 50 159Painters (not construction) 102 102Printing, publishing et c 267 3 0 286Welders 182
Total manufacturing etc 535 1,722 163 200 80 4 102 254 3,944Construction 2,773 841 707 290 36 4,816Painters/decorators (construction)
334 335
Roofers/road workers (construction)
471 541
Total Construction 2,773 841 707 290 471 334 36 5439Land transport 133 6 350 3 505Personal/household services 361 7 14 29 22 804Public admin./defence 240 20 273Shift work 1,957 1,957Wholesale, retail, restaurants 66 6 6 7 118 269
Total service industry 573 1,957 7 402 431 7 248 4,177Total Attrib. Registrations 4,216 1,957 1,722 1,541 907 801 475 437 316 284 13,598

Construction Industry
AF% Deaths Registrations
Construction 2.30 3457 4668Painters and decorators (construction) 0.17 254 334Roofers, road surfacers, Roadmen, Paviors (Construction) 0.00 4 471Total Construction 2.46 3694 5439
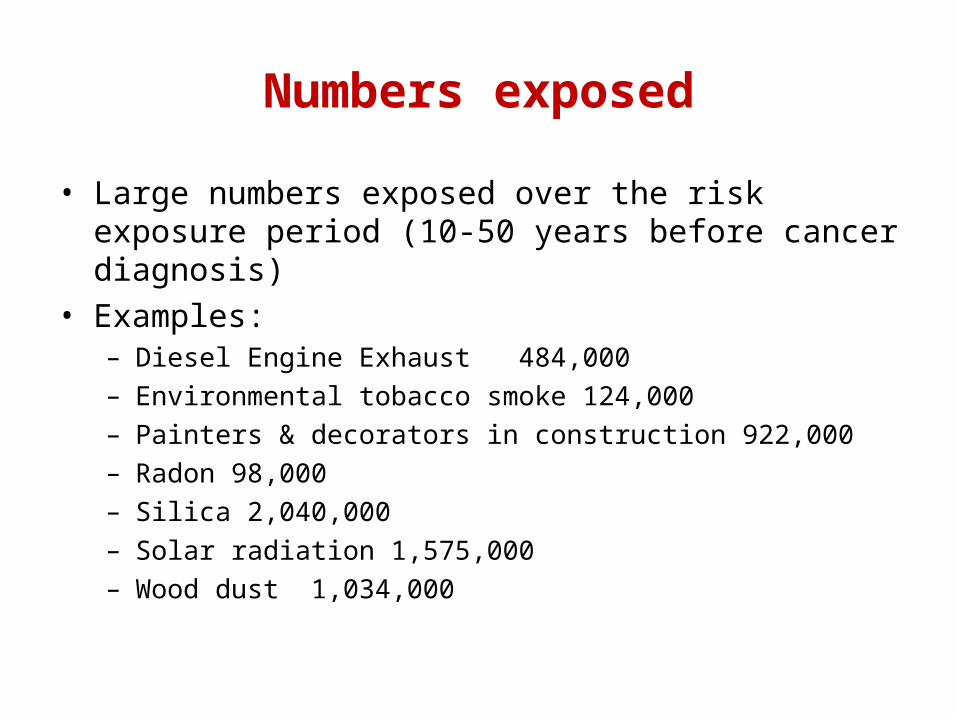
Numbers exposed
• Large numbers exposed over the risk exposure period (10-50 years before cancer diagnosis)
• Examples:– Diesel Engine Exhaust 484,000– Environmental tobacco smoke 124,000– Painters & decorators in construction 922,000– Radon 98,000– Silica 2,040,000– Solar radiation 1,575,000– Wood dust 1,034,000

Cancer Registrations Attributable to Work in the Construction Industry - Men
0 500 1000 1500 2000 2500 3000 3500 4000
ArsenicAsbestos
ChromiumCobaltDiesel
ETSFormaldehyde
LeadPainters
PAHPAH - coal tars
and pitchesRadonSilica
Solar RadiationTetrachloroethylene
Wood dust
Carc
inog
en
Number of Registrations
Construction, inc painters anddecorators; road surfacers,
roadmen, roofers & glazers, paviours
Other Sectors
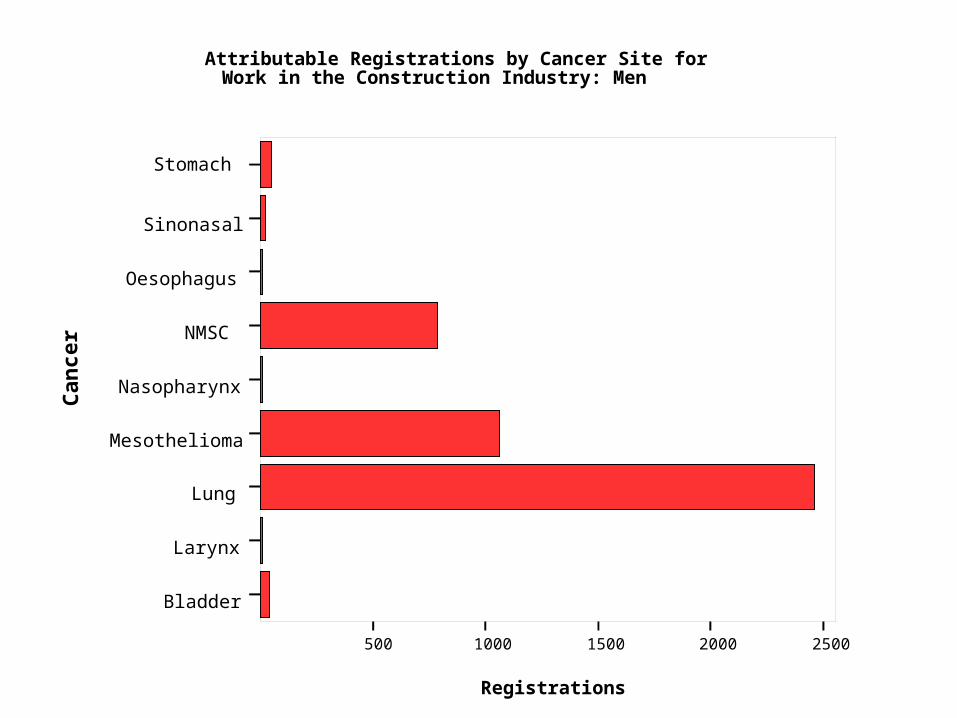
500 1000 1500 2000 2500
Registrations
Bladder
Larynx
Lung
Mesothelioma
Nasopharynx
NMSC
Oesophagus
Sinonasal
Stomach
Canc
erAttributable Registrations by Cancer Site for
Work in the Construction Industry: Men
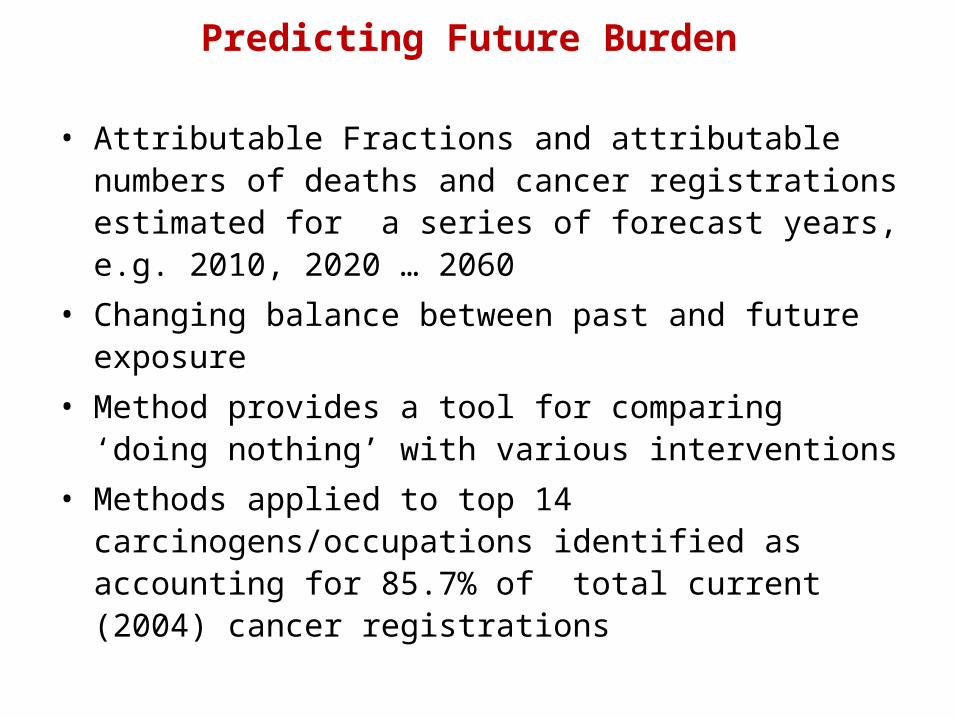
Predicting Future Burden
• Attributable Fractions and attributable numbers of deaths and cancer registrations estimated for a series of forecast years, e.g. 2010, 2020 … 2060
• Changing balance between past and future exposure
• Method provides a tool for comparing ‘doing nothing’ with various interventions
• Methods applied to top 14 carcinogens/occupations identified as accounting for 85.7% of total current (2004) cancer registrations
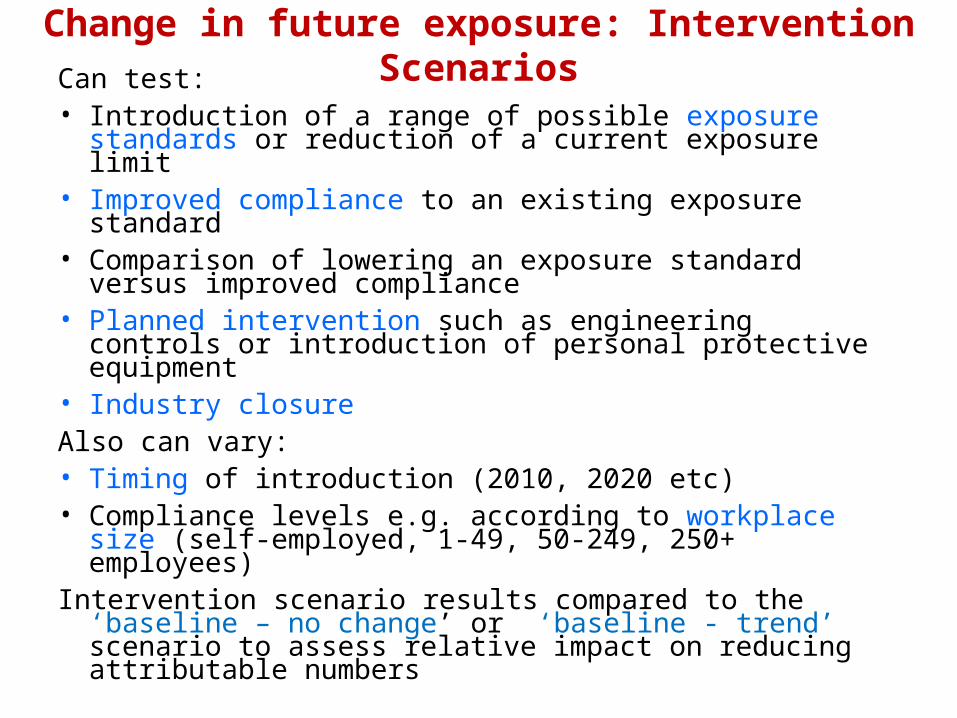
Change in future exposure: Intervention ScenariosCan test:• Introduction of a range of possible exposure standards
or reduction of a current exposure limit• Improved compliance to an existing exposure standard• Comparison of lowering an exposure standard versus
improved compliance• Planned intervention such as engineering controls or
introduction of personal protective equipment• Industry closureAlso can vary:• Timing of introduction (2010, 2020 etc)• Compliance levels e.g. according to workplace size (self-
employed, 1-49, 50-249, 250+ employees)Intervention scenario results compared to the ‘baseline –
no change’ or ‘baseline - trend’ scenario to assess relative impact on reducing attributable numbers
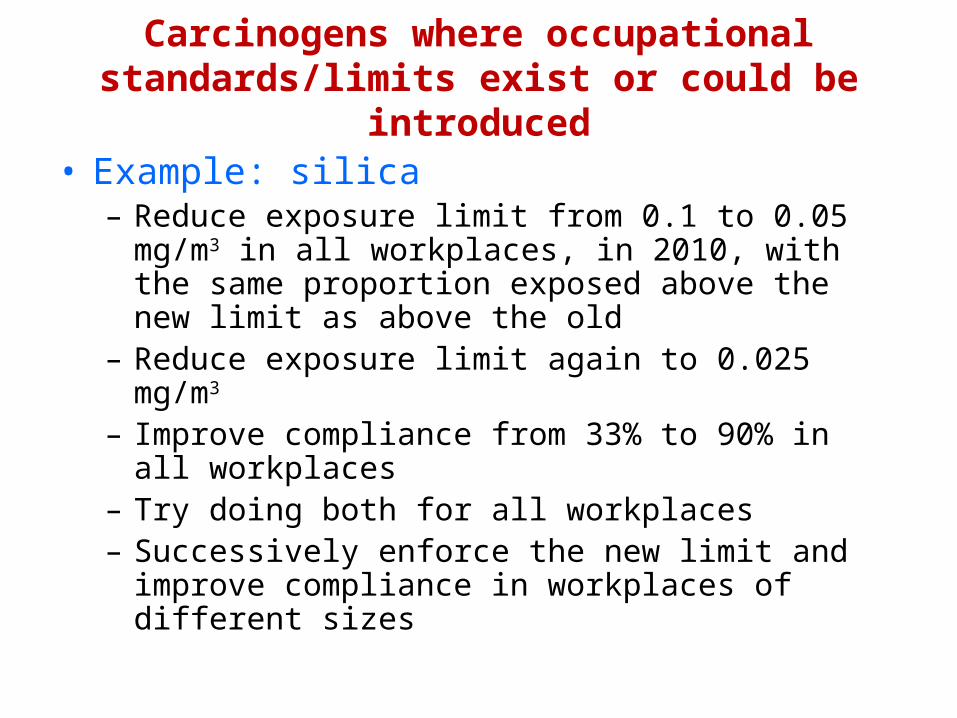
Carcinogens where occupational standards/limits exist or could be introduced
• Example: silica– Reduce exposure limit from 0.1 to 0.05 mg/m3 in all
workplaces, in 2010, with the same proportion exposed above the new limit as above the old
– Reduce exposure limit again to 0.025 mg/m3
– Improve compliance from 33% to 90% in all workplaces
– Try doing both for all workplaces– Successively enforce the new limit and improve
compliance in workplaces of different sizes
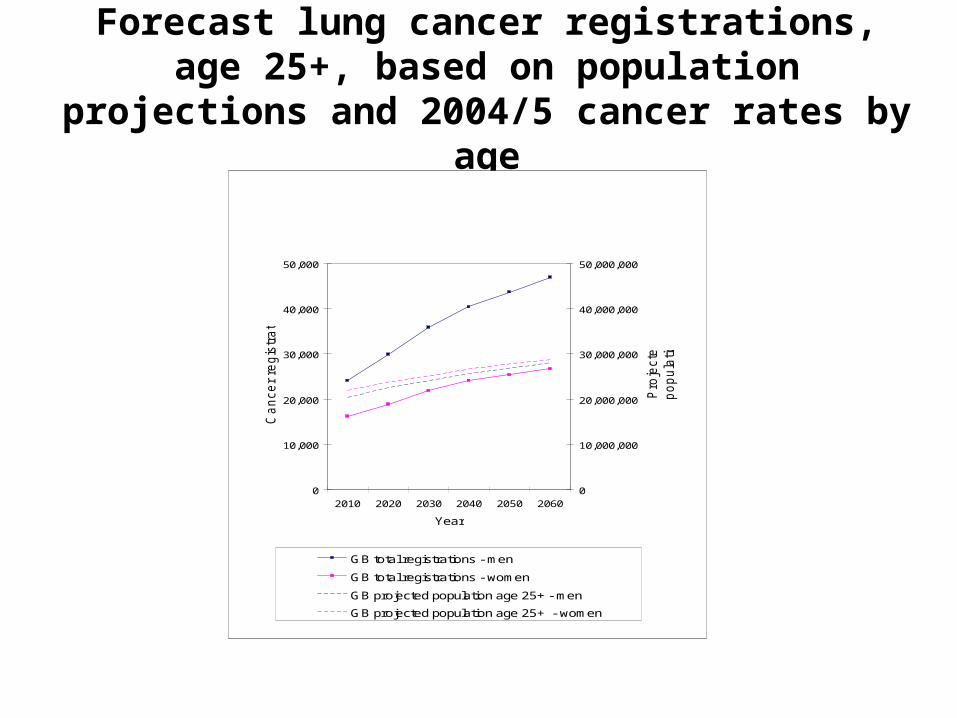
Forecast lung cancer registrations, age 25+, based on population projections and 2004/5 cancer rates by age
0
10,000
20,000
30,000
40,000
50,000
2010 2020 2030 2040 2050 2060
Year
Ca
nce
r re
gis
tra
tio
ns
0
10,000,000
20,000,000
30,000,000
40,000,000
50,000,000
Pro
jecte
d
po
pu
latio
n
GB total registrations - men
GB total registrations - women
GB projected population age 25+ - men
GB projected population age 25+ - women

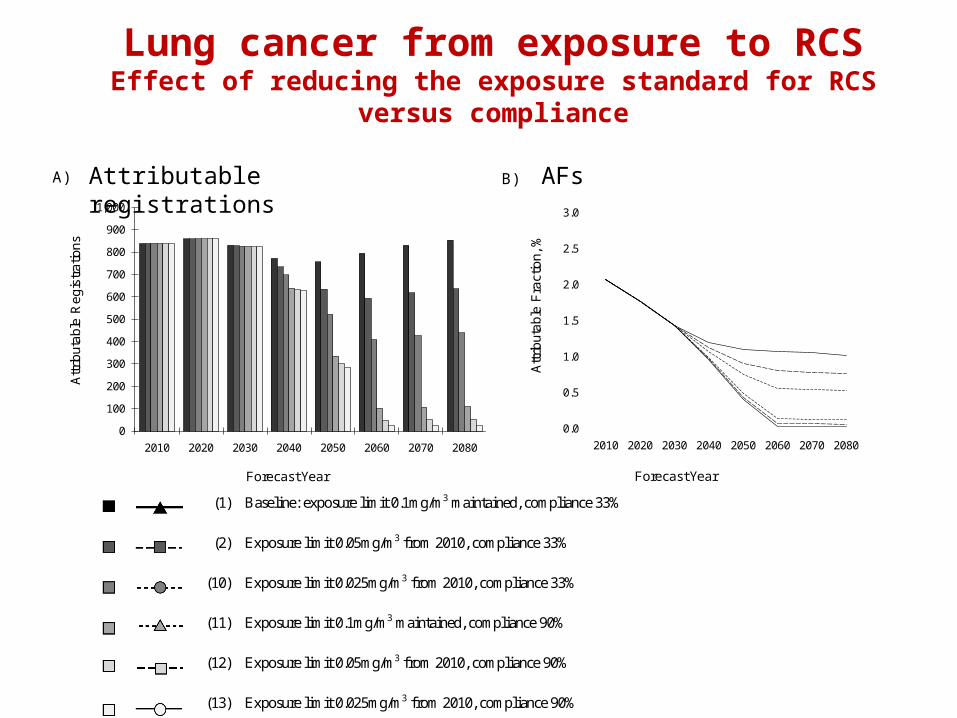
Testing reduction of exposure standard and changes in complianceForecast lung cancers for 2060 for Respirable Crystalline Silica
2010
Attributable Fraction
Attributable registrations
Avoided registrations
3.3 803
2060
Base-line: exposure limit 0.1mg/m3, compliance 33%
1.08 794
Exposure limit 0.05mg/m3, compliance 33% 0.80 592 202
Exposure limit 0.025mg/m3, compliance 33% 0.56 409 385
Exposure limit 0.1mg/m3, compliance 90% 0.14 102 693
Exposure limit 0.05mg/m3, compliance 90% 0.07 49 745
Exposure limit 0.025mg/m3, compliance 90% 0.03 21 773
0
100
200
300
400
500
600
700
800
900
1,000
2010 2020 2030 2040 2050 2060 2070 2080
Attr
ibu
tab
le R
eg
istr
atio
ns
Forecast Year
A)
0.0
0.5
1.0
1.5
2.0
2.5
3.0
2010 2020 2030 2040 2050 2060 2070 2080
Attr
ibu
tab
le F
ract
ion
, %
Forecast Year
B)
Lung cancer from exposure to RCSEffect of reducing the exposure standard for RCS versus
compliance
Attributable registrations AFs
(1) Baseline: exposure limit 0.1mg/m3 maintained, compliance 33%
(2) Exposure limit 0.05mg/m3 from 2010, compliance 33%
(10) Exposure limit 0.025mg/m3 from 2010, compliance 33%
(11) Exposure limit 0.1mg/m3 maintained, compliance 90%
(12) Exposure limit 0.05mg/m3 from 2010, compliance 90%
(13) Exposure limit 0.025mg/m3 from 2010, compliance 90%
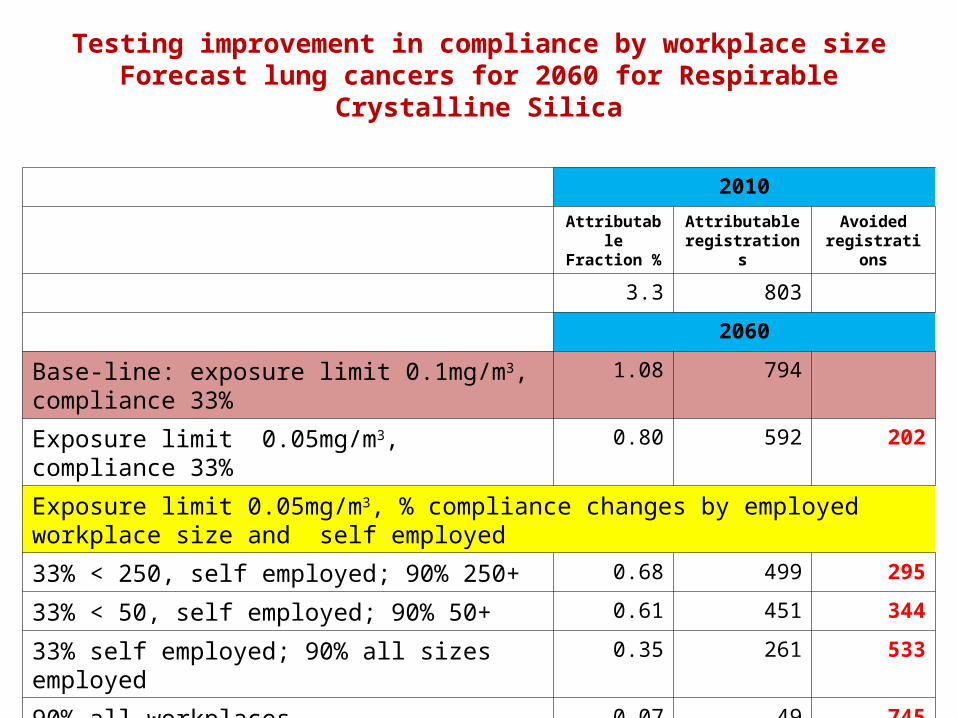
Testing improvement in compliance by workplace sizeForecast lung cancers for 2060 for Respirable Crystalline Silica
2010
Attributable Fraction %
Attributable registrations
Avoided registrations
3.3 803
2060
Base-line: exposure limit 0.1mg/m3, compliance 33%
1.08 794
Exposure limit 0.05mg/m3, compliance 33% 0.80 592 202
Exposure limit 0.05mg/m3, % compliance changes by employed workplace size and self employed
33% < 250, self employed; 90% 250+ 0.68 499 295
33% < 50, self employed; 90% 50+ 0.61 451 344
33% self employed; 90% all sizes employed 0.35 261 533
90% all workplaces 0.07 49 745

0
100
200
300
400
500
600
700
800
900
1,000
2010 2020 2030 2040 2050 2060 2070 2080
Attr
ibu
tab
le R
eg
istr
atio
ns
Forecast Year
A)
0.0
0.5
1.0
1.5
2.0
2.5
3.0
2010 2020 2030 2040 2050 2060 2070 2080
Attr
ibu
tab
le F
ract
ion
, %
Forecast Year
B)
Lung cancer from exposure to RCSEffect of improved compliance by workplace size
Attributable registrations AFs
(1) Baseline: exposure limit 0.1mg/m3, compliance 33%
(2) Exposure limit 0.05mg/m3 from 2010, compliance 33% all workplaces
(6) Exposure limit 0.05mg/m3 from 2010, compliance 33% < 250, self employed; 90% 250+
(7) Exposure limit 0.05mg/m3 from 2010, compliance 33% < 50, self employed; 90% 50+
(8) Exposure limit 0.05mg/m3 from 2010, compliance 33% self employed; 90% all sizes employed
(9) Exposure limit 0.05mg/m3 from 2010, compliance 90% all workplaces
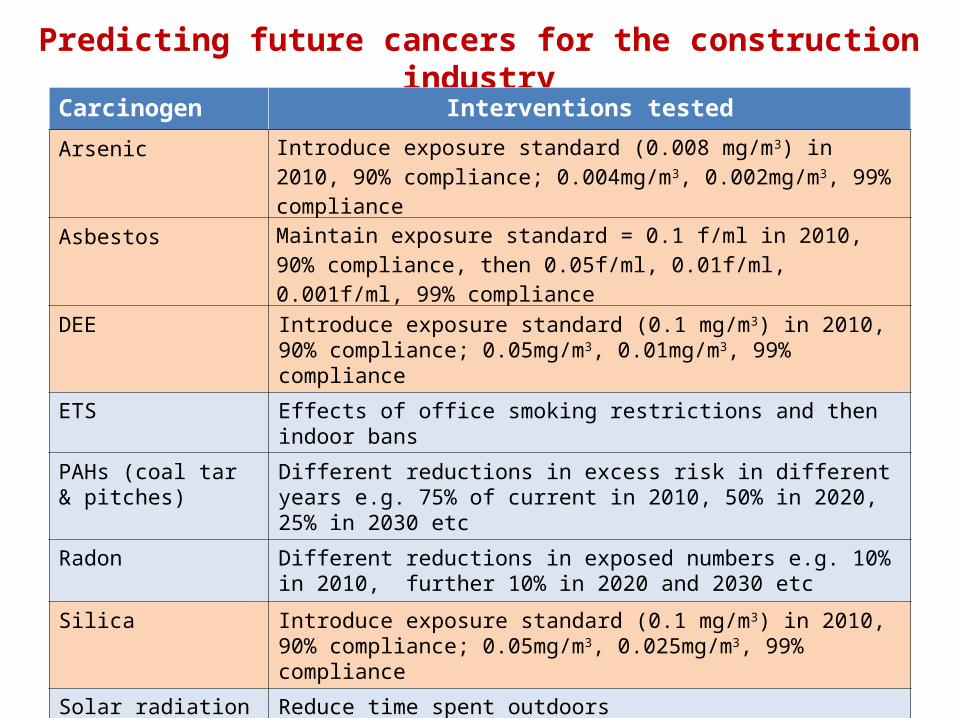
Predicting future cancers for the construction industry
Carcinogen Interventions tested
Arsenic Introduce exposure standard (0.008 mg/m3) in 2010, 90% compliance; 0.004mg/m3, 0.002mg/m3, 99% compliance
Asbestos Maintain exposure standard = 0.1 f/ml in 2010, 90% compliance, then 0.05f/ml, 0.01f/ml, 0.001f/ml, 99% compliance
DEE Introduce exposure standard (0.1 mg/m3) in 2010, 90% compliance; 0.05mg/m3, 0.01mg/m3, 99% compliance
ETS Effects of office smoking restrictions and then indoor bans
PAHs (coal tar & pitches)
Different reductions in excess risk in different years e.g. 75% of current in 2010, 50% in 2020, 25% in 2030 etc
Radon Different reductions in exposed numbers e.g. 10% in 2010, further 10% in 2020 and 2030 etc
Silica Introduce exposure standard (0.1 mg/m3) in 2010, 90% compliance; 0.05mg/m3, 0.025mg/m3, 99% compliance
Solar radiation Reduce time spent outdoors
Tetrachloroethylene Introduce exposure standard (4.2 mg/m3) in 2010, 90% compliance; 2.1mg/m3, 1.5mg/m3, 99% compliance
Work as a painter Different reductions in excess risk in different years e.g. 75% of current in 2010, 50% in 2020, 25% in 2030 etc
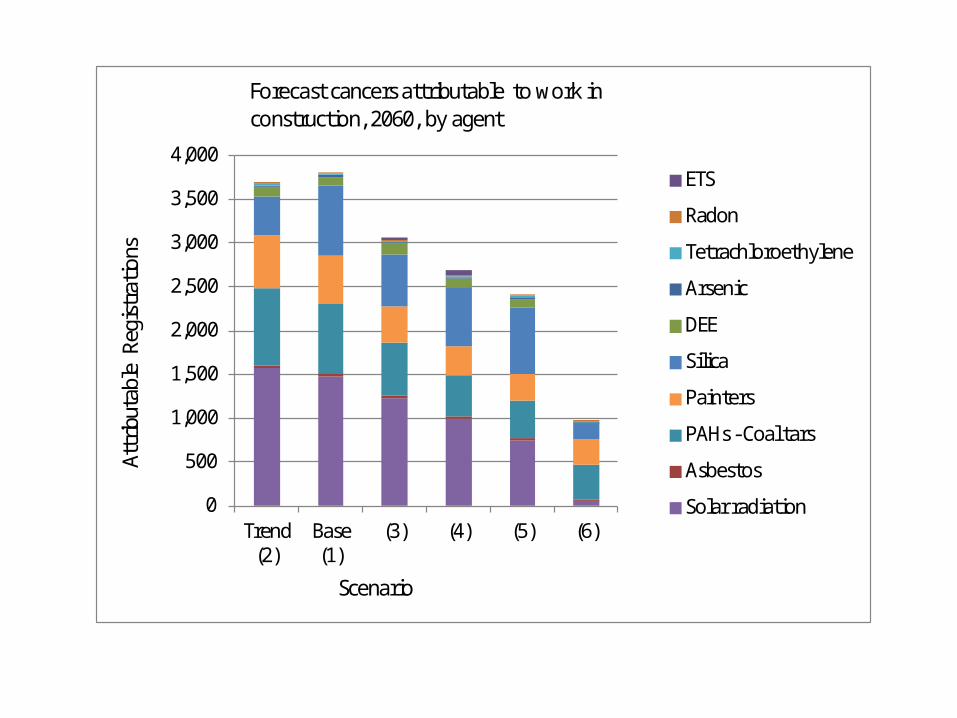
0
500
1,000
1,500
2,000
2,500
3,000
3,500
4,000
Trend (2)
Base (1)
(3) (4) (5) (6)
ETS
Radon
Tetrachloroethylene
Arsenic
DEE
Silica
Painters
PAHs - Coal tars
Asbestos
Solar radiation
Scenario
Attrib
utab
leRe
gist
ratio
ns
Forecast cancers attributable to work in construction, 2060, by agent
0
500
1,000
1,500
2,000
2,500
3,000
3,500
4,000
Trend (2)
Base (1)
(3) (4) (5) (6)
Cervix
NHL
Larynx
Oesophagus
Bladder
Mesothelioma
Stomach
Lung
NMSC
Scenario
Attrib
utab
leRe
gist
ratio
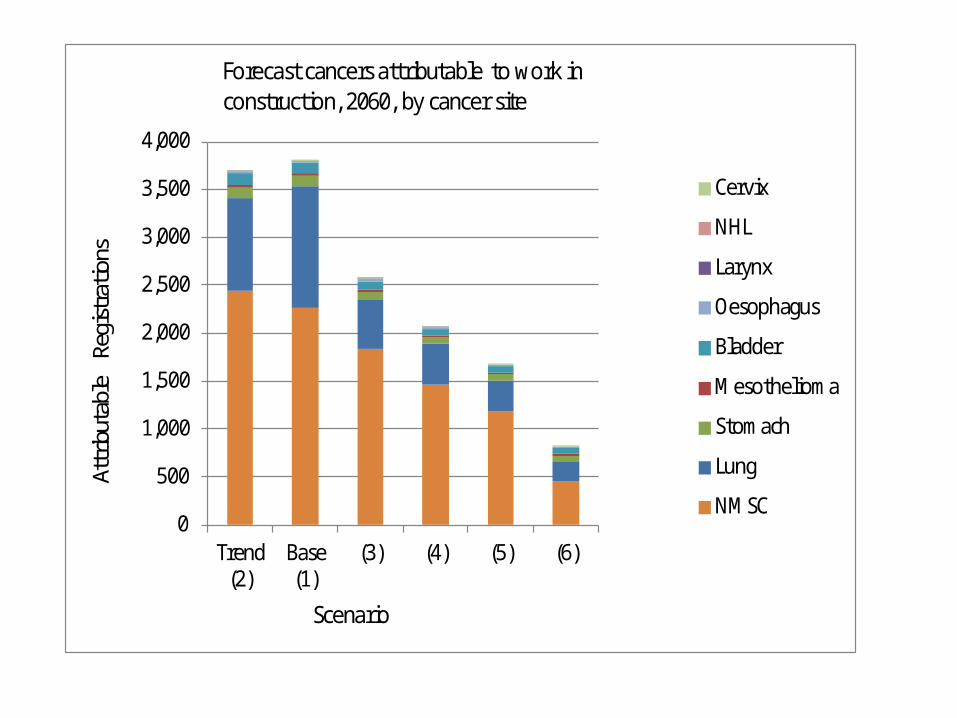
nsForecast cancers attributable to work in construction, 2060, by cancer site
Summary of Future Burden Results
• 14 agents account for 85.7% current occupation attributable cancer (2004), 12,000 cancers in 2010
• Will rise to nearly 13,000 by 2060 given current trends in employment and exposure levels (>12,300 if current levels maintained). Aging population is a factor.
• No impact seen until 2030 because of general increase in cancers due to aging population
• With modest intervention over 2,000 cancers can be avoided by 2060 (including 376 lung, 928 breast cancers, 432 NMSC)
• With stronger interventions nearly 8,500 can be avoided by 2060 (including 1,732 lung, 3,062 breast and 3,287 NMSC)
• Methods enables effective interventions to be identified• Need to monitor exposure levels in future to assess whether
interventions have been successful
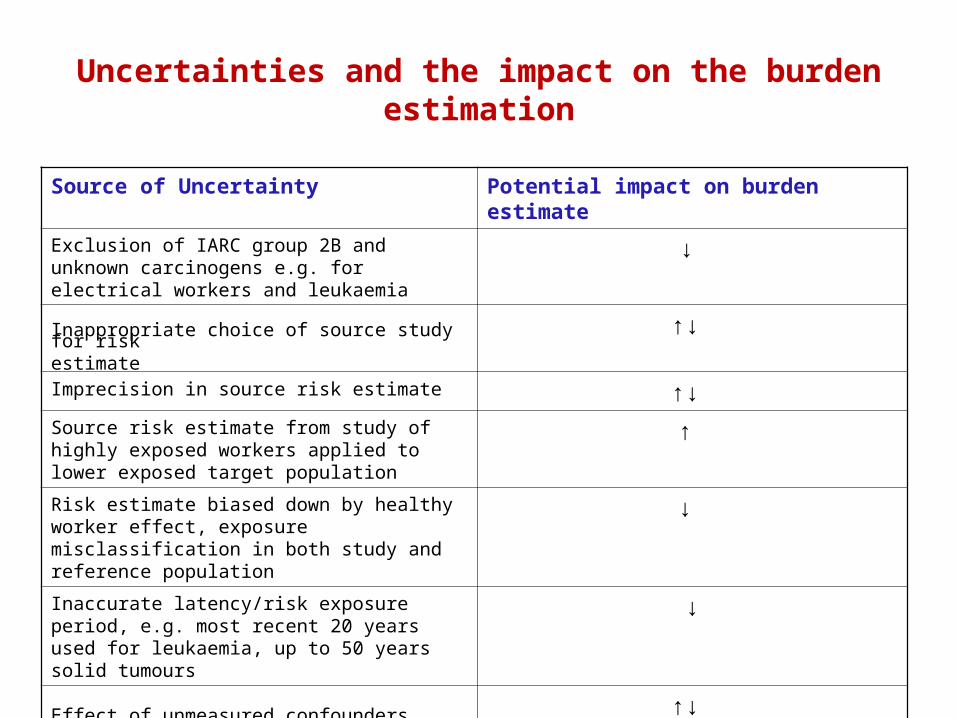
Uncertainties and the impact on the burden estimation
Source of Uncertainty Potential impact on burden estimate
Exclusion of IARC group 2B and unknown carcinogens e.g. for electrical workers and leukaemia
↓
Inappropriate choice of source study for risk estimate
↑↓
Imprecision in source risk estimate ↑↓ Source risk estimate from study of highly exposed workers applied to lower exposed target population
↑
Risk estimate biased down by healthy worker effect, exposure misclassification in both study and reference population
↓
Inaccurate latency/risk exposure period, e.g. most recent 20 years used for leukaemia, up to 50 years solid tumours
↓
Effect of unmeasured confounders ↑↓
Unknown proportion exposed at different levels ↑↓
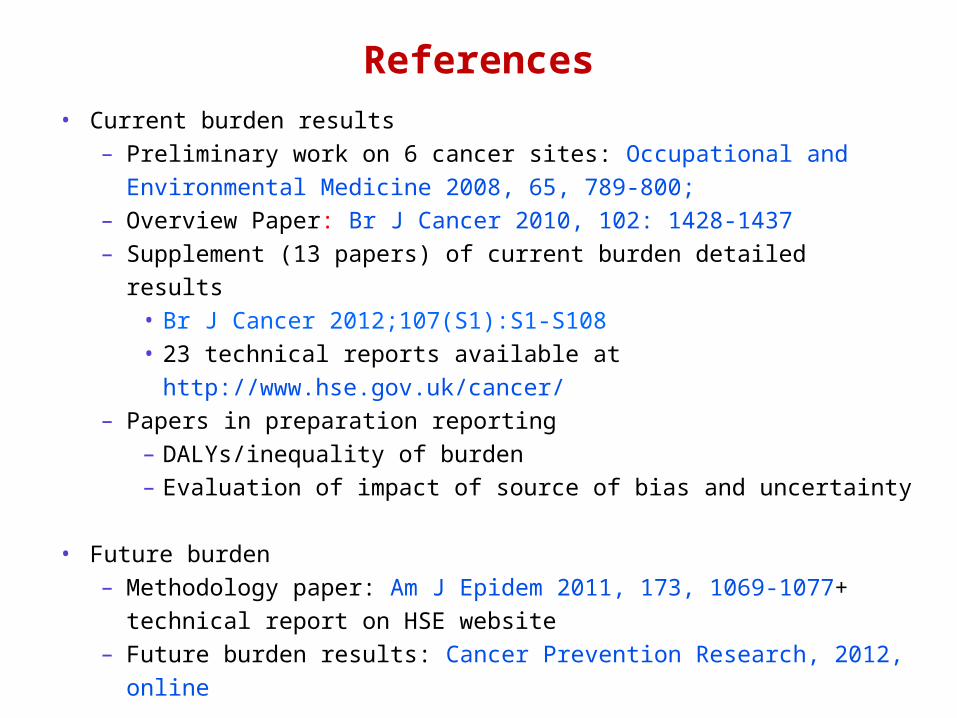
References
• Current burden results– Preliminary work on 6 cancer sites: Occupational and
Environmental Medicine 2008, 65, 789-800; – Overview Paper: Br J Cancer 2010, 102: 1428-1437 – Supplement (13 papers) of current burden detailed results
• Br J Cancer 2012;107(S1):S1-S108 • 23 technical reports available at
http://www.hse.gov.uk/cancer/– Papers in preparation reporting
– DALYs/inequality of burden– Evaluation of impact of source of bias and uncertainty
• Future burden– Methodology paper: Am J Epidem 2011, 173, 1069-1077+
technical report on HSE website– Future burden results: Cancer Prevention Research, 2012, online