canine object perception studied with noninvasive
TRANSCRIPT
Department of Equine and Small Animal Medicine Faculty of Veterinary Medicine
University of Helsinki Finland
CANINE OBJECT PERCEPTION STUDIED WITH NON-INVASIVE ELECTROENCEPHALOGRAPHY
AND EYE GAZE TRACKING
-A COMPARATIVE PERSPECTIVE
Heini Törnqvist
DOCTORAL DISSERTATION
To be presented for public discussion with the permission of the Faculty of Veterinary Medicine of the University of Helsinki, in Auditorium 108, Metsätieteiden
talo, Latokartanonkaari 7, on the 23th of October 2020 at 12.15 o’clock.
Helsinki 2020

Supervised by Professor Outi Vainio, DVM, PhD, DECVPT Department of Equine and Small Animal Medicine University of Helsinki Finland
Docent Miiamaaria V. Kujala, PhD Department of Psychology University of Jyväskylä Finland
Reviewed by Professor Per Jensen, PhD
Department of Physics, Chemistry and Biology Linköping University Sweden
Professor Kun Guo, PhD School of psychology University of Lincoln United Kindom
Opponent Professor Josep Call, PhD School of Psychology and Neuroscience University of St Andrews United Kingdom
ISBN 978-951-51-6699-9 (pbk.) ISBN 978-951-51-6700-2 (PDF) Unigrafia Helsinki 2020

3
ABSTRACT
Canine cognition has been widely studied especially with behavioral methods.
Behavioral studies have shown that dog’s social cognitive abilities are similar to
preverbal human infants, and that dogs are excellent readers of human
communicative gestures. However, behavioral studies cannot determine the
cognitive processes and neuronal functions underlying the behavior. In addition,
direct comparisons between humans and dogs, highlighting differences and
similarities between the species, have been rarely used in previous studies. The
aim of this thesis was to evaluate the feasibility of two novel non-invasive
methods of examining dog social cognitive functions, and also to compare human
and dog cognitive abilities with eye gaze tracking.
The feasibility of non-invasive electroencephalography (EEG) and eye gaze
tracking in dog cognitive studies were studied in experiments I–IV. In an EEG
experiment, the visual event-related potentials (ERPs) were measured while
dogs were watching human and canine facial images. In the eye tracking
experiments fixations and saccades towards the stimulus images were
measured.
Experiment I confirmed, for the first time, the usability of completely non-
invasive EEG measurement in intact fully alert dogs. The early visual ERPs were
detected at 75–100 ms from the stimulus onset. In Experiments II–IV, remote eye
gaze tracking was used to study visual cognitive abilities in dogs. The
experiments verified the feasibility of the eye tracking method in dogs and
showed that dogs’ attention was focused on the informative areas of the images.
Experiment II showed that dogs preferred facial images of dogs and humans over
inanimate objects. In experiment III, comparisons between the eye movements
of humans and dogs revealed that both dogs and humans gazed longer social
interaction images than non-social images. However, dogs gazed longer human
interaction images and humans gazed longer at dog interaction images, which
indicates that processing social interaction of another species might take more

4
time. Also in experiment III, family dogs gazed at images longer than kennel
dogs, suggesting that kennel dogs’ limited social environment might have
affected their processing of social stimuli. Experiment IV explored dogs’ gazing
behavior towards natural images containing dogs, humans and wild animals. This
study showed that dogs focused their gaze at living creatures and especially
gazed at the biologically informative areas in the images, such as the head area.
In conclusion, EEG and eye tracking are promising methods for studying dog
cognition, and eye tracking can be used to compare responses between humans
and dogs. EEG and eye tracking studies showed that dogs were focusing on the
objects in the images and their gazing behavior depended on the image category.
These studies highlight the importance of facial information to dogs, and also
reflect their excellent skills in comprehending social and emotional cues in both
conspecifics and non-conspecifics.
5
ACKNOWLEDGEMENTS
These experiments were carried out in the Faculty of Veterinary Medicine,
Department of Equine and Small Animal Medicine. I’m grateful for the Academy
of Finland for funding the major part of this thesis (Cognidog -project, leader Outi
Vainio). I would like to thank Clinical Veterinary Medicine Doctoral School for
one-year personal grant, and Aniwel Graduate School for travel grants. I thank
the directors Professor (emerita) Christina Krause (Cognitive Science) and
Professor Outi Vainio (Department of Equine and Small Animal Medicine) for
providing research environments and equipments, which have made the
scientific work of this thesis possible.
I express my gratitude to the supervisors of this thesis, Professor Outi Vainio
and Docent Miiamaaria (Miiu) Kujala. I would also like to thank Professor
(emerita) Christina Krause for supervising my thesis in the first years of my
doctoral studies. I’m grateful for the practical advice that you all gave me: I felt
that I could always ask for help. Thank you for your patience with this thesis
project, it took many years to finish, but your expertise has helped me through it.
Miiu was there always to support and guide me, and I loved the discussions with
Miiu.
The reviewers of this thesis were Professor Per Jensen and Professor Kun
Guo, who I would like to thank for their efforts and positive comments. I would
like to thank Professor Josep Call for agreeing to serve as my opponent. I also
thank Rachel Bennett for language editing.
I’m grateful to Docent Otto Lappi from Cognitive Science unit, who let me
know about the opportunity to make master’s thesis on this topic in the Faculty
of Veterinary Medicine. Without Otto’s guidance I probably never would have
found this research group and eventually started this thesis. A great thanks goes
to all my colleagues. It has been a great pleasure to work with Sanni Somppi. We
conducted almost all of these experiments together, and it is Sanni’s
innovativeness and enthusiasm that made these experiments possible. A warm
thanks goes to Aija Koskela, who has been our reliable assistant in many
experiments.

6
I would like to thank Associate professors Jan Kujala and Matti Pastell for their
patient help with EEG recordings and analyses. I further wish to thank Timo
Murtonen for the custom-made dog chin rest and EEG trigger system. I also wish
to thank PhD Mari Palviainen for the help in dog training and conducting the EEG
pilot measurements; Docent Tarja Pääkkönen for giving advice in the EEG
recordings and PhD Mari Vainionpää for helping in the computed tomography
acquisition; Antti Flyckt and Kristian Törnqvist for the technical support; Reeta
Törne for assisting in the eye tracking experiments and preparing the data. I’m
further grateful for Docent Jaana Simola, Katja Irvankoski, Aleksander Alafuzoff
and Teemu Peltonen for their help in conducting the experiments.
A warm thanks goes to my friends Riikka Rahkonen, Piia Savolainen, Minna
Saalpo, Katja Saarinen, Johanna Haapasalo, Susanne Sevola and my family for
support and listening during all these years. I also offer deep thanks to all the
dogs and dog owners, who have taken part and trained their dogs in these
experiments.

7
CONTENTS
Abstract ....................................................................................................... 3
Acknowledgements ..................................................................................... 5
Contents ...................................................................................................... 7
List of original publications .......................................................................... 9
Abbreviations............................................................................................. 10
1 Introduction ....................................................................................... 11
2 Review of the literature ..................................................................... 14
2.1 Comparative Cognition ............................................................. 14
2.2 Neuronal basis underlying dog cognitive functions ................... 15
2.3 Vision in dogs ........................................................................... 18
2.4 Social cognition in dogs ............................................................ 23
2.5 Dog cognition research methods .............................................. 25
2.5.1 Behavioral studies................................................................ 25
2.5.2 Measuring brain function ...................................................... 27
2.5.3 Eye gaze tracking ................................................................ 29
3 Aims of the study .............................................................................. 31
4 Materials and methods ...................................................................... 32
4.1 Participants ............................................................................... 32
4.1.1 Family and kennel dogs ....................................................... 32
4.1.2 Humans ............................................................................... 34
4.2 Stimuli ....................................................................................... 34
4.3 Training of the dogs .................................................................. 36
4.4 Electroencephalography ........................................................... 37
4.4.1 Overview .............................................................................. 37

8
4.4.2 Measurement ....................................................................... 38
4.4.3 Analysis ............................................................................... 39
4.5 Eye tracking ............................................................................. 40
4.5.1 Overview .............................................................................. 40
4.5.2 Measurement ....................................................................... 41
4.5.3 Analysis ............................................................................... 42
5 Results .............................................................................................. 45
5.1 Applicability of non-invasive eeg and eye tracking in dog cognition studies ................................................................................... 45
5.2 Category-related differences in dogs’ brain responses and gazing times .......................................................................................... 46
5.3 Differences between human and dog viewing behavior of social interaction and two dog populations living in different social environments ........................................................................................ 48
6 Discussion ........................................................................................ 54
6.1 Reliability of non-invasive eeg in dog cognition studies............ 54
6.2 Visual event-related potentials during human and dog facial image viewing in dogs ........................................................................... 57
6.3 Reliability of eye tracking in dog cognition studies ................... 58
6.4 Attentional focus on the presented images in dogs .................. 60
6.5 Effects of image category and composition to the gazing behavior in dogs.................................................................................... 62
6.6 The differences between dogs’ and humans’ gazing behavior in images with social and non-social content ............................................ 64
6.7 Gazing behavior of two dog populations living in different social environments ........................................................................................ 66
6.8 Methodological considerations ................................................. 68
6.9 Future research ........................................................................ 69
7 Conclusions ...................................................................................... 71
References ................................................................................................ 72

9
LIST OF ORIGINAL PUBLICATIONS
This thesis is based on the following publications, which are referred to by their
roman numerals in the text.
I Törnqvist H, Kujala MV, Somppi S, Hänninen L, Pastell M, Krause CM,
Kujala J, Vainio O (2013) Visual event-related potentials of dogs: a non-
invasive electroencephalography study. Animal Cognition 16, 973–982.
II Somppi S, Törnqvist H, Hänninen L, Krause CM, Vainio O (2012) Dogs
do look at images -eye tracking in canine cognition research. Animal
Cognition 15, 163–174.
III Törnqvist H, Somppi S, Koskela A, Krause CM, Vainio O, Kujala MV
(2015) Comparison of dogs and humans in visual scanning of social
interaction. Royal Society Open Science 2, 150341.
IV Törnqvist H, Somppi S, Kujala MV, Vainio O (submitted) Observing
animals and humans: dogs target their gaze to the biological information
in natural scenes.

10
ABBREVIATIONS
AOI area of interest
CRT cathode ray tube
CT computed tomography
EEG electroencephalography
ERP event-related potential
fMRI functional magnetic resonance imaging
fNIRS functional near-infrared spectroscopy
IRT infrared thermography
LCD liquid-crystal display
LGN lateral geniculate nucleus
ToM theory of mind

11
1 INTRODUCTION
Dogs have lived alongside people for approximately 18 000–32 000 years
(Thalmann et al. 2013) and during that time they have evolved forms of
human-like social cognition, that differentiate their behavior and responses
from those of wolves (Miklósi and Topál 2013). Dogs are more skillful at
reading human communicative behavior than wolves that are raised by
humans (e.g. Hare et al. 2002). During domestication, dogs have adapted to
living with humans by developing forms of cognition that enable them to
understand human communicative signals (Hare and Tomasello 2005).
Because of their human-like social skills, dogs are considered to be one of the
best model animals for human social behavior and disorders (Miklósi and
Topál 2013; Head 2013). Unlike laboratory dogs or other laboratory animals,
family dogs also share the environment and lifestyle with their human
counterparts. Comparative studies, where species-specific natural abilities
have been considered can provide detailed information about the similarities
in processing social and emotional information. However, comparative
cognition studies between humans and dogs, where both species are
measured with comparable methodology, are still rare.
Examining dog cognition has to be conducted with indirect methods,
because unlike humans, dogs cannot tell us directly what they are thinking and
how they are feeling. Previously, dogs’ cognitive abilities have been
extensively studied with tasks that require behavioral responses (for a review,
Bensky et al. 2013). Despite the extensive research on canine behavior, still
relatively little is known about the mental and neural background behind this
behavior. This thesis employed two novel non-invasive methods, EEG and eye
tracking, to measure the neural and visual responses associated with object
viewing in dogs. The visual ERPs were measured to examine basic visual
brain potentials during the image viewing, and also to reveal differences in
brain potentials between human and canine facial images (Experiment I).
The eye movements of dogs were measured to assess where dogs focus
their attention and to study the effect of image category on the gazing behavior

12
(Experiments II–IV). In addition, dogs’ and humans’ gazing behavior was
compared during the viewing of social stimuli (Experiment III). Furthermore,
the eye movements of two dog populations living in different social
environments were compared to evaluate the effect of social environment on
canine gazing behavior (Experiments III and IV).
Traditionally, EEG studies in animals have mostly been invasive. To date,
there are only a few studies where fully non-invasive EEG methods have been
used in conscious dogs in a manner similar to that standardly used in healthy
humans (Kujala et al. 2013; Kis et al. 2014; Kis et al. 2017a; Bunford et al.
2018). Other studies published to date have used needle electrodes (Howell
et al. 2011, 2012; James et al. 2011, 2017) or other invasive electrodes
(Bichsel et al.1988), sedatives (Adams et al. 1987; Berendt et al.1999;
Jeserevics et al. 2007; Pellegrino and Sica 2004) or they have measured EEG
during sleep (Kis et al. 2014, 2017a; Bunford 2018). In humans, ERP studies
are very common, but not in dogs probably due to different research traditions
and difficulties in measuring EEG in fully alert dogs. Concurrently with the work
of this thesis, great advancements in comparative studies have been made
with non-invasive functional magnetic resonance imaging (fMRI) method
adapted from human studies. fMRI studies have for example found similarities
in the functional anatomy of human and canine brains, e.g. related to
processing of facial information (e.g. Berns et al. 2012; Andics et al. 2014;
Dilks et al. 2015). However, it is not fully known to what extent brain structures
in dogs anatomically and functionally correspond to those in humans, and
whether those structures underpin similar cognitive functions between species
(for a review, Bunford et al. 2017).
For dogs, the sense of smell is highly important, but dogs use also their
sight to communicate and navigate in their surroundings. For example, many
tasks given by humans to dogs require acute eyesight, such as hunting,
herding and guarding. Surprisingly little is known about dogs’ basic visual
abilities, and this makes it difficult to compare visual perception between
humans and dogs. Nevertheless, almost all behavioral cognitive studies
conducted in dogs are based on vision, although it is not known in detail how
dogs perceive these tasks (for a review, Byosiere et al. 2018). By using eye

13
tracking we acquire millisecond-scale temporal and millimeter-scale spatial
information on where dogs focus their attention; in which order or how quickly
they attend to different visual features; or how they view different kinds of
visual stimuli. Furthermore, eye gaze tracking allows better direct comparisons
between canine and human gazing behavior and visual cognition.
This thesis explores the usability of non-invasive EEG and eye tracking in
dog cognition studies. The motivation behind the thesis was to develop new
animal-friendly methods, and to characterize canine visual cognitive abilities
related to social perception of conspecifics and non-conspecifics and
subsequently, the underlying mechanisms involved. We hypothesized that
dogs’ neurophysiological brain potentials can be detected non-invasively from
the surface of the skin and that the early visual event-related responses can
be measured (Experiment I). In addition, we expected that dogs focus their
attention to the biologically relevant areas of images, such as the head/ face
area (Experiments II–IV), and that image composition affects the dogs’ gazing
behavior (Experiment IV). Furthermore, we anticipated that dogs’ gazing times
differ between image categories, and that they prefer conspecific images over
other image categories (Experiments II–IV).
14
2 REVIEW OF THE LITERATURE
2.1 COMPARATIVE COGNITION
Cognition refers to the mechanisms of processing, acquiring, storing and
acting on information, and it includes different cognitive processes such as
perception, learning, memory and decision making (Shettleworth 2010).
Comparative studies between humans and animals have a long history;
already Darwin (1859, 1872) proposed that humans and non-human animals
share similarities in anatomy, emotions, and cognitive abilities. As humans, we
have the greatest understanding of our own cognitive abilities, and
comparative cognitive studies often examine the abilities of non-human
species in situations that humans are able to solve. In the traditional approach
for studying the evolution of human social cognition, comparisons have been
made between non-human primates and humans (e.g. Seed and Tomasello
2010). But the last 20 years has seen a substantial increase in canine behavior
and cognition studies for several reasons. Dogs’ trainability and willingness to
cooperate with humans makes them not only great companions and working
partners in a variety of jobs, but also excellent study subjects.
There are similarities in dogs’ and children’s responsiveness to
communicative cues, and dogs’ performance appears comparable to 2–3-
year-childrens’ performance, although this is dependent upon the type of skills
tested (Kaminski et al. 2004; Virányi et al. 2006; Lakatos et al. 2009; Racca et
al. 2012; Gergely et al. 2019). Despite increasing interest in comparative
studies, there are only a few studies where the cognitive functions of adult
humans and dogs have been directly compared by utilizing similar research
methods (Kis et al. 2014; Andics et al. 2014; Correia-Caeiro et al. 2020).

15
2.2 NEURONAL BASIS UNDERLYING DOG COGNITIVE FUNCTIONS
Dogs have become a popular research animals in behavioral and cognitive
studies, but for some reason little research has been conducted on the canine
brain in the last decades. The primary animal models in comparative cognitive
neuroscience have been non-human primates, rodents, and birds (e.g.
Perretta 2009; Vandamme 2014; Clayton and Emery 2015). Many people may
find invasive research of the canine brain ethically unacceptable, because
dogs hold a privileged status as pets in Western society (Berns and Cook
2016).
All mammals have highly developed right and left cerebral hemispheres,
which together constitute the cerebrum (Etsuro 2016). The cerebral
hemispheres consist of the cerebral cortex (i.e. the gray matter at the surface
of the cerebrum), white matter and basal nuclei. Each cerebral hemisphere
has five cerebral lobes: the temporal, frontal, parietal, occipital and piriform.
These cerebral lobes have rather arbitrary boundaries in dogs, because there
is great variation in the sulci and gyri patterns (inward and outward folds of the
cerebral cortex), which makes it difficult to outline clear borders of the cerebral
lobes. Nevertheless, a few distinct sulci commonly found in dogs serve as
reference points for a description of the cerebral lobes (Etsuro 2016).
Dogs and humans have differences in skull formation and accordingly in
brain anatomy. Also the breeding of dogs to produce specific breeds has
affected the form of their brains. In general, the size of the dog brain is smaller
than that of the human brain (see Figure 1). In dogs the cerebral cortex is less
gyrificated (folded) containing fewer neurons than in humans, who have the
most developed cerebral cortex (Roth and Dicke 2005; Kaas 2013). The
cerebral cortex is a central region controlling complex cognitive behaviors in
mammals (Kaas 2013; Geschwind and Rakic 2013), and it has been
suggested that the absolute number of neurons in the cerebral cortex is a
major determinant of the cognitive abilities (Roth and Dicke 2005; Herculano-
Houzel 2017).

16
Figure 1 Dog and human brains. Dogs have smaller brains than humans and their cerebral cortex is less folded containing fewer neurons. Adapted from Roth & Dicke (2005) with permission from Elsevier.
The temporal, frontal, parietal and occipital lobes represent a
phylogenetically newer portion of the cerebral cortex known as the neocortex
(Etsuro 2016). The neocortex is the largest part of human cerebral cortex that
takes up about 80 % of the total brain mass (Kaas 2013), but in dogs, the
neocortex constitutes a relatively much smaller part of the brain (Jensen
2007). The neocortex integrates sensory stimuli and is responsible for
reflection and conscious reasoning. Part of the neocortex is the prefrontal
cortex, which constitutes 29% of the total cerebral cortex in the adult human
and 12.5% in the dog and it is exceptionally well connected with other brain
structures (Brodmann 1909). The prefrontal cortex is generally considered to
be the origin of higher cognitive functions, and in primates, it is bigger in size
than in other mammals in relative to the rest of the cortex (Preuss 1995; Bush
and Allman 2004).
There are five primary cortical areas that receive sensory signals from the
brainstem and spinal cord: somatosensory, motor, visual, auditory, and
olfactory. The cerebral cortex is mapped according to these functional
characteristics. The primary cortical areas provide awareness of sensation,
but the recognition of such sensation requires the association of one primary
stimulus into more complex sensory combinations (Etsuro 2016).
The limbic system is part of the cerebral cortex and it is common to all
mammals and reptiles (Alcock 2009). The limbic system contains the
hippocampus, olfactory cortex, parts of the thalamus and the hypothalamus of

17
the diencephalon. It controls basic behaviors, related to e.g. feeding and
aggression, connects to sensory areas in the neocortex and is also
responsible for attaching emotions to behaviors. The structure and relative
size of the limbic system is similar in humans and dogs (Jensen 2007). Based
on this similarity, dogs may perceive more or less the same range of basic
emotions as humans, but they have a limited capability to reflect consciously
on these emotions (Jensen 2007).
Large variations in skull formation and size exist between dog breeds: dog
skull length ranges from 7 to 28 cm (McGreevy et al. 2004). This variation is
also associated with differences in brain organization in brachycephalic dogs
with short noses when compared to dolichocephalic dog breeds with longer
noses (Roberts et al. 2010).
This difference can be further associated with differences in behavior, for
example increased attention and ability to read human gestures and also
differences in trainability and cognitive performance (Helton 2009; Gácsi et al.
2009a). Dog breeds with larger brains perform better on cognitive measures
of short-term memory (e.g. the ability to remember, after a short delay, under
which of multiple containers a treat is hidden) and self-control (ability to inhibit
a desire to consume visible food) (Horschler et al. 2019). In humans, variation
in skull formation and size is relatively minor, mostly related to sex-specific
brain differences (Cosgrove et al. 2007).
It is not known in detail to what extent brain structures in dogs anatomically
and functionally correspond to those in humans, and whether those structures
underpin similar cognitive functions between species (for a review, Bunford et
al. 2017). Recent evidence from fMRI studies support certain correlation
between humans and dogs brain structures. Similarities have been found in
neural mechanisms of human and dog face processing (Dilks et al. 2015;
Cuaya et al. 2016; Thompkins et al. 2018), vocal processing (Andics et al.
2014, 2016), human emotional expressions (Hernández-Pérez et al. 2018)
and reward processing (Berns et al. 2012, 2013).

18
2.3 VISION IN DOGS
Vision is considered to be one of the most important senses in humans,
whereas dogs are believed to rely heavily on their excellent olfactory abilities
at least in their communication with other dogs (Sjaastad et al. 2010).
Relatively little is known about dogs’ visual abilities when compared directly
with those of humans (for a review, Byosiere et al. 2018). However, the neural
circuitry underlying vision is similar in humans and other mammals (Masland
and Martin 2007).
The visual perception begins within the retina of the eye. The retina is the
innermost layer of tissue of the eye, that is full of photoreceptor cells, rods and
cones, that detect light and send impulses via the optic nerve to the visual
cortex where information is interpreted as an image.
Dogs’ retinas are mostly composed of rod photoreceptor cells (97%), that
function in dim light, and provide black and white vision, only 3% of
photoreceptors are cone cells, which are responsible for color vision (Peichl
1991; for a review, Byosiere et al. 2018). The area centralis within the retina
of humans consists exclusively of cones, whereas in dogs only a minority of
the photoreceptors in this area are cones (Movat et al. 2008). Humans’
trichromatic color vision is based on three types of cone cells, which are
sensitive to all wavelengths (i.e. color) of light. Dogs have dichromatic color
vision that is based on two types of cone cells, and it has been concluded, that
dogs are not able to distinguish green, yellow, and red colors from one other
(Miller and Murphy 1995; Neitz et al. 1989; Siniscalchi et al. 2017). However,
study results determining which colors dogs can discriminate, have been
controversial (Miller and Murphy 1995): to date, at least one study suggested
that dogs distinguish blue, red and green from gray color (Tanaka et al.
2000b). In addition to color vision, the canine ability to distinguish brightness
affects the dog visual perception. Dogs’ ability to discriminate differences in
brightness have been estimated to be half that of humans (Pretterer et al.
2004), thus it has been suggested that dogs rely more on color cues than
brightness when choosing between visual stimuli (Kasparson et al. 2013).

19
Dogs’ visual system functions well in all lighting conditions, but it is
especially adapted to dim light conditions and following movement, probably
because their ancestor the wolf needed to locate the potential prey animal
(Miller and Murphy 1995). The tapetum lucidum, a reflective layer of tissue
behind the retina, increases dogs’ sensitivity in dim light by reflecting light
through the retina a second time (Ollivier et al. 2004). Little research has been
done on dogs’ motion-detecting abilities, but it has been suggested that dogs
can discriminate moving objects at a distance of 800 - 900 m, but the same
stationary objects only at a distance of 500 - 600 m (Walls 1963). Dogs can
discriminate flickering of light at higher rates than humans (Coile et al. 1989),
which could affect their ability to observe images or videos from computer
screens. Flicker fusion frequency is observed to be 80 Hz in dogs and 60 Hz
in humans (Coile et al. 1989; Healy et al. 2013).
Dogs’ sensitivity to light comes at the expense of visual acuity (sharpness
or clarity of vision), and their visual acuity is considered to be worse than
humans. The number of cones connected to a single ganglion cell determine
the visual acuity. Primates have the highest visual acuity (one-to-one cone-
ganglion cell ratio), and in cats and probably also dogs the ratio is 1 to 4 (Miller
and Murphy 1995). Estimates of dogs’ visual acuity have varied greatly owing
to difference in research methods, which include behavioral tests, measuring
visually evoked cortical potentials or pattern electroretinography (Tanaka et al.
2000a; Odom 1983). Visual acuity has been estimated to be three times higher
in humans than in dogs in both bright and dim light conditions (Lind et al.
2017). It has been estimated, that dogs’ visual acuity is 6/18 to 6/26, which
means that a dog can see clearly a stationary object placed 6 meters away,
whereas a person with normal vision can see it from 18 - 26 meters way (Miller
and Murphy 1995; Tanaka et al. 2000a).
There are anatomical differences between human and canine eyes, which
has an effect on the visual sensation. In humans, the area of sharp central
vision (fovea) is located in the macula lutea, near the center of retina. The best
visual acuity, foveal vision, is only within a visual angle of 1 - 2°, and for the
peripheral areas within the visual field and outside the focus of the gaze, the
visual acuity decreases dramatically (Yang et al. 2002). Wolves and dogs do

20
not have a fovea, but instead they have a horizontal visual streak, which is the
area of best visual acuity (Peichl 1992).
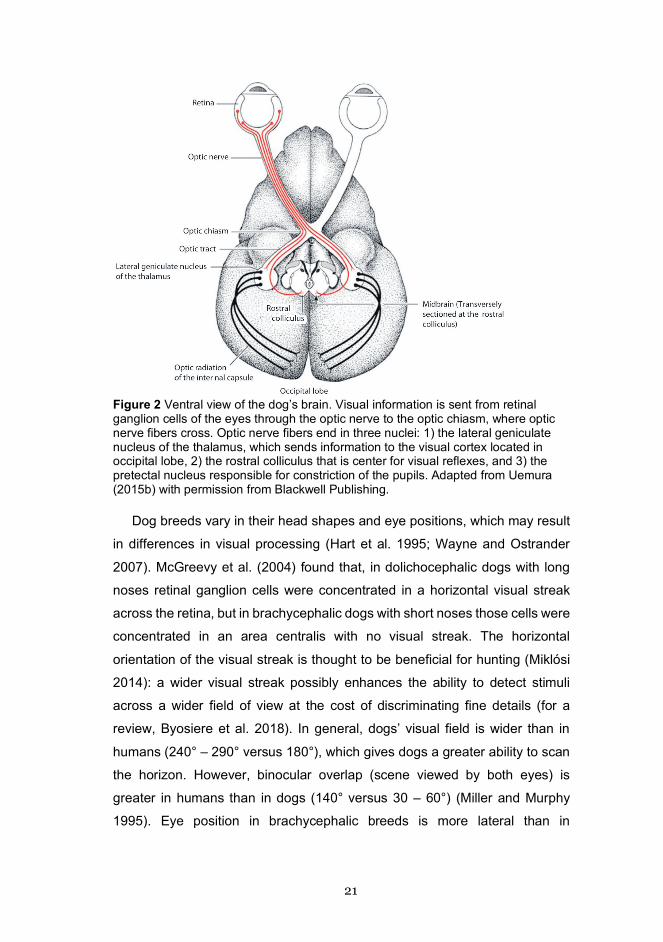
Visual processing occurs mainly in occipital cortex in humans (Reichert
1992), in dogs (Willis et al. 2001; Sjaastad et al. 2010), cats (Hubel and Wiesel
1959; De Lahunta 1983) and non-human primates (Hubel et al. 1978). The
primate cerebral cortex contains over 30 regions implicated in visual
processing, which occupy the occipital lobe and parts of the temporal cortex.
Temporal cortex regions include areas which contain neurons responsive to
faces (Van Essen 1979; Perrett et al. 1982; Felleman and Van 1991; Dilks et
al. 2015).
The brain areas involved in visual processing are not fully explored in dogs,
but it has been found that cats have 13 visual processing regions in cerebral
cortex, so it can be assumed that dogs also have several visual processing
areas (Tusa and Palmer 1980; Sjaastad et al. 2010). In mammals, the optic
nerve axons from the retinal ganglion cells in each eye meet at the optic
chiasm, where the fibers cross and the visual information of the left visual field
is processed by the right hemisphere and vice versa (King 1987). Through the
optic tract visual information is further sent to the lateral geniculate nucleus
(LGN) in the thalamus and to the primary visual cortex (V1), which is located
in the occipital lobe (Van Essen 1979, Figure 2). V1 is the earliest cortical
visual area processing of all visual information necessary for perception.
Neurons in the V1 area are sensitive to particular visual stimuli, such as
vertical or horizontal boundaries, color, moving objects and size of stimuli.
After V1, information is sent for further processing onto the visual association
cortex, which is located within the posterior parietal lobe and posterior
temporal lobes. In addition, this information is also passed to different areas
of the extrastriate visual cortex including all of the occipital lobe areas
surrounding the V1 area (Van Essen 1979; Uemura 2015).
21
Figure 2 Ventral view of the dog’s brain. Visual information is sent from retinal ganglion cells of the eyes through the optic nerve to the optic chiasm, where optic nerve fibers cross. Optic nerve fibers end in three nuclei: 1) the lateral geniculate nucleus of the thalamus, which sends information to the visual cortex located in occipital lobe, 2) the rostral colliculus that is center for visual reflexes, and 3) the pretectal nucleus responsible for constriction of the pupils. Adapted from Uemura (2015b) with permission from Blackwell Publishing.
Dog breeds vary in their head shapes and eye positions, which may result
in differences in visual processing (Hart et al. 1995; Wayne and Ostrander
2007). McGreevy et al. (2004) found that, in dolichocephalic dogs with long
noses retinal ganglion cells were concentrated in a horizontal visual streak
across the retina, but in brachycephalic dogs with short noses those cells were
concentrated in an area centralis with no visual streak. The horizontal
orientation of the visual streak is thought to be beneficial for hunting (Miklósi
2014): a wider visual streak possibly enhances the ability to detect stimuli
across a wider field of view at the cost of discriminating fine details (for a
review, Byosiere et al. 2018). In general, dogs’ visual field is wider than in
humans (240° – 290° versus 180°), which gives dogs a greater ability to scan
the horizon. However, binocular overlap (scene viewed by both eyes) is
greater in humans than in dogs (140° versus 30 – 60°) (Miller and Murphy
1995). Eye position in brachycephalic breeds is more lateral than in
22
dolichocephalic breeds resulting in more binocular overlap because the
muzzle is not obstructing the field of view (Evans and De Lahunta 2013).
Morphological characteristics affecting the dog’s vision might also be
associated with performance in cognition tasks. In a commonly used object-
choice task, a human experimenter kneels or stands between two containers,
one of which contains a food bait, and waits until the dog makes eye contact.
The experimenter then gestures towards one of the containers. If the dog
chooses the baited container, it serves as reinforcement for a correct choice.
Larger dogs have been found to perform better on an object-choice task than
smaller dogs, probably because larger dogs have a greater inter-ocular
distance, which may improve the use of depth cues (Helton and Helton 2010).
Also dogs with short muzzles and forward-facing eyes are more successful in
an object-choice task than dogs with long muzzles which is explained by short
muzzled dogs more focused visual attention on the human signaler (Gácsi et
al. 2009b). However, a meta-analysis of object-choice tasks did not find any
differences between dog breed groups (Dorey et al. 2009). Nevertheless,
visual capacities can also differ between dog breeds that are bred for different
purposes (Peichl 1992). Visual acuity might be better for example in dogs that
hunt by their sight (e.g. greyhounds) than with their scent (e.g. basset hounds).
In addition, the developmental environment can influence a dog’s later
perceptual abilities, since the stimulation from the environment can affect
survival of the neurons in the brain or in a sensory organ (Hubel and Wiesel
1998; Miklòsi 2014).
Many of the cognitive research tasks used in dogs are adapted from human
or monkey studies and are based on vision. These kinds of tasks include for
example the extensively used pointing tasks, where a dog locates food by
following human hand direction (e.g. Soproni et al. 2002), face recognition
tasks (e.g. Adachi et al. 2007; Somppi et al. 2014) and studies, that use touch-
screen for testing visual discrimination (e.g. Range et al. 2008). Dogs’ visual
discriminatory abilities have been tested using two-choice discrimination
paradigms, where dogs are trained to discriminate between two objects or
stimulus images. Dogs are rewarded with food in the training phase from their

23
positive choices (e.g. touching the correct image with their nose) or not
rewarded from negative choices (e.g. touching the incorrect image).
Dogs have been taught to discriminate horizontal and vertical gratings (Lind
et al. 2017), different objects (Milgram et al. 1994), objects of different sizes
(Tapp et al. 2004; Byosiere et al. 2017) and different quantities (Baker et al.
2012; Petrazzini and Wynne 2016). In a recent study, dogs were more
successful at discriminating larger size than smaller size stimuli, which
suggests that dogs have difficulties in discriminating fine details of the stimuli
(Byosiere et al. 2017; for a review, Byosiere et al. 2018). At the time the work
of this thesis began, research into dogs’ ability to differentiate objects from
each other had just started. But during the thesis dogs were found to be
capable of many kinds of categorization, which had been studied in visual and
auditory experiments (e.g. Adachi et al. 2007; Range et al. 2008; Racca et al.
2010; Autier-Dérian et al. 2013; Somppi et al. 2014, 2016, 2017; Albuquerque
et al. 2016; Barber et al. 2016).
2.4 SOCIAL COGNITION IN DOGS
Apart from wolves, dogs have a strong tendency to use their gaze to
communicate with humans and they also alternate glances to a human more
frequently than wolves when given a problem-solving task that is unsolvable
(Miklósi et al. 2003; Kubinyi et al. 2007). Furthermore, dogs’ social-cognitive
abilities seem more flexible than those of our nearest primate relatives, such
as chimpanzees, bonobos, and other great apes (Hare and Tomasello 2005;
for a review, Miklósi and Soproni 2006). Compared to dogs, all primates are
poor at finding hidden food using social-communicative cues provided by a
human (e.g. Anderson et al. 1995; Call et al. 2000). However, primates
outperform dogs when physical cues are used such as food making a noise
when container is shaken (Bräuer et al. 2006). The lack of utilizing social-
communicative cues given by a human may be related to competitiveness;
primates hardly ever in their natural environment experience a situation in

24
which one individual cooperatively indicates to another individual the location
of food (for a review, Miklósi and Soproni 2006).
Different theories have been proposed to explain how dogs have acquired
responsiveness to human social cues (for a review, Reid 2009). One proposal
is that during domestication, dogs were selected for their social-cognitive
abilities, which enabled them to communicate with humans in unique ways
(Hare et al. 2002; Hare 2007). A second assertion assumes that in their
interactions with humans, dogs learn through conditioning processes to be
responsive to human social cues (for a review, Udell and Wynne 2008).
According to a third explanation, co-evolution with humans have equipped
dogs with cognitive skills to understand our mental states (Polgárdi et al. 2000;
Miklósi et al. 2004). Lastly it has been proposed that dogs are predisposed to
learn human communicative gestures (for a review, Reid 2009).
Underlying human social interaction is the Theory of Mind (ToM): the ability
to think about our own and other’s mental states, such as thoughts, beliefs,
and emotions (for a review, Carlson et al. 2013). At present, there is no
scientific consensus or enough empirical evidence about whether, or to what
extent, non-human animals understand other individuals’ minds (Premack and
Woodruff 1978; Hare et al. 2001; Penn and Povinelli 2007). Based on dogs’
social cognitive skills, it has been suggested that dogs may possess at least a
precursory theory of mind or an ability to take others perspective (e.g. Miklósi
et al 2004; Gácsi et al. 2004; Bräuer et al. 2004). Dogs are sensitive to the
attentional states of people: dogs take the ‘forbidden’ piece of food more often
if the experimenter’s back is turned, their eyes are closed, or they are engaged
in a distracting activity. This contrasts with the scenario when the experimenter
is looking at them (Call et al. 2003). Dogs are also less likely to beg from a
person facing away from them or wearing a blindfold (Gácsi et al. 2004).
However, these performances do not require ToM. They only require that dogs
have learned through past experiences, the cues associated with reward and
non-reward, such as people are unlikely to give them food without paying
attention to them (for a review, Emery 2000; Udell and Wynne 2008).
In humans, the ability to recognize faces based on visual cues is an
important part of social cognition (Bruce and Young 1998). The face provides

25
information about individual’s identity, age, gender, familiarity, emotional and
mental states. Faces are differentiated and recognized with superior efficiency
compared with objects, and face-sensitive neural mechanisms are involved in
facial processing (e.g. Farah 1996; McKone et al. 2007). Multiple studies have
also demonstrated that dogs are able to discriminate faces based on visual or
audiovisual cues. Dogs can differentiate between canine and landscape
images (Range et al. 2008), canine and human faces (e.g. Racca et al. 2010),
familiar and unfamiliar faces (Nagasawa et al. 2011; Somppi et al. 2014;
Eatherington et al. 2020), canine and non-canine faces (Autier-Dérian et al.
2013) and emotional expressions (Nagasawa et al. 2011; Müller et al. 2015;
Somppi et al. 2016). In addition, dogs can integrate bimodal sensory
information. In an auditory experiment, dogs were presented with a picture of
their owner’s face or the face of a stranger and the voice of one of those. Dogs
looked at the owner’s picture longer when the picture did not match the voice
suggesting that the dogs generated a visual image from the auditory
information (Adachi et al. 2007). A similar study showed that dogs looked
longer at the human or canine face whose expression was congruent to the
emotional valence of vocalization (Albuquerque et al. 2016). Besides dogs,
the ability to discriminate conspecifics from visual cues have been
demonstrated in many other species, e.g. in sheep (Kendrick et al. 1995), in
cattle (Coulon et al. 2011) and in monkeys (Fujita 1987; Pascalis and
Bachevalier 1998).
2.5 DOG COGNITION RESEARCH METHODS
2.5.1 BEHAVIORAL STUDIES Dog cognition has been extensively studied with different kinds of behavioral
experiments, and the tests have been used as an indicator of cognitive
differences between dogs and wolves (Miklósi et al. 2003; Kubinyi et al. 2007;
see review, Bensky et al. 2013). Dogs have been shown to be more skilful
than great apes and wolves in an object-choice task following basic human

26
pointing cues to locate food and also to generalize this behavior to relatively
novel human movements such as pointing with leg (e.g. Hare and Tomasello
1999; Soproni et al. 2002). These findings suggest that during domestication,
dogs evolved specialized skills to read human social and communicative
behavior (Hare et al. 2002; Hare and Tomasello 2005).
Problem solving tasks, especially object manipulation, have been widely
utilized when comparing dog and wolf intelligence (e.g. Frank and Frank 1985;
Hiestand 2011). One of the object manipulation tasks is a means-end task that
has been used to study dogs’ understanding of how a combination of actions
leads to a goal, e.g. by pulling a string the dog obtains access to a piece of
food (Osthaus et al. 2005; Range et al. 2011). In means-end tasks, the
problem solver has to first envision the goal, and then decide the best actions
for achieving the goal in the current situation. Evaluation of means-end
understanding is an important area of comparative cognition; it can be
considered a key mental prerequisite of higher cognitive abilities such as tool
use (Helme et al. 2006; Schuck-Paim et al. 2009). Second, the object
manipulation tasks have been used to compare independent problem-solving
skills between dogs and wolves. In tasks such as manipulating a box to gain
access to a food dish, more persistent and independent wolves performed
better than dogs that give up sooner and seek help from human experimenter
(Frank 1980; Frank and Frank 1985).
Looking-time experimental paradigms, relying on the assumption that dogs
direct their attention to interesting targets, are adapted from pre-verbal infant
studies (Berlyne 1958; Fantz 1958). Typically, two pictures are presented side-
by-side and the dog’s attention to a certain image or object is evaluated from
video recordings (e.g. Adachi et al. 2007; Racca et al. 2010). However, video
recording techniques relying only on the direction of the dog’s head lack spatial
accuracy and they allow only gross judgements of the direction of the dog’s
gaze (Williams et al. 2011). Besides the behavioral tests, other methods are
also necessary to obtain information about the cognitive and neural processes
underlying a dog’s behavior.

27
2.5.2 MEASURING BRAIN FUNCTION Electroencephalography (EEG) is a brain imaging technique that measures
electrical activity generated by neuronal cells (Berger 1929). In humans, EEG
is standardly measured completely non-invasively from the surface of the head
with electrodes that are placed on the scalp in specific positions. This
technique uses the international 10/20 system to maintain the relative
distances between electrodes constant (Jasper 1958). In dogs, no
standardized system exists for EEG measurements, thus different kinds of
electrodes and different positioning have been used in canine studies. The
electrical activity is generated by synchronously active groups of neurons in
the cerebral cortex, oriented in the same direction. Large populations of
simultaneously active neurons are needed in order to record their electrical
activity on the head surface, because the current needs to penetrate the skull,
muscles, and skin. The recordable neural activity is the summation of the
excitatory and inhibitory postsynaptic potentials of synchronously firing
pyramidal neurons. EEG records voltage differences between two electrodes:
active and reference electrodes (Caton 1875; Berger et al. 1929; Teplan 2002;
Britton et al. 2016).
EEG is a powerful tool in neurology and clinical neurophysiology due to its
ability to reflect normal and abnormal electrical activity of the brain in
millisecond-scale temporal resolution (Niedermeyer and da Silva 2005). In
dogs, EEG has been mostly used as a diagnostic method in epilepsy research
(Berendt et al. 1999; Jeserevics et al. 2007; Jokinen et al. 2007; James et al.
2011; De Risio et al. 2015; James et al. 2017). Although scalp-EEG is widely
utilized in humans, there are only a few recent studies where fully non-invasive
EEG method has been used in unsedated dogs (Kujala et al. 2013; Kis et al.
2014; Kis et al. 2017a; Bunford et al. 2018), all of which are either concurrent
with or subsequent to the data of this thesis. In addition, Howell et al. (2011,
2012) used minimally-invasive EEG with needle electrodes to study mismatch
negativity potential related to novel auditory stimuli. In general, previous EEG
studies in animals have mainly been invasive, and therefore animals need to
be sedated or anesthetized, which limits the subject of the study and can

28
influence cognitive processing (Koelsch et al. 2006). Kis et al. (2014, 2017a)
studied canine sleep with the non-invasive polysomnography method (see
also Bunford et al. 2018). Sleep studies might be easier to perform than
conscious recordings in moving dogs, but they make it impossible to study the
vast majority of cognitive processes, for example visual and attentional
processes. For this purpose, the event-related potential (ERP) technique is
more suitable.
In humans, many ERP components are well recognized and characterized
(Otten and Rugg 2005), but in non-human species they have been studied
less frequently owing to differences in research traditions. The advantages of
measuring ERPs are that they reflect ongoing neural activity with almost no
delay, and that they can be measured noninvasively from any group of
participants (e.g. infants and dogs) without any behavioral response (Luck
2012). However, ERP measurements have relatively low spatial resolution
compared for example with the functional magnetic resonance imaging (fMRI)
technique.
Contrary to EEG, fMRI can provide millimeter-scale information about the
area in which brain information is processed, but with much lower temporal
precision, time lag of 300 - 1000 ms (Glover et al. 2011). fMRI detects active
brain areas by measuring oxygenation level -dependent changes in blood flow
(Huettel et al. 2004; Dalenberg et al. 2018). In humans, fMRI has become the
prominent method in cognitive neuroscience studies and during the last
decade a highly popular method also in dogs. In dogs, conscious fMRI testing
requires them to be trained to stay still and to wear earmuffs during the
measurements. fMRI has been used for studying the regions of the dog’s brain
that are related to human hand signals (Berns et al. 2012, 2013; Cook et al.
2014), face processing (Dilks et al. 2015; Cuaya et al. 2016), human and dog
vocalization responses (Andics et al. 2014), analyzing and integrating word
meaning and intonation (Andics et al. 2016), olfactory responses (Jia et al.
2014) and cognitive control (Cook et al. 2016).

29
2.5.3 EYE GAZE TRACKING Eye tracking is a non-invasive method that can be used to study for example
visual, attentional, emotional, and cognitive processes in humans and animals.
Compared to visual inspection of head and gaze direction of dogs (e.g. Adachi
et al. 2007; Racca et al. 2010), eye gaze tracking allows eye movement data
collection at finer temporal and spatial resolution (Park et al. 2020). Generally,
the eye tracker sends invisible harmless infrared rays into the observer’s eyes
and tracks the reflection of the rays to obtain information about the observer’s
eye movements e.g. fixations and saccades. Fixations are eye movements
that stabilize the eyes to an object of interest, and they can last from 10 of
milliseconds up to several seconds in humans. Saccades are rapid eye
movements that are used to reorient the eyes from one fixation to another
about three times each second (for a review, Rayner 1998; Duchowski 2007).
During a saccade no new information is acquired because the eyes are moving
so quickly that only blur would be perceived (Uttal and Smith 1968; for a
review, Matin 1974).
Utilizing eye gaze tracking, we can follow, almost in real-time, where
attention is directed and what the research subject finds interesting. In most
eye trackers the sampling frequency is between 25 - 2000 Hz, which refers to
how many times per second the position of eyes is measured, for example for
a 250 Hz eye-tracker a sample is taken once every 4 ms (Andersson et al.
2010). The interesting or important objects in a scene are often inspected first
and attract longer viewing time than less interesting objects (for a review,
Rayner 1998; Henderson 2003; Duchowski 2007). In humans, non-intrusive
eye tracking is a common research method and it has been used since Buswell
(1935). Eye tracking research has revealed much about the cognitive
processes underlying human behavior and it is useful in various research
fields such as psychology, marketing, and human computer interaction (e.g.
Yarbus et al. 1967; Gredebäck et al. 2010; Holmqvist et al. 2011).
Eye gaze tracking is a relatively novel method in dogs, and at the beginning
of this thesis work there were no scientific publications of eye tracking in dogs.
Williams et al. (2011) was the first to develop a head-mounted eye tracking

30
system for dogs, which allowed eye movement tracking even when the dog
was moving (see also preliminary results, Rossi et al. 2014). As the eye tracker
is attached to the dog’s head, it requires training to ensure the dogs are
habituated to the apparatus. Calibration of the eye tracker can also be
challenging, because the dog needs to fixate calibration points with minimal
head movements in order to accomplish accurate calibration (Williams et al.
2011). Head-mounted systems have been developed also for use in other
animal species such as chimpanzees (Kano and Tomonaga 2013), chickens
(Schwartz et al. 2013) and rats (Wallace et al. 2013).
Contrary to head-mounted systems, remote eye trackers enable eye gaze
tracking without direct contact to the subjects, but they are usually relatively
sensitive to subjects’ head and other movements. Remote eye tracking has
been used in several comparative cognition studies in primates (e.g. Dahl et
al. 2007, 2009; Hirata et al. 2010; Kano and Tomonaga 2009, 2010; Leonard
et al. 2012; Myowa-Yamakoshi et al. 2012; Paukner et al. 2013) and also
recent studies in dogs (Téglás et al. 2012; Somppi et al. 2014, 2016, 2017;
Barber et al. 2016; Kis et al. 2017b; Gergely et al. 2019), all of which are
concurrent with or subsequent to the commencement of this thesis.

31
3 AIMS OF THE STUDY
The first aim of the experiments in this thesis was to evaluate the feasibility of
novel non-invasive electroencephalography (EEG) and remote eye gaze
tracking methods in dogs. Second aim was to compare human and dog
cognitive abilities by using eye gaze tracking. More detailed research
questions were:
1. Can non-invasive EEG be reliably used in dog cognition studies, and can
dogs’ early visual event-related potentials (ERPs) be measured in human
and dog faces (Experiment I)?
2. Can eye gaze tracking be reliably used in dog cognition studies and for
comparison of eye movements between humans and dogs? Do dogs
focus their attention to the presented images and biologically relevant
areas in them (Experiments I–IV)?
3. Do dogs differentiate between images according to their categorical
content, and does the composition of the images affect the dogs’ gazing
behavior (Experiments I–IV)?
4. Do dogs and humans differ in their gazing behavior of images with social
and non-social content (Experiment III)?
5. Do two dog populations living in different social environments differ in
their gazing behavior (Experiments III and IV)?

32
4 MATERIALS AND METHODS
4.1 PARTICIPANTS
Four experiments were conducted between years 2010 - 2012 at the
University of Helsinki (Table 1). All the experiments were ethically pre-
evaluated and accepted by the Viikki Campus Research Ethics Committee
before the start of the experiments.
Table 1 Electroencephalography (EEG) was measured in one experiment and eye tracking was used in three experiments.
Exp. Exp. conducted
(year)
Article published
(year)
Research method
Exp. focus
I 2011 2013 Electro-encephalography
(EEG)
Non-invasive EEG measurement
in dogs
II 2010 2012 Eye tracking Contact-free eye tracking in dogs
III 2012 2015 Eye tracking Comparison of
eye movements between humans
and dogs
IV 2011 submitted Eye tracking Observation of natural scenes
by dogs
4.1.1 FAMILY AND KENNEL DOGS In total, 84 dogs were included in experiments (Table 2), and some of these
dogs were included in multiple experiments. In experiments II - IV 6 – 38 family
dogs participated, representing many breeds and sizes. Family dogs were 1 –
10 years old and lived with their owners. Their daily routine consisted of food
provision once/ twice a day and being taken outdoors three to five times. In
addition, 8 purpose-bred beagles participated in experiments I, III and IV.

33
During the experiments, the kennel dogs were 4 – 6 years old, and they lived
in a kennel-like environment as a social group at the facilities of University
Helsinki. Kennel dogs seldom met other dogs or humans except the
caretakers and the researchers with whom they were familiar. Kennel dogs
were fed two times a day and released into an outside area every day for 2
hours. After the experiments, all kennel dogs were re-homed to private
families. All the dogs had normal vision as evaluated by their owners or
caretakers.
Table 2 Number, sex and breeds of dogs that participated in the experiments.
Exp.I Exp.II Exp.III Exp.IV Family dogs – 6 38 16 Females – 5 31 11 Males – 1 7 5 Kennel dogs (Beagles) 8 – 8 8 Females 2 – 2 2 Males 6 – 6 6 Total number of dogs 8 6 46 24 Australian kelpie – – 1 – Beauceron – 3 3 3 Border collie – – 7 1 Boxer – – 2 – Bouvier des Flandres – – 1 – German pinscher – – 1 – German shepherd – – 3 – Great Pyrenees – 1 1 1 Hovawart – 1 3 2 Lagotto Romagnolo – – 1 1 Manchester terrier – – 1 – Miniature poodle – – 2 – Miniature schnauzer – – 1 – Mixed breed – – 3 2 Rottweiler – – 1 – Rough collie – 1 2 2 Smooth collie – – 1 2 Swedish shepherd – – 1 1 Welsh corgi cardigan – – 3 1

34
4.1.2 HUMANS In experiment III, human data from 26 volunteers were included: a completely
re-analysed subsample from a previous experiment (Kujala et al. 2012). There
were two groups of humans: dog experts and non-experts. Dog experts (9
females, 4 males, age 31.9 ± 6.6 years) owned a dog/dogs and had extensive
experience of dogs. Non-experts (5 females, 8 males, age 28.2 ± 7.5 years)
did not own a dog and they had little experience of dogs. All the participants
had normal vision or corrected-to-normal vision.
4.2 STIMULI
In experiments I – IV, the stimuli were specifically chosen to be able to study
cognitive and neural processes related to image categorization and viewing
natural social scenes (see Figure 3 for examples). For experiments I, II and
IV, images were obtained from personal collections and image databases on
the internet (e.g. 123RF and bigstockphoto). In experiment III, a selection of
60/200 original images from a previous human study (Kujala et al. 2012) were
chosen for the comparative study between dogs and humans.
The stimuli in experiments I–II were close-up images of faces, objects, and
characters, detached from their original backgrounds. In experiment I, the
stimuli consisted of color images of 36 upright human and 39 dog faces, and
3 inverted human and 3 dog faces (Figure 3). Inverted faces were part of
another experiment with different aim, and their small total number of stimuli
did not result in an adequate signal-to-noise ratio to allow comparisons with
the other image categories. However, inverted images were used for the
general feasibility analysis of the brain responses. The facial images were
approximately 550 x 600 pixels (px) in size. All the faces were detached from
their original background and placed on a gray background. In experiment II,
color images of 29 human faces, 27 dog faces, 12 children’s toys and 15
alphabetic characters were used as stimuli. The images were presented on a
gray background and were 750 x 536 px in size.
In experiment III, the stimuli consisted of natural full-body images of dogs
and humans within a neutral background, and artificially created control

35
images. More specifically, the stimulus images were color photos of two dogs
facing towards each other and greeting by sniffing or playing; two dogs facing
away from one another; two humans facing each other and greeting; and two
humans facing away from one another. In addition, in experiment III
crystallized pixel images were used as control stimuli, taken from a random
sample of both interactive and non-interactive image conditions. There were
12 images per category. The dog images were 567 × 397 px and the human
images 640 × 480 px placed on a grey background. Images were of equal
physical dimensions (20 x 14 cm) in human and dog studies.
The stimuli in experiment IV were natural full-body color images of dogs,
humans, and wild animals (e.g. elephants, tigers, pandas), either close-up or
within their natural surroundings (Figure 3). There were three categories of
images: 1) landscape images that contained a human or an animal, 2) single
human or animal full body images 3) full body images of two paired humans
or animals (4 human and 4 animal images per each category). Images were
725 x 550 px in size overlaid on a grey background.
Figure 3 Two images from the left: Examples of dog and human face images used in Experiment I. Two images from the right: Example images from experiment IV (full-body image of paired wild animals and landscape image containing a dog).
For dogs, stimuli were presented with PresentationÒ software
(Neurobehavioral Systems, San Francisco, CA, USA) in experiments I and II.
In experiments III and IV, stimuli were shown using Experiment centerÔ 3.0
software (SensoMotoric Instruments GmbH, Berlin, Germany). The images
were delivered on a 22-inch (47.4 × 29.7 cm) liquid-crystal display (LCD)
monitor. For humans in experiment III, the stimuli were shown with
PresentationÒ software (Neurobehavioral Systems, San Francisco, CA, USA)
Experiment I images Experiment IV images

36
and shown on a projection screen by a data projector (Christie Vista x3,
Christie Digital Systems Inc., Cypress, CA, USA).
4.3 TRAINING OF THE DOGS
Before the experiments, dogs were trained to lie still and lean their head on a
chin rest, because dog’s movements cause severe artifacts in the EEG and
eye tracking data. Kennel dogs were also accustomed to wearing a custom-
made vest with a pocket, which held the lightweight EEG amplifier was (Figure
4). Dogs were trained with a positive operant conditioning method (clicker) to
lie 1 minute on a 10 cm tick Styrofoam mattress and lean their head on a
purpose-designed u-shaped chin rest. Dogs were not trained to fixate on the
monitor or images. To pass the training period, a dog had to take the pre-
trained position on their own (without any command from the trainer) and to
remain in that position for at least 30 seconds while the owner/ experimenter
was behind an opaque barrier.
Family dogs were trained during 1 – 2 months before the experiments by
their owners as instructed by the experimenter. Dogs also visited the
experiment room with their owners, 2 – 9 times to become accustomed to the
room and setup. Kennel dogs were trained during an 18-month period by the
experimenters. Kennel dog training took longer than that of the family dogs,
because they were less used to the training situation and had less obedience
training experience previously than the family dogs. Kennel dogs were also
trained for the task less often than family dogs.

37
Figure 4 Left: The experimental setup during the EEG measurement. The dogs were lying on a mattress and leaning their head on a chin rest while observing the stimuli from the computer monitor. The dogs were also carrying the dog vest with the EEG amplifier. Right: A dog watching images from computer monitor during eye tracking. The eye tracker was mounted under the monitor (eye tracker not visible in picture). The experimental setup was similar to the EEG setup except the dogs were not wearing the EEG equipment.
4.4 ELECTROENCEPHALOGRAPHY
4.4.1 OVERVIEW EEG is a widely used method for investigation of brain function and for
determining the reactions of the brain to particular stimuli. Event-related
potentials (ERPs) are electrical potentials produced by the brain in response
to specific internal or external events (Storm van Leeuwen et al. 1975;
Callaway 1978). For a visual stimulus, the first major ERP component is the
P1 wave with a peak latency of approximately 100 ms. The P1 is followed by
the N1 wave peaking around 100-200 ms after stimulus onset, which has been
identified non-invasively from humans (e.g. Hillyard and Münte 1984;
O’Donnell et al. 1997) and intracranially in monkeys (e.g. Pineda et al. 1994;
Woodman et al. 2007) and in dogs (e.g. Bichsel et al. 1988; Lopes da Silva et
al. 1970 a, b). N1 has several subcomponents (Fabiani et al. 2007; Luck 2012).
The widely studied N170 wave is associated with the processing of faces: the
amplitude of N170 is stronger when facial stimuli are presented compared to
non-facial objects (Puce et al. 1995; Kanwisher et al. 1997; for a review, Haxby
et al. 2000). ERPs are not recognized from raw EEG data, so they are
extracted by digital averaging of recording periods of EEG time-locked to

38
different events (Dawson 1954; Teplan 2002; Luck 2012). Prior to this thesis,
there were no non-invasive ERP studies in dogs, and only one ERP study
where a dog’s reactions to auditory stimuli was measured with one needle
electrode (Howell et al. 2012), therefore we wanted to explore the usability of
non-invasive ERP technique in dog cognition studies.
4.4.2 MEASUREMENT Experiment I included EEG measurements from eight dogs. The EEG was
measured with an ambulatory Emblaâ TitaniumÔ-recorder, RemLogic Ô 2.0 -
software (Embla Systems) and custom-made trigger system. The size of the
EEG recorder was 3.5 x 7.5 x 11.4 cm and it weighted 200 g. Disposable
Unilectä (Unomedical a/s, Birkerod, Denmark) neonatal electrodes with
bioadhesive gel and cloth were used in the measurements. The hair on top of
the dog’s head was shaved, NuPrepägel (Weaver and Company, Aurora, CO)
was rubbed on the skin and the skin was cleaned with isopropyl alcohol. To
keep the electrodes in place, drops of cyanoacrylate glue were applied to the
corners of the electrode pads before the electrodes were attached to the skin.
Additionally, medical elastic tape was attached to the top of the electrodes.
The EEG was measured with seven electrodes: Fp1 and Fp2 above the eyes,
F3 and F4 located cornerwise from the previous in the postero-lateral
direction, Cz in the middle, and P3 and P4 on the back of the dog’s head
(Figure 5). Before the EEG measurements, the locations of the electrodes
were visualized with respect to each dog’s brain using computed tomography
(CT) images acquired with a Somatom Emotion Duo scanner (Siemens
Medical Solutions, Erlangen, Germany). The locations of the electrodes were
displayed with calcium pills placed on the surface of the dog’s head. The y-
linked reference electrodes were placed on the dog’s ears, and the ground
electrode was attached at the lower back. The impedances of the electrodes
were checked three times during each measurement to be sufficient, and the
EEG signals were band-pass filtered to 0.15–220 Hz and digitized at 512 Hz.

39
Figure 5 The layout of the electrodes on the dog’s head.
4.4.3 ANALYSIS The EEG data analyses were conducted with Matlab R2010B (Mathworks Inc,
Massachusetts, USA). All trials, where dog movement was detected, or EEG
channels’ amplitude exceeded 200 µV, were discarded from further analyses
to prevent data contamination by external artifacts. Each dogs’ EEG traces
were averaged across single trials from –200 ms prior to 400 ms after stimulus
onset, and 30 Hz low-pass filtering was used. To statistically confirm individual
level ERPs, a standard deviation was determined from the baseline period of
Fp1 Fp2
F3 F4
Cz
P3 P4

40
-200 ms to 0 ms separately in each EEG channel, and the statistical threshold
level was set to 3.291 standard deviations, which corresponds to the
significance level of p < 0.001 of the estimated t statistics. After that, all the
time points from 0 to 400 ms were statistically tested against the baseline level,
to reveal significantly differing brain responses from the baseline level. For the
group analysis, the response of individual dogs was normalized with respect
to the maximum modulation during the 0 – 400 ms time period (with respect to
the –200 to 0 ms baseline period), so that the maximum amplitude was given
value 1 and the rest of the responses were scaled accordingly. This made it
possible to scale the responses of all dogs similarly and to ensure that any
single dog’s responses did not drive the group-level effect. After that, a group-
level grand average of eight dogs was made by averaging together the
individual traces, and the group-level responses from 0 to 400 ms were
compared to zero (one-sample t tests, p < 0.001). For species-related testing,
group level grand averages of ERP traces were calculated for the human and
dog face categories separately, and the responses to the human and dog
faces were compared using paired-samples t tests (p < 0.01).
4.5 EYE TRACKING
4.5.1 OVERVIEW By eye tracking we can obtain some insight into what the observer found
interesting and what drew his/ her attention for example towards a certain point
in an image. Eye tracking is a widely applied method in studies of cognitive
processes in humans (Duchowski 2017), and recently also in non-human
primates (e.g. Dahl et al. 2007; Kano and Tomonaga 2009) and in dogs (e.g.
Téglás et al. 2012; Somppi et al. 2014).
Given that eye tracking is a relatively new technique to be used in dogs,
there is a lack of information regarding the length and speed of dogs’ fixations
and saccades. In the eye tracking analyses of this thesis, based on a study
conducted in monkeys (Kano and Tomonaga 2009), a fixation was coded if
the minimum fixation duration was 75 ms, and the maximum dispersion value

41
D = 250 px {D = [max(x) − min(x)] + [max(y) − min(y)]}. Elsewise the recorded
data sample was defined to be part of the saccade. A low-speed event
detection algorithm was used for scoring the fixations. It calculates potential
fixations with a moving window spanning consecutive data points.
Before an eye tracking episode, the eye tracker must be calibrated to each
participant’s eyes in order to collect data as accurately as possible. The
accuracy of measured eye movements depends on how well the calibration
has succeeded. In adult humans, calibration is done by asking the participant
to look at certain points on the screen. Based on this, the eye tracker program
analyses eye position in each calibration point and calculates coordinates to
the gaze direction (Duchowski 2017). In infant or current animal studies,
moving targets are commonly used in order to maintain participants attention
in these points (Gredebäck et al. 2010; Téglás et al. 2012). Before this thesis
project, there were no studies where dogs’ eye gaze had been measured with
remote eye-tracking. One eye gaze tracking study in dogs was published
simultaneously with experiment II of this thesis (Téglás et al. 2012).
4.5.2 MEASUREMENT Eye tracking was used in Experiments II – IV. Dogs’ binocular eye movements
were measured at a sampling rate of 250 Hz with an infrared contact-free eye
tracker (iView Xä RED250, SensoMotoric Instruments GmbH, Berlin,
Germany), based on a corneal reflection (Figure 6). The eye tracker was
integrated into an LCD monitor. In experiment II, human monocular eye
movements were recorded at a sampling rate of 60 Hz with the SMI MEye
Track long-range eye-tracking system (SensoMotoric Instruments GmbH,
Berlin, Germany), which is based on video-oculography and dark pupil-corneal
reflection.
In dogs (experiments II - IV), the eye tracker was calibrated using a five-
point procedure. The screen was replaced with a plywood wall with five 30-
mm holes in the calibration point positions, and the experimenter lifted up a
flap covering a hole and showed a treat in the hole to catch the dog’s attention.
Another experimenter accepted the calibration point with the operating

42
computer program (iView Xä, SensoMotoric Instruments GmbH, Berlin,
Germany), when the dog had looked at a point for at least 5 seconds. After all
calibration points were accepted, the dog was rewarded with a treat. In
addition, two calibration check trials were done after the initial calibration. To
pass the criterion for an adequate calibration, the dog needed to fixate on the
central calibration point and at least three of four distal points within a 1° radius.
Calibration and experimental sessions were recorded on separate days in
order to maintain the ideal vigilance and to prevent frustration of the dog. The
dog and eye tracker position and illumination were kept the same during
calibration, calibration check trials and actual experiments. The human eye
calibration (experiment III) followed a standard procedure: the calibration was
performed by showing five fixation points on the screen, which humans were
asked to look at.
Figure 6 Dogs’ binocular eye image from the eye trackers’ recording program SMI Experiment center. The eye tracker registers the center of the pupil (white crosshair) and corneal reflection (black crosshair).
4.5.3 ANALYSIS The eye gaze data were analyzed using BeGazeä software (SensoMotoric
Instruments GmbH, Berlin, Germany). In experiments II – IV, calculations were
made from binocular raw data in dogs. In experiment III, gaze parameters were
calculated from monocular raw data obtained in humans. Before the statistical
analyses, the stimuli were divided into areas of interest (AOI) and gaze
variables were calculated for these areas. The statistical analyses were
conducted using SPSS statistics (IBM, New York, USA).

43
In experiment II, repeated linear mixed-effect models were used to analyze
the differences in gaze parameters between the familiar and the novel images,
between image categories (dog, human, letter, and item), and between the
blank screen and image-viewing frames. Each image was divided into three
AOI areas: monitor, image, and object. Number of fixations, duration of single
fixation, total duration of fixations, and relative fixation duration (the duration
of object area fixations divided by the image area fixations) were calculated
for each AOI. In the comparison between blank screen and image-viewing
frames, the relative fixation duration was the duration of image area fixations
divided by the monitor area fixations.
To make the human and dog data comparable in Experiment III, both
species’ eye movement data were analyzed with a likewise procedure with
BeGazeä software. Repeated-measures analysis of variance (ANOVA) were
used to examine the differences between family and kennel dogs, and
between human experts and non-experts. Post-hoc tests (independent
samples t-tests with between-groups and within-groups comparison) were
then used to clarify the ANOVA results. Two AOI areas were used: image and
object area (the heads and bodies of the two dogs/humans). Pixel images did
not have object AOI area. Total gaze time (sum of durations of all fixations and
saccades) was calculated for the image area and relative gaze time (the total
object area gaze time divided by the image area gaze time) for the object area.
Furthermore, the number of saccades between two objects (the transitions of
fixations from left object to right object and vice versa) were calculated for the
two AOIs.
In experiment IV, the differences between family and kennel dogs’ eye
movements were studied with repeated-measures analysis of variance
(ANOVA), and ANOVA results were clarified with paired samples t-tests. Total
gaze times (sum of durations of all fixations and saccades) were calculated for
each AOI area (object, background, head, and body). There was variation in
the sizes of the AOI areas between image categories and species represented
in images, and therefore the gaze time was measured as a normalized score,
“proportional gazing time” (applied from Dahl et al. 2009; Guo et al. 2010;
Somppi et al. 2016). Calculation of the score was done by subtracting the

44
relative AOI size (e.g. the size of the head divided by the size of the whole
object) from the relative gaze time (e.g. the total gaze time of the head divided
by the total gaze time of the whole object area).
45
5 RESULTS
5.1 APPLICABILITY OF NON-INVASIVE EEG AND EYE TRACKING IN DOG COGNITION STUDIES
Experiment I explored the feasibility of event-related EEG measurements in
dogs and experiments II – IV studied the applicability of eye gaze tracking in
studying canine cognitive processes. Experiment I demonstrated the
applicability of non-invasive scalp-EEG in studying the neural processes
underpinning canine visual cognition and object perception. Early visual ERPs
were detected at 75 – 100 ms from the time of the stimulus onset in individual
dogs. At the group level, the data of eight dogs at the most posterior sensors
(P3 and P4) differed significantly from zero bilaterally at approximately 75 ms.
Some variation in the amplitude of the visual N1 response was detected
between dogs, even though the latency and the transient form of the
responses were similar across individuals.
Experiments II – IV showed that remote eye tracking is a feasible method
to study dog cognition related to image viewing. All of the dogs’ eyes were
successfully calibrated before the experiments, and calibration accuracy was
between 84 and 96 %, calculated as a portion of fixated points out five
calibration points within a 1° radius in calibration checks from all dogs (Table
3). In Experiment II, six dogs’ eye gaze were successfully tracked, and dogs
focused their attention on the informative regions of the images: they fixated
longer and more often towards the screen when images were shown than
when there was only blank screen. The eye gaze tracking succeeded better
for one eye than the other. For the better eye, the average tracking ratio (mean
percentage of the time pupil was detected during the entire experimental
session) was on average 45 %. In Experiment III, successful gaze tracking
was gained from 32 family dogs, eight kennel dogs, and 26 humans. Six family
dogs were excluded from the analyses due to their restless behavior (e.g.
leaving repeatedly from the chin rest or turning their heads away from the
screen) during the recordings. In experiment IV, eye gaze was successfully
recorded from 16 family dogs and eight kennel dogs. Images were excluded

46
from the analyses due to technical difficulties, eye-tracker software problems
or dogs leaving/ lifting their head from the chin rest (Table 3).
Table 3 The calibration accuracy in percentage in eye tracking experiments and number of excluded stimuli from analyses on average per dog or human in all experiments.
Experiment Research method Calibration accuracy
Excluded stimuli
I Electroencephalography - 74/240
II Eye tracking 84% 10/143 III Eye tracking -Dogs 95% 4/60 -Humans - a 2/60
IV Eye tracking 96% 5/72 a Calibration accuracy was not checked in humans, instead a standard calibration procedure was followed
5.2 CATEGORY-RELATED DIFFERENCES IN DOGS’ BRAIN RESPONSES AND GAZING TIMES
All experiments I - IV explored the differentiation of visual categories by dogs.
Differences in ERPs between human and dog faces were detected at 75 – 100
ms in the posterior sensors and at 350 – 400 ms in the anterio-temporal
sensors in Experiment I. In eye tracking Experiment II, dogs’ gazing behavior
differed between image categories. All the results in Experiment II were
analyzed with repeated linear mixed-effects models. Dogs fixated dog faces
more than human faces, items or letters (mean ± standard error of the mean
(SEM), for dog versus human 534 ± 80 ms versus 446 ± 80 ms, p < 0.05; for
dog versus item 534 ± 80 ms versus 294 ± 80 ms, p <0.01; for dog versus
letter 534 ± 80 ms versus 94 ± 120, p < 0.001; human versus letter 446 ± 80
ms versus 94 ± 120, p < 0.01; letter versus item 94 ± 120 versus 294 ± 80, p
< 0.05; Figures 7 & 8). Furthermore, dogs fixated on dog images more often
(2.0 ± 0.3) than human (1.6 ± 0.3, p < 0.05), item (1.2 ± 0.3, p < 0.01) or letter
images (0.5 ± 0.5, p < 0.01). Statistically significant difference was found in a
main effect of the image category on the relative fixation duration of the object

47
(p = 0.042), but in the pairwise comparisons image categories did not differ
from each other (duration of object area fixations divided by image area
fixations in percentage: dog 65.4 ± 6.4%; human 56.2 ± 6.7%; item 60.4 ±
8.4%; and letter 39.8 ± 13.3%). In addition, dogs fixated familiar images longer
than novel images in all image categories. The first image of the series
gathered more fixations (1.8 ± 0.3) than familiar (1.3 ± 0.3, p < 0.01) or novel
images (0.1 ± 0.3, p < 0.001). After the first image the number of fixations
decreased (p < 0.05) and the duration of single fixation increased (p < 0.01).
Experiment II also showed that dogs fixated more (2.3 ± 0.4 versus 1.1 ± 0.5,
p < 0.001) and the durations of single fixations were longer (205 ms, 95%
confidence interval (CI) 137 – 307 versus 128 ms, 95 % CI 85 – 193) at the
monitor when images were displayed than when the monitor was blank.
Figure 7 Total duration of fixations (mean ± SEM) toward dog, human, item and letter images in dogs (Experiment II). Letters indicate statistically significant differences between image categories (p < 0.05).
In Experiment IV, paired samples t-tests were used to compare the
proportional gazing times of object, background, head and body areas. Family
and kennel dogs gazed at the head area longer than the body (0.10 ± 0.03
and -0.10 ± 0.03, respectively; t23 = 3.3, p = 0.003) or background area (0.10
± 0.03 and -0.26 ± 0.03, respectively; t23 = 8.6, p = 0.001). In addition, the body
area was gazed longer than the background area (-0.10 ± 0.03 and -0.26 ±
0.03, respectively; t23 = 3.4, p = 0.002). Furthermore, the object area was
0 100 200 300 400 500 600 700
Letter
Item
Human
Dog
Total duration of fixations (ms)
a
b
c
d
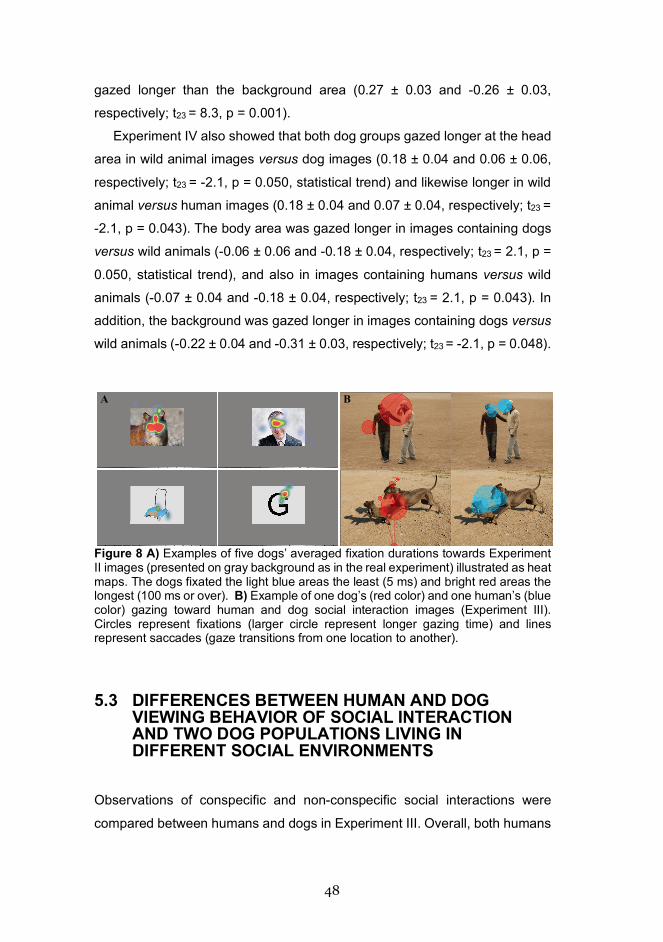
48
gazed longer than the background area (0.27 ± 0.03 and -0.26 ± 0.03,
respectively; t23 = 8.3, p = 0.001).
Experiment IV also showed that both dog groups gazed longer at the head
area in wild animal images versus dog images (0.18 ± 0.04 and 0.06 ± 0.06,
respectively; t23 = -2.1, p = 0.050, statistical trend) and likewise longer in wild
animal versus human images (0.18 ± 0.04 and 0.07 ± 0.04, respectively; t23 =
-2.1, p = 0.043). The body area was gazed longer in images containing dogs
versus wild animals (-0.06 ± 0.06 and -0.18 ± 0.04, respectively; t23 = 2.1, p =
0.050, statistical trend), and also in images containing humans versus wild
animals (-0.07 ± 0.04 and -0.18 ± 0.04, respectively; t23 = 2.1, p = 0.043). In
addition, the background was gazed longer in images containing dogs versus
wild animals (-0.22 ± 0.04 and -0.31 ± 0.03, respectively; t23 = -2.1, p = 0.048).
Figure 8 A) Examples of five dogs’ averaged fixation durations towards Experiment II images (presented on gray background as in the real experiment) illustrated as heat maps. The dogs fixated the light blue areas the least (5 ms) and bright red areas the longest (100 ms or over). B) Example of one dog’s (red color) and one human’s (blue color) gazing toward human and dog social interaction images (Experiment III). Circles represent fixations (larger circle represent longer gazing time) and lines represent saccades (gaze transitions from one location to another).
5.3 DIFFERENCES BETWEEN HUMAN AND DOG VIEWING BEHAVIOR OF SOCIAL INTERACTION AND TWO DOG POPULATIONS LIVING IN DIFFERENT SOCIAL ENVIRONMENTS
Observations of conspecific and non-conspecific social interactions were
compared between humans and dogs in Experiment III. Overall, both humans
A B
49
and dogs gazed longer at the actors in social interactions than non-social
images. However, dogs gazed longer at the actors in human rather than dog
social interaction images and humans gazed longer at the actors in dog rather
than human social interaction images (Table 4, Figure 8). The effect of social
living environment was studied in experiments III and IV by comparing the
gazing behavior of family and kennel dogs (Figure 9).
The gaze times of dog experts and non-experts were compared with
repeated-measures ANOVA. The results of the ANOVA were further clarified
with independent and paired samples t-tests. There was no difference in the
image area gaze time between experts and non-experts (F1,24 = 0.4, p = 0.5),
but a main effect of category was found (F2,47 = 6.0, p < 0.01). Both groups
gazed longer at pixel images than human non-social (human_away) images
(2313 ± 55 and 2110 ± 91 ms, respectively; t25 = 3.4, p < 0.01) and dog non-
social (dog_away) images were gazed at longer than human_away images
(2284 ± 67 and 2110 ± 91 ms, respectively; t25 = 3.5, p < 0.01). The gazing
time of pixel images created from social images (toward) and pixel images
created from non-social images (away) did not differ between experts and non-
experts (F1,24 = 0.4, p = 0.5, repeated-measures ANOVA). In addition, the
paired samples t-tests showed that across groups, the gazing times of toward
and away pixel images did not differ (2341 ± 61 and 2307 ± 56 ms,
respectively; t25 = 1.0, p = 0.3).
There was no difference in the relative gaze time of the object area
between experts and non-experts (F1,24 = 0.5, p = 0.5), but main effects of
species (F1,24 = 12.3, p < 0.01) and behavior (F1,24 = 40.3, p < 0.001) were
found (Experiment III). Across groups, the object area was gazed relatively
longer in human social interaction (human_toward) than human_away (68 ±
3.7 and 59 ± 2.9%, respectively; t25 = 3.6, p < 0.01), dog social interaction
(dog_toward) than dog_away (77 ± 2.5 and 68 ± 2.3%, respectively; t25 = 4.9,
p < 0.001), dog_toward than human_toward (77 ± 2.5 and 68 ± 3.7%,
respectively; t25 = 2.6, p < 0.05) and dog_away than human_away images (68
± 2.3 and 59 ± 2.9%, respectively; t25 = 3.4, p < 0.01). Between experts and
non-experts, there was no difference in the number of saccades between
objects (F1,22 = 0.001, p = 0.9). Nevertheless, a main effect of category was

50
found (F2,42 = 6.2, p < 0.01). Across groups, humans displayed more saccades
between objects in dog_toward than human_toward images (1.4 ± 0.07 and
0.9 ± 0.13, respectively; t23 = 3.6, p < 0.01), and in dog_away than
human_away images (1.4 ± 0.07 and 1.1 ± 0.05, respectively; t23 =3.1, p <
0.01, Table 4).
The gaze times between family and kennel dogs were compared with the
same statistical methods as in humans (repeated-measures ANOVA and t-
tests). The image area gazing time differed between family and kennel dogs
(between-subjects factor group, F1,38 = 7.6, p < 0.01). In addition, there was a
main effect of category (F4,152 = 2.5, p < 0.05). Family dogs’ image area gazing
time was longer than kennel dogs in human_toward (1557 ± 83 and 1058 ±
119 ms, respectively; t38 = 2.8, p < 0.01), human_away (1544 ± 88 and 1056
± 128 ms, respectively; t38 = 2.6, p < 0.05), dog_toward (1462 ± 92 and 929 ±
132 ms, respectively; t38 = 2.7, p < 0.05) and dog_away (1460 ± 79 and 930 ±
96 ms, respectively; t38 = 3.2, p < 0.01) categories, but gazing times did not
differ in the pixel category (1441 ± 96 and 1070 ± 104 ms, respectively; t38 =
1.9, p = 0.07, Figure 9). In within groups comparisons, family dogs gazed at
the image area longer in human_toward than pixel (t31 = 2.5, p < 0.05),
human_away than pixel (t31 = 2.5, p < 0.05) and human_away than dog_away
categories (t31 = 2.1, p < 0.05). In kennel dogs, the gazing time of the image
area was longer in human_away than dog_away category (t7 = 2.4, p < 0.05).
In addition, there was no difference in the gazing time between toward and
away pixel images for family and kennel dogs (between-subjects factor group,
F1,38 = 3.1, p = 0.08). Paired-samples t-tests showed that across groups, the
gazing times of toward and away pixel images (1358 ± 94 and 1391 ± 84 ms,
respectively; t39 = 0.5, p = 0.6) did not differ.

51
Figure 9 The differences between family and kennel dogs gazing times (mean ± SEM) toward stimulus images in Experiment III. Asterisks indicate statistically significant differences between dog groups (**p < 0.01 and *p < 0.05).
There was no difference in relative gazing time at the object area between
family and kennel dogs (F1,38 = 0.6, p = 0.5). Instead, species (F1,38 = 7.1, p <
0.05) and behavior (F1,38 = 22.2, p < 0.001) main effects were found. Both dog
groups’ relative gazing time was longer at the object area in interaction images
and human images. The gaze time was longer in human_toward than
human_away (42 ± 1.5 and 31 ± 1.8%, respectively; t39 = 5.9, p < 0.001),
dog_toward than dog_away (36 ± 1.5 and 30 ± 1.4%, respectively; t39 = 4.9, p
< 0.001) and human_toward than dog_toward (42 ± 1.5 and 36 ± 1.5%,
respectively; t39 = 13.3, p < 0.001) images. In addition, between family and
kennel dogs, there was no difference in the number of saccades between
objects (F1,22 = 4.1, p = 0.06), but a main effect of category was found (F3,66 =
9.1, p < 0.001). Across groups, dogs demonstrated more saccades between
objects in human_toward than in human_away images (0.2 ± 0.03 and 0.03 ±
0.01, respectively; t23 = 4.9, p < 0.001, Table 4).
0 200 400 600 800 1000 1200 1400 1600 1800
Human non-social
Dog non-social
Human social interaction
Dog social interaction
Gaze time (ms)
Family dogs Kennel dogs
*
**
**
*

52
Table 4 The relative gaze times (the gaze time (ms) of the object area divided by the gaze time (ms) of the image area in percentage ± SEM) of image categories by humans and dogs in Experiment III.
In Experiment IV, the proportional gazing times of object, background,
head, and body areas of the images were compared between family and
kennel dogs with repeated-measures ANOVA and the results were further
clarified with paired samples t-tests. There was no difference in the
proportional gaze time between family and kennel dogs (between-subjects
factor group, F1,22 = 0.024, p = 0.877). Instead, main effect of AOI area (F2,38
= 38.9, p = 0.001) and interaction effects between AOI area x group (F2,38 =
4.6, p = 0.020), AOI area x species (F3,62 = 2.9, p = 0.046), AOI area x image
category (F3,69 = 10.1, p = 0.001) and AOI area x image category x group (F3,69
= 3.2, p = 0.028) were found.
Family dogs gazed at the head area longer than the body (0.15 ± 0.03 and
-0.15 ± 0.03, respectively; t15 = 4.6, p = 0.001) or background (0.15 ± 0.03 and
-0.31 ± 0.04, respectively; t15 = 11.0, p= 0.001) areas. In addition, family dogs’
gazing time was longer for the object area than for the background (0.31 ±
0.04 and -0.31 ± 0.04, respectively; t15 = 8.0, p = 0.001) area. Furthermore, the
body area gazing time was longer than the background area gazing time (-
0.15 ± 0.03 and -0.31 ± 0.04, respectively; t15 = 2.7, p = 0.018). In kennel dogs,
the gazing time was longer for the head than the background (0.01 ± 0.05 and
-0.18 ± 0.04, respectively; t7 = 3.3, p = 0.012) area. In addition, kennel dogs’
gazing time was longer for the object than the background area (0.18 ± 0.04
and -0.18 ± 0.04, t7 = 4.1, p = 0.005).
In experiment IV it was also found that family dogs gazed longer at the
head area in images containing a single human or animal versus paired human
or animal (0.22 ± 0.06 and 0.07 ± 0.02, respectively; t15 = 2.7, p = 0.017).

53
Family dogs also gazed longer at the body area in paired versus single human
or animal images (-0.07 ± 0.02 and -0.22 ± 0.06, respectively; t15 = -2.7, p =
0.017). Furthermore, family dogs gazed longer at objects in single human or
animal versus landscape images (0.49 ± 0.08 and 0.11 ± 0.03, respectively;
t15 = -4.9, p = 0.001) and likewise longer in paired human or animal versus
landscape images (0.31 ± 0.06 and 0.11 ± 0.03, respectively; t15 = -3.2, p =
0.007) and also longer in single human or animal versus paired images (0.49
± 0.08 and 0.31 ± 0.06, respectively; t15 = 2.4, p = 0.030). Instead, family dogs
gazed longer at the background area in landscape versus single (-0.11 ± 0.03
and -0.49 ± 0.08, respectively; t15 = 4.9, p = 0.001) or paired images (-0.11 ±
0.03 and -0.28 ± 0.05, respectively; t15 = 3.0, p = 0.010). Likewise, they gazed
longer at the background areas in paired versus single images (-0.28 ± 0.05
and -0.49 ± 0.08, respectively; t15 = -3.5, p = 0.003). In kennel dogs, the gazing
times of object area were also longer for paired human or animal versus
landscape images (0.29 ± 0.09 and 0.08 ± 0.06, respectively; t7 = -4.0, p =
0.005). Kennel dogs also gazed longer at the background area in landscape
versus paired human or animal images (-0.08 ± 0.06 and –0.26 ± 0.07,
respectively; t7 = 3.5, p = 0.009).

54
6 DISCUSSION
This thesis examined the feasibility of non-invasive EEG and eye tracking
methods in studying dogs’ neuronal functions and cognitive processes. This
was investigated in studies that involved viewing different kinds of social and
non-social stimulus images, comparisons of human and dog gazing behavior
and by comparing two dog groups living in different social environments.
6.1 RELIABILITY OF NON-INVASIVE EEG IN DOG COGNITION STUDIES
Experiment I was designed to validate the feasibility of non-invasive EEG in
alert non-medicated dogs by measuring the visual ERPs in individual dogs and
within the group level. We detected the early visual N1 response of dogs at
approximately 75 – 100 ms, which roughly corresponds with the visual N1 in
humans. Compared to the typical human visual N1 response, which peaks
around 100 ms, dogs’ response occurred somewhat earlier, but otherwise the
transient form of the ERP response was similar in both species. In addition, all
individual dogs showed highly similar ERP responses peaking at
approximately 100 ms (p < 0.001) within the lateral posterior channels, which
are the channels closest to the occipital brain areas of primary visual
processing (Van Essen 1979; Uemura 2015). This result validates the
feasibility of non-invasive ERP measurements in individual dogs.
The earlier occurrence of the N1 response in dogs compared with humans
is in accordance with non-human primate studies (Van der Marel et al. 1984;
Woodman et al. 2007). In the Bichsel et al. (1988) study investigating
anesthetized dogs, the mean latency of visual N1 response was approximately
54 – 56 ms recorded with subdermal electrodes. Methodological differences
between human and animal studies can also lead to variations in results.
Subdermal single-unit recordings tell us about the functional characteristics of
individual neurons and non-invasive surface electrodes record large ensemble
activity (Woodman et al. 2007). Anesthesia suppresses neural activity and
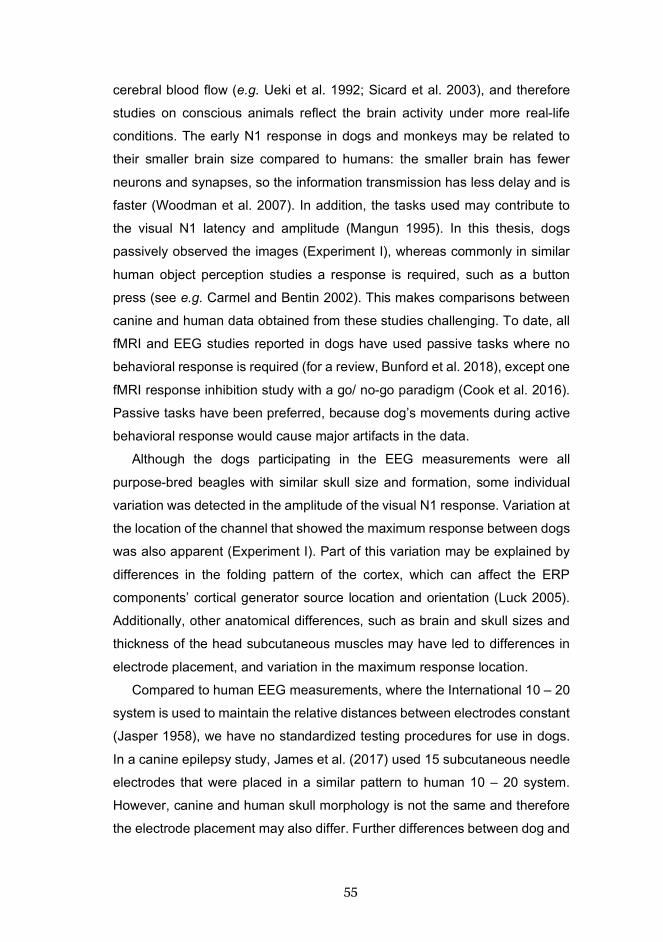
55
cerebral blood flow (e.g. Ueki et al. 1992; Sicard et al. 2003), and therefore
studies on conscious animals reflect the brain activity under more real-life
conditions. The early N1 response in dogs and monkeys may be related to
their smaller brain size compared to humans: the smaller brain has fewer
neurons and synapses, so the information transmission has less delay and is
faster (Woodman et al. 2007). In addition, the tasks used may contribute to
the visual N1 latency and amplitude (Mangun 1995). In this thesis, dogs
passively observed the images (Experiment I), whereas commonly in similar
human object perception studies a response is required, such as a button
press (see e.g. Carmel and Bentin 2002). This makes comparisons between
canine and human data obtained from these studies challenging. To date, all
fMRI and EEG studies reported in dogs have used passive tasks where no
behavioral response is required (for a review, Bunford et al. 2018), except one
fMRI response inhibition study with a go/ no-go paradigm (Cook et al. 2016).
Passive tasks have been preferred, because dog’s movements during active
behavioral response would cause major artifacts in the data.
Although the dogs participating in the EEG measurements were all
purpose-bred beagles with similar skull size and formation, some individual
variation was detected in the amplitude of the visual N1 response. Variation at
the location of the channel that showed the maximum response between dogs
was also apparent (Experiment I). Part of this variation may be explained by
differences in the folding pattern of the cortex, which can affect the ERP
components’ cortical generator source location and orientation (Luck 2005).
Additionally, other anatomical differences, such as brain and skull sizes and
thickness of the head subcutaneous muscles may have led to differences in
electrode placement, and variation in the maximum response location.
Compared to human EEG measurements, where the International 10 – 20
system is used to maintain the relative distances between electrodes constant
(Jasper 1958), we have no standardized testing procedures for use in dogs.
In a canine epilepsy study, James et al. (2017) used 15 subcutaneous needle
electrodes that were placed in a similar pattern to human 10 – 20 system.
However, canine and human skull morphology is not the same and therefore
the electrode placement may also differ. Further differences between dog and
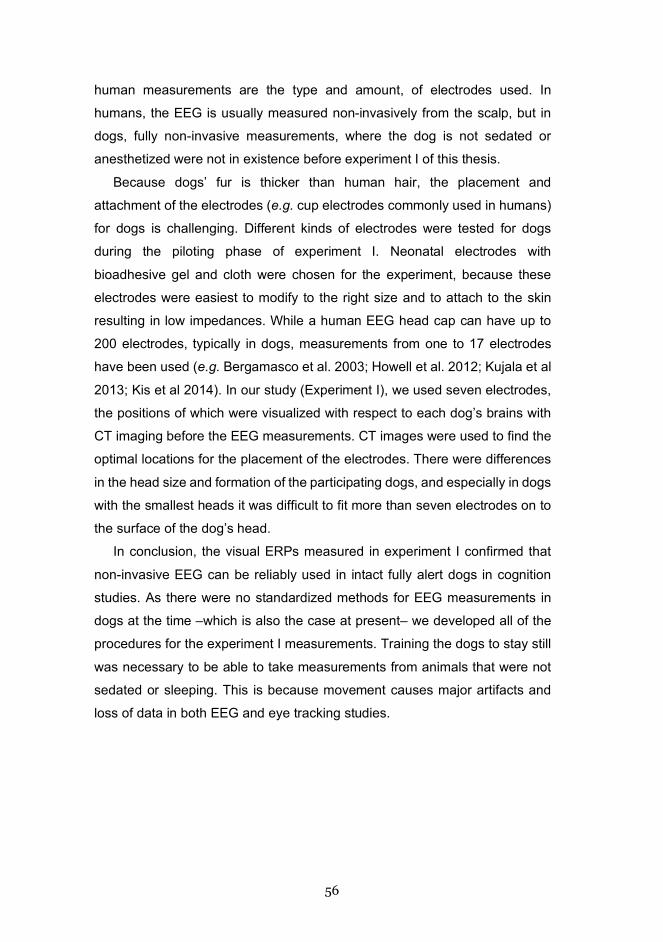
56
human measurements are the type and amount, of electrodes used. In
humans, the EEG is usually measured non-invasively from the scalp, but in
dogs, fully non-invasive measurements, where the dog is not sedated or
anesthetized were not in existence before experiment I of this thesis.
Because dogs’ fur is thicker than human hair, the placement and
attachment of the electrodes (e.g. cup electrodes commonly used in humans)
for dogs is challenging. Different kinds of electrodes were tested for dogs
during the piloting phase of experiment I. Neonatal electrodes with
bioadhesive gel and cloth were chosen for the experiment, because these
electrodes were easiest to modify to the right size and to attach to the skin
resulting in low impedances. While a human EEG head cap can have up to
200 electrodes, typically in dogs, measurements from one to 17 electrodes
have been used (e.g. Bergamasco et al. 2003; Howell et al. 2012; Kujala et al
2013; Kis et al 2014). In our study (Experiment I), we used seven electrodes,
the positions of which were visualized with respect to each dog’s brains with
CT imaging before the EEG measurements. CT images were used to find the
optimal locations for the placement of the electrodes. There were differences
in the head size and formation of the participating dogs, and especially in dogs
with the smallest heads it was difficult to fit more than seven electrodes on to
the surface of the dog’s head.
In conclusion, the visual ERPs measured in experiment I confirmed that
non-invasive EEG can be reliably used in intact fully alert dogs in cognition
studies. As there were no standardized methods for EEG measurements in
dogs at the time –which is also the case at present– we developed all of the
procedures for the experiment I measurements. Training the dogs to stay still
was necessary to be able to take measurements from animals that were not
sedated or sleeping. This is because movement causes major artifacts and
loss of data in both EEG and eye tracking studies.

57
6.2 VISUAL EVENT-RELATED POTENTIALS DURING HUMAN AND DOG FACIAL IMAGE VIEWING IN DOGS
The early visual ERP responses differed between human and dog facial
images at 75 – 100 ms at the group level in the posterior sensor P3
(Experiment I). This difference was detected within the transient, early visual
N1-like response. However, early ERPs are sensitive to low-level differences
in the stimulus images, and it is possible that the early differences were due
to elementary stimulus features such as luminance and contrast, that were not
specifically matched across categories. Showing dark compared to bright
stimuli against similar backgrounds elicits larger amplitude and delayed peak
latency of the N1 component in humans (Hughes et al. 1984; Johannes et al.
1995; Wijers et al 1997). Dogs’ abilities to discriminate differences in
brightness have been estimated to be half that of humans (Pretterer et al.
2004; Kasparson et al. 2013). In Experiment I, this may have affected dogs’
perception of the stimulus images and the related ERP responses. In
Experiment I, dog facial images were overall darker than human facial images,
because of the different coat colors and patterns the dogs presented in the
images. This might have also influenced the observed ERP differences
between image categories. This should be taken into account in future studies,
where early visual responses are the focus of the study.
Later differences in visual ERP responses between human and canine
facial images were also detected at the group-level data in an electrode
located anterio-laterally on the left side of the dog’s head, above the dog’s
temporal cortex. The temporal cortex is associated with visual processing of
faces in humans (Allison et al. 1994; Puce et al. 1995; Kanwisher and Yovel
2006), in monkeys (Gross et al. 1972; Perrett et al. 1982; Tsao et al. 2006)
and in sheep (Kendrick and Baldwin 1987; Kendrick 1991). The later ERP
responses are considered to be quite unaffected to contrast changes (e.g.
Rolls and Baylis 1986; Avidan et al. 2002). However, EEG recordings are
highly sensitive to artifacts, such as eye and muscle movements, which can
be difficult to distinguish from true cerebral activity (Libenson 2010). As there
were no clear brain responses within this late time window, artifacts may have
58
also affected the results of Experiment I and therefore replication is needed to
confirm these results. In the Experiment I, only face stimuli were used, but in
the future studies also other stimulus categories should be included to be able
to compare visual ERP responses for example between faces and objects
(Dilks et al. 2015). Recent fMRI studies have confirmed that likewise, dogs
have brain regions in the temporal lobe specialized for the processing of faces
(Dilks et al. 2015; Cuaya et al. 2016). Nevertheless, differences between
canine and human brain structures make it difficult to determine if a measured
electrocortical signal derives from comparable populations of neurons (for a
review, Bunford et al. 2017).
The results showed differences in earlier and later ERPs to dog and human
face images, but more studies are still needed to confirm these results, since
this was the first study using non-invasive EEG measurement in dogs. At this
point, we cannot exclude the possible effects of low-level stimulus properties
or some unaccounted-for artifacts in the ERP responses, even after the rather
rigorous data cleaning and artifact removal.
6.3 RELIABILITY OF EYE TRACKING IN DOG COGNITION STUDIES
This thesis examined the applicability of eye tracking for dog cognition studies
(Experiments II – IV), and also for direct comparisons between dogs and
humans (Experiment III). The eye tracker that we utilized in our studies is
designed for humans, and therefore it is not optimal for dog studies. Eye-
tracking systems use an eye movement detection algorithm and threshold
settings for categorizing the raw eye movement data into fixations and
saccades. The default settings are developed for tracking adult human eyes,
and if dogs’ eye movements differ from humans’, the algorithm may not work
in an optimal way (Park et al. 2020). Despite this limitation, calibration
accuracy was sufficiently high in all experiments (on average 91.7 %) and eye
tracking data were successfully collected from almost all of the participating
dogs.

59
In experiments II – IV, dogs’ binocular eye movements were recorded and
averaged. In experiment III, monocular eye tracking was used in humans.
Holmqvist et al. (2011) reported that usually human participants’ eyes look at
the same position, but some people have one dominant and one passive eye,
which looks in a different direction. Similar differences may also exist between
dogs’ eyes, and therefore using monocular eye tracking might give more
precise results. Binocular eye tracking was used in our experiments, because
the eye tracker we used was designed for binocular eye tracking and the
calibration was made with both of the dogs’ eyes. In experiments II – IV the
eye tracker was calibrated using a five-point procedure, where the screen was
replaced with a plywood wall with five holes in the calibration point positions,
and the experimenter showed a treat in the hole to attract the dog’s attention.
This calibration method was developed in experiment II, because there was
no previous calibration method for use in dogs. It would have been difficult to
get dogs to look at the calibration points presented in the display without
training them to look at those points.
Experiments II – IV participants included dogs of multiple breeds. They had
varying head shapes and respectively, their eyes were at varying angles with
respect to the eye tracker, which might have affected how well the eye tracker
could measure the eye gaze. In experiment II, where the tracking ratio (mean
percentage of the time eye tracker could detect a pupil) was reported, the eye
tracking succeeded better for one eye than the other. In dogs with long
muzzles/ snouts, the snout can obscure the eyes, such that the infrared rays
sent by the eye tracker could not reach both of the dog’s eyes. Therefore, each
dog’s eyes had to be individually calibrated for the eye tracker and dog position
optimally adjusted for the measurements.
Based on these eye tracking experiments it was concluded that measuring
dogs’ eye movements is challenging, but possible. Measuring dogs’ cognitive
functions with eye tracking can provide details that cannot be seen from the
dogs’ behavior. In addition, comparisons with results in humans can be done
using the same paradigm in both species. However, the default eye movement
classification algorithms of human eye trackers, may not be optimal for dogs,
and this should be considered in future studies.

60
6.4 ATTENTIONAL FOCUS ON THE PRESENTED IMAGES IN DOGS
Eye gaze tracking demonstrated that dogs were looking more at the monitor
when images were displayed than when the monitor was blank (Experiment
II). This indicates that dogs did not learn to fixate on the monitor merely in
anticipation of a reward even when images were not presented. Dogs were
also focusing their attention on the images’ informative regions, such as the
face and the whole-body area, without specific training for this kind of targeting
(Experiments II–IV). This result has been further confirmed in other canine eye
tracking studies (e.g. Téglas et al. 2012; Somppi et al. 2014; Barber et al.
2016). However, dogs do not maintain a constant level of attention on the
stimuli, particularly if the same images are repeated. The first frame of the
image series attracted the highest looking time, and the looking time was
decreased when the image was repeated (Experiment II). Visual habituation
(decline in looking with repeated presentation of stimulus) is a well-known
psychological effect (Fantz 1964), which has been widely studied in human
infants (for a review, Colombo and Mitchell 2009). Consistently, it has been
also found in monkeys (Joseph et al. 2006) and our result was verified in
another recent canine study (Kis et al. 2017b). These results confirm that dogs’
basic cognitive processes (e.g. habituation) during image viewing are similar
to humans’, because similar processes have been found also in human eye
tracking studies.
Dogs were also found to gaze at images for a shorter time than humans
(Experiment III). This finding suggests that dogs have quicker processing
mechanisms, i.e. they need less time to decode the social cues. Dogs also
might have a more limited attention span, or they are more easily bored than
adult humans (see for a review, Wróbel 2000; Burn 2017). Based on our
experiments, it is hard to define an optimal presentation time of the images or
the length of image series for the dogs. Video clips with moving targets might
hold dogs’ attention better than still images, because dogs’ visual system is
especially adapted to following movement (Miller and Murphy 1995). In
addition, the ecological validity of videos might be better than still images, but
the analysis of complex video stimuli is not straightforward. Contrary to our

61
results and other studies where human and dog gazing behavior have been
compared (Guo et al. 2009; Racca et al. 2012; Correia-Caeiro et al. 2020), a
recent eye-tracking experiment suggest that dogs’ saccades/ eye movements
are slower and fixations longer than those of humans for facial or round non-
facial objects (Park et al. 2020). However, the total gaze time was not reported
in the work by Park and colleagues (2020). Longer fixations might be beneficial
for the dog, whose visual system is especially adapted to following movement.
Longer fixations make it possible to keep their sight focused on moving objects
or focused on motionless objects when the dog is moving (Sjaastad et al.
2010). The discrepancy between study results might be due to the different
kind of stimuli (natural full-body versus close-up facial images) or differences
in the eye tracking systems’ sampling frequencies and algorithms used
(Holmqvist et al. 2011; Park et al. 2020).
Dogs focused their gaze on the biologically relevant and informative areas
of the images. In Experiment II, where faces, items and letters were shown,
dogs fixated longer on the image compared with the surrounding background
monitor area and on the object compared with the image background.
Similarly, in Experiment IV, where animals and humans were shown in
different kinds of natural backgrounds, dogs gazed at the living creatures
(object area) longer than background area of the images, as previously
reported in humans and non-human primates (e.g. Yarbus 1967; Nahm et al.
1997; Kano and Tomonaga 2009). Experiment IV results suggest rapid and
accurate detection of living creatures from landscape images by dogs, which
have been previously shown in humans and non-human primates (e.g. Fabre-
Thorpe et al. 1998; Thorpe et al. 2001). Dogs’ focus on the biologically relevant
information is also consistent with the “life detector mechanism” (for a review,
Rosa Salva et al. 2015). In addition, dogs generally gazed longer on the head
than the background area, which highlights the importance of faces in visual
processing of social animals (for a review, Leopold and Rhodes 2010).
In conclusion, dogs focused their attention on the presented images and
biologically relevant areas in them (Experiments II-IV). Compared to humans,
dogs gazed at images for a shorter time, which can be related to dogs’ quicker
processing mechanisms or limited attention span. However, to differentiate

62
between these two, more comparative studies are needed, where dogs’ and
humans’ eye movements are measured under similar conditions.
6.5 EFFECTS OF IMAGE CATEGORY AND COMPOSITION TO THE GAZING BEHAVIOR IN DOGS
In Experiments II and III, dogs’ gazing times differed between image
categories, which suggests that dogs can differentiate images based on their
categorical content. These findings are in accordance with earlier behavioral
studies, where dogs have been explicitly taught to discriminate between image
categories (Range et al. 2008; Autier-Dérian et al. 2013), and also with other
eye tracking studies in dogs (Somppi et al. 2014, 2016, 2017; Barber et al.
2016).
Relatively little is known about the basic visual capacities of dogs, and yet
most of the cognitive research tasks in dogs are visual, because these tasks
are adapted from human and monkey studies (for a review, Byosiere et al.
2018). Based on the findings in experiments I – IV, dogs can differentiate the
image categories and concentrate their eye movements on the informative
areas of the images, but how they actually perceive these images remains a
mystery. Dogs’ visual acuity seems to be less precise, and also brightness
discrimination and color vision are more limited than in humans. Estimates of
dogs’ visual acuity have varied greatly probably owing to various research
methods (e.g. Odom et al. 1983; Miller and Murphy 1995; Tanaka et al. 2000a;
Lind et al. 2017), so there is a need to develop a reliable visual acuity measure
to assess which size of stimuli dogs are able to see clearly. Variation in head
and facial morphology (muzzle length, skull shape) between dog breeds may
affect the eye structure (McGreevy et al. 2004), visual acuity (Murphy et al.
1992; for a review, Byosiere et al. 2018) and also the cognitive performance
(Gácsi et al. 2009b). The differences between the visual capacities of different
dog breeds will provide an excellent topic for a further study.
In experiments I – IV, dogs were shown color images of humans, animals,
letters of the alphabet, and items. In previous canine studies both gray-scale
images and color images were used (e.g. Range et al. 2008; Racca et al.

63
2012). Dogs’ color discrimination abilities remain controversial (e.g. Neitz et
al. 1989; for a review, Byosiere et al. 2018), and it is unclear how dogs
perceive these images. Kasparson et al. (2013) suggests that color cues are
more important than brightness when dogs are choosing between stimuli;
color can be one of the characteristics that enable the discrimination and
recognition processes. However, stimulus images have been quite simple in
studies where dogs’ perceptual abilities have been tested, and it is not the
natural situation, where objects and events generate complex stimuli that
affect several senses (Miklósi 2014). By developing more natural tasks and
experimental situations we could obtain more valid data from comparative
studies between humans and dogs (Cook 1993; Hare 2001; Stevens 2010).
Composition of the images can affect the dogs gazing behavior. In the
experiments of this thesis, different kinds of stimulus images were used, which
can create discrepancies in the results. In Experiment II, dogs gazed at canine
facial images more than human facial images, but in Experiment III, where full
body images of social interaction were used, they gazed at humans more than
dogs. In addition, the size of the object in the image can affect the gazing
behavior. In Experiment IV, dogs gazed less time at animals/ humans in
landscape images, in which the size of the object was smaller relative to the
background, than in other types of images. Reduced looking times of smaller
objects in Experiment IV suggests that dogs are not able to see small
differences in the images, which may be related to poorer visual acuity and
less ability to distinguish brightness in dogs than in humans (Pongracz et al.
2017; for a review, Byosiere et al. 2018). However, one of the reasons for the
reduced looking times of smaller objects might be that the calibration accuracy
was not sufficient for the smaller objects in these images. Dogs might have
actually looked at these objects, but the accuracy of the eye tracker was not
sufficient to detect the gazes with this precision.
Thus, the results of these experiments indicate that dogs are able to
spontaneously differentiate images based on their categorical content.
However, there is still a lack of basic information on dogs’ visual abilities and
what size of objects dogs are able to distinguish from the images.

64
6.6 THE DIFFERENCES BETWEEN DOGS’ AND HUMANS’ GAZING BEHAVIOR IN IMAGES WITH SOCIAL AND NON-SOCIAL CONTENT
This thesis examined visual processing of different kinds of stimulus images
by dogs, varying also in their social content. In Experiment III, the gazing
behavior of humans and dogs were compared to social and non-social images.
In the studies of thesis, dogs gazed at canine facial images more than human
facial images (Experiment II), but when dogs gazed at full body images of
social interaction, they gazed at humans more than dogs (Experiment III). In
addition, humans gazed longer at the actors in canine rather than human
interaction images (Experiment III). This suggests that processing of non-
conspecific social interactions may take more time and be cognitively more
demanding for both dogs and humans. Furthermore, dogs and humans might
use an adaptive social attention strategy, which is influenced by innate
preferences, social learning and experiences. Dogs’ gazing behavior towards
human social interaction images might also reflect their inherent sensitivity to
human social gestures (Udell et al. 2010).
Images in Experiments II and III were contextually quite different (large
close-up faces versus full body images from the side view at a greater
distance), which may partly explain the differences in dogs’ gazing behavior
between these experiments. It might be that close-up facial images of
conspecifics were more threatening and drew dogs’ attention more than full
body images from the side view. In experiment II, dogs might have looked at
dog faces more than human faces, because they were biologically more
relevant and therefore captured their attention more effectively. It is also
possible that dogs avoided gazing directly at human faces, even though the
facial images in this study were neutral. During domestication, dogs might
have adapted to living with humans by displaying such conflict-avoiding
signals towards humans (Győri et al. 2010; Somppi et al. 2016).
When results from dogs and humans were compared in Experiment III,
similarities were also found. Both dogs and humans gazed longer and made
more transitions (saccades) between actors in social interaction rather than
non-social images. In social interaction situations both faces and whole bodies

65
are important sources of information because facial expressions, bodily
gestures and postures reflect the emotional states and goals of actors. In the
previous fMRI study, similar brain areas related to social cognition were
activated when humans observed humans or dogs in interactional situations,
suggesting similarities in brain mechanisms processing social information
regardless of species (Kujala et al. 2012). In dogs, social interaction stimuli
have not been studied yet, but a recent dog fMRI study found a temporal lobe
area that responded similarly to human and dog face images (Dilks et al. 2015;
but see Thompkins et al. 2018). Direct comparisons between humans’ and
dogs’ cognitive functions are still very rare, which is probably due to the
tradition of comparing humans and non-human primates and a lack of
methods, that allow direct comparisons. Non-invasive EEG and eye tracking
make comparisons possible, as well as fMRI technique, but they require the
dogs to be trained to stay in place during the measurements.
In experiments II - IV, the differences between image categories imply, that
dogs can differentiate social and non-social stimuli from each other, and that
they preferred to look at the stimuli that were more socially and biologically
relevant for them. Differences between social interaction and non-social
images of Experiment III are unlikely to be due to responses to low-level
stimulus properties (e.g. contrast and luminance). This is because gazing
times of the pixelated stimulus images, manufactured from the interactive and
non-interactive images, differed neither in humans nor in dogs.
To summarize, differences and also similarities were found between
humans and dogs gazing behavior towards social stimuli. Both dogs and
humans gazed for longer at social stimuli than at non-social stimuli. However,
both species gazed for longer at actors in non-conspecific images, which might
indicate that the processing of social interaction of non-conspecifics is more
demanding.

66
6.7 GAZING BEHAVIOR OF TWO DOG POPULATIONS LIVING IN DIFFERENT SOCIAL ENVIRONMENTS
This thesis also investigated the effect of social environment and life
experiences on the gazing behavior of two dog groups: family and kennel
dogs. Family dogs live closely and interact constantly with humans, whereas
kennel dogs usually live in quite isolated kennel facilities and interact more
with their own small group of dogs than with humans. Topál et al. (1997)
showed, that dogs kept outside of the house (e.g. as guard dogs) used less
gazing behavior towards human in a problem-solving task than dogs that were
kept indoors for companionship.
In this thesis, family dogs gazed at social images (interacting dogs or
humans) longer than kennel dogs that were living in a limited social
environment, but otherwise their gazing behavior did not differ (Experiment III).
This suggests that social experiences might have affected the processing of
the social stimuli, but that the basic processing of social stimuli is similar
despite social experiences. During domestication, dogs may have been
predisposed to detect human social cues, but also the exposure to humans
affects how social information is processed (for a review, Reid 2009). In
Experiment IV, family dogs focused their gaze at the head areas of single
animals or humans, but in images containing paired animals or humans, they
gazed more at the body than the head areas. Family dogs’ fixations may have
been spread more widely in images containing two head areas i.e. in the
paired than in the single animal or human images. In these images, the social
bodily gestures (two animals or humans sitting or standing close to each other)
may have drawn family dogs’ attention into body areas. Kennel dogs’ gazing
times did not differ between head and body areas in the single or paired
images. Otherwise family and kennel dogs gazing behavior was quite similar.
Consistently with Experiment III and IV results, a recent behavioral study
showed that kennel dogs were less responsive/ active to social and
environmental stimuli than family dogs or kennel dogs that were adopted at
age of 8 weeks of age by families (Turcsán et al. 2020). Experiment III and IV
results are also consistent with another eye tracking study of our research
group, where kennel dogs gazed at faces for a shorter duration of time than

67
family dogs did (Somppi et al. 2014). However, in another study, the total
looking time at human faces was longer in kennel dogs than family dogs. This
study suggests that it takes longer for kennel dogs to process the facial
information than family dogs, because kennel dogs have less experience of
faces as they are not part of their daily visual environment (Barber et al. 2016).
The discrepancy between results might be affected by the different kind of
stimuli, testing procedures and data analysis used in these experiments.
In addition, breed can affect dogs’ viewing behavior. Previous behavioral
studies have shown, that herding and working dogs that have been bred to
respond to human communicative signals, are more skilled at using gestural
cues. They show more human-directed gazing behavior than dogs that are not
bred for cooperation with humans, e.g. primitive and molossoid dogs (Wobber
et al. 2009; Passalacqua et al. 2011). Kennel dogs that participated in the
experiments of this thesis were beagles, which are hunting dogs bred for more
independent hunting than cooperation with humans, and most of the family
dogs were breeds from herding or working groups. However, there might be
great individual variation within dog breeds, which should also be considered
in future studies (Arden et al. 2016; Turcsán et al. 2020). In addition, dogs’
sociability and training level can affect their willingness to gaze at social
images or read social gestures in behavioral tests (Jakovcevic et al. 2012;
Marshall-Pescini et al. 2009; McKinley and Sambrook 2000). Kennel dogs
were quite fearful and cautious in training and experimental situations
compared to family dogs, and it took more time for kennel dogs to learn for
example to keep their heads on the chin rest. Most of family dogs had also
had previous training experience from obedience, agility, or other dog sports,
which kennel dogs did not have.
Overall, the number of dogs participating in the experiments should have
been higher to allow comparisons between dog breeds (Experiments III – IV).
There was also a significant overlap in the dogs, which participated in the
experiments. Therefore, our results might not be generalizable to the larger
population comprising all existing dog breeds (for a review, Bensky et al. 2013;
Arden et al. 2016). The reasons behind this might be the limited number of
dogs available for studies, the prolonged training needed before the

68
experiments, and also dog owners’ willingness to participate in multiple
studies.
Thus, the results obtained in this thesis suggest that there are some
differences in the gazing behavior between family and kennel dogs inferring
the effect of social environment, but the basic visual processes seem to be
similar between these dog groups. There are some discrepancies in the study
results, which may be related to different study setups.
6.8 METHODOLOGICAL CONSIDERATIONS
In this thesis, novel non-invasive methods were developed for studying dogs’
cognitive processes, and there is always a chance to improve things. Dogs
were trained with positive operant conditioning method to lie still during the
EEG and eye tracking measurements (Experiments I – IV) to prevent head
movements, which cause major artifacts in data. Most of the excluded data in
both EEG and eye tracking were due to a dog leaving or lifting its head from
the chin rest. Dogs were trained to lie still, but they were not under any
command, and they were free to move. Movement artifacts may be smaller
when measuring EEG during sleep or drowsiness (e.g. Kis et al. 2017a), but
this makes studying cognitive functions impossible. A fMRI study compared
awake and lightly sedated dogs’ brain responses to different odors and
concluded that higher order brain structures responsible for cognitive functions
were mainly activated only in conscious dogs (Jia et al. 2014). Recently, an
eye tracking system has been developed that allow participants to move more
freely by allowing more data noise (Correia-Caeiro et al. 2020).
Some studies suggest that intensive training of the dogs to the task might
influence their natural responses, gazing patterns as well as their cognitive
processes during image viewing (Kis et al. 2017b; Correia-Caeiro et al. 2020),
although dogs were not trained to gaze at the images or monitor. In this thesis
work, training was regarded as necessary because dog’s movements during
the calibration and eye tracking caused serious artifacts and loss of data, thus
exposing studies to too few samples per dog. Movement artifacts are one of
the reasons why extensive training has been very successfully also used in

69
fMRI studies with dogs (e.g. Berns et al. 2012). Furthermore, as dogs learn
very quickly, they may also learn some behavior during the experiment, thus
unwanted and unsupervised dog learning in the experimental studies pose a
serious confounding factor since it is unaccounted for. In the future, this issue
should be investigated further by comparing dogs that are trained to the task
with untrained dogs.
It could be argued that it would be more natural to use odors for testing
dogs’ cognitive abilities rather than visual stimuli, because the sense of smell
is highly important to dogs. Dogs’ olfactory bulb and cortex are larger in size
compared to humans, and the dog nose epithelium has hundreds of millions
more olfactory cells than the human nose. Dogs’ olfactory capability is at least
100 times greater for detecting certain odors than humans (Moulton et al.
1960; Gazit and Terkel 2003; Lindsay 2013). However, dogs also use their
sight in everyday communication and based on the results of Experiments II –
IV, they seem to pay attention to visual stimuli and are able to acquire social
information from the still images by using only their sight.
6.9 FUTURE RESEARCH
Eye tracking and non-invasive EEG are promising methods for dog cognition
studies, and with these methods we can advance our understanding of dog-
human interaction and dog behavior. In the future, combining eye gaze
tracking with EEG recording could show what is happening in the brain during
a particular visual task. Simultaneous recordings could help to identify and
reject eye movement artifacts (e.g. blinks) from the EEG signal (Plöchl et al.
2012). However, eye tracking and EEG recordings should be synchronized
carefully, for example by sending marker signals into both data streams.
Interesting new non-invasive methods in dog research are functional near-
infrared spectroscopy (fNIRS) and infrared thermography (IRT). fNIRS was
piloted in one study, where hemodynamic changes in canine brains during
positive interactions with humans were measured (Gygax et al. 2015). IRT can
be used to visualize and measure superficial temperatures and temperature
changes in the body, that are related to illnesses, and also to stress and

70
emotional states (for a review, Stewart et al. 2005; Nakayama et al 2005;
Vainionpää 2014).
For clinical purposes EEG has primarily been used in the diagnosis of
canine epilepsy (e.g. Pellegrino and Sica 2004; Jeserevics et al. 2007; Jokinen
et al. 2007). In the future, EEG and eye gaze tracking could be used to unveil
the neurocognitive changes present in family dogs suffering from chronic pain
(e.g. due to osteoarthritis). Identifying the effect of pain in animals is
challenging (for a review, Hansen 2003; Vainio 2012; for a review, Reid et al.
2018), and new methods should thus be introduced. Given their evolutionary
history with humans, dogs can be used as translational models for human
disorders such as genetic diseases and age-related cognitive decline (Shearin
and Ostrander 2010; Chapagain et al. 2018). Family dogs can be also
monitored in their natural environment, which they share with humans, unlike
laboratory raised monkeys or rats (for a review, Bunford et al. 2017).
The dog as a model can expand our understanding of human cognition and
its evolution and may prove valuable in identifying mechanisms underlying
human diseases. Furthermore, dog owners benefit from a better
understanding of their dog’s social-cognitive skills, which can improve welfare
in dogs and cooperation between dogs and humans.

71
7 CONCLUSIONS
1. The feasibility of non-invasive EEG in dog cognition studies was
confirmed. Early visual ERPs were detected in response to viewing facial
images, and a difference between human and canine facial images was
found, which may be associated with the visual processing of facial
information.
2. Eye tracking is a promising method for studying canine cognitive abilities
and also for comparing eye movements between humans and dogs.
Dogs focused their attention on biologically relevant areas, such as head
area, in the images presented.
3. Dogs’ gazing times differed between image categories, which implies that
dogs were able to differentiate between images according to their
categorical content. In addition, the composition of the images affected
dogs’ gazing behavior, for example smaller objects were gazed at less
than larger ones in the images.
4. Both humans and dogs gazed at social interaction images more than
non-social images, but both gazed more at the other’s species interaction
than their own species.
5. Gazing behavior of two dog populations (family and kennel dogs) had
minor differences. Kennel dogs that were living in a limited social
environment gazed at social interaction images less than family dogs and
focused their attention on different areas in the images, but otherwise the
basic visual processes seem to be similar between family and kennel dogs.
72
REFERENCES
Adachi I, Kuwahata H, Fujita K (2007) Dogs recall their owner's face upon hearing the owner's voice. Animal Cognition 10, 17-21.
Adams CL, Molfese DL, Betz JC (1987) Electrophysiological correlates of
categorical speech perception for voicing contrasts in dogs. Developmental Neuropsychology 3, 175-189.
Albuquerque N, Guo K, Wilkinson A et al. (2016) Dogs recognize dog and
human emotions. Biology Letters 12, 20150883. Alcock J (2009) Animal Behavior: An Evolutionary Approach. Sinauer
Associates. Allison T, Ginter H, McCarthy G et al. (1994) Face recognition in human
extrastriate cortex. Journal of Neurophysiology 71, 821-825. Anderson JR, Sallaberry P, Barbier H (1995) Use of experimenter-given cues
during object-choice tasks by capuchin monkeys. Animal Behaviour 49, 201-208.
Andersson R, Nyström M, Holmqvist K (2010) Sampling frequency and eye-
tracking measures: how speed affects durations, latencies, and more. Journal of Eye Movement Research 3, 1-12.
Andics A, Gácsi M, Faragó T et al. (2014) Voice-sensitive regions in the dog
and human brain are revealed by comparative fMRI. Current Biology 24, 574-578.
Andics A, Gábor A, Gácsi M et al. (2016) Neural mechanisms for lexical
processing in dogs. Science 353, 1030-1032. Arden R, Bensky MK, Adams MJ (2016) A review of cognitive abilities in dogs,
1911 through 2016: more individual differences, please! Current Directions in Psychological Science 25, 307-312.
Autier-Dérian D, Deputte BL, Chalvet-Monfray, K et al. (2013) Visual
discrimination of species in dogs (Canis familiaris). Animal Cognition 16, 637-651.
Avidan G, Harel M, Hendler T et al. (2002) Contrast sensitivity in human visual
areas and its relationship to object recognition. Journal of Neurophysiology 87, 3102-3116.

73
Baker JM, Morath J, Rodzon KS et al. (2012) A shared system of representation governing quantity discrimination in canids. Frontiers in Psychology 3, 387.
Barber ALA, Randi D, Müller CA et al. (2016) The processing of human
emotional faces by pet and lab dogs: Evidence for lateralization and experience effects. Plos One 11, e0152393.
Bensky MK, Gosling SD, Sinn DL (2013) The world from a dog’s point of view:
a review and synthesis of dog cognition research. In Advances in the Study of Behavior 45, 209-406.
Berendt M, Hogenhaven H, Flagstad A et al. (1999) Electroencephalography
in dogs with epilepsy: similarities between human and canine findings. Acta Neurologica Scandinavica 99, 276-283.
Bergamasco L, Accatino A, Priano, L et al. (2003) Quantitative
electroencephalographic findings in beagles anaesthetized with propofol. The Veterinary Journal 166, 58-66.
Berger H (1929) Über das elektroenkephalogramm des menschen. Archiv für
Psychiatrie und Nervenkrankheiten 87, 527-570. Berlyne DB (1958) The influence of the albedo and complexity of stimuli on
visual fixation in the human infant. British Journal of Psychology 49, 315-318.
Berns GS, Brooks AM, Spivak M (2012) Functional MRI in awake unrestrained
dogs. Plos One 7, e38027. Berns GS, Brooks A, Spivak M (2013) Replicability and heterogeneity of
awake unrestrained canine fMRI responses. Plos One 8, e81698. Berns GS, Cook PF (2016) Why did the dog walk into the MRI? Current
Directions in Psychological Science 25, 363-369. Bichsel P, Oliver JE, Coulter DB et al. (1988) Recording of visual-evoked
potentials in dogs with scalp electrodes. Journal of Veterinary Internal Medicine 2, 145-149.
Britton JW, Frey LC, Hopp JL et al. (2016) Electroencephalography (EEG): An
Introductory Text and Atlas of Normal and Abnormal Findings in Adults, Children, and Infants. American Epilepsy Society, Chicago.
Brodmann K (1909) Vergleichende okalisationslehre der Grosshirnrinde in
ihren Prinzipien dargestellt auf Grund des Zellenbaues. Barth. Bruce V, Young A (1998) In the Eye of the Beholder: The Science of Face
Perception. Oxford: Oxford University Press.

74
Bräuer J, Call J, Tomasello M (2004) Visual perspective taking in dogs (Canis familiaris) in the presence of barriers. Applied Animal Behaviour Science 88, 299-317.
Bräuer J, Kaminski J, Riedel J et al. (2006) Making inferences about the
location of hidden food: social dog, causal ape. Journal of Comparative Psychology 120, 38-47.
Bunford N, Andics A, Kis A et al. (2017) Canis familiaris as a model for non-
invasive comparative neuroscience. Trends in Neurosciences 40, 438-452. Bunford N, Reicher V, Kis A et al. (2018) Differences in pre-sleep activity and
sleep location are associated with variability in daytime/nighttime sleep electrophysiology in the domestic dog. Scientific Reports 8, 7109.
Burn CC (2017) Bestial boredom: A biological perspective on animal boredom
and suggestions for its scientific investigation. Animal Behaviour 130, 141-151.
Bush EC, Allman JM (2004) The scaling of frontal cortex in primates and
carnivores. Proceedings of the National Academy of Sciences 101, 3962-3966.
Buswell GT (1935) How People Look at Pictures. A study of the Psychology
of Perception in Art. The University of Chicago Press. Byosiere SE, Feng LC, Woodhead JK et al. (2017) Visual perception in
domestic dogs: susceptibility to the Ebbinghaus–Titchener and Delboeuf illusions. Animal Cognition 20, 435-448.
Byosiere SE, Chouinard PA, Howell TJ et al. (2018) What do dogs (Canis
familiaris) see? A review of vision in dogs and implications for cognition research. Psychonomic Bulletin and Review 25, 1798-1813.
Call J, Agnetta B, Tomasello M (2000) Cues that chimpanzees do and do not
use to find hidden objects. Animal Cognition 3, 23-34. Call J, Bräuer J, Kaminski J et al. (2003) Domestic dogs (Canis familiaris) are
sensitive to the attentional state of humans. Journal of Comparative Psychology 117, 257-263.
Callaway E, Tueting P, Koslow SH (1978) Event-related Brain Potentials in
Man. New York: Academic Press. Carmel D, Bentin S (2002) Domain specificity versus expertise: factors
influencing distinct processing of faces. Cognition 83, 1-29. Carlson SM, Koenig MA, Harms MB (2013) Theory of mind. Wiley
Interdisciplinary Reviews: Cognitive Science 4, 391-402.

75
Caton R (1875). Electrical currents of the brain. The Journal of Nervous and Mental Disease 2, 610.
Chapagain D, Range F, Huber L et al. (2018) Cognitive aging in dogs.
Gerontology 64, 165-171. Clayton NS, Emery NJ (2015) Avian models for human cognitive
neuroscience: a proposal. Neuron, 86, 1330-1342. Coile DC, Pollitz CH, Smith JC (1989) Behavioral determination of critical
flicker fusion in dogs. Physiology and Behavior 45, 1087-1092. Colombo J, Mitchell DW (2009) Infant visual habituation. Neurobiology of
Learning and Memory 92, 225-234. Cook RG (1993) The experimental analysis of cognition in animals.
Psychological Science 4, 174-178. Cook PF, Spivak M, Berns GS (2014) One pair of hands is not like another:
caudate BOLD response in dogs depends on signal source and canine temperament. PeerJ 2, e596.
Cook PF, Spivak M, Berns GS (2016) Neurobehavioral evidence for individual
differences in canine cognitive control: an awake fMRI study. Animal Cognition 19, 867-878.
Correia-Caeiro C, Guo K, Mills DS (2020) Perception of dynamic facial
expressions of emotion between dogs and humans. Animal Cognition, 1-12.
Cosgrove KP, Mazure CM, Staley JK (2007) Evolving knowledge of sex
differences in brain structure, function, and chemistry. Biological Psychiatry 62, 847-855.
Coulon M, Baudoin C, Heyman Y et al. (2011) Cattle discriminate between
familiar and unfamiliar conspecifics by using only head visual cues. Animal Cognition 14, 279-290.
Cuaya LV, Hernandez-Perez R, Concha L (2016) Our faces in the dog's brain:
Functional imaging reveals temporal cortex activation during perception of human faces. Plos One 11, e0149431.
Dahl CD, Logothetis NK, Hoffman KL (2007) Individuation and holistic
processing of faces in rhesus monkeys. Proceedings of the Royal Society B: Biological Sciences 274, 2069-2076.
Dahl CD, Wallraven C, Bülthoff HH et al. (2009) Humans and macaques
employ similar face-processing strategies. Current Biology 19, 509-513.
76
Dalenberg JR, Hoogeveen HR, Lorist MM (2018) Physiological Measurements: EEG and fMRI. Methods in Consumer Research 2, 253-277.
Darwin C (1859) The origin of species; and, the descent of man. Modern
library. Darwin C (1872). The expression of the emotions in man and animals. London:
Murray. Dawson GD (1954) A summation technique for the detection of small evoked
potentials. Electroencephalography and Clinical Neurophysiology 6, 65-84. De Lahunta A (1983) Veterinary Neuroanatomy and Clinical Neurology.
Philadelphia: WB Saunders. De Risio L, Bhatti S, Muñana K et al. (2015) International veterinary epilepsy
task force consensus proposal: diagnostic approach to epilepsy in dogs. BMC Veterinary Research 11, 148.
Dilks DD, Cook P, Weiller SK et al. (2015) Awake fMRI reveals a specialized
region in dog temporal cortex for face processing. PeerJ 3, e1115. Dorey NR, Udell MAR, Wynne CDL (2009) Breed differences in dogs
sensitivity to human points: A meta-analysis. Behavioural Processes 81, 409-415.
Duchowski AT (2007) Eye Tracking Methodology: Theory and Practice.
London: Springer-Verlag. Duchowski AT (2017) Table-mounted system calibration. In Eye Tracking
Methodology. Cham: Springer. Eatherington CJ, Mongillo P, Lõoke M et al. (2020) Dogs (Canis familiaris)
recognise our faces in photographs: implications for existing and future research. Animal Cognition, 1-9.
Emery NJ (2000) The eyes have it: the neuroethology, function and evolution
of social gaze. Neuroscience and Biobehavioral Reviews 24, 581-604. Etsuro EU (2016) Fundamentals of Canine Neuroanatomy and
Neurophysiology. Oxford: John Wiley & Sons. Evans HE, De Lahunta A (2013) Miller's Anatomy of the Dog, E-book. Elsevier
Health Sciences. Fabiani M, Gratton G, Federmeier K (2007) Event-related brain potentials. In
J. Cacioppo, L. Tassinary & G. Berntson (Eds), Handbook of Psychophysiology, (pp. 85-119). Cambridge: Cambridge University Press.

77
Fabre-Thorpe M, Richard G, Thorpe SJ (1998) Rapid categorization of natural images by rhesus monkeys. Neuroreport 9, 303-308.
Fantz RL (1958) Pattern vision in young infants. The Psychological Record 8,
43-47. Fantz RL (1964) Visual experience in infants: Decreased attention to familiar
patterns relative to novel ones. Science 146, 668-670. Farah MJ (1996) Is face recognition ‘special’? Evidence from
neuropsychology. Behavioural Brain Research 76, 181-189. Felleman DJ, Van DE (1991) Distributed hierarchical processing in the primate
cerebral cortex. Cerebral cortex 1, 1-47. Frank H (1980) Evolution of canine information processing under conditions of
natural and artificial selection. Zeitschrift Für Tierpsychologie 53, 389-399. Frank H, Frank MG (1985) Comparative manipulation-test performance in ten-
week-old wolves (Canis lupus) and Alaskan malamutes (Canis familiaris): A Piagetian interpretation. Journal of Comparative Psychology 99, 266-274.
Fujita K (1987) Species recognition by five macaque monkeys. Primates 28,
353-366. Gácsi M, Miklósi Á, Varga O (2004) Are readers of our face readers of our
minds? Dogs (Canis familiaris) show situation-dependent recognition of human’s attention. Animal Cognition 7, 144-153.
Gácsi M, Gyoöri B, Virányi Z et al. (2009a) Explaining dog wolf differences in
utilizing human pointing gestures: Selection for synergistic shifts in the development of some social skills. Plos One 4, e6584.
Gácsi M, McGreevy P, Kara E et al. (2009b) Effects of selection for
cooperation and attention in dogs. Behavioral and Brain Functions 5, 31. Gazit I, Terkel J (2003) Domination of olfaction over vision in explosives
detection by dogs. Applied Animal Behaviour Science 82, 65-73. Gergely A, Petró E, Oláh, K et al. (2019) Auditory–visual matching of
conspecifics and non-conspecifics by dogs and human infants. Animals 9, 17.
Geschwind DH, Rakic P (2013) Cortical evolution: judge the brain by its cover.
Neuron 80, 633-647. Glover GH (2011) Overview of functional magnetic resonance imaging.
Neurosurgery Clinics 22, 133-139.

78
Gredebäck G, Johnson S, Hofsten C (2010) Eye tracking in infancy research. Developmental Neuropsychology 35, 1-19.
Gross CG, Rocha-Miranda CD, Bender DB (1972) Visual properties of
neurons in inferotemporal cortex of the macaque. Journal of Neurophysiology 35, 96-111.
Guo K, Meints K, Hall C et al. (2009) Left gaze bias in humans, rhesus
monkeys and domestic dogs. Animal Cognition 12, 409-418. Guo K, Tunnicliffe, D, Roebuck H (2010) Human spontaneous gaze patterns
in viewing of faces of different species. Perception 39, 533-542. Gygax L, Reefmann N, Pilheden T (2015) Dog behavior but not frontal brain
reaction changes in repeated positive interactions with a human: a non-invasive pilot study using functional near-infrared spectroscopy (fNIRS). Behavioural Brain Research 281, 172-176.
Győri B, Gácsi M, Miklósi Á (2010) Friend or foe: Context dependent sensitivity
to human behaviour in dogs. Applied Animal Behaviour Science 128, 69-77.
Hansen BD (2003) Assessment of pain in dogs: veterinary clinical studies.
ILAR journal 44, 197-205. Hare B, Tomasello M (1999) Domestic dogs (Canis familiaris) use human and
conspecific social cues to locate hidden food. Journal of Comparative Psychology 113, 173-177.
Hare B (2001) Can competitive paradigms increase the validity of experiments
on primate social cognition? Animal Cognition 4, 269-280. Hare B, Call J, Tomasello M (2001) Do chimpanzees know what conspecifics
know? Animal Behaviour 61, 139-151. Hare B, Brown M, Williamson C et al. (2002) The domestication of social
cognition in dogs. Science 298, 1634-1636. Hare B, Tomasello M (2005) Human-like social skills in dogs? Trends in
Cognitive Sciences 9, 439-444. Hare B (2007) From nonhuman to human mind: what changed and why?
Current Directions in Psychological Science 16, 60-64. Hart BL (1995) Analysing breed and gender differences in behaviour. The
Domestic Dog: Its Evolution, Behaviour and Interactions with People, (pp. 65-77). UK: Cambridge University Press.

79
Haxby JV, Hoffman EA, Gobbini MI (2000) The distributed human neural system for face perception. Trends in Cognitive Sciences 4, 223-233.
Head E (2013) A canine model of human aging and Alzheimer's disease.
Biochimica et Biophysica Acta (BBA)-Molecular Basis of Disease 1832, 1384-1389.
Healy K, McNally L, Ruxton GD et al. (2013) Metabolic rate and body size are
linked with perception of temporal information. Animal Behaviour 86, 685-696.
Helme AE, Call J, Clayton NS et al. (2006) What do bonobos (Pan paniscus)
understand about physical contact? Journal of Comparative Psychology 120, 294-302.
Helton WS (2009) Cephalic index and perceived dog trainability. Behavioural
Processes 82, 355-358. Helton WS, Helton ND (2010) Physical size matters in the domestic dog's
(Canis lupus familiaris) ability to use human pointing cues. Behavioural Processes 85, 77-79.
Henderson JM (2003) Human gaze control during real-world scene
perception. Trends in Cognitive Sciences 7, 498-504. Herculano-Houzel S (2017) Numbers of neurons as biological correlates of
cognitive capability. Current Opinion in Behavioral Sciences 16, 1-7. Hernández-Pérez R, Concha L, Cuaya LV (2018) Decoding human emotional
faces in the dog's brain. BioRxiv, 134080. Hiestand L (2011) A comparison of problem-solving and spatial orientation in
the wolf (Canis lupus) and dog (Canis familiaris). Behavior Genetics 41, 840-857.
Hillyard SA, Münte TF (1984) Selective attention to color and location: An
analysis with event-related brain potentials. Perception and Psychophysics 36, 185-198.
Hirata S, Fuwa K, Sugama K et al. (2010) Facial perception of conspecifics:
chimpanzees (Pan troglodytes) preferentially attend to proper orientation and open eyes. Animal Cognition 13, 679-688.
Holmqvist K, Nyström M, Andersson R et al. (2011) Eye Tracking: A
Comprehensive Guide to Methods and Measures. Oxford: OUP Oxford. Horschler DJ, Hare B, Call J et al. (2019) Absolute brain size predicts dog
breed differences in executive function. Animal Cognition 22, 187-198.

80
Howell TJ, Conduit R, Toukhsati S et al. (2011) Development of a minimally-invasive protocol for recording mismatch negativity (MMN) in the dog (Canis familiaris) using electroencephalography (EEG). Journal of Neuroscience Methods 201, 377-380.
Howell TJ, Conduit R, Toukhsati S et al. (2012) Auditory stimulus
discrimination recorded in dogs, as indicated by mismatch negativity (MMN). Behavioural Processes 89, 8-13.
Hubel DH, Wiesel TN (1959) Receptive fields of single neurones in the cat's
striate cortex. The Journal of Physiology 148, 574-591. Hubel DH, Wiesel TN, Stryker MP (1978) Anatomical demonstration of
orientation columns in macaque monkey. Journal of Comparative Neurology 177, 361-379.
Hubel DH, Wiesel TN (1998) Early exploration of the visual cortex. Neuron 20,
401-412. Hughes HC (1984) Effects of flash luminance and positional expectancies on
visual response latency. Perception and Psychophysics 36, 177-184. Huettel SA, Song AW, McCarthy G (2004) Functional Magnetic Resonance
Imaging (Vol. 1). Sunderland, MA: Sinauer Associates. Jakovcevic A, Mustaca A, Bentosela M (2012) Do more sociable dogs gaze
longer to the human face than less sociable ones? Behavioural Processes 90, 217-222.
James FMK, Allen DG, Bersenas AME et al. (2011) Investigation of the use of
three electroencephalographic electrodes for long-term electroencephalographic recording in awake and sedated dogs. American Journal of Veterinary Research 72, 384-390.
James FMK, Cortez MA, Monteith G et al. (2017) Diagnostic utility of wireless
video-electroencephalography in unsedated dogs. Journal of Veterinary Internal Medicine 31, 1469-1476.
Jasper H (1958) Report of the committee on methods of clinical examination
in electroencephalography. Electroencephalography and Clinical Neurophysiology 10, 370-375.
Jensen P (2007) Mechanisms and function in dog behaviour. The Behavioural
Biology of Dogs. Trowbridge: Cromwell Press. Jeserevics J, Viitmaa R, Cizinauskas S et al. (2007) Electroencephalography
findings in healthy and finnish spitz dogs with epilepsy: visual and background quantitative analysis. Journal of Veterinary Internal Medicine 21,1299-1306.

81
Jia H, Pustovyy OM, Waggoner P et al. (2014) Functional MRI of the olfactory system in conscious dogs. Plos One 9, e86362.
Johannes S, Münte TF, Heinze HJ et al. (1995) Luminance and spatial
attention effects on early visual processing. Cognitive Brain Research 2, 189-205.
Jokinen TS, Metsähonkala L, Bergamasco L (2007) Benign familial juvenile
epilepsy in Lagotto Romagnolo dogs. Journal of Veterinary Internal Medicine 21, 464-471.
Joseph JE, Powell DK, Andersen AH et al. (2006) fMRI in alert, behaving
monkeys: an adaptation of the human infant familiarization novelty preference procedure. Journal of Neuroscience Methods 157, 10-24.
Kaas JH (2013) The evolution of brains from early mammals to humans. Wiley
Interdisciplinary Reviews: Cognitive Science 4, 33-45. Kaminski J, Call J, Fischer J (2004) Word learning in a domestic dog: evidence
for" fast mapping". Science 304, 1682-1683. Kano F, Tomonaga M (2009) How chimpanzees look at pictures: a
comparative eye-tracking study. Proceedings of the Royal Society B: Biological Sciences 276, 1949-1955.
Kano F, Tomonaga M (2010) Face scanning in chimpanzees and humans:
Continuity and discontinuity. Animal Behaviour 79, 227-235. Kano F, Tomonaga M (2013) Head-mounted eye tracking of a chimpanzee
under naturalistic conditions. Plos One 8, e59785. Kanwisher N, McDermott J, Chun MM (1997) The fusiform face area: a module
in human extrastriate cortex specialized for face perception. Journal of Neuroscience 17, 4302-4311.
Kanwisher N, Yovel G (2006) The fusiform face area: a cortical region
specialized for the perception of faces. Philosophical Transactions of the Royal Society of London B: Biological Sciences 361, 2109-2128.
Kasparson AA, Badridze J, Maximov VV (2013) Colour cues proved to be
more informative for dogs than brightness. Proceedings of the Royal Society of London B: Biological Sciences 280, 20131356.
Kendrick KM, Baldwin BA (1987) Cells in temporal cortex of conscious sheep
can respond preferentially to the sight of faces. Science 236, 448-450. Kendrick KM (1991) How the sheep's brain controls the visual recognition of
animals and humans. Journal of Animal Science 69, 5008-5016.

82
Kendrick KM, Atkins K, Hinton MR (1995) Facial and vocal discrimination in sheep. Animal Behaviour 49, 1665-1676.
King AS (1987) Physiological and Clinical Anatomy of the Domestic Mammals.
Volume 1: Central Nervous System. Oxford: Oxford University Press. Kis A, Szakadát S, Kovács E et al. (2014) Development of a non-invasive
polysomnography technique for dogs (Canis familiaris). Physiology and behavior 130, 149-156.
Kis A, Zakadát S, Gácsi M et al. (2017a) The interrelated effect of sleep and
learning in dogs (Canis familiaris); an EEG and behavioural study. Scientific reports 7, 41873.
Kis A, Hernádi A, Miklósi B et al. (2017b) The way dogs (Canis familiaris) look
at human emotional faces is modulated by oxytocin. An eye-tracking study. Frontiers in Behavioral Neuroscience, 11.
Koelsch S, Heinke W, Sammler D (2006) Auditory processing during deep
propofol sedation and recovery from unconsciousness. Clinical Neurophysiology 117, 1746-1759.
Kubinyi E, Viranyi Z, Miklósi Á (2007) Comparative social cognition: from wolf
and dog to humans. Comparative Cognition and Behavior Reviews 2, 26-46.
Kujala MV, Kujala J, Carlson S et al. (2012) Dog experts’ brains distinguish
socially relevant body postures similarly in dogs and humans. Plos One 7, e39145.
Kujala MV, Törnqvist H, Somppi S et al. (2013) Reactivity of dogs' brain
oscillations to visual stimuli measured with non-invasive electroencephalography. Plos One 8, e61818.
Lakatos G, Soproni K, Dóka, A et al. (2009) A comparative approach to
dogs’(Canis familiaris) and human infants’ comprehension of various forms of pointing gestures. Animal Cognition 12, 621-631.
Leonard TK, Blumenthal G, Gothard KM et al. (2012) How macaques view
familiarity and gaze in conspecific faces. Behavioral Neuroscience 126, 781-791.
Leopold DA, Rhodes G (2010) A comparative view of face perception. Journal
of Comparative Psychology 124, 233-251. Libenson MH (2010) Practical Approach to Electroencephalography, E-Book.
Elsevier Health Sciences. Lind O, Milton I, Andersson E et al. (2017) High visual acuity revealed in dogs.
Plos One 12, e0188557.

83
Lindsay SR (2013) Handbook of Applied Dog Behavior and Training, Adaptation and Learning (Vol. 1). Oxford: John Wiley & Sons.
Lopes da Silva FH, van Rotterdam A, Storm van Leeuwen W, Tielen AM
(1970a) Dynamic characteristics of visual evoked potentials in the dog. I. Cortical and subcortical potentials evoked by sine wave modulated light. Electroencephalography and Clinical Neurophysiology 29, 246-259.
Lopes da Silva FH, van Rotterdam A, Storm van Leeuwen W, Tielen AM
(1970b) Dynamic characteristics of visual evoked potentials in the dog. II. Beta frequency selectivity in evoked potentials and background activity. Electroencephalography and Clinical Neurophysiology 29, 260-268.
Luck SJ (2005) An introduction to the Event-related Potential Technique.
Cambridge, MA: MIT Press. Luck SJ (2012) Event-related potentials. In H. Cooper, P. M. Camic, D. L.
Long, A. T. Panter, D. Rindskopf & K. J. Sher (Eds). APA Handbook of Research Methods in Psychology, Vol. 1. Foundations, Planning, Measures, and Psychometrics, (pp. 523-546). Washington, DC: American Psychological Association.
Mangun GR (1995) Neural mechanisms of visual selective attention.
Psychophysiology 32, 4-18. Marshall-Pescini S, Passalacqua C, Barnard S et al. (2009) Agility and search
and rescue training differently affects pet dogs’ behaviour in socio-cognitive tasks. Behavioural Processes 81, 416-422.
Masland RH, Martin PR (2007) The unsolved mystery of vision. Current
Biology 17, 577-582. Matin E (1974) Saccadic suppression: a review and an analysis. Psychological
Bulletin 81, 899-917. McGreevy P, Grassi TD, Harman AM (2004) A strong correlation exists
between the distribution of retinal ganglion cells and nose length in the dog. Brain, Behavior and Evolution 63, 13-22.
McKinley J, Sambrook TD (2000) Use of human-given cues by domestic dogs
(Canis familiaris) and horses (Equus caballus). Animal Cognition 3, 13-22. McKone E, Kanwisher N, Duchaine BC (2007) Can generic expertise explain
special processing for faces? Trends in Cognitive Sciences 11, 8-15. Miklósi Á, Kubinyi E, Topál J et al. (2003) A simple reason for a big difference:
wolves do not look back at humans, but dogs do. Current Biology 13, 763-766.

84
Miklósi A, Topál J, Csányi V (2004) Comparative social cognition: what can dogs teach us? Animal Behaviour 67, 995-1004.
Miklósi Á, Soproni K (2006) A comparative analysis of animals' understanding
of the human pointing gesture. Animal Cognition 9, 81-93. Miklósi Á, Topál J. (2013) What does it take to become ‘best friends’?
Evolutionary changes in canine social competence. Trends in Cognitive Sciences 17, 287-294.
Miklósi Á (2014) Dog Behaviour, Evolution, and Cognition. Oxford: OUP
Oxford. Miller PE, Murphy CJ (1995) Vision in dogs. Journal of American Veterinary
Medical Association, 207, 1623-1634. Milgram NW, Head E, Weiner E et al. (1994) Cognitive functions and aging in
the dog: acquisition of nonspatial visual tasks. Behavioral Neuroscience 108, 57-68.
Moulton DG, Ashton EH, Eayrs JT (1960) Studies in olfactory acuity. 4.
Relative detectability of n-aliphatic acids by the dog. Animal Behaviour 8, 117-128.
Mowat FM, Petersen-Jones SM, Williamson H et al. (2008) Topographical
characterization of cone photoreceptors and the area centralis of the canine retina. Molecular Vision 14, 2518-2527.
Murphy CJ, Zadnik K, Mannis MJ (1992) Myopia and refractive error in dogs.
Investigative Ophthalmology and Visual Science 33, 2459-2463. Myowa-Yamakoshi M, Scola C, Hirata S (2012) Humans and chimpanzees
attend differently to goal directed actions. Nature Communications 3, 1-7. Müller CA, Schmitt K, Barber AL, Huber L (2015) Dogs can discriminate
emotional expressions of human faces. Current Biology, 25, 601-605. Nagasawa M, Murai K, Mogi K et al. (2011) Dogs can discriminate human
smiling faces from blank expressions. Animal Cognition 14, 525-533. Nahm FK, Perret A, Amaral DG et al. (1997) How do monkeys look at faces?
Journal of Cognitive Neuroscience 9, 611-623. Nakayama K, Goto S, Kuraoka K et al. (2005) Decrease in nasal temperature
of rhesus monkeys (Macaca mulatta) in negative emotional state. Physiology and Behavior 84, 783-790.
Neitz J, Geist T, Jacobs GH (1989) Color vision in the dog. Visual
Neuroscience 3, 119-125.

85
Niedermeyer E, da Silva FL (Eds) (2005) Electroencephalography: Basic
Principles, Clinical Applications, and Related Fields. Philadelphia: Lippincott Williams & Wilkins.
Odom JV, Bromberg NM, Dawson WW (1983) Canine visual acuity: retinal
and cortical field potentials evoked by pattern stimulation. American Journal of Physiology-Regulatory, Integrative and Comparative Physiology 245, 637-641.
O’Donnell B, Swearer J, Smith L et al. (1997) A topographic study of ERPs
elicited by visual feature discrimination. Brain Topography 10, 133-143. Ollivier FJ, Samuelson DA, Brooks DE et al. (2004) Comparative morphology
of the tapetum lucidum (among selected species). Veterinary Ophthalmology 7, 11-22.
Osthaus B, Lea SE, Slater AM (2005) Dogs (Canis lupus familiaris) fail to show
understanding of means-end connections in a string-pulling task. Animal Cognition 8, 37-47.
Otten LJ, Rugg MD (2005) Interpreting event-related brain potentials. In T. C.
Handy (ed) Event-related Potentials. A Methods Handbook, (pp 3-16). Cambridge: The MIT Press.
Park SY, Bacelar CE, Holmqvist K (2020) Dog eye movements are slower than
human eye movements. Journal of Eye Movement Research 12, 4. Pascalis O, Bachevalier J (1998) Face recognition in primates: a cross-
species study. Behavioural Processes 43, 87-96. Passalacqua C, Marshall-Pescini S, Barnard S et al. (2011) Human-directed
gazing behaviour in puppies and adult dogs, Canis lupus familiaris. Animal Behaviour 82, 1043-1050.
Paukner A, Bower S, Simpson EA et al. (2013) Sensitivity to first-order
relations of facial elements in infant rhesus macaques. Infant and Child Development 22, 320-330.
Peichl L (1991) Catecholaminergic amacrine cells in the dog and wolf retina.
Visual Neuroscience 7, 575-587. Peichl L (1992) Topography of ganglion cells in the dog and wolf retina.
Journal of Comparative Neurology 324, 603-620. Pellegrino FC and Sica RE (2004) Canine electroencephalographic recording
technique: findings in normal and epileptic dogs. Clinical Neurophysiology 115, 477-487.

86
Penn DC, Povinelli DJ (2007) On the lack of evidence that non-human animals possess anything remotely resembling a ‘theory of mind’. Philosophical Transactions of the Royal Society B: Biological Sciences 362, 731-744.
Perrett DI, Rolls ET, Caan W (1982) Visual neurones responsive to faces in
the monkey temporal cortex. Experimental Brain Research 47, 329-342. Perretta G (2009) Non-human primate models in neuroscience research.
Scandinavian Journal of Laboratory Animal Sciences 36, 77-85. Petrazzini MEM, Wynne CD (2016) What counts for dogs (Canis lupus
familiaris) in a quantity discrimination task? Behavioural Processes 122, 90-97.
Pineda JA, Sebestyen G, Nava C (1994) Face recognition as a function of
social attention in non-human primates: an ERP study. Cognitive Brain Research 2, 1-12.
Polgárdi R, Topál J, Csányi V (2000) Intentional behaviour in dog-human
communication: an experimental analysis of “showing” behaviour in the dog. Animal Cognition 3, 159-166.
Pongrácz P, Ujvári V, Faragó T et al. (2017). Do you see what I see? The
difference between dog and human visual perception may affect the outcome of experiments. Behavioural processes 140, 53-60.
Premack D, Woodruff G (1978) Does the chimpanzee have a theory of mind?
Behavioral and Brain Sciences 1, 515-526. Pretterer G, Bubna-Littitz H, Windischbauer G et al. (2004) Brightness
discrimination in the dog. Journal of Vision 4, 241-249. Preuss TM (1995) Do rats have prefrontal cortex? The Rose-Woolsey-Akert
program reconsidered. Journal of Cognitive Neuroscience 7, 1-24. Puce A, Allison T, Gore JC et al. (1995) Face-sensitive regions in human
extrastriate cortex studied by functional MRI. Journal of Neurophysiology 74, 1192-1199.
Plöchl M, Ossandón JP, König P (2012) Combining EEG and eye tracking:
identification, characterization, and correction of eye movement artifacts in electroencephalographic data. Frontiers in Human Neuroscience 6, 278.
Racca A, Amadei E, Ligout S et al. (2010) Discrimination of human and dog
faces and inversion responses in domestic dogs (Canis familiaris). Animal Cognition 13, 525-533.
Racca A, Guo K, Meints K et al. (2012) Reading faces: differential lateral gaze
bias in processing canine and human facial expressions in dogs and 4-year-old children. Plos One 7, e36076.
87
Range F, Aust U, Steurer M et al. (2008) Visual categorization of natural stimuli
by domestic dogs. Animal Cognition 11, 339-347. Range F, Hentrup M, Virányi Z (2011) Dogs are able to solve a means-end
task. Animal Cognition 14, 575-583. Rayner K (1998) Eye movements in reading and information processing: 20
years of research. Psychological Bulletin 124, 372-422. Reichert H (1992) Introduction to Neurobiology. Stuttgart: Georg Thieme
Verlag. Reid J, Nolan AM, Scott EM (2018) Measuring pain in dogs and cats using
structured behavioural observation. The Veterinary Journal 236, 72-79. Reid PJ (2009) Adapting to the human world: dogs’ responsiveness to our
social cues. Behavioural Processes 80, 325-333. Roberts T, McGreevy P, Valenzuela M (2010) Human induced rotation and
reorganization of the brain of domestic dogs. Plos One 5, e11946. Rolls ET, Baylis GC (1986) Size and contrast have only small effects on the
responses to faces of neurons in the cortex of the superior temporal sulcus of the monkey. Experimental Brain Research, 65, 38-48.
Rosa Salva O, Mayer U, Vallortigara G (2015) Roots of a social brain:
developmental models of emerging animacy-detection mechanisms. Neuroscience and Biobehavioral Reviews 50, 150-168.
Roth G, Dicke U (2005) Evolution of the brain and intelligence. Trends in
Cognitive Sciences 9, 250-257. Rossi A, Smedema D, Parada FJ et al. (2014) Visual attention in dogs and the
evolution of non-verbal communication. In Domestic Dog: Cognition and Behavior, (pp. 133-154). Berlin: Springer Verlag.
Schuck-Paim C, Borsari A, Ottoni EB (2009) Means to an end: Neotropical
parrots manage to pull strings to meet their goals. Animal Cognition 12, 287-301.
Schwarz JS, Sridharan D, Knudsen EI (2013) Magnetic tracking of eye
position in freely behaving chickens. Frontiers in Systems Neuroscience 7, 91.
Seed A, Tomasello M (2010) Primate cognition. Topics in Cognitive Science
2, 407-419.

88
Shearin AL, Ostrander EA (2010) Leading the way: canine models of genomics and disease. Disease Models and Mechanisms 3, 27-34.
Shettleworth SJ (2010) Cognition, Evolution, and Behavior. New York: Oxford
University Press. Sicard K, Shen Q, Brevard ME et al. (2003) Regional cerebral blood flow and
BOLD responses in conscious and anesthetized rats under basal and hypercapnic conditions: implications for functional MRI studies. Journal of Cerebral Blood Flow and Metabolism 23, 472-481.
Siniscalchi M, d'Ingeo S, Fornelli S et al. (2017) Are dogs red–green colour
blind? Royal Society Open Science 4, 170869. Sjaastad OV, Sand O, Hove K (2010) Physiology of Domestic Animals. Oslo:
Scandinavian Veterinary Press. Somppi S, Törnqvist H, Hänninen L et al. (2014) How dogs scan familiar and
inverted faces: an eye movement study. Animal Cognition 17, 793-803. Somppi S, Törnqvist H, Kujala MV et al. (2016) Dogs evaluate threatening
facial expressions by their biological validity-evidence from gazing patterns. Plos One 11, e0143047.
Somppi S, Törnqvist H, Topál J (2017) Nasal oxytocin treatment biases dogs’
visual attention and emotional response toward positive human facial expressions. Frontiers in Psychology 8, 1854.
Soproni K, Miklósi Á, Topál J et al. (2002) Dogs' (Canis familiaris)
responsiveness to human pointing gestures. Journal of Comparative Psychology 116, 27-34.
Stevens JR (2010) The challenges of understanding animal minds. Frontiers
in Psychology 1, 203. Stewart M, Webster JR, Schaefer AL et al. (2005) Infrared thermography as a
non-invasive tool to study animal welfare. Animal Welfare 14, 319-325. Storm van Leeuwen W, Lopes da Silva FH, Kamp A (1975) Evoked responses.
Part A. In P. Buser (ed) Handbook of Electroencephalography and Clinical Neurophysiology. Vol 8. Amsterdam: Elsevier.
Tanaka T, Ikeuchi E, Mitani S et al. (2000a) Studies on the visual acuity of
dogs using shape discrimination learning. Nihon Chikusan Gakkaiho 71, 614-620.
Tanaka T, Watanabe T, Eguchi Y et al. (2000b) Color discrimination in dogs.
Nihon Chikusan Gakkaiho 71, 300-304.

89
Tapp PD, Siwak CT, Head E et al. (2004) Concept abstraction in the aging dog: development of a protocol using successive discrimination and size concept tasks. Behavioural Brain Research 153, 199-210.
Téglás E, Gergely A, Kupán K et al. (2012) Dogs' gaze following is tuned to
human communicative signals. Current Biology 22, 209-212. Teplan M (2002) Fundamentals of EEG measurement. Measurement Science
Review 2, 1-11. Thalmann O, Shapiro B, Cui P et al. (2013) Complete mitochondrial genomes
of ancient canids suggest a European origin of domestic dogs. Science 342, 871-874.
Thompkins AM, Ramaiahgari B, Zhao S et al. (2018) Separate brain areas for
processing human and dog faces as revealed by awake fMRI in dogs (Canis familiaris). Learning and Behavior 46, 561-573.
Thorpe SJ, Gegenfurtner KR, Fabre-Thorpe M et al. (2001) Detection of
animals in natural images using far peripheral vision. European Journal of Neuroscience 14, 869-876.
Topál J, Miklósi Á, Csányi V (1997) Dog-human relationship affects problem
solving behavior in the dog. Anthrozoös 10, 214-224. Tsao DY, Freiwald WA, Tootell RB et al. (2006) A cortical region consisting
entirely of face-selective cells. Science 311, 670-674. Turcsán B, Tátrai K, Petró E et al. (2020). Comparison of behavior and genetic
structure in populations of family and kenneled beagles. Frontiers in Veterinary Science 7, 183.
Tusa RJ, Palmer LA (1980) Retinotopic organization of areas 20 and 21 in the
cat. Journal of Comparative Neurology 193, 147-164. Udell MA, Wynne CD (2008) A review of domestic dogs'(Canis familiaris)
human-like behaviors: or why behavior analysts should stop worrying and love their dogs. Journal of the Experimental Analysis of Behavior 89, 247-261.
Udell MA, Dorey NR, Wynne CD (2010) What did domestication do to dogs?
A new account of dogs' sensitivity to human actions. Biological Reviews 85, 327-345.
Ueki M, Mies G, Hossmann KA (1992) Effect of alpha-chloralose, halothane,
pentobarbital and nitrous oxide anesthesia on metabolic coupling in somatosensory cortex of rat. Acta Anaesthesiologica Scandinavica 36, 318-322.

90
Uemura EE (2015) Fundamentals of Canine Neuroanatomy and Neurophysiology. Oxford: John Wiley & Sons.
Uemura EE (2015b) Section I: Neurophysiology, Visual system. In H.H.
Erickson, J.P. Goff, E.E. Uemura (eds). Dukes' Physiology of Domestic Animals, (pp.57-67). Oxford: John Wiley & Sons.
Uttal WR, Smith P (1968) Recognition of alphabetic characters during
voluntary eye movements. Perception and Psychophysics 3, 257-264. Vainio O (2012) Translational animal models using veterinary patients – An
example of canine osteoarthritis (OA). Scandinavian Journal of Pain 3, 84-89.
Vainionpää M (2014) Thermographic Imaging in Cats and Dogs: Usability as
a Clinical Method. PhD thesis, University of Helsinki. Vandamme TF (2014) Use of rodents as models of human diseases. Journal
of Pharmacy and Bioallied Sciences 6, 2-9. Van der Marel EH, Dagnelie G, Spekreijse H (1984) Subdurally recorded
pattern and luminance EPs in the alert rhesus monkey. Clinical Neurophysiology 57, 354-368.
Van Essen DC (1979) Visual areas of the mammalian cerebral cortex. Annual
Review of Neuroscience 2, 227-261. Virányi Z, Topál J, Miklósi Á et al. (2006) A nonverbal test of knowledge
attribution: a comparative study on dogs and children. Animal Cognition 9, 13-26.
Wallace DJ, Greenberg DS, Sawinski J et al. (2013). Rats maintain an
overhead binocular field at the expense of constant fusion. Nature 498, 65-69.
Walls GL (1963) The Vertebrate Eye and Its Adaptive Radiation. New York:
Hafner Publishing Company. Wayne RK, Ostrander EA (2007) Lessons learned from the dog genome.
Trends in Genetics 23, 557-567. Wijers AA, Lange JJ, Mulder G et al. (1997) An ERP study of visual spatial
attention and letter target detection for isoluminant and nonisoluminant stimuli. Psychophysiology 34, 553-565.
Williams FJ, Mills DS, Guo K (2011) Development of a head-mounted, eye-
tracking system for dogs. Journal of Neuroscience Methods 194, 259-265.

91
Willis CK, Quinn RP, McDonell WM et al. (2001) Functional MRI activity in the thalamus and occipital cortex of anesthetized dogs induced by monocular and binocular stimulation. Canadian Journal of Veterinary Research 65, 188-195.
Wobber V, Hare B, Koler-Matznick J et al. (2009) Breed differences in
domestic dogs’ (Canis familiaris) comprehension of human communicative signals. Interaction Studies 10, 206-224.
Woodman GF, Kang MS, Rossi AF et al. (2007) Nonhuman primate event-
related potentials indexing covert shifts of attention. Proceedings of the National Academy of Sciences 104, 15111-15116.
Wróbel A (2000) Beta activity: a carrier for visual attention. Acta
Neurobiologiae Experimentalis, 60, 247-260. Yang G-Z, Dempere-Marco L, Hu X-P et al. (2002) Visual search:
Psychophysical models and practical applications. Image and Vision Computing 20, 291-305.
Yarbus AL (1967) Eye Movements and Vision. New York: Plenum.
