canned tuna in the middle east: a market in turmoil?infofish.org/v2/images/ptf2017/slide/day 2am - 6...
TRANSCRIPT

Canned Tuna in the Middle East: A market in turmoil? September 2017
Arnab Sengupta
Phoenix Commodities

Is Middle East an interesting market for canned tuna?
Parameters processors should take into account while entering ME
What should be done to gain more market share
This document aims to answer the following:
Key Questions
1
2
3
Table of Contents
Market Entry Opportunities
Communication Review
Tuna Market Overview
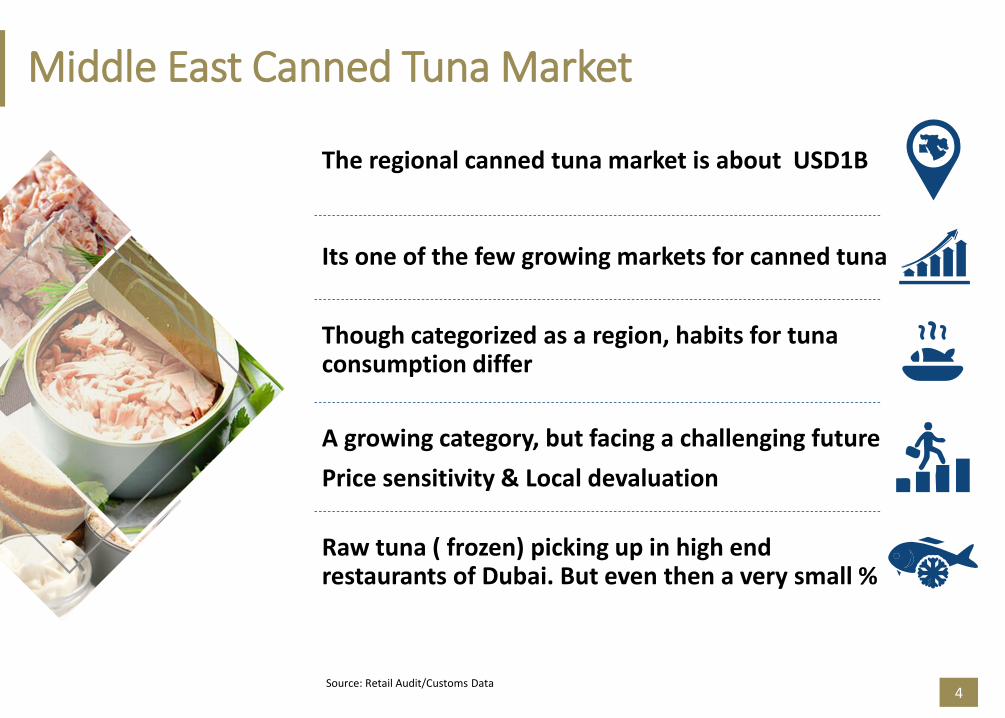
The regional canned tuna market is about USD1B
Its one of the few growing markets for canned tuna
A growing category, but facing a challenging future
Price sensitivity & Local devaluation
Raw tuna ( frozen) picking up in high end restaurants of Dubai. But even then a very small %
Though categorized as a region, habits for tuna consumption differ
4Source: Retail Audit/Customs Data
Middle East Canned Tuna Market
Middle East Tuna Market: Overview
5
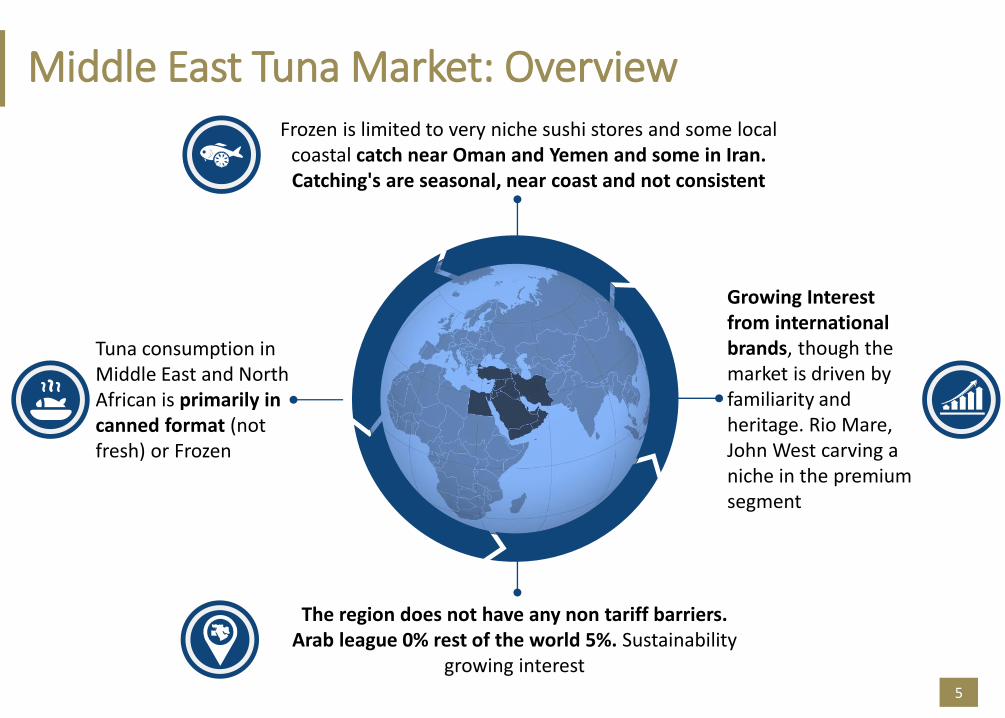
Frozen is limited to very niche sushi stores and some local coastal catch near Oman and Yemen and some in Iran. Catching's are seasonal, near coast and not consistent
Tuna consumption in Middle East and North African is primarily in canned format (not fresh) or Frozen
The region does not have any non tariff barriers. Arab league 0% rest of the world 5%. Sustainability
growing interest
Growing Interest from international brands, though the market is driven by familiarity and heritage. Rio Mare, John West carving a niche in the premium segment
Market Sizes – Canned Tuna
6
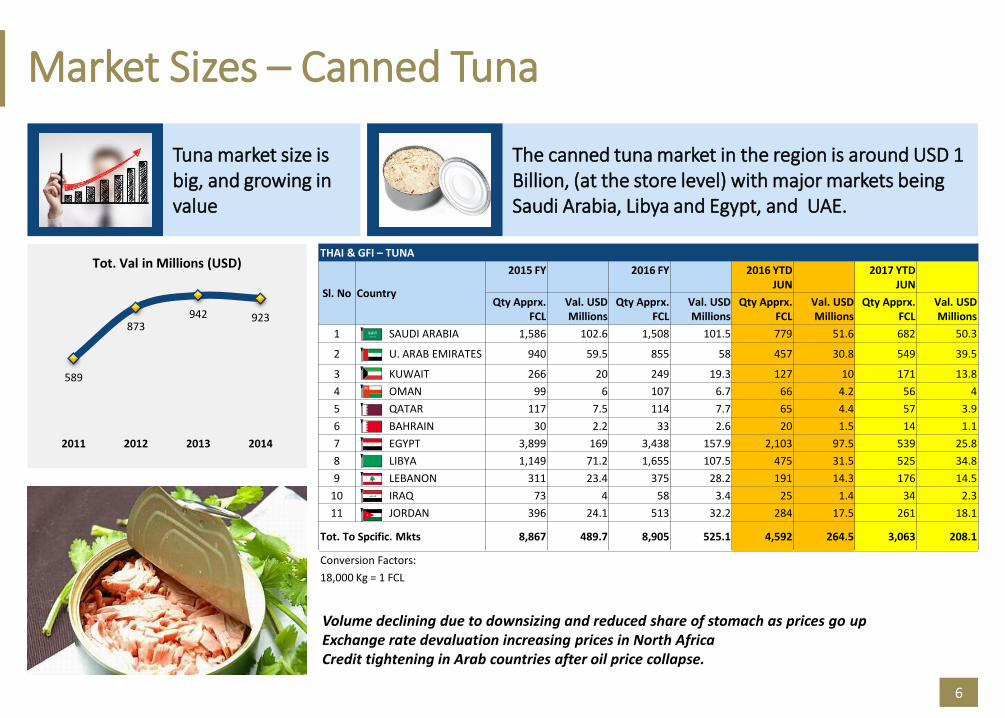
Tuna market size is big, and growing in value
The canned tuna market in the region is around USD 1 Billion, (at the store level) with major markets being Saudi Arabia, Libya and Egypt, and UAE.
589
873942 923
2011 2012 2013 2014
Tot. Val in Millions (USD)THAI & GFI – TUNA
Sl. No Country
2015 FY 2016 FY 2016 YTD JUN
2017 YTD JUN
Qty Apprx. FCL
Val. USD Millions
Qty Apprx. FCL
Val. USDMillions
Qty Apprx. FCL
Val. USDMillions
Qty Apprx. FCL
Val. USDMillions
1 SAUDI ARABIA 1,586 102.6 1,508 101.5 779 51.6 682 50.3
2 U. ARAB EMIRATES 940 59.5 855 58 457 30.8 549 39.5
3 KUWAIT 266 20 249 19.3 127 10 171 13.8
4 OMAN 99 6 107 6.7 66 4.2 56 4
5 QATAR 117 7.5 114 7.7 65 4.4 57 3.9
6 BAHRAIN 30 2.2 33 2.6 20 1.5 14 1.1
7 EGYPT 3,899 169 3,438 157.9 2,103 97.5 539 25.8
8 LIBYA 1,149 71.2 1,655 107.5 475 31.5 525 34.8
9 LEBANON 311 23.4 375 28.2 191 14.3 176 14.5
10 IRAQ 73 4 58 3.4 25 1.4 34 2.3
11 JORDAN 396 24.1 513 32.2 284 17.5 261 18.1
Tot. To Spcific. Mkts 8,867 489.7 8,905 525.1 4,592 264.5 3,063 208.1
Conversion Factors:
18,000 Kg = 1 FCL
Volume declining due to downsizing and reduced share of stomach as prices go upExchange rate devaluation increasing prices in North AfricaCredit tightening in Arab countries after oil price collapse.
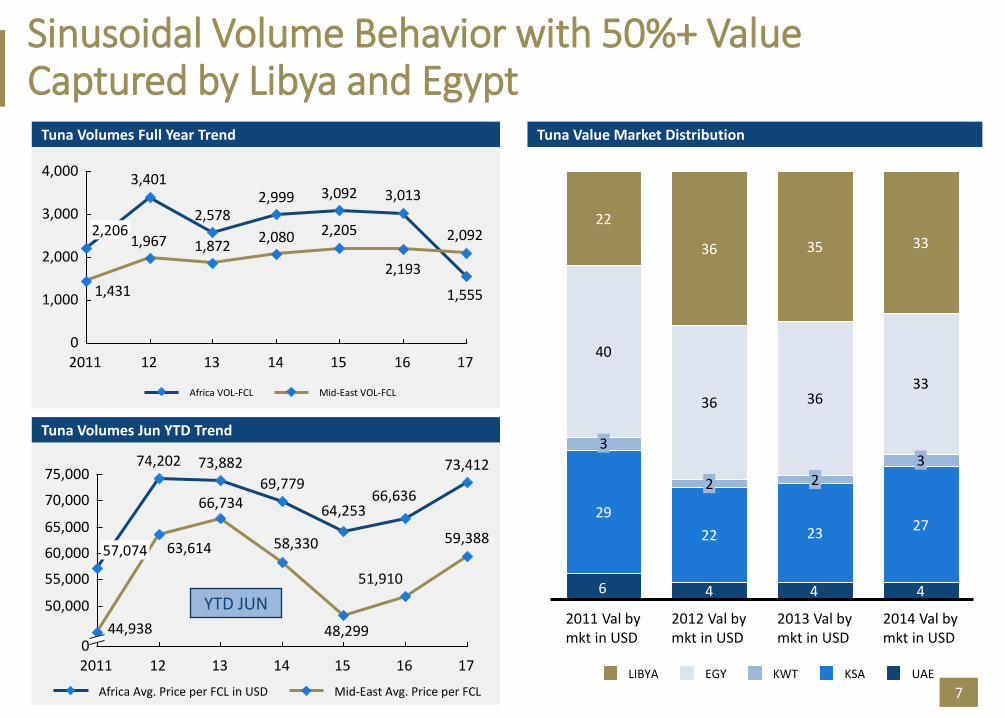
Tuna Volumes Jun YTD Trend
Sinusoidal Volume Behavior with 50%+ Value Captured by Libya and Egypt
7
Tuna Volumes Full Year Trend Tuna Value Market Distribution
4 4
29
22 23 27
40
36 3633
22
36 35 33
46
32
2013 Val by mkt in USD
3
2014 Val by mkt in USD
2
2012 Val by mkt in USD
2011 Val by mkt in USD
KSAEGY UAEKWTLIBYA
3,0133,0922,9992,578
3,401
1,555
2,0922,2052,0801,8721,967
2,193
1,431
2,000
4,000
3,000
0
1,000
16132011 1714
2,206
1512
Africa VOL-FCL Mid-East VOL-FCL
75,000
55,000
50,000
65,000
70,000
60,000
0
66,636
17
73,412
51,910
15
58,330
69,779
64,25366,734
73,882
63,614
2011
57,074
44,938
16
48,299
14
74,202
12 13
59,388
Mid-East Avg. Price per FCLAfrica Avg. Price per FCL in USD
YTD JUN
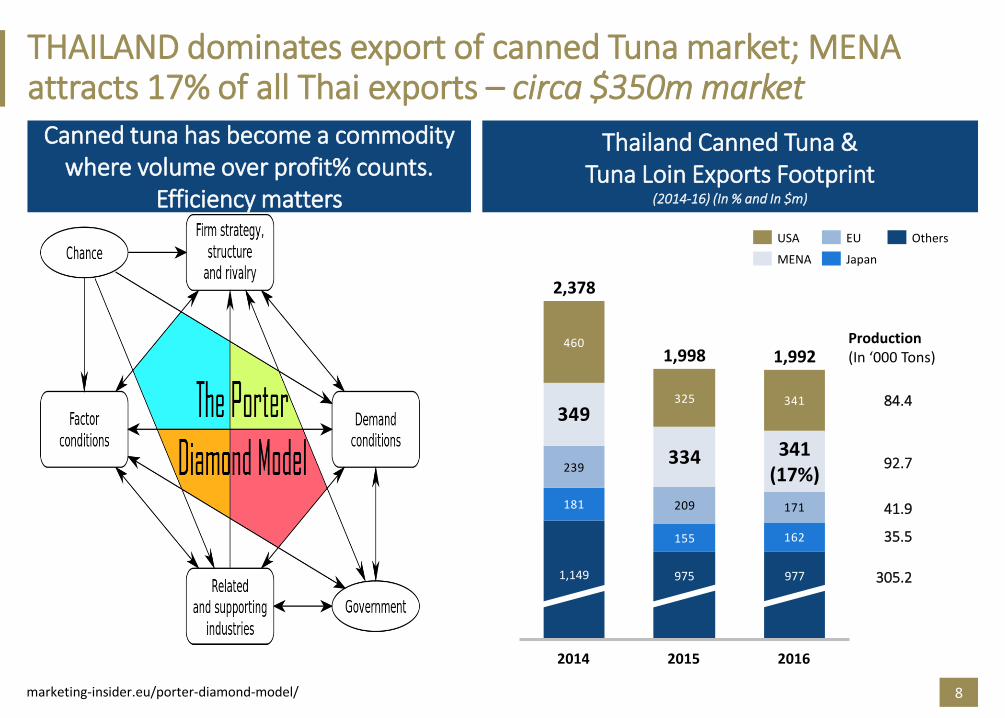
THAILAND dominates export of canned Tuna market; MENA attracts 17% of all Thai exports – circa $350m market
8
Thailand Canned Tuna & Tuna Loin Exports Footprint
(2014-16) (In % and In $m)
181
155 162
239
209 171
460
325 341
334
349
2016
1,992
341(17%)
977
2015
2,378
1,998
1,149
2014
975
EUUSA Others
JapanMENA
Production(In ‘000 Tons)
84.4
92.7
41.9
35.5
305.2
Canned tuna has become a commodity where volume over profit% counts.
Efficiency matters
marketing-insider.eu/porter-diamond-model/
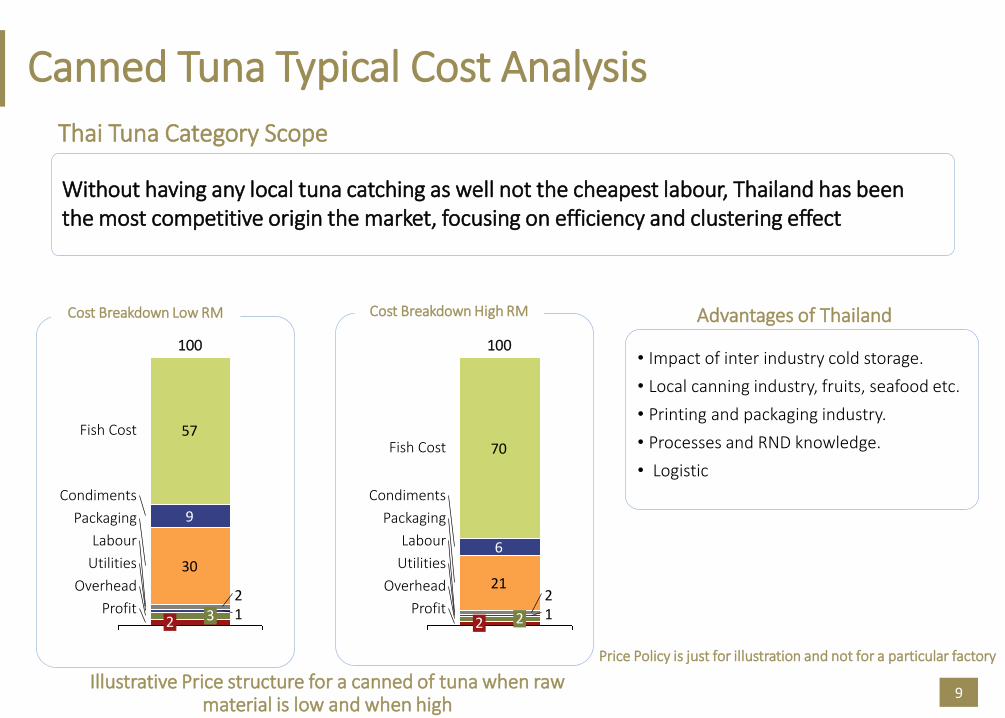
Canned Tuna Typical Cost Analysis
9
Thai Tuna Category Scope
Cost Breakdown High RM
12
21
6
70Fish Cost
Utilities
Condiments
Profit
Overhead
Packaging
Labour
100
2 2
Advantages of Thailand
• Impact of inter industry cold storage.
• Local canning industry, fruits, seafood etc.
• Printing and packaging industry.
• Processes and RND knowledge.
• Logistic
Price Policy is just for illustration and not for a particular factory
Cost Breakdown Low RM
12
30
9
57Fish Cost
Utilities
Condiments
Profit
Overhead
Packaging
Labour
100
2 3
Illustrative Price structure for a canned of tuna when raw material is low and when high
Without having any local tuna catching as well not the cheapest labour, Thailand has been the most competitive origin the market, focusing on efficiency and clustering effect
10
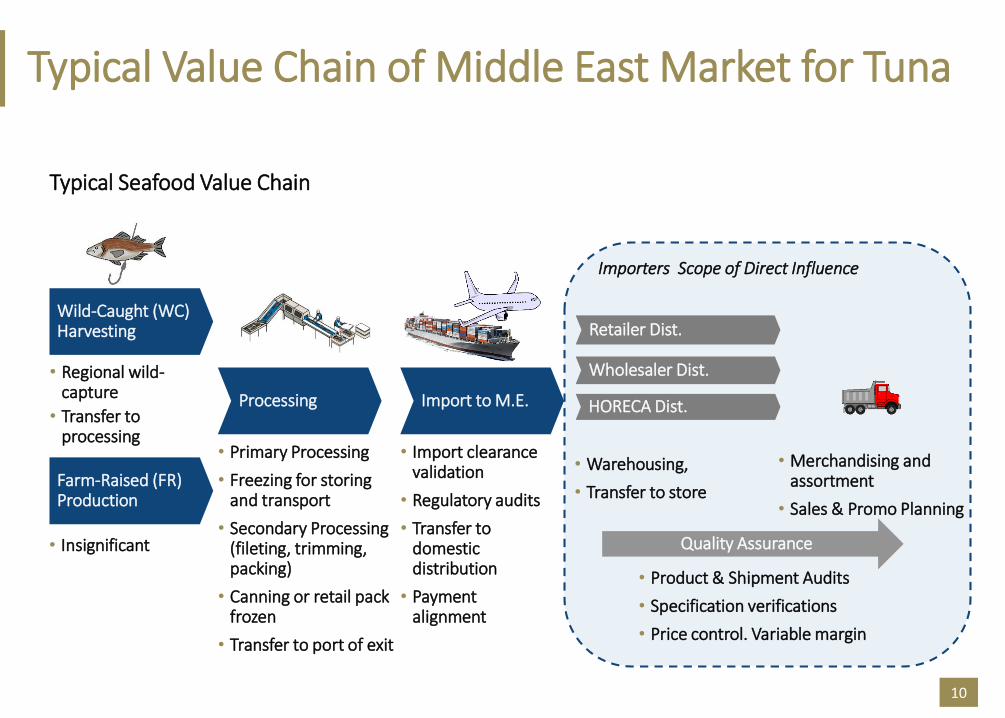
Typical Value Chain of Middle East Market for Tuna
Typical Seafood Value Chain
Wild-Caught (WC) Harvesting
Processing
Farm-Raised (FR) Production
Import to M.E.
Retailer Dist.
• Primary Processing
• Freezing for storing and transport
• Secondary Processing (fileting, trimming, packing)
• Canning or retail pack frozen
• Transfer to port of exit
• Import clearance validation
• Regulatory audits
• Transfer to domestic distribution
• Payment alignment
• Merchandising and assortment
• Sales & Promo Planning
• Warehousing,
• Transfer to store
• Regional wild-capture
• Transfer to processing
• Insignificant
Importers Scope of Direct Influence
Wholesaler Dist.
HORECA Dist.
Quality Assurance
• Product & Shipment Audits
• Specification verifications
• Price control. Variable margin

Within MENA, KSA & Egypt Captures 55-60% of Canned Tuna Market
11
ALL Canned Tuna Exports Footprint(2014-16) (In % and In $m)
510
17%
35%
15%
490
21%
5%
12%
5%
2%4%
2014
31%
24%
7%4%
494
10%
32%
26%
5%
15%
3%
4%
4%
24%
22%
3%
2013
11%
5%
588
2011
330
5%
1%
4%
2012
21%
20%
8%5%
31%
37%
1%
2015
11%
2%
Qatar
Egypt
Kuwait
Oman
KSA
UAE
Iraq
Libya
Jordan
Lebanon
Bahrain

KSA – Market Overview
12
Market Size+11% on volume +16% on value
Total Market (KSA) MAT'15 MAT'14 Diff-15/14
Sales Volume 1000KGS 25046.9 22878.7 9%
Sales Value SR 100000 8932.7 7727.1 16%
Solid: Biggest segment (68.4%), yet declining (-2.6ppts).
Chunks: Fastest growing (+1.1ppts), reaching 11%.
Flakes: Grew (+0.4%) to reach 11.9%.
Total MarketVOLUME SHARE
DiffVOLUME SHARE
DiffYTD'15 YTD'14
CHUNK 11 1.1 9 1
FLAKES 11.9 0.4 9.1 0.3
SOLID 68.4 -2.6 69.2 -2.7
READY TO EAT 2.9 0.5 5.4 0.7
SLICES 5.7 0.6 7.3 0.6

Egypt – Market Overview
Market Size-8.5% on volume -5.5% on value
Total Market MAT'15 MAT'14 Diff-15/14
Sales Volume 1000KGS 61901 72590 -8.5%
Sales Value LE 100000 25770 24655 +5.5%
Flakes: Biggest segment (53.2)% declined a few points (2.3%)
Solid: Growing segment (13.7%), growing
Chunks: Fastest growing (+1.1ppts), reaching 30.8%
Egypt currency has devalued ( 8.5 to 18) pushing the
prices in the market
13

Solid: Remains to be the largest cut at 54.9% (flat vs. YA), followed by
Chunks: at 18.8% (also flat), then
Flakes: at 16.2% (+0.4ppts)
UAE – Market Overview
14
Market Size+6% (volume and value)
Total Market MAT'15 MAT'14 Percentage Growth
Sales Volume 1000 KGS 3781.9 3554.5 6%
Sales Value 1000 AED 144165 132041 6%
Total MarketVOLUME SHARE
DiffYTD'15 YTD'14
SOLID 54.9 55.0 -0.1
CHUNK 19.8 18.7 0.0
FLAKES 17.2 15.8 1.4
READY TO EAT 7.9 7.6 0.3
SLICES 1.4 2.8 -0.4
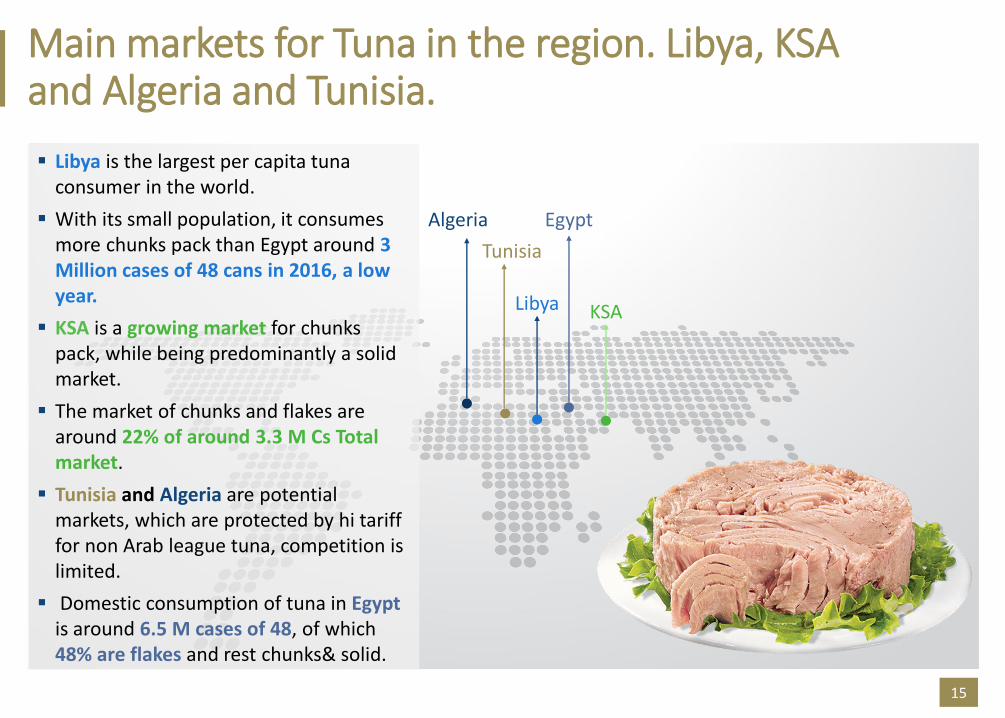
Main markets for Tuna in the region. Libya, KSA and Algeria and Tunisia.
15
Libya is the largest per capita tuna consumer in the world.
With its small population, it consumes more chunks pack than Egypt around 3 Million cases of 48 cans in 2016, a low year.
KSA is a growing market for chunks pack, while being predominantly a solid market.
The market of chunks and flakes are around 22% of around 3.3 M Cs Total market.
Tunisia and Algeria are potential markets, which are protected by hi tariff for non Arab league tuna, competition is limited.
Domestic consumption of tuna in Egyptis around 6.5 M cases of 48, of which 48% are flakes and rest chunks& solid.
Tunisia
Libya KSA
Algeria Egypt

16
Opportunities in the Middle East Market
Seafood Category Overview
Sourcing Process
• Tuna pricing is driven by commodity index hence spot purchased in favorable periods
• A mix of and spot buy are popular. Usually contacts are in 20 fcl or 2 fcl lots
ME Internal Demand
• Market demand's cheap source for protein. Tuna satisfy key criteria
• Devaluation of regional currencies in North Africa.
• Demand of tuna at the HORECA level
• Demand falling, lead by North Africa
Market Outlook
• Canned tuna market in Middle East has seen more than 15% dip this year due to currency.
• Frozen Fresh tuna demand increasing in GCC.
• Pet food market in UAE 65% of human food
Benefits Potential
Key Strategic Initiatives
~12-15 M USD
Low hanging fruits
Restaurant Items
• Focus on Horeca needs. Ready to serve sushi, pouch tuna, opportunity to consolidate
Pet Food
• Hit directly, high margin category. Allowing for efficiency gaps
Tuna
• Efficiency of production, work on ancillary business. Packaging and printing technology.
• Catering size opportunities

Consumer Insights

Tuna Category is Driven by Familiarity Mainly by BRAND CONSIDERATION Driving BRAND EQUITYEquity Drivers For Tuna
Sources of
Brand Equity
Industry Norms
Awareness: 30% Consideration: 10% Associations: 60%
Awareness 11%
Consideration 64%
Association 25%Based on FMCG & Retail categories
Importance of Association Factors
LIGHT & HIGH QUALITY
HEALTHY & PROVIDES VALUE
AESTHETICS MEAT QUALITIES
8% 8% 7% 2%
18Source: Winning Brands Categories

2% 2%14%
25% 27%28%
2%1% 3%14%
34%21%
27%
1% 3%17%
39%
17%24%
0%0% 0%
18%
36%23% 22%
0%0% 1%14%
42%
14%
29%
0%
Once or more a day 4 - 6 Times a week 2 - 3 Times a week Once a week Bi-Weekly Once a month Less than once amonth
W4 '14 W1 '15 W2 '15 W3 '15 W4 '15
Purchase & consumption frequency remain stable, so has the quantities purchased in each type of shopping trip WITH AN INCREASE IN QUANTITY PURCHASES IN THE TOP UP SHOPPING TRIP THIS QUARTER
19
CONSUMPTION FREQUENCYWEEKLY MEAN: 1.8 times
3% 6%
44% 41%
4%2% 4%
46% 46%
2%1% 6%
42% 49%
2%0% 2%
49% 47%
1%0% 2%
45% 51%
1%
Once or more a day 4 - 6 Times a week 2 - 3 Times a week Once a week Bi-Weekly
W4 '14 W1 '15 W2 '15 W3 '15 W4 '15
Cans of Tuna Bought Main Shopping Trip
Cans of Tuna BoughtTop Up Shopping Trip
Average 5 cans 5 cans
PURCHASE FREQUENCYWEEKLY MEAN: 1 time
Base: W3 ‘14: 201, W4 ‘14: 206, W1 ’15: 192, W2’ 15: 190, W3 ‘15:209, W4 ‘15:210Source: Q37ab, Q35ab

Consumer Perceptions on tuna
21
A protein within reach
It has a ritual and special way of
eating
Its valuable… its fish
It tastes good, and everyone eats
it in their special way
With some additions it
becomes a main meal
Perceived to be a VALUABLE variant of fish protein and meat that is affordable
It is a main and regular meal, that they happily arrange the appropriate setting for, to strengthen their bond with the product and create a pleasant eating experience.
Tuna is very versatile, and family members accustom it to their taste preferences using simple ingredients
The main trigger of purchase is the eating experience and its affordability, plus convenience and time saving

Who consumes it?
All Family members: Each one has his/her taste preferences, but everyone consumes tuna either alone, or with the family as a family dish
Who prepares it?
Usually, Mothers prepare tuna for the whole family. However, at occasions when family members eat it alone/quickly/as snack, they may prepare it for themselves.
When do they eat it?
Tuna can be eaten at lunch or dinner, or as a late snack. It can be put as a main dish during lunch/dinner, or as part of a dish (pasta, salad).
C1 and C2 class eat tuna in lunch, dinner, and late night snack.
B class consumers mainly consume Tuna for dinner (with other small dishes), and serve it at lunch only when it is an ingredient in another dish (pasta/salad).
Consumer – Consumption habits
23

Consumer – Purchase habits
24
How often?
High consumption families (C1 and C2): 3 times/week.
Lower consumption (B-class): 1-2 times/week.
How many cans opened per serving?
Depending on the occasion, the number of
cans varies. Generally, ONE can per family
member is the NORM.
When tuna is served as a main dish along with other sides/additives, 3 cans can be enough for a family of 4-5 members.

Communication Review

Communication: Tuna middle East
26
Merchandising support growing
ATL in certain premium brands,
category lead by Rio Mare
Internet based tools are gaining
popularity
Mostly promotions,
with secondary display

Activations
27
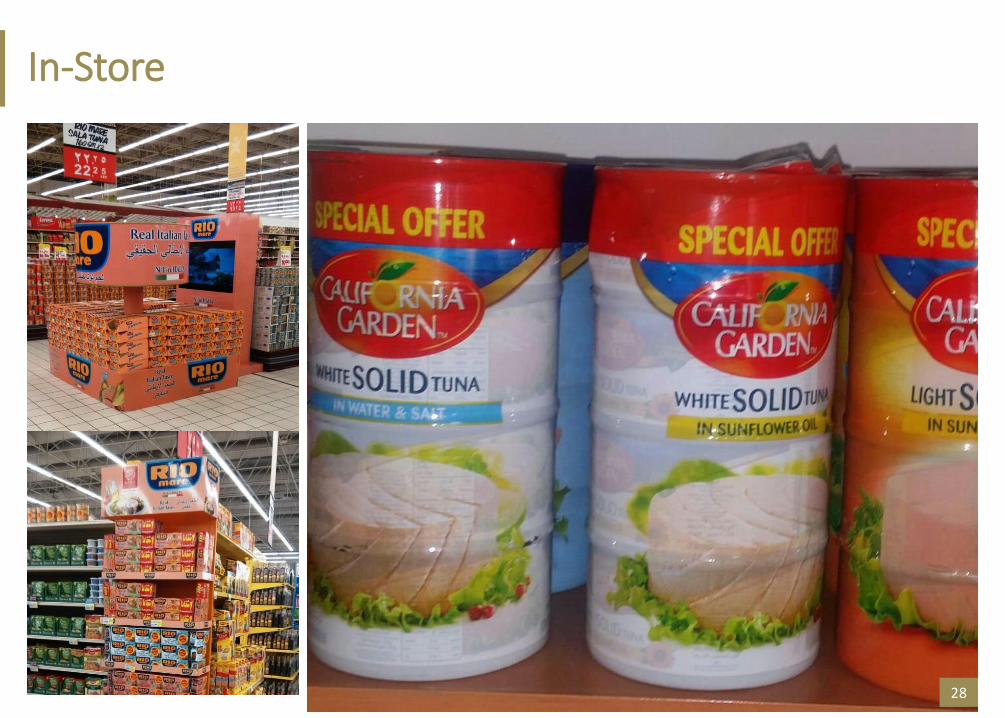
In-Store
28
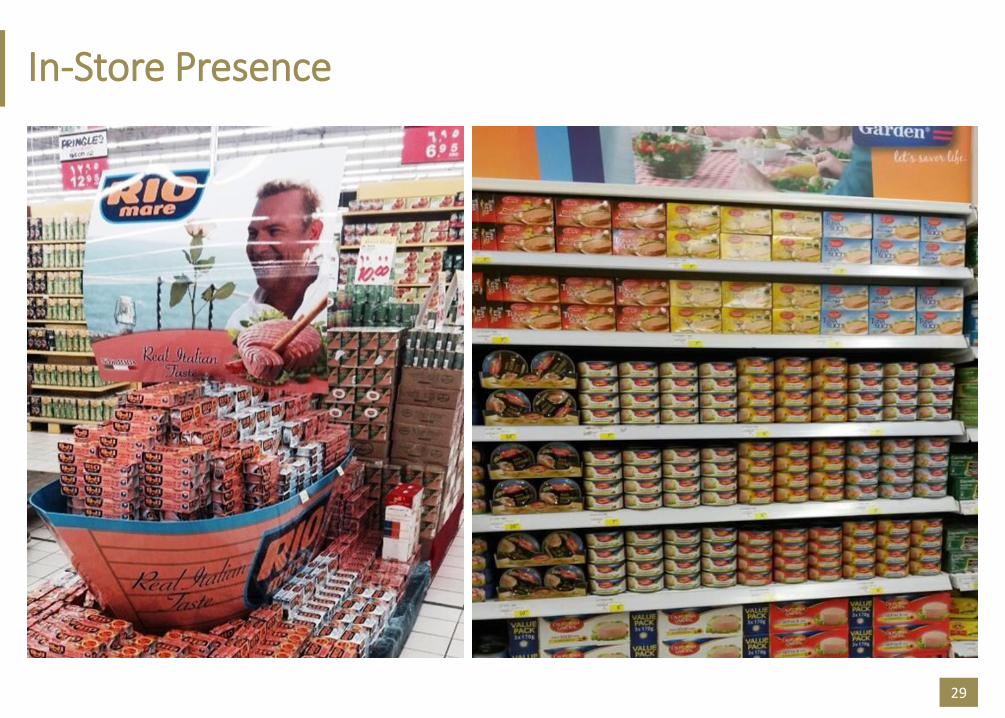
In-Store Presence
29

From the Internet
Communication review
30
Going beyond display campaigns few tuna brands are building microsites on popular portals that included games/competitions as well as content sharing
and knowledge sharing about tuna

Digital
31
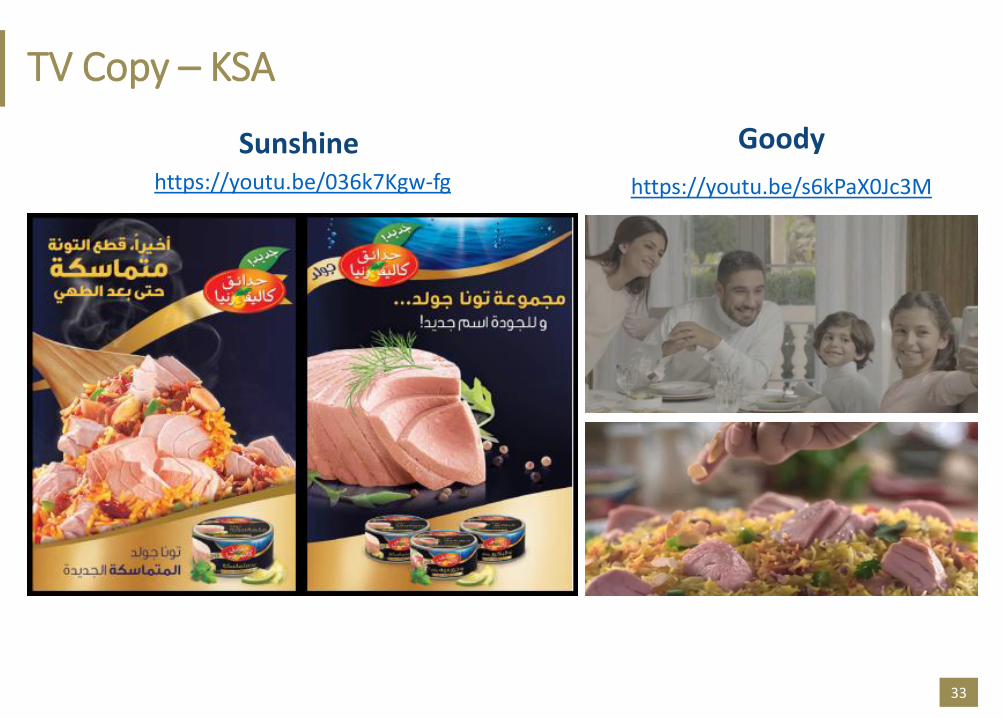
TV Copy – KSA
33
https://youtu.be/036k7Kgw-fg
Sunshine
https://youtu.be/s6kPaX0Jc3M
Goody
Recommendation
34Source: Ipsos Pan Arab-GCC 2012- 2013
• Middle East is big enough and easy enough to enter to make it a market of focus, for new origin for canned tuna. No preapproval needed. Basic Cordex specs followed
• All variants/ quality finds a market here
• Price competitiveness being paramount in large part of the market, current high price of tuna gives a good opportunity to beat Thailand advantage of clustering
• Regional semi-govt. groups could market, freshness of regional tuna, sustainability, at the grass route consumer level, while demonstrating the quality and texture of the product. ( eg. Australia Meat Work at retail level)
• Focus on high value & profitable pet food and frozen fish market: Focus on a niche or a single market and create success
Thank [email protected]