cap water sources...1 numeric water quality standard (21 µg/l) determined by the arizona department...
TRANSCRIPT

Central Arizona Water Conservation DistrictWater Transmission
by Scott Bryan, Senior Biologist
2019
ANNUAL REPORT
WATERQUALITY

Central Arizona Project (CAP) reliably delivers Colorado River water from Lake Havasu, located on Arizona’s western border, to central and southern Arizona. The total CAP system is 336 miles long and consists of open canals, inverted siphon pipelines, tunnels, pumping plants, check structures, turnouts, and the Lake Pleasant storage reservoir.
The CAP system provides a means for 1.5 million acre feet (MAF) of Arizona’s Colorado River allotment (totaling 2.8 MAF) to be delivered to the most populous areas of the state and reduce the use of groundwater for agriculture and other activities.
YOUR WATER
2 | 2019 Water Quality Annual Report
Central Arizona Water Conservation District (CAWCD), with more than 80 long-term customers, is Arizona’s largest supplier of renewable water. Customers are categorized in three distinct user groups: municipal and industrial (M&I), agricultural, and tribal. They use CAP’s Colorado River water to run businesses, water crops, and maintain households, all of which are critical to the quality of life in Arizona.

CAWCD does not provide potable water directly to the public, but supplies raw Colorado River water to its various customers. Lake Pleasant is CAP’s 10,000-surface-acre storage reservoir, and it is strategically utilized based on demand, while taking advantage of the lowest power rates possible. In general, Colorado River water is pumped into Lake Pleasant from CAP October to May, and water is drawn from the reservoir during summer months. Therefore, depending on the time of year, CAP customers may receive water that solely originates from the Colorado River, or a blend of water from the river and Lake Pleasant.
During the time that water is stored in Lake Pleasant, it may take on different water quality characteristics than originally found in the Colorado River. Each of these sources presents its own challenges as they are exposed to unique watershed-related events and activities, such as stormwater runoff, wastewater discharge, recreation, wildlife, algal blooms, and other factors that may affect water quality.
While agricultural and industrial customers may directly utilize raw CAP water, municipal customers filter, disinfect, and apply other necessary treatments to the water before it is delivered through the municipal distribution system for domestic use.
CAP WATER SOURCES
Central Arizona Project | 3

From 1985 to 1995, the United States Bureau of Reclamation (USBR) and CAWCD cooperated with the United States Geological Survey (USGS) to implement a water quality sampling program in the CAP. USGS collected monthly and quarterly grab samples at three sites in the canal system and tested more than 50 parameters. Historical CAP water quality data is available online at:
https://nwis.waterdata.usgs.gov/nwis/qwdata
In 1996, CAWCD took over the water quality sampling program and expanded the scope to include additional sites and parameters. Since that time, CAWCD has produced Annual Water Quality reports, which detail the water quality measured in the canal throughout the calendar year. Past reports are available online at:
https://www.cap-az.com/departments/water-operations/water-quality
CAP HISTORICAL WATER QUALITY
4 | 2019 Water Quality Annual Report

GRAB SAMPLES
Grab samples are collected monthly at six locations, including Lake Havasu, Little Harquahala Pumping Plant, Lake Pleasant Parkway, McKellips Road, Brady Pumping Plant, and San Xavier Pumping Plant (see page 8 map). Each monthly sample includes testing for 23 primary water quality constituents (Appendix A). In addition, quarterly samples are collected from four sites, including Lake Havasu, Lake Pleasant, Lake Pleasant Parkway, and San Xavier Pumping Plant (see page 8 map). Quarterly samples include the 23 primary constituents, as well 120 additional contaminants. A Hydrolab DS5X is also deployed during each sampling event to record temperature, dissolved oxygen, conductivity, and pH.
CAWCD contracts with a State of Arizona licensed and certified laboratory to perform the water quality analysis on grab samples. Verified results are then posted on CAP’s website and available for download at:
http://www.cap-az.com/departments/water-operations/water-quality
As a service to CAP customers, a robust monitoring program is in place to provide water users with valuable information regarding source and canal water quality. The monitoring program consists of both real-time measurements and monthly/quarterly grab samples. CAWCD also coordinates with CAP customers to provide additional sampling if needed.
REAL-TIME MEASUREMENTS
CAWCD monitors basic water quality in real-time at two locations along the canal; CAP Headquarters (7th Street) and just upstream of the Roosevelt Water Conservation District turnout in Mesa, AZ (McDowell Road). Both stations utilize a Hydrolab DS5X multiparameter meter to measure temperature, conductivity, pH, dissolved oxygen, and turbidity. Meters are calibrated and maintained monthly to provide reasonably accurate data. Real-time data is automatically uploaded from each water quality meter every 15 minutes and is displayed on CAP’s website at:
http://www.cap-az.com/departments/water-operations/water-quality
CAP WATER QUALITY PROGRAM
Central Arizona Project | 5

EXPANDED WATER QUALITY PROGRAMIn 2020, CAWCD is placing more emphasis on its water quality program to provide customers with additional data, respond to customer requests, improve communications, and incorporate elements of the System Use Agreement (which allows for wheeling of non-project water).
The expansion of the program will include water quality monitoring at additional representative sample sites, as well as increasing the number of constituents to be tested. Monthly samples will now include 54 primary constituents, while quarterly samples will include an additional 171 EPA regulated and unregulated contaminants. Contaminant testing includes constituents historically sampled by CAWCD, as well as PFAs, disinfection by-products, pathogens, and more.
Samples collected from traditional sites in November and December 2019 were tested for the additional constituents and results are included in Appendix A.
CAWCD will also be working to update the CAP water quality website to improve access to data and provide valuable water quality notifications to customers. The 2020 annual report will include results from the additional testing as well as other important information for our customers.
6 | 2019 Water Quality Annual Report

LakePleasant
Gila River
Gila River
Salt River
Lake Pleasant
Lake PleasantParkway
Lake Havasu
Little HarquahalaPumping Plant
McKellips
BradyPumping Plant
San XavierPumping Plant
±0 2010
Miles
!(!(
!(
!(
!(
!(
!(
NEW
MEXIC
O
NEV
ADA
CAL
IFO
RN
IA
MEXICOGulf ofCalifornia
Tucson
Flagstaff
PHOENIX
Yuma
Kingman
Prescott
Parker
PimaPima
YumaYuma
MaricopaMaricopa
ApacheApache
NavajoNavajo
GilaGila
CoconinoCoconinoMohaveMohave
YavapaiYavapai
La PazLa Paz
PinalPinal
CochiseCochise
SantaSantaCruzCruz
GrahamGraham
Gre
enle
eG
reen
lee
Central Arizona Project
UTAH
Colorado Riv e rLakeMead
LakePowell
LakeHavasu
LegendCAP Canal
Water Quality Sample Sites
Central Arizona Project | 7

All water, whether it be treated or untreated, can be expected to contain at least small amounts of some contaminants. Many of these contaminants are naturally occurring and are either harmless or beneficial at low concentrations. Others may be regulated by EPA to ensure protection for public health.
CAWCD tests for a wide range of constituents to inform water providers of the quality of water that they are receiving. In 2019, none of the primary constituents tested by CAWCD exceeded a typical range for CAP water (see summary table below and Appendix A). Just five contaminants were found to be above a level of “Non Detect” (see Detected Contaminants Table below) throughout the year. However, levels of these contaminants in CAP water were found to be signifantly lower than the Federal Maximum Contaminant Level (MCL) and/or standards established by the State of Arizona.
2019 TEST RESULTS
8 | 2019 Water Quality Annual Report

Constituent Units 2019 Range 2019 Average CAP 5-Yr Average Federal MCL
Field Measurements
Temperature oF 48.4 - 84.9 66.7 --
Dissolved Oxygen mg/L 9.83 - 10.03 9.50 --
Specific Conductance µS/cm 835 - 947 911 --
pH 7.39 - 8.72 8.09 6.5 - 8.5
Primary Constituents
Alkalinity mg/L 93 - 130 121.43 122.29 --
Ammonia Nitrogen mg/L 0.051 - 0.26 0.10 0.04 --
Barium µg/L 100 - 210 118.47 123.17 2000
Bromide µg/L 68 - 99 76.65 81.67 --
Calcium mg/L 55 - 120 70.25 72.58 --
Chloride mg/L 82 - 96 87.47 91.46 250
Copper (Total) µg/L 2.8 - 8.4 5.6 6.69 --
Dissolved Organic Carbon mg/L 2.8 - 3.8 3.19 3.18 --
Iron (Dissolved) mg/L Non-Detect Non-Detect Non-Detect 0.03
Iron (Total) mg/L 0.02 - 3.2 0.18 0.09 --
Magnesium mg/L 24 - 28 25.51 26.67 --
Manganese µg/L 1.9 - 170 8.53 5.65 50
Nitrate as Nitrogen mg/L 0.20 - 0.34 0.27 0.12 10
Orthophosphate as P mg/L 0.01 - 0.86 0.34 0.01 --
Potassium mg/L 4.4 - 5.5 4.82 4.92 --
Silica mg/L 3.4 - 23 7.44 8.14 --
Sodium mg/L 80 - 95 86.81 92.61 --
Specific Conductance µS/cm 870 - 1000 945.14 1028.71 --
Strontium mg/L 0.95 - 1.2 1.03 1.11 --
Sulfate mg/L 200 - 240 219.86 237.36 250
Total Dissolved Solids mg/L 500 - 660 585.14 629.71 500
Total Phosphorous as P mg/L 0.02 - 0.11 0.06 0.02 --
Total Suspended Solids mg/L Non-Detect - 27 7.03 7.86 --
Turbidity NTU 0.19 - 5.8 1.11 1.07 5
SUMMARY OF PRIMARY CONSTITUENTS(Does not include expanded water quality Constituents tested in November/December)
Central Arizona Project | 9

Constituent Location Month Value Units Federal MCL Source of Contamination
2,4-D Agriculture and Landscaping, Runoff
San Xavier May 0.82 µg/L 70
Arsenic Natural deposits, Industrial processes
Havasu Feb 2.2 µg/L 10
Lake Pleasant Feb 2.7 µg/L 10
Lake Pleasant Parkway Feb 2.2 µg/L 10
San Xavier Feb 2.1 µg/L 10
Havasu May 2.4 µg/L 10
Lake Pleasant May 3.8 µg/L 10
Lake Pleasant Parkway May 2.7 µg/L 10
San Xavier May 2.7 µg/L 10
Havasu Aug 2.6 µg/L 10
Lake Pleasant Aug 5.0 µg/L 10
Lake Pleasant Parkway Aug 2.7 µg/L 10
San Xavier Aug 2.9 µg/L 10
Havasu Nov 2.5 µg/L 10
Lake Pleasant Nov 3.5 µg/L 10
Lake Pleasant Parkway Nov 2.3 µg/L 10
Hexavalent Chromium1 Natural deposits, Industrial processes
Havasu Feb 0.04 µg/L 21
Havasu May 0.11 µg/L 21
Havasu Aug 0.09 µg/L 21
Havasu Nov 0.11 µg/L 21
Perchlorate2 Natural deposits, Industrial processes
Lake Pleasant Feb 3.9 µg/L 11
Uranium Natural deposits, Industrial processes
Havasu Feb 3.8 µg/L 30
Lake Pleasant Parkway Feb 4.1 µg/L 30
Havasu May 3.7 µg/L 30
Lake Pleasant Parkway May 4.2 µg/L 30
Havasu Aug 3.6 µg/L 30
Lake Pleasant Parkway Aug 3.8 µg/L 30
Havasu Nov 4.4 µg/L 30
Lake Pleasant Parkway Nov 3.9 µg/L 30
DETECTED CONTAMINANTS TABLE
1 Numeric water quality standard (21 µg/L) determined by the Arizona Department of Environmental Quality for domestic water sources (18 A.A.C. 11)
2 Arizona Department of Health Services developed a health-based guidance level for perchlorate of 11 µg/L in April 2005.
10 | 2019 Water Quality Annual Report

2,4-D is one of the oldest and most widely available herbicides and defoliants in the world, having been commercially available since 1945. It can be found in numerous commercial lawn herbicide mixtures, and is widely used as a weedkiller on cereal crops, pastures, and orchards. Over 1,500 herbicide products contain 2,4-D as an active ingredient. 2,4-D was detected on just one occasion (May) and was 85 times lower than the Federal MCL.
Arsenic is a chemical element that occurs naturally in many minerals, usually in combination with sulfur and metals, but also as a pure elemental crystal. Arsenic is commonly found in groundwater throughout the southwestern United States. The primary use of arsenic is in alloys of lead (for example, in car batteries and ammunition). The Federal MCL for arsenic is 10 µg/L the highest level measured by CAP was 5.0 µg/L.
Hexavalent Chromium is a form of the metallic element chromium. Chromium is a naturally occurring element found in rocks, animals, plants, soil, and volcanic dust and gases. It comes in several different forms, including hexavalent chromium or chromium (VI). Hexavalent chromium can occur naturally in low levels, but is generally produced by industrial processes. Hexavalent chromium is widely used in electroplating, stainless steel production, leather tanning, textile manufacturing, and wood preservation. In heavy doses, inhaled hexavalent chromium is recognized as a human carcinogen, but levels found by CAP in Lake Havasu were just a fraction of the Federal MCL.
Perchlorate is a chemical compound that occurs in low levels naturally, but the majority of perchlorates are commercially produced salts. They are mainly used for propellants, exploiting properties as powerful oxidizing agents and to control static electricity in food packaging. Perchlorate contamination in food, water, and other parts of the environment has been studied in the U.S. because of its harmful effects on human health. Perchlorate was detected in Lake Pleasant on one occasion and it was at a level one-third of the Federal MCL.
Uranium occurs naturally in low concentrations of a few parts per million in soil, rock and water, and is commercially extracted from uranium-bearing minerals. Many contemporary uses of uranium exploit its unique nuclear properties for power and weapons. Most ingested uranium is excreted during digestion, but when inhaled by way of dust into the lungs, pose a more serious exposure hazard. However, levels found in the CAP System were 7 to 10 times lower than the Federal MCL.
DETAILED INFORMATION ON DETECTED CONTAMINANTS
Central Arizona Project | 11

2019 Lake Pleasant Operations
115,054 AF of gaged inflow
Highest Water Elevation (4/25/19) 1,696.98 (ft)
Lowest Water Elevation (8/31/19) 1,663.00 (ft)
Change in Elevation: 33.98 (ft)
2019 Lake Pleasant Release Summary
Month Waddell Releases (AF)
Pass-Thru (AF)
% Ratio
January 18,404 89,618 5/95
April 13,494 134,807 10/90
May 15,508 137,884 10/90
June 84,160 84,005 50/50
July 93,396 74,264 55/45
August 75,286 82,319 50/50
The CAP system utilizes Lake Pleasant as a seasonal pump-storage reservoir. During a typical year, Colorado River water is pumped into the reservoir from October to May when water demands and electricity costs are lower. During the summer, when water demands and electricity costs are higher, water is released from the reservoir for customer deliveries. These schedules may be modified based on required maintenance of the system, as well as rainfall that impacts customer demand. In 2019, small releases were made during January and April to accomodate maintenance activities, while normal pumping occurred from late May to the end of August.
During summer months, the reservoir typically stratifies, with a thermocline developing at a depth of approximately 40-60 feet below the water surface (Appendix B). Although the intake portals at Waddell Dam are set at two different levels, CAP only utilizes the lower portals (elevation 1515) to best manage water quality and reduce taste and odor issues associated with anoxic water. This may seem counter-intuitive, as lower quality water is near the bottom of the reservoir (hypolimnion), but retaining the oxygen-rich epilimnetic water in the reservoir improves the overall quality of water to delivered to CAP customers.
LAKE PLEASANT OPERATIONS
12 | 2019 Water Quality Annual Report

TASTE AND ODOR RESEARCH PROGRAMMunicipal water treatment plants, which treat water supplies from the CAP and SRP systems, occasionally experience seasonal taste and odor episodes. Compounds produced by Cyanobacteria (blue-green algae), such as MIB and geosim, are the suspected causes of the taste and odor problems. These compounds are found at extremely low levels and do not pose a human health hazard.
An ongoing cooperative monitoring program, led by Arizona State University (ASU), has provided a valuable long-term data set for compounds that may cause the taste and odor issues in the CAP and SRP systems. This includes measurements of MIB, Geosmin, Dissolved Organic Carbon (DOC), UV254, and Total Dissolved Nitrogen (TDN).
This program publishes a monthly newsletter, which contains sampling results and a general discussion of the findings. A summary of the project, newsletters distributed from January 2006 – April 2014, and a final report are available at:
https://faculty.engineering.asu.edu/pwesterhoff/research/regional-water-quality-issues/regional-water-quality-newsletter/
Newsletters from 2016-2019 are available at:
https://wet.asu.edu/regional-water-quality/
ASU experienced technical difficulties in collecting, analyzing, and reporting data in 2019, so specific information is limited. However, municipalities have indicated that, similar to previous years, CAP water continues to be of excellent quality and does not contribute to significant levels of MIB and Geosmin.
Central Arizona Project | 13

The Colorado River provides domestic and industrial water to approximately 27 million people in the western United States and is used to irrigate approximately 4 million acres of land. However, salinity levels in the river water have historically been high, which can reduce crop yields, limit the choice of crops that can be grown, make the land unsuitable for agricultural purposes, and kill riparian vegetation.
In 1975, the seven Colorado River Basin states adopted a salinity standard for the Colorado River. That standard, which was approved by the EPA, is composed of numeric criteria for total dissolved solids and a plan of implementation to meet the criteria. Since the program’s implementation, salinity in the river has been reduced by approximately 100 mg/L. For CAP customers this translates to approximately 220,000 tons of salt that did not enter the CAP service area.
CAWCD participates with Arizona and the other Basin States and Federal Agencies in the implementation of the Program. CAWCD also works with the Colorado River Basin Salinity Control Forum and the Forum’s technical workgroup to address funding and other issues associated with program implementation.
SALINITY CONTROL PROGRAM
14 | 2019 Water Quality Annual Report

GROUNDWATER RECHARGECAWCD has developed and currently operates six recharge projects:
1. Pima Mine Road Recharge Project
2. Lower Santa Cruz Recharge Project
3. Agua Fria Recharge Project
4. Hieroglyphic Mountain Recharge Project
5. Tonopah Desert Recharge Project
6. Superstition Mountains Recharge Project
The Tucson Active Management Area (AMA) recharge facilities have a cumulative operational capacity of 80,000 acre-feet per year and include the Pima Mine Road and Lower Santa Cruz Recharge Projects. In the Phoenix AMA, there are four facilities: the Tonopah Desert, Hieroglyphic Mountains, Agua Fria, and Superstition Mountains Recharge Projects, with a combined annual operational capacity of 310,000 acre-feet.
A portion of the permitting process and regulatory compliance for these projects requires periodic water quality monitoring. The sampling results are compiled into an annual report, which is a matter of public record and is submitted to the Arizona Department of Water Resources. Copies of the reports or portions of the reports are available by contacting:
Phillip Pagels CAP Water Transmission Department (623) 869-2252 [email protected]
Central Arizona Project | 15

CENTRAL ARIZONA PROJECT
23636 North 7th Street Phoenix, Arizona 85024 (623) 869-2474
FOR MORE I NFORMATI ON:
Scott Bryan (623) 869-2474 [email protected]
Phillip Pagels (623) 869-2252 [email protected]
www.CentralArizonaProject.com
GET SOCIAL WITH US!

APPENDIX A. WATER QUALITY TABLES
Central Arizona Project | A1

Constituent Units MRL Jan Feb Mar Apr May Jun Jul Aug Sep Oct Nov Dec
Field Measurements
Temperature oF --- 52.8 53.8 56.7 67.3 56 77.9 80.7 84.4 81.2 75.3 62.0 58.8
Dissolved Oxygen mg/L --- 10.47 --- 10.34 9.69 --- 9.25 9.3 9.8 7.69 7.24 9.54 9.06
Specific Conductance
µS/cm --- 907 894 883 920 --- 920 913 904 926 924 926 911
pH --- 7.66 8.13 7.83 7.81 8.24 8.47 8.38 8.12 8.06 7.96 8.07 7.97
Primary Analytes
Alkalinity mg/L 2.0 120 130 130 130 130 130 120 120 120 130 130 130
Alpha, Gross pCi/L 3.0 Expanded water quality testing ND ND
Aluminum µg/L 20.0 Expanded water quality testing 150 170
Ammonia Nitrogen mg/L 0.05 ND 0.084 ND 0.079 0.072 ND ND ND ND ND ND ND
Antimony µg/L 1.0 Expanded water quality testing ND ND
Arsenic µg/L 1.0 Expanded water quality testing 2.5 2.1
Barium µg/L 2.0 120 120 130 120 120 110 110 110 120 120 120 120
Beryllium µg/L 1.0 Expanded water quality testing ND ND
Beta, Gross pCi/L 3.0 Expanded water quality testing 5.4 5.0
Boron mg/L 0.05 Expanded water quality testing 0.13 0.13
Bromide µg/L 5.0 79 77 74 77 77 77 74 71 76 75 76 83
Cadmium µg/L 0.5 Expanded water quality testing ND ND
Calcium mg/L 1.0 71 75 74 71 72 71 69 67 69 71 70 72
Chloride mg/L 0.5 89 86 86 85 86 88 86 84 82 85 88 86
Chromium (Total) µg/L 1.0 Expanded water quality testing ND ND
Cobalt µg/L 2.0 Expanded water quality testing ND ND
Copper (Dissolved) µg/L 2.0 Expanded water quality testing ND ND
Copper (Total) µg/L 2.0 ND ND ND ND ND ND ND ND ND ND ND ND
Dissolved Organic Carbon mg/L 2.8 3.1 2.9 3.3 3.0 3.1 3.0 2.8 3.2 3.2 3.3 3.0 2.8
Fluoride mg/L 0.05 Expanded water quality testing 0.32 0.35
Germanium µg/L 1.0 Expanded water quality testing ND ND
Hexavalent Chromium µg/L 0.02 Expanded water quality testing 0.11 0.05
Iron (Dissolved) mg/L 0.02 ND ND ND ND ND ND ND ND ND ND ND ND
Iron (Total) mg/L 0.02 ND 0.089 0.028 ND 0.084 0.029 ND ND 0.032 0.19 0.20 0.19
A2 | 2019 Water Quality Annual Report
LAKE HAVASU 2019 (MARK WILMER PUMPING PLANT)

Constituent Units MRL Jan Feb Mar Apr May Jun Jul Aug Sep Oct Nov Dec
Lead (Total) µg/L 0.5 Expanded water quality testing ND ND
Magnesium mg/L 0.1 25 25 25 24 25 25 25 24 25 25 26 26
Manganese µg/L 2.0 2.4 4.1 2.4 2.3 5.1 3.7 2.1 3.0 5.6 12 8.1 9.5
Mercury µg/L 0.2 Expanded water quality testing ND ND
Molybdenum µg/L 2.0 Expanded water quality testing 4.5 4.4
Nickel µg/L 5.0 Expanded water quality testing ND ND
Nitrate as Nitrogen mg/L 0.05 0.27 0.28 0.32 0.34 0.30 0.28 ND ND ND 0.20 ND ND
Nitrite Nitrogen mg/L 0.05 Expanded water quality testing ND ND
Orthophosphate as P mg/L 0.01 ND ND ND ND ND ND ND ND ND ND ND 0.01
Orthophosphate as PO4 mg/L 0.031 Expanded water quality testing nD 0.031
Perchlorate µg/L 4.0 Expanded water quality testing ND ND
Potassium mg/L 1.0 4.9 4.8 4.4 4.6 4.6 4.6 4.5 4.4 4.7 5.0 4.8 4.7
Radium 226 pCi/L 1.0 Expanded water quality testing ND ND
Radium 228 pCi/L 1.0 Expanded water quality testing ND ND
Selenium µg/L 5.0 Expanded water quality testing ND ND
Silica mg/L 0.5 8.1 8.5 8.2 7.4 7.8 7.6 7.5 7.4 7.8 9.1 12 9.4
Silver (Total) µg/L 0.5 Expanded water quality testing ND ND
Sodium mg/L 1.0 87 88 85 83 85 86 85 80 84 87 86 88
Specific Conductance
µS/cm 2.0 950 960 950 950 940 940 930 920 940 940 950 950
Strontium mg/L 0.01 1.0 1.1 1.0 1.0 1.0 1.0 1.0 1.0 1.0 1.0 1.0 1.0
Sulfate mg/L 0.5 230 220 220 220 220 220 220 210 210 210 220 210
Thallium µg/L 1.0 Expanded water quality testing ND ND
Total Dissolved Solids mg/L 10.0 610 600 580 580 580 570 570 560 570 550 660 580
Total Organic Carbon mg/L 0.3 Expanded water quality testing 2.8 2.8
Total Phosphorous as P mg/L 0.02 ND ND 0.11 ND ND ND ND ND ND ND ND ND
Total Suspended Solids mg/L 10.0 ND ND ND ND ND ND ND ND ND ND ND ND
Turbidity NTU 0.1 0.45 1.8 0.54 0.28 1.3 1.0 0.42 0.62 1.4 2.8 2.0 1.6
Uranium µg/L 1.0 Expanded water quality testing 4.4 4.4
Vanadium µg/L 3.0 Expanded water quality testing 3.0 ND
Zinc µg/L 20.0 Expanded water quality testing ND ND
LAKE HAVASU 2019 (CONTINUED)
Central Arizona Project | A3

Constituent Units MRL Jan Feb Mar Apr May Jun Jul Aug Sep Oct Nov Dec
Field Measurements
Temperature oF --- 51.1 54.9 57.6 65.8 64 77.2 79 84.9 80.1 74.1 61.4 58
Dissolved Oxygen mg/L --- 10.90 --- 10.68 9.1 --- 9.42 8.47 8.00 6.85 7.32 9.2 10.01
Specific Conduc-tance
µS/cm --- 900 896 884 923 --- 915 913 8.27 927 922 925 904
pH --- 8.00 8.04 8.72 8.24 8.25 8.45 8.26 9.08 8.01 7.91 8.09 8.06
Primary Analytes
Alkalinity mg/L 2.0 120 130 120 130 130 130 120 120 120 130 130 120
Alpha, Gross pCi/L 3.0 Expanded water quality testing ND 4.4
Aluminum µg/L 20.0 Expanded water quality testing --- ND
Ammonia Nitrogen mg/L 0.05 ND ND ND 0.13 ND ND ND ND ND ND ND ND
Antimony µg/L 1.0 Expanded water quality testing --- ND
Arsenic µg/L 1.0 Expanded water quality testing --- 2.3
Barium µg/L 2.0 110 120 120 120 120 110 110 110 120 120 --- 110
Beryllium µg/L 1.0 Expanded water quality testing --- ND
Beta, Gross pCi/L 3.0 Expanded water quality testing 5.6 3.7
Boron mg/L 0.05 Expanded water quality testing 0.13 0.12
Bromide µg/L 5.0 76 79 70 78 73 73 72 73 74 77 75 78
Cadmium µg/L 0.5 Expanded water quality testing --- ND
Calcium mg/L 1.0 71 74 70 72 73 70 68 69 70 70 71 68
Chloride mg/L 0.5 89 87 87 85 85 88 86 86 83 85 88 87
Chromium (Total) µg/L 1.0 Expanded water quality testing --- ND
Cobalt µg/L 2.0 Expanded water quality testing --- ND
Copper (Dissolved) µg/L 2.0 Expanded water quality testing --- ND
Copper (Total) µg/L 2.0 ND ND ND ND ND ND ND ND ND ND --- ND
Dissolved Organic Carbon mg/L 2.8 Expanded water quality testing 3.0 2.8
Fluoride mg/L 0.05 Expanded water quality testing 0.30 0.34
Germanium µg/L 1.0 Expanded water quality testing --- ND
Hexavalent Chromi-um µg/L 0.02 Expanded water quality testing 0.12 0.12
Iron (Dissolved) mg/L 0.02 ND ND ND ND ND ND ND ND ND ND ND ND
Iron (Total) mg/L 0.02 ND 0.038 ND ND 0.54 ND ND ND 0.17 0.032 0.067 ND
A4 | 2019 Water Quality Annual Report
LITTLE HARQUAHALA 2019

Constituent Units MRL Jan Feb Mar Apr May Jun Jul Aug Sep Oct Nov Dec
Lead (Total) µg/L 0.5 Expanded water quality testing --- ND
Magnesium mg/L 0.1 26 26 24 24 24 24 25 25 25 25 26 25
Manganese µg/L 2.0 ND 2.0 ND 5.9 21 2.2 2.1 2.1 11 6.0 --- ND
Mercury µg/L 0.2 Expanded water quality testing ND ND
Molybdenum µg/L 2.0 Expanded water quality testing --- 4.4
Nickel µg/L 5.0 Expanded water quality testing --- ND
Nitrate as Nitrogen mg/L 0.05 ND ND 0.26 0.32 0.30 ND ND ND ND 0.21 ND ND
Nitrite Nitrogen mg/L 0.05 Expanded water quality testing ND ND
Orthophosphate as P mg/L 0.01 ND ND ND ND ND ND ND ND ND ND ND ND
Orthophosphate as PO4 mg/L 0.031 Expanded water quality testing ND ND
Perchlorate µg/L 4.0 Expanded water quality testing ND ND
Potassium mg/L 1.0 4.7 4.8 4.5 4.7 4.7 4.5 4.5 4.7 4.7 4.7 4.9 4.7
Radium 226 pCi/L 1.0 Expanded water quality testing ND ND
Radium 228 pCi/L 1.0 Expanded water quality testing ND ND
Selenium µg/L 5.0 Expanded water quality testing --- ND
Silica mg/L 0.5 7.6 8.2 7.3 7.1 10 6.3 7.3 7.9 8.6 7.7 9.0 6.9
Silver (Total) µg/L 0.5 Expanded water quality testing --- ND
Sodium mg/L 1.0 89 88 83 83 83 83 85 84 83 85 88 87
Specific Conduc-tance
µS/cm 2.0 940 960 950 950 940 930 930 920 940 940 950 940
Strontium mg/L 0.01 1.1 1.1 1.0 1.0 1.0 1.0 1.0 1.0 1.0 1.0 1.0 1.0
Sulfate mg/L 0.5 230 220 220 220 220 220 220 220 210 210 220 220
Thallium µg/L 1.0 Expanded water quality testing --- ND
Total Dissolved Solids mg/L 10.0 580 600 580 590 590 570 570 570 560 550 570 590
Total Organic Carbon mg/L 0.3 Expanded water quality testing 2.8 2.8
Total Phosphorous as P mg/L 0.02 ND ND ND ND ND ND ND ND ND ND ND ND
Total Suspended Solids mg/L 10.0 ND ND ND ND 25 ND ND ND 11 ND ND ND
Turbidity NTU 0.1 0.19 0.52 0.21 0.28 2.5 0.63 0.38 0.31 5.6 1.7 0.96 0.74
Uranium µg/L 1.0 Expanded water quality testing --- 4.0
Vanadium µg/L 3.0 Expanded water quality testing --- ND
Zinc µg/L 20.0 Expanded water quality testing --- ND
LITTLE HARQUAHALA 2019 (CONTINUED)
Central Arizona Project | A5

Constituent Units MRL Jan Feb Mar Apr May Jun Jul Aug Sep Oct Nov Dec
Field Measurements
Temperature oF --- 54.7 52.4 60.5 65.4 68.2 67.3 69 73.9 80.2 74.3 65.9 57.8
Dissolved Oxygen mg/L --- 11.62 10.03 10.9 10.1 9.41 8.25 8.02 8.01 7.84 8.99 8.98 10.3
Specific Conduc-tance
µS/cm --- 887 897 883 916 925 933 927 919 926 920 892 901
pH --- 8.45 7.95 8.29 7.70 8.07 8.17 8.04 8.08 8.13 8.16 7.91 7.97
Primary Analytes
Alkalinity mg/L 2.0 120 120 120 130 120 120 120 120 120 120 130 120
Alpha, Gross pCi/L 3.0 Expanded water quality testing ND ND
Aluminum µg/L 20.0 Expanded water quality testing 82 ND
Ammonia Nitrogen mg/L 0.05 ND ND ND 0.051 0.061 ND ND ND ND ND ND ND
Antimony µg/L 1.0 Expanded water quality testing ND ND
Arsenic µg/L 1.0 Expanded water quality testing 2.3 2.4
Barium µg/L 2.0 110 110 120 130 130 120 110 110 120 120 120 110
Beryllium µg/L 1.0 Expanded water quality testing ND ND
Beta, Gross pCi/L 3.0 Expanded water quality testing 6.5 5.0
Boron mg/L 0.05 Expanded water quality testing 0.13 0.12
Bromide µg/L 5.0 73 77 71 68 77 82 80 77 72 73 79 75
Cadmium µg/L 0.5 Expanded water quality testing ND ND
Calcium mg/L 1.0 70 73 74 71 70 69 67 67 71 70 73 67
Chloride mg/L 0.5 88 88 87 85 85 89 88 82 85 84 87 87
Chromium (Total) µg/L 1.0 Expanded water quality testing ND ND
Cobalt µg/L 2.0 Expanded water quality testing ND ND
Copper (Dissolved) µg/L 2.0 Expanded water quality testing ND ND
Copper (Total) µg/L 2.0 ND ND ND ND ND ND ND ND ND ND ND ND
Dissolved Organic Carbon mg/L 2.8 Expanded water quality testing 3.2 2.9
Fluoride mg/L 0.05 Expanded water quality testing 0.35 0.33
Germanium µg/L 1.0 Expanded water quality testing ND ND
Hexavalent Chromi-um µg/L 0.02 Expanded water quality testing 0.11 0.049
Iron (Dissolved) mg/L 0.02 ND ND ND ND ND ND ND ND ND ND ND ND
Iron (Total) mg/L 0.02 ND ND ND 0.10 0.034 ND ND ND 0.25 0.18 0.088 ND
A6 | 2019 Water Quality Annual Report
LAKE PLEASANT PARKWAY 2019

Constituent Units MRL Jan Feb Mar Apr May Jun Jul Aug Sep Oct Nov Dec
Lead (Total) µg/L 0.5 Expanded water quality testing ND ND
Magnesium mg/L 0.1 26 26 26 24 25 26 26 26 24 25 25
Manganese µg/L 2.0 ND ND ND 6.5 4.6 4.2 4.2 8.7 16 11 4.6 ND
Mercury µg/L 0.2 Expanded water quality testing ND ND
Molybdenum µg/L 2.0 Expanded water quality testing 4.3 4.4
Nickel µg/L 5.0 Expanded water quality testing ND ND
Nitrate as Nitrogen mg/L 0.05 ND 0.27 ND 0.28 ND ND ND ND ND 0.20 ND ND
Nitrite Nitrogen mg/L 0.05 Expanded water quality testing ND ND
Orthophosphate as P mg/L 0.01 ND ND ND ND ND ND ND ND ND ND ND ND
Orthophosphate as PO4 mg/L 0.031 Expanded water quality testing ND ND
Perchlorate µg/L 4.0 Expanded water quality testing ND ND
Potassium mg/L 1.0 4.6 4.6 4.5 4.6 4.8 5.0 4.9 4.8 4.6 4.8 5.0 4.6
Radium 226 pCi/L 1.0 Expanded water quality testing ND ND
Radium 228 pCi/L 1.0 Expanded water quality testing ND ND
Selenium µg/L 5.0 Expanded water quality testing ND ND
Silica mg/L 0.5 7.4 8.1 7.3 7.4 6.9 6.8 7.8 8.0 8.8 7.9 7.3 6.5
Silver (Total) µg/L 0.5 Expanded water quality testing ND ND
Sodium mg/L 1.0 90 88 87 86 86 89 87 86 82 84 90 84
Specific Conduc-tance
µS/cm 2.0 940 950 940 950 950 960 950 940 930 940 940 940
Strontium mg/L 0.01 1.1 1.1 1.1 1.0 1.0 1.0 1.0 1.0 1.0 1.0 1.1 1.0
Sulfate mg/L 0.5 220 220 220 220 220 220 220 210 220 200 210 220
Thallium µg/L 1.0 Expanded water quality testing ND ND
Total Dissolved Solids mg/L 10.0 590 570 600 580 600 580 600 590 610 580 610 580
Total Organic Carbon mg/L 0.3 Expanded water quality testing 3.6 3.0
Total Phosphorous as P mg/L 0.02 ND ND ND ND ND ND ND ND ND ND ND ND
Total Suspended Solids mg/L 10.0 ND ND ND ND ND ND ND ND 20 14 ND ND
Turbidity NTU 0.1 0.29 0.57 0.21 1.9 0.39 0.49 0.28 0.35 3.6 3.6 2.0 0.97
Uranium µg/L 1.0 Expanded water quality testing 3.9 4.1
Vanadium µg/L 3.0 Expanded water quality testing ND ND
Zinc µg/L 20.0 Expanded water quality testing ND ND
LAKE PLEASANT PARKWAY 2019 (CONTINUED)
Central Arizona Project | A7

Constituent Units MRL Jan Feb Mar Apr May Jun Jul Aug Sep Oct Nov Dec
Field Measurements
Temperature oF --- 53.5 52.6 61.9 66.5 74.5 71.2 71 73.2 82.3 75.6
NO
TE
ST
ING
55.7
Dissolved Oxygen mg/L --- 10.5 10.58 11.07 10.32 9.61 10.35 10.22 8.26 8.2 9.2 10.82
Specific Conduc-tance
µS/cm --- 947 893 884 917 913 929 926 926 929 921 902
pH --- 7.39 8.10 8.42 7.66 8.41 8.27 8.22 8.01 8.08 8.17 7.79
Primary Analytes
Alkalinity mg/L 2.0 120 120 120 130 120 120 120 110 120 120 120
Alpha, Gross pCi/L 3.0 Expanded water quality testing 5.1
Aluminum µg/L 20.0 Expanded water quality testing ND
Ammonia Nitrogen mg/L 0.05 ND ND ND ND 0.13 ND ND ND ND ND ND
Antimony µg/L 1.0 Expanded water quality testing ND
Arsenic µg/L 1.0 Expanded water quality testing 2.5
Barium µg/L 2.0 110 110 120 110 120 120 110 120 120 120 110
Beryllium µg/L 1.0 Expanded water quality testing ND
Beta, Gross pCi/L 3.0 Expanded water quality testing 4.3
Boron mg/L 0.05 Expanded water quality testing 0.14
Bromide µg/L 5.0 92 72 72 70 71 76 88 75 71 68 71
Cadmium µg/L 0.5 Expanded water quality testing ND
Calcium mg/L 1.0 71 73 73 77 70 69 67 66 68 70 73
Chloride mg/L 0.5 93 88 88 85 87 89 90 88 84 86 90
Chromium (Total) µg/L 1.0 Expanded water quality testing ND
Cobalt µg/L 2.0 Expanded water quality testing ND
Copper (Dissolved) µg/L 2.0 Expanded water quality testing ND
Copper (Total) µg/L 2.0 ND ND ND ND ND ND ND ND ND ND ND
Dissolved Organic Carbon mg/L 2.8 Expanded water quality testing 3.0
Fluoride mg/L 0.05 Expanded water quality testing 0.31
Germanium µg/L 1.0 Expanded water quality testing ND
Hexavalent Chromi-um µg/L 0.02 Expanded water quality testing 0.12
Iron (Dissolved) mg/L 0.02 ND ND ND ND ND ND ND ND ND ND ND
Iron (Total) mg/L 0.02 ND ND ND 0.020 0.065 ND ND ND 0.13 0.18 ND
A8 | 2019 Water Quality Annual Report
MCKELLIPS ROAD 2019 (MESA)

Constituent Units MRL Jan Feb Mar Apr May Jun Jul Aug Sep Oct Nov Dec
Lead (Total) µg/L 0.5 Expanded water quality testing
NO
TE
ST
ING
Magnesium mg/L 0.1 28 26 26 26 24 26 26 25 24 25 28
Manganese µg/L 2.0 3.6 2.0 2.6 4.0 6.2 3.6 4.9 5.1 9.0 10 1.9
Mercury µg/L 0.2 Expanded water quality testing ND
Molybdenum µg/L 2.0 Expanded water quality testing 4.4
Nickel µg/L 5.0 Expanded water quality testing ND
Nitrate as Nitrogen mg/L 0.05 ND ND ND 0.25 0.25 ND ND ND ND ND ND
Nitrite Nitrogen mg/L 0.05 Expanded water quality testing ND
Orthophosphate as P mg/L 0.01 ND ND ND ND ND 0.050 ND 0.86 ND ND ND
Orthophosphate as PO4 mg/L 0.031 Expanded water quality testing ND
Perchlorate µg/L 4.0 Expanded water quality testing ND
Potassium mg/L 1.0 5.3 4.6 4.6 5.0 4.5 5.0 5.0 4.9 4.6 4.8 5.2
Radium 226 pCi/L 1.0 Expanded water quality testing ND
Radium 228 pCi/L 1.0 Expanded water quality testing ND
Selenium µg/L 5.0 Expanded water quality testing ND
Silica mg/L 0.5 7.8 7.3 6.7 7.0 6.0 5.4 7.1 7.7 8.1 7.8 6.6
Silver (Total) µg/L 0.5 Expanded water quality testing ND
Sodium mg/L 1.0 95 87 86 91 85 89 88 82 82 84 93
Specific Conduc-tance
µS/cm 2.0 990 950 940 950 940 950 950 960 940 940 930
Strontium mg/L 0.01 1.1 1.1 1.0 1.1 1.0 1.0 1.0 1.0 1.0 1.0 1.1
Sulfate mg/L 0.5 240 220 220 220 220 220 220 220 220 200 230
Thallium µg/L 1.0 Expanded water quality testing ND
Total Dissolved Solids mg/L 10.0 630 570 590 580 570 630 580 590 580 570 590
Total Organic Carbon mg/L 0.3 Expanded water quality testing 3.4
Total Phosphorous as P mg/L 0.02 ND ND ND ND ND ND ND ND ND ND ND
Total Suspended Solids mg/L 10.0 ND ND ND ND 12 ND ND ND ND 10 ND
Turbidity NTU 0.1 0.29 0.42 0.28 0.94 2.8 0.80 0.35 0.86 0.74 5.8 0.79
Uranium µg/L 1.0 Expanded water quality testing 4.0
Vanadium µg/L 3.0 Expanded water quality testing ND
Zinc µg/L 20.0 Expanded water quality testing ND
MCKELLIPS ROAD 2019 (CONTINUED)
Central Arizona Project | A9

Constituent Units MRL Jan Feb Mar Apr May Jun Jul Aug Sep Oct Nov Dec
Field Measurements
Temperature oF --- 54.4 55.6 63.6 66.3 69.8 74.7 74.5 75.5 81.2 63.6
NO
TE
ST
ING
54
Dissolved Oxygen mg/L --- 11.89 10.78 11.92 9.64 9.42 10.35 9.36 8.39 8.71 10.19 10.13
Specific Conduc-tance
µS/cm --- 936 887 871 912 922 926 931 924 925 925 887
pH --- 7.69 8.24 8.40 8.10 8.02 8.34 8.02 8.15 8.21 8.16 7.69
Primary Analytes
Alkalinity mg/L 2.0 120 120 120 120 120 120 120 120 120 120 93
Alpha, Gross pCi/L 3.0 Expanded water quality testing ND
Aluminum µg/L 20.0 Expanded water quality testing 85
Ammonia Nitrogen mg/L 0.05 ND ND ND ND ND ND ND ND ND 0.054 0.063
Antimony µg/L 1.0 Expanded water quality testing ND
Arsenic µg/L 1.0 Expanded water quality testing 2.0
Barium µg/L 2.0 110 110 210 120 120 120 120 110 110 110 100
Beryllium µg/L 1.0 Expanded water quality testing ND
Beta, Gross pCi/L 3.0 Expanded water quality testing 5.0
Boron mg/L 0.05 Expanded water quality testing 0.12
Bromide µg/L 5.0 86 80 74 70 76 81 75 79 70 76 73
Cadmium µg/L 0.5 Expanded water quality testing ND
Calcium mg/L 1.0 66 70 120 71 70 68 70 66 69 69 55
Chloride mg/L 0.5 94 89 96 86 89 90 87 86 84 95 90
Chromium (Total) µg/L 1.0 Expanded water quality testing ND
Cobalt µg/L 2.0 Expanded water quality testing ND
Copper (Dissolved) µg/L 2.0 Expanded water quality testing ND
Copper (Total) µg/L 2.0 ND ND 8.4 ND ND ND ND ND ND ND ND
Dissolved Organic Carbon mg/L 2.8 Expanded water quality testing 3.2
Fluoride mg/L 0.05 Expanded water quality testing 0.32
Germanium µg/L 1.0 Expanded water quality testing ND
Hexavalent Chromi-um µg/L 0.02 Expanded water quality testing 0.12
Iron (Dissolved) mg/L 0.02 ND ND ND ND ND ND ND ND ND ND ND
Iron (Total) mg/L 0.02 ND ND 3.2 0.064 0.094 0.075 0.054 0.025 ND ND 0.06
A10 | 2019 Water Quality Annual Report
BRADY PUMPING PLANT 2019
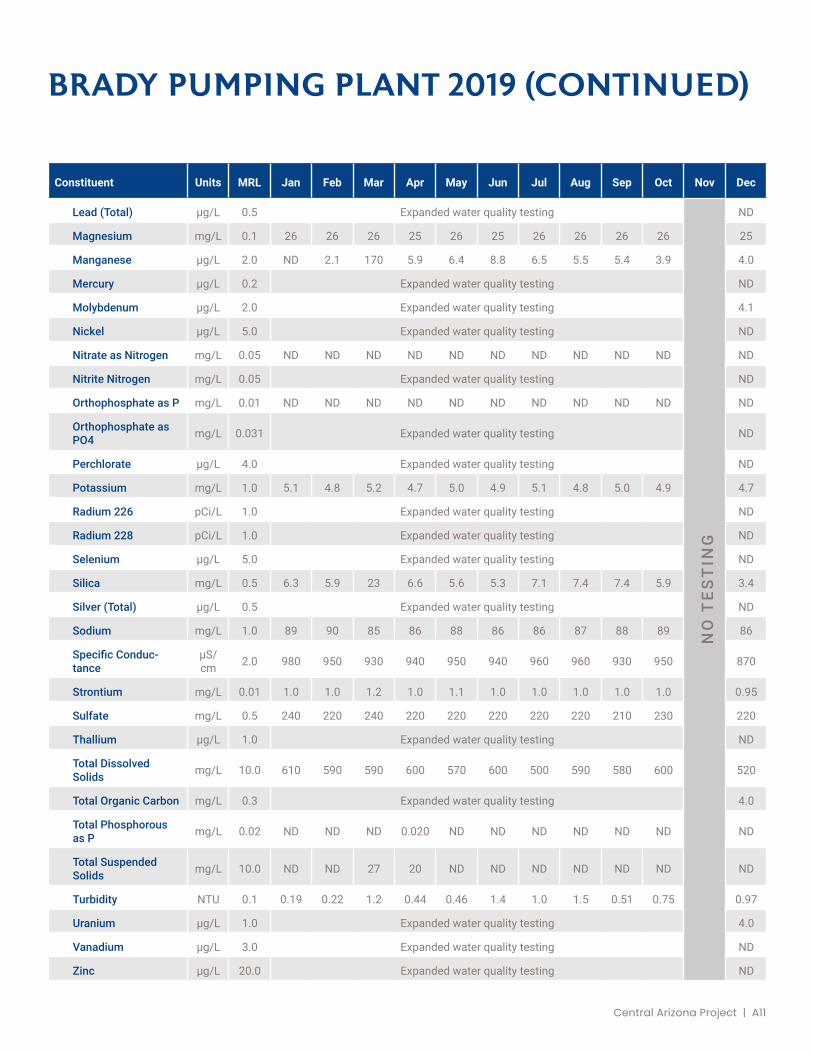
Constituent Units MRL Jan Feb Mar Apr May Jun Jul Aug Sep Oct Nov Dec
Lead (Total) µg/L 0.5 Expanded water quality testing
NO
TE
ST
ING
ND
Magnesium mg/L 0.1 26 26 26 25 26 25 26 26 26 26 25
Manganese µg/L 2.0 ND 2.1 170 5.9 6.4 8.8 6.5 5.5 5.4 3.9 4.0
Mercury µg/L 0.2 Expanded water quality testing ND
Molybdenum µg/L 2.0 Expanded water quality testing 4.1
Nickel µg/L 5.0 Expanded water quality testing ND
Nitrate as Nitrogen mg/L 0.05 ND ND ND ND ND ND ND ND ND ND ND
Nitrite Nitrogen mg/L 0.05 Expanded water quality testing ND
Orthophosphate as P mg/L 0.01 ND ND ND ND ND ND ND ND ND ND ND
Orthophosphate as PO4 mg/L 0.031 Expanded water quality testing ND
Perchlorate µg/L 4.0 Expanded water quality testing ND
Potassium mg/L 1.0 5.1 4.8 5.2 4.7 5.0 4.9 5.1 4.8 5.0 4.9 4.7
Radium 226 pCi/L 1.0 Expanded water quality testing ND
Radium 228 pCi/L 1.0 Expanded water quality testing ND
Selenium µg/L 5.0 Expanded water quality testing ND
Silica mg/L 0.5 6.3 5.9 23 6.6 5.6 5.3 7.1 7.4 7.4 5.9 3.4
Silver (Total) µg/L 0.5 Expanded water quality testing ND
Sodium mg/L 1.0 89 90 85 86 88 86 86 87 88 89 86
Specific Conduc-tance
µS/cm 2.0 980 950 930 940 950 940 960 960 930 950 870
Strontium mg/L 0.01 1.0 1.0 1.2 1.0 1.1 1.0 1.0 1.0 1.0 1.0 0.95
Sulfate mg/L 0.5 240 220 240 220 220 220 220 220 210 230 220
Thallium µg/L 1.0 Expanded water quality testing ND
Total Dissolved Solids mg/L 10.0 610 590 590 600 570 600 500 590 580 600 520
Total Organic Carbon mg/L 0.3 Expanded water quality testing 4.0
Total Phosphorous as P mg/L 0.02 ND ND ND 0.020 ND ND ND ND ND ND ND
Total Suspended Solids mg/L 10.0 ND ND 27 20 ND ND ND ND ND ND ND
Turbidity NTU 0.1 0.19 0.22 1.2 0.44 0.46 1.4 1.0 1.5 0.51 0.75 0.97
Uranium µg/L 1.0 Expanded water quality testing 4.0
Vanadium µg/L 3.0 Expanded water quality testing ND
Zinc µg/L 20.0 Expanded water quality testing ND
BRADY PUMPING PLANT 2019 (CONTINUED)
Central Arizona Project | A11

Constituent Units MRL Jan Feb Mar Apr May Jun Jul Aug Sep Oct Nov Dec
Field Measurements
Temperature oF 52.2 52.1 63 64.9 69.1 78 80.2 79.5 78.5 62.8
NO
TE
ST
ING
48.4
Dissolved Oxygen mg/L 10.68 9.83 10.24 9.16 9.15 9.57 8.45 7.81 7.77 10.32 10.14
Specific Conductance
µS/cm 901 870 867 913 940 940 937 926.2 8.21 8.06 835
pH 8.04 8.32 7.42 8.30 7.81 8.34 8.04 8.19 906 918 7.78
Primary Analytes
Alkalinity mg/L 2.0 120 110 110 120 120 120 120 120 110
NO
TE
ST
ING
120
Alpha, Gross pCi/L 3.0 Expanded Water Quality testing ND
Aluminum µg/L 20.0 EXPANDED WATER QUALITY TESTING ND
Ammonia Nitrogen mg/L 0.05 0.20 ND ND ND ND ND 0.26 0.055 0.078 ND
Antimony µg/L 1.0 Expanded Water Quality testing ND
Arsenic µg/L 1.0 Expanded Water Quality testing 10
Barium µg/L 2.0 120 110 110 110 130 110 120 110 120 120
Beryllium µg/L 1.0 Expanded Water Quality testing ND
Beta, Gross pCi/L 3.0 Expanded Water Quality testing 5.8
Boron mg/L 0.05 Expanded Water Quality testing 0.13
Bromide µg/L 5.0 78 75 72 75 83 83 78 80 73 73
Cadmium µg/L 0.5 Expanded Water Quality testing ND
Calcium mg/L 1.0 67 65 67 70 68 67 68 65 62 70
Chloride mg/L 0.5 90 88 88 87 91 92 90 85 82 88
Chromium (Total) µg/L 1.0 Expanded Water Quality testing 1.2
Cobalt µg/L 2.0 Expanded Water Quality testing ND
Copper (Dissolved) µg/L 2.0 Expanded Water Quality testing ND
Copper (Total) µg/L 2.0 ND ND ND ND ND ND ND ND ND ND
Dissolved Organic Carbon mg/L 2.8 Expanded Water Quality testing 3.8
Fluoride mg/L 0.05 Expanded Water Quality testing 0.33
Germanium µg/L 1.0 Expanded Water Quality testing ND
Hexavalent Chromium µg/L 0.02 Expanded Water Quality testing 0.088
Iron (Dissolved) mg/L 0.02 ND ND ND ND ND ND ND ND ND ND
Iron (Total) mg/L 0.02 0.046 0.057 ND 0.030 0.038 ND 0.031 0.024 0.14 ND
A12 | 2019 Water Quality Annual Report
SAN XAVIER PUMPING PLANT 2019

Constituent Units MRL Jan Feb Mar Apr May Jun Jul Aug Sep Oct Nov Dec
Lead (Total) µg/L 0.5 Expanded Water Quality testing
NO
TE
ST
ING
NO
TE
ST
ING
ND
Magnesium mg/L 0.1 25 25 26 26 26 27 27 26 24 27
Manganese µg/L 2.0 4.0 4.9 4.2 6.4 5.1 4.4 4.2 4.1 10 3.9
Mercury µg/L 0.2 Expanded Water Quality testing ND
Molybdenum µg/L 2.0 Expanded Water Quality testing 5.2
Nickel µg/L 5.0 Expanded Water Quality testing ND
Nitrate as Nitrogen mg/L 0.05 ND ND ND ND ND ND ND ND ND ND
Nitrite Nitrogen mg/L 0.05 Expanded Water Quality testing ND
Orthophosphate as P mg/L 0.01 ND ND ND ND ND ND ND ND ND ND
Orthophosphate as PO4 mg/L 0.031 Expanded Water Quality testing ND
Perchlorate µg/L 4.0 Expanded Water Quality testing ND
Potassium mg/L 1.0 4.7 4.8 4.7 4.9 5.2 5.1 5.2 4.9 4.6 5.1
Radium 226 pCi/L 1.0 Expanded Water Quality testing ND
Radium 228 pCi/L 1.0 Expanded Water Quality testing ND
Selenium µg/L 5.0 Expanded Water Quality testing ND
Silica mg/L 0.5 5.8 3.6 4.1 5.4 5.8 5.6 6.8 7.1 8.0 6.1
Silver (Total) µg/L 0.5 Expanded Water Quality testing ND
Sodium mg/L 1.0 88 88 90 90 90 89 88 88 81 91
Specific Conduc-tance
µS/cm 2.0 950 930 930 940 960 950 950 950 910 930
Strontium mg/L 0.01 1.0 1.0 1.1 1.1 1.1 1.0 1.1 1.0 0.96 1.1
Sulfate mg/L 0.5 220 220 220 220 230 220 220 210 210 220
Thallium µg/L 1.0 Expanded Water Quality testing ND
Total Dissolved Solids mg/L 10.0 590 580 590 590 580 600 580 590 560 560
Total Organic Carbon mg/L 0.3 Expanded Water Quality testing 3.0
Total Phosphorous as P mg/L 0.02 ND ND 0.089 0.027 ND ND ND ND ND ND
Total Suspended Solids mg/L 10.0 ND ND ND ND ND 18 ND ND 11 ND
Turbidity NTU 0.1 0.68 0.57 0.48 0.68 0.50 1.1 0.89 1.1 3.3 2.3
Uranium µg/L 1.0 Expanded Water Quality testing 11
Vanadium µg/L 3.0 Expanded Water Quality testing 12
Zinc µg/L 20.0 Expanded Water Quality testing ND
SAN XAVIER PUMPING PLANT 2019 (CONTINUED)
Central Arizona Project | A13

Constituent Units MRL Jan Feb Mar Apr May Jun Jul Aug Sep Oct Nov Dec
Primary Analytes
Alkalinity mg/L 2.0 120 120 110 130
Alpha, Gross pCi/L 3.0 Expanded Water Quality testing ND
Aluminum µg/L 20.0 Expanded Water Quality testing 100
Ammonia Nitrogen mg/L 0.05 ND ND ND ND
Antimony µg/L 1.0 Expanded Water Quality testing ND
Arsenic µg/L 1.0 2.7 3.8 5.0 3.5
Barium µg/L 2.0 110 120 110 120
Beryllium µg/L 1.0 Expanded Water Quality testing ND
Beta, Gross pCi/L 3.0 Expanded Water Quality testing 6.1
Boron mg/L 0.05 Expanded Water Quality testing 0.14
Bromide µg/L 5.0 86 93 99 87
Cadmium µg/L 0.5 ND ND ND ND
Calcium mg/L 1.0 72 67 66 73
Chloride mg/L 0.5 90 87 95 89
Chromium (Total) µg/L 1.0 ND ND ND ND
Cobalt µg/L 2.0 Expanded Water Quality testing ND
Copper (Dissolved) µg/L 2.0 Expanded Water Quality testing ND
Copper (Total) µg/L 2.0 ND ND ND 2.8
Dissolved Organic Carbon mg/L 2.8 Expanded Water Quality testing 3.5
Fluoride mg/L 0.05 Expanded Water Quality testing 0.36
Germanium µg/L 1.0 Expanded Water Quality testing ND
Hexavalent Chromi-um µg/L 0.02 Expanded Water Quality testing 0.10
Iron (Dissolved) mg/L 0.02 ND ND ND ND
Iron (Total) mg/L 0.02 ND ND ND 0.05
Lead (Total) µg/L 0.5 ND ND ND ND
Magnesium mg/L 0.1 27 26 26 28
Manganese µg/L 2.0 2.8 ND 4.4 8.1
Mercury µg/L 0.2 ND ND ND ND
Molybdenum µg/L 2.0 Expanded Water Quality testing 4.6
Nickel µg/L 5.0 Expanded Water Quality testing ND
A14 | 2019 Water Quality Annual Report
LAKE PLEASANT PARKWAY 2019

Constituent Units MRL Jan Feb Mar Apr May Jun Jul Aug Sep Oct Nov Dec
Nitrate as Nitrogen mg/L 0.05 ND ND ND ND
Nitrite Nitrogen mg/L 0.05 Expanded Water Quality testing ND
Orthophosphate as P mg/L 0.01 ND 0.45 ND ND
Orthophosphate as PO4 mg/L 0.031 ND 1.4 ND ND
Perchlorate µg/L 2.0 3.9 ND ND ND
Potassium mg/L 1.0 5.2 5.3 5.2 5.5
Radium 226 pCi/L 1.0 Expanded Water Quality testing ND
Radium 228 pCi/L 1.0 Expanded Water Quality testing ND
Selenium µg/L 5.0 ND ND ND ND
Silica mg/L 0.5 8.1 6.9 7.5 8.4
Silver (Total) µg/L 0.5 ND ND ND ND
Sodium mg/L 1.0 91 88 88 94
Specific Conduc-tance
µS/cm 2.0 980 960 1000 970
Strontium mg/L 0.01 1.1 1.0 1.0 1.1
Sulfate mg/L 0.5 230 220 240 220
Thallium µg/L 1.0 Expanded Water Quality testing ND
Total Dissolved Solids mg/L 10.0 600 600 630 630
Total Organic Carbon mg/L 0.3 Expanded Water Quality testing 3.0
Total Phosphorous as P mg/L 0.02 ND ND ND 0.047
Total Suspended Solids mg/L 10.0 ND ND ND ND
Turbidity NTU 0.1 0.44 0.41 0.6 1.6
Uranium µg/L 1.0 Expanded Water Quality testing 3.9
Vanadium µg/L 3.0 Expanded Water Quality testing 3.3
Zinc µg/L 20.0 Expanded Water Quality testing ND
LAKE PLEASANT PARKWAY 2019 (CONTINUED)
Central Arizona Project | A15

APPENDIX B. LAKE PLEASANT PROFILES
Central Arizona Project | B1

1500
1520
1540
1560
1580
1600
1620
1640
1660
1680
Jan
Feb
Mar
Apr
May Jun
Jul
Aug
Sep
Oct
Nov De
c
Lake
Ple
asan
t Ele
vatio
n (f
t)
Lake Pleasant Temperature Profile
50-60
60-70
70-80
80-90
Degrees (oF)
B2 | 2019 Water Quality Annual Report
LAKE PLEASANT TEMPERATURE PROFILE

1500
1520
1540
1560
1580
1600
1620
1640
1660
1680
Jan
Feb
Mar
Apr
May Jun
Jul
Aug
Sep
Oct
Nov De
c
Lake
Ple
asan
t Ele
vatio
n (f
t)
Lake Pleasant Dissolved Oxygen Profile
0-2
2-4
4-6
6-8
8-10
10-12
DO (mg/L)
Central Arizona Project | B3
LAKE PLEASANT DISSOLVED OXYGEN PROFILE