capa wp231 alvesbarbot - up · • c em pri sup ort e dby ft h go i fq a , w c nad . ¤ we would...
TRANSCRIPT

���������������� ��� ����������� ������ ����������� ������ ����������� ������ ����������� ������ ����������� ������ ����������� ������ ����������� ������ ����������� ���
������� ���������������� ���������������� ���������������� ���������������� ���������������� ���������������� ���������������� ���������
� ���� � ���� ������ ���� � ���� ������ ���� � ���� ������ ���� � ���� ������ ���� � ���� ������ ���� � ���� ������ ���� � ���� ������ ���� � ���� �������������
��������������������������������������������
������ ������� ������� ������� �������������������������
������������ ������� ������� ������� ���� ��� �������� �������� �������� ����� ���!�������!�������!�������!����
� ������ " # ����� ������ " # ����� ������ " # ����� ������ " # ���� �������������$������$������$������$�
���������������%����%����%����%�� ��� �������� �������� �������� ����� ���!������!������!������!��� �������� ���� �# ����� �# ����� �# ����� �# �
&� �!����'&� �!����'&� �!����'&� �!����'
��������� %��( �%��( �%��( �%��( � ���� ���# ������# ������# ������# ���
����������������� ����������������� ����������������� ����������������� ����������������� ����������������� ����������������� ����������������� �����(�����(�����(�����(
) �*) �*) �*) �* ��������
��+�����+�����+�����+�������������������� ����������������� ����������������� ����������������� ����������������� ����������������� ����������������� �����������������
� ,�-./'�� ,�-./'�� ,�-./'�� ,�-./'�0 ��0 ��0 ��0 ��,�-112,�-112,�-112,�-112

DO LOW COST CARRIERS HAVE DIFFERENT CORPORATE
GOVERNANCE MODELS?♦♦♦♦
Carlos Alves
CEMPRE••••, Faculdade de Economia do Porto email: [email protected] Rua Dr. Roberto Frias, 4200-464 Porto, Portugal
Telephone: + 351 225 571 100 Fax: + 351 225 505 050
Cristina Barbot CETE♦, Faculdade de Economia do Porto
email: [email protected] Rua Dr. Roberto Frias, 4200-464 Porto, Portugal
Telephone: + 351 225 571 100 Fax: + 351 225 505 050
ABSTRACT
In this paper, we investigate whether different business models in the same industry (passenger air transportation) lead to different corporate governance models. We found that low cost carriers (LCCs) organise their boards differently from full service carriers (FSCs), in order to achieve lower costs and the faster decision-making process that is required by their business model. We also found that LCCs and FSCs solve their potential agency cost problems differently. FSCs have more board committees in order to monitor management, and LCSs have a closer coincidence of interests between shareholders and management.
Keywords: corporate governance, low cost carriers. JEL codes: G34, L93.
♦ We wish to thank participants at the ATRS (Air Transport Research Society) 2006 Conference, Nagoya, Japan and at the 4th International Conference on Corporate Governance, hosted by the Centre for Corporate Governance Research, Birmingham for their comments. The usual disclaimer applies. • CEMPRE is supported by FCT through POCTI of the QCAIII, which is financed by FEDER and Portuguese funds. ♦ We would also like to thank FCT (Fundação para a Ciência e Tecnologia) for its financial support.
2
1. INTRODUCTION
Low cost carriers (LCCs) are frequently defined as airlines that supply no-frills flights for
which passengers pay low fares. No-frills means no expenses with catering and other free
inflight services and therefore the “low cost” designation for this type of firm. However,
studies on cost differentials between LCCs and full service carriers (FSCs) have shown that
being a “frills” or “no-frills” business is not the main reason for the difference in cost
structures. A study by ECA (2002) estimates that LCC costs per passenger are about 43% of
FSC costs. The estimates of Hansson et al. (2003) approach this percentage. What can explain
this wide cost differential? The ECA (2002) study shows that the main LCC cost advantages
are due to a higher seat density and no inflight catering, minimal handling fees, lower
reservation costs (including no agents’ commissions), higher aircraft utilisation, cheaper
airports, smaller administration costs, lower crew costs and homogeneous fleet.
Only the first two factors are directly related to the no-frills concept. However, according to
Hansson et al. (2003), “frills” account for only 5% whereas about 65% of the cost savings
come from the product choice, and among them, the most important are business pace, process
complexity and ticket distribution.
It is not catering and other amenities that distinguish LCCs and FSCs as firms but rather their
business model. As Franke (2004) states, LCC competitive conditions are a result of a different
business model, based on quick, streamlined processes, or, in the words of Hansson et al.
(2003), with “minimal complexity in products and processes”.
A business model includes the choice of the product and of production processes, as well as
that of a strategy for achieving a growing market share and higher market power. Taken in this

3
broad context, a business model is nested inside the firm, but its survival closely depends on
the firm’s behaviour in markets. When a firm pursues a business model, it must develop an
internal form of decision-making and control that is adequate to that aim. Therefore, we
postulate that a specific business model should require that a firm should have a specific
corporate governance model. In other words, could it be that different corporate governance
structures coexist within the same industry, on account of different business models, and
independently of the legal and institutional environment?
Research on the implications of a particular business model on board and other corporate
governance structures is still scarce. This paper attempts to contribute towards filling this gap
in literature, by trying to answer the question above. In particular, we investigate whether
LCCs are governed in a specific way, and differently from FSCs. Furthermore, we intend to
investigate whether that specificity reflects in cost differences as well as going beyond the
creation of decision-making mechanisms adapted to each business model, reaching monitoring
instruments and thus the promotion of a closer coincidence of interests between shareholders
and managers.
We analysed the governance of 49 airlines. Our results indicate that LCCs have less complex
and less expensive governance models, which enable greater agility in decision-making
processes. In contrast, their boards of directors, or at least some of their components, are not
designed to allow for a greater efficacy in monitoring and controlling top executives. But this
does not mean that LCC shareholders bear higher agency costs. In fact, in these companies,
executive directors have a higher share in equity capital, and this contributes to aligning their
interests with those of shareholders.
The paper is structured as follows. In Section 2 we present a few remarks on corporate

4
governance. Section 3 establishes the differences between LCC and FSC business models, and
how corporate governance models may relate to them. Section 4 deals with our dataset and
methodology. In Section 5 we present our models and results. Finally, Section 6 concludes.
2. CORPORATE GOVERNANCE: A FEW REMARKS
Corporate governance includes all mechanisms that exist in the firms in order to establish: i)
their objectives and the means of attaining those objectives; ii) control over the way those
means work in order to ensure their efficacy and the effective prosecution of the firms’ goals.
These mechanisms include the board of directors, the executive managers, and the relationships
among them and with both shareholders and stakeholders (OECD, 2004).
In many airlines, like in other firms, decisions are made by a few professional managers who
often are not shareholders or have small shares in the company’s capital. The separation
between those who decide and those who hold the capital has important effects on a firm’s
performance. Whenever shares are widely dispersed, agents (the professional managers) may
have a high level of discretionary power in their decisions. First, there is asymmetric
information between managers (for whom more information is available) and shareholders
(who dispose of less information) (Myers and Majuf, 1984). Then, the agents’ objective may
be the maximisation of their own utility, instead of shareholders’ wealth (Jensen and Meckling,
1976). It is also recognised that competition alone will not eliminate all the possibilities of
managers getting their own benefits (Nickell, 1996). Then there is a need for mechanisms that
solve or minimise the problem of separation between ownership and management, and lead to
efficient decision-making and to the pursuance of shareholders’ objectives.
Literature on corporate governance indicates that its structures differ according to the legal and

5
institutional environment of the firm. In this context, two main corporate governance systems
are identified (Shleifer and Vishny, 1997; Schmidt and Tyrell, 1997; and Franks and Mayer,
2001): the Continental system1, the main examples of which are Germany and Japan, though it
is extensive throughout Western Europe countries, and the Anglo-Saxon system2, which has
the US and the UK as paradigms. Literature reports that they have significant differences as
regards ownership structure (Breuer, 1998; Prigge, 1998; and La Porta et al., 1999)3, the
structure and behaviour of the board of directors, and evaluation and control of executive
management (Breuer, 1998; Prigge, 1998; and Wymeersch, 1998). Literature also reports that
capital markets, and in particular takeover threats, play a different role in management
discipline in both systems (Jensen, 1988; Franks and Mayer, 1996; Prigge, 1998; and
Holmstrom and Kaplan, 2001). Finally, mechanisms that promote a better coincidence of
interests between management and shareholders are also different. In particular, in the
Continental system it is less common to see a performance-based remuneration, or, when it
does exist, the variable share of remuneration is smaller (Charkham, 1995).
Differences between the two corporate governance systems are fundamentally the result of an
historic evolution based on political pressures and options, which were developed in specific
legal environments. The latter affect to what extent the firms’ ownership concentration and
financing are maintained and to what extent shareholders’ rights are safeguarded. (Roe, 1994;
La Porta et al., 1997). However, in both cases there is a certain degree of freedom, allowing
firms to make choices that are adequate to their needs and specificities. For example, some
papers claim that board design is influenced by the scope and complexity of the firm’s
operations (Fama and Jensen, 1983; Lehn et al., 2004; and Coles et al., 2005).
1 Also called relation-oriented system, bank-oriented system or insider system. 2 Which is sometimes called market-oriented system or outsider system. 3 Ownership structure is usually more dispersed in Anglo-Saxon countries (mainly in the US and UK) and more concentrated in Europe and Asia.

6
3. FSCS VERSUS LCCS
(i) FSCs and LCCs: Two Different Business Models
The FSC business model is based on hub and spoke networks, combining long and short haul
flights, often operated by code share agreements, and including airline alliances. The LCC
business model is based on point-to-point services with quick aircraft turnaround, in order to
maximise the utilisation of crews and aircrafts. Their strategy is based on tight cost control. As
these airlines entered markets later, they must strive to achieve growth, which may include
aggressive strategies, and so their decision making process must be quick. In Franke’s (2004)
words, this last feature may be called a “quick business pace”.
The main differences in the two carriers’ operations are based on (1) the airports they use,
which have different requirements according to the alternatives hub and spoke or point-to-
point, (2) on cost control and (3) on business pace.
(1) Airports – FSCs use large hub airports that are often congested and not designed for simple
and quick handling procedures, and where the availability of adequate slots is scarce. Low cost
carriers use mainly secondary airports with plenty of spare capacity and where they can often
design handling and other procedures according to their own needs.
(2) Cost control - Cost control is an important element of LCC management objectives. Airport
check-in and handling procedures must be reduced to the minimum as far as what the company
is responsible for. The small number of land staff must be efficient and both labour and other
factors related to handling procedures should be simple and closely monitored. FSCs work in a
more complex way. Negotiations of slots’ rights, code share agreements and alliances may lead
to considerable transaction costs. FSCs’ long haul flights increase labour costs, as these

7
companies must provide accommodation for crews. LCCs rely on a point-to-point service, and
crews often sleep at their own homes and so the companies save on accommodation and other
items. FSCs use different types of aircrafts, which will have implications in rising engineering
and maintenance costs and in the creation of their own maintenance firms, which, adding to
catering and other subsidiaries, makes their organisational structure more complex. The
homogeneity of the LCC fleet was chosen precisely to minimise these costs, and this type of
airline often relies on outsourcing for this aim.
As hub airports are often congested, FSCs are subject to higher congestion costs, which include
direct and indirect costs of delays. Delays are another source of costs, but they also mean
additional staff and departments to control connection delays and their effects. To these, add
environment costs and their monitoring, by means of environment committees. The use of
secondary, non-congested airports by LCCs reduces this kind of problem to the minimum.
Finally, we must say that the FSC hub and spoke networks need a complex and expensive
information system. Additionally, FSCs use revenue management systems, which also require a
large amount of information. LCCs use much more simple procedures.
(3) Business pace - Code share agreements and airline alliances mean that a FSC has
commitments that involve transaction costs and take a certain time to be concluded or resumed.
Additionally, hub and spoke networks themselves are difficult to redesign because of their
complexity and of the airline agreements they include. FSCs therefore experiment difficulties
in quickly accommodating changes in demand patterns, in regulatory legislation, or other kinds
of changes. As Hansson et al. (2003) put it, FSCs have a slower pace business model.
LCCs are not committed or allied to other carriers. In addition, they are young firms trying to
get market power on the routes they operate, and some of them have been extending their

8
network at a surprisingly quick pace.4 This strategy requires the necessary funds to finance new
routes and higher frequencies, as well as a quicker decision making process. In brief, the LCC
business model is based on a quick business pace, while for the FSC model a slower pace is
more adequate.
(ii) FSC and LCC Business Models: Corporate Governance Implications
Next we establish the main corporate governance requirements of LCC and FSC business
models and processes. We point out four dimensions that we consider to be most important.
The first dimension is saving costs. Corporate mechanisms implicate costs. For example, the
members of the board are remunerated. More members mean more expenses. Also, if the board
works in committees, this implies that non-executive directors dedicate more time to the
company. This dedication must be paid, and this means higher costs. We postulate that
corporate governance costs are positively related to variables like the number of directors, the
number of senior executives, and the number of board committees. This implies that LCCs
must have boards with fewer members, working with fewer committees, and a smaller number
of top executives, in order to minimise the corporate governance costs.
The second dimension is related to the quick (or slow) decision making process. In the
previous section, it was stated that the FSC hub and spoke model is a complex process at
several levels, namely with regard to the network itself, negotiations with airports, code share
agreements, fare structures and hub airports with congestion and environmental problems.
Routine changes, such as late arrivals due to congestion, overbooking, or others, and strategic
changes, and network re-definitions, are difficult to accommodate within a complex business
process. Therefore, FSC adjustments to changes and consequently their decision making
process are slow, leading to a more complex corporate governance system, with larger boards,
4 To mention an example, Ryanair launched 69 new routes in 2005 and Easyjet launched 59 routes in the same year.
9
more committees and more senior executives. LCCs’ simple business process allows for a
quick decision making process. This fact is enhanced by the need for a very tight cost control
and thus for the capacity for quick adjustment.
The other two dimensions are related to agency problems, due to ownership and management
separation, and include executive monitoring and executive incentives. The LCC business
model depends on a tight cost control and simple operations. Thus it becomes both easier and
more necessary to control operations, both routine and strategic, and agency problems should
be less likely to appear. It follows that LCCs should have a smaller number of independent
members on the board, and fewer committees (such as an audit committee and evaluation
committees). But at the same time the capacity for board monitoring of the executives’ actions
would be reduced. If this is true, we can expect higher information asymmetry in LCCs than in
FSCs, which may lead to less shareholder protection (3rd dimension).
In order to minimise agency problems, incentives to senior executives should also be stronger
in LCCs. Moreover, as these companies are striving to get higher market shares and therefore
market power, they should pursue more risky and aggressive behaviour and thus better
performance. To achieve good performance, high incentives are needed (4th dimension).
Some papers establish the relationship between the scope and the complexity of the firm and
some corporate governance issues. Fama and Jensen (1983), Lehn et al. (2004) and Coles et al.
(2005) address the issue of the relationship between the scope of operations and the board
structure. However, no relationship has been established between the firm’s corporate
governance model and its business model. Also, and as far as we know, there are no available
studies on the relationship between LCCs and FSCs and their corporate governance systems,
though some previous literature provides a few interesting insides that allow us to consolidate
some of our hypotheses.

10
Kole and Lehn (1999) have investigated how airlines adapted their governance structure to the
de-regulation process in the US, with a panel sample of 21 airlines from 1971 to 1972. They
found that this adaptation was done gradually, and that new entrants have a more concentrated
ownership structure, smaller boards and more equity-based pay.
Carney and Dostaler (2006) establish a typology of airlines, according to the relation between
ownership and corporate governance. They come to three types of governance systems: (i)
managerial governance, (ii) entrepreneurial governance, (iii) stakeholder governance.
According to these authors, LCCs seem to fit better into the pattern of entrepreneurial
governance, but so do regional, cargo and express airlines. This pattern is characterised by a
more direct control of management decisions, and so here it becomes possible to make quicker
and more risky decisions, though there is a disadvantage with regard to capital needs.
Though neither of the said papers distinguish between LCCs and FSCs, it is possible to infer,
but with some caution, that the quick pace business model of the LCCs works better with less
separation between ownership and control, and with a smaller board of directors. This is in line
with some of the hypotheses we put forward in the previous section.
4. DATASET AND METHODOLOGY
(i) Data
Our sample contains 49 airlines. To select the sample, we started with IATA’s 265 members
(IATA website), which represent about 94% of the world’s scheduled air traffic, spread across

11
8 regions (Africa and the Indian Ocean, Asia and the Pacific, China, Europe, Russia and the
CIS, the Middle East, North America, and Latin America). Of these airlines, and after
withdrawing cargo and postal services, those for which financial and corporate governance
data was available on the respective websites were chosen (36 companies). Since many LCCs
are not IATA members, 13 of these companies were added. They were taken from the 25
largest LCCs in the world, in terms of number of passengers in 2004, according to Airline
Business (2005); we included in the sample those for which data was available. Websites were
the main source of the corporate governance data and financial reports. We also got
information from companies’ stock exchanges and securities commissions, and from
Worldscope Databases. Data was collected for 2005.
Airlines are distributed across Continents in the following way: 34.7% in Europe, 28.6% in
Asia, 26.5% in America, 8.2% in Australia and New Zealand, and 2% in Africa. Of these
airlines, 15 are LCCs, 43 are listed on a stock exchange, and 26 are Anglo-Saxon companies.
(ii) Main Variables
All details on the variables used in the performed regressions can be found in Appendix 1.
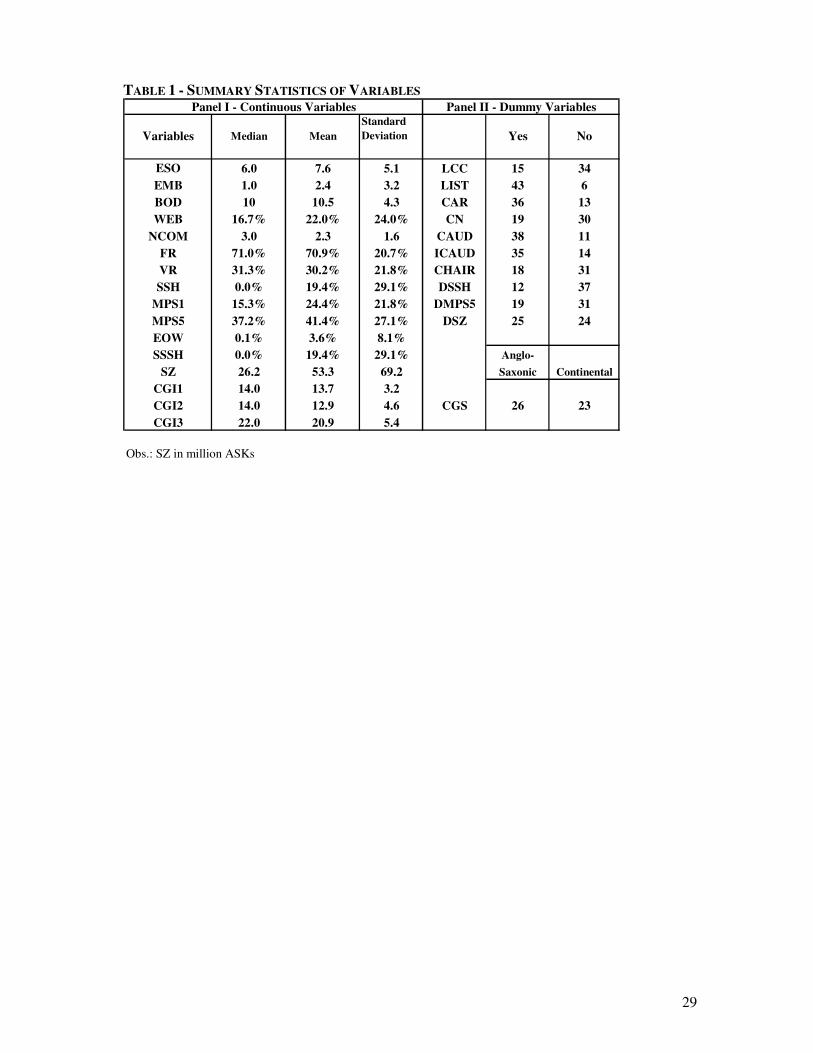
Table 1 describes the main statistics of continuous variables (Panel 1) and dummy variables
(Panel 2).
Insert Table 1
The average number of the board of directors (BOD) is 10.5, whereas 50% of the airlines have
fewer than 10 members. The same numbers for members of the executive committee included
in the board (EMB) are 2.4 and 1.0, with 10 airlines without executives on the board. Senior
executives register an average number of 7.6, with a wide variation interval, between 1 and 24

12
(ESO).5 The mean number of board committees (NCOM) is 2.3, while 50% of the airlines have
fewer than 3 committees. Two airlines have 6 committees (the largest number) and 9 airlines
have no committees at all. The percentage of the variable in total executive remuneration (VR)
ranges between 0% and 86%, but half of the airlines are paying their executives at least 31.3%
in bonuses, shares, options on shares and other benefits. The State has a percentage of voting
rights (SSH) exhibiting a mean of 19.4% and ranging between 0% and 100%. Capital
concentration in the 5 major shareholders (MPS5) varies between 0% and 95%, with a mean of
41.4%. Executive ownership (EOW) is also quite variable, and the mean of 3.6% hides the fact
that executives hold between 0% and 27.4% of the capital.
As regards our dummy variables, 15 airlines are LCCs and 34 FSCs. Only 6 companies are not
listed on any stock exchange (LIST), and most of them have an evaluation and remuneration
committee (CAR). Moreover, 38 have an audit committee (CAUD), and in 35 cases the
majority of the audit committee members are outside members of the board (ICAUD).6 In 19
companies there is also a nominations committee (CN). In addition, in most cases, the
chairman and CEO are different people (CHAIR). The distribution of airline nationality
between Anglo-Saxon countries (considered as those belonging to the British Commonwealth
of Nations) and others is fairly equal, with 47% of the airlines based in non Anglo-Saxon
countries.
To assess the main features of corporate governance that account for the firms’ behaviour, we
built two corporate governance scores.7 The first one is CGI1, and intends to capture which
characteristics of the governance system account for the complexity and celerity in decision-
5 Senior executives are the members of the executive committee or, if the company has no executive committee, the top executives (i.e. the first line of managers) identified by the company. 6 We approach the outside members of the board by the number of non-executive members of the board. 7 Many authors have quantified the governance using scores. This is the case, for instance, of Bhagat and Black (2002) and Gompers et al. (2003).

13
making processes. As described in Appendix 1, GGI1 is positively biased towards five
corporate governance features that may increase the complexity of decision-making processes,
namely: the separation between chairman and CEO, the number of senior executives, the
number of board members, the number of board committees, and the proportion of outsiders on
the board.
The second corporate governance index, CGI2 is aimed at capturing the control of management
discretionary power in order to reduce agency problems, and is also described in Appendix 1.
A higher value of CGI2 indicates tighter management control, by means of combining several
variables: the separation between chairman and CEO, the number of senior executives, the
number of board members, the number of board committees, the proportion of outsiders on the
board, the existence of an evaluation and remuneration committee, the existence of a
nomination committee and a positive bias towards the fact that the audit committee, if existent,
has a majority of board members that are outsiders.
(iii) Methodology
In order to evaluate whether LCCs and FSCs differ with regard to costs, the celerity of
decision-making processes and the control and motivation of management, we performed two
types of regressions. First, we regressed a set of dependent (corporate governance) variables
against a set of dummy independent variables (including a dummy that identifies LCCs).
Second, we used two binary regressions (probit) to obtain a relationship between the
probability of the airline being (or not) an LCC, and some corporate governance variables.
It is well recognised in literature that in corporate governance studies we must always consider
the potential endogeneity of the explanatory variables. For instance, if we try to distinguish

14
LCCs and FSCs by means of models that include ownership and corporate governance
variables as regressors, these variables may be endogenous. LCC versus FSC characteristics
may influence the ownership structure and the ownership structure may influence, among other
variables, the board size and structure. In this context, estimators are biased and inconsistent if
the latent error terms are heteroscedastic, and the bias may be severe (see, among others,
Bhagat and Jefferis, 2005). Some authors use structural models of simultaneous equations
(Agrawal and Knoeber, 1996) or else orthogonalise the endogenous variables (Denis and Sarin,
1999) to control for endogeneity. However, others claim against both the orthogonalising
process and the models of simultaneous equations (Boon et al., 2004), and still others argue
that simultaneous equations tend to yield results that are highly sensitive to the specified model
and the identifying assumptions (Bhagat and Jefferis, 2005). In this paper, we follow Bhagat
and Jefferis (2005) and we apply dummy variable regressions and probit regressions, using the
bootstrapping procedure to correct the bias mentioned above. We apply the bootstrapping of
the pairs (as in Bhagat and Jefferis, 2005) instead of the bootstrapping of the residuals because
the first procedure is less sensitive to assumptions (see Efron and Tibshirani, 1993).
The stylised version of the dummy regression model is:
CG = b0 + b1LCC + b2LIS + b3CGS + b4DSSH + b5DMPS5 +b7DSZ. [1]
where CG is the corporate governance variable that we try to relate to the type of airline and
LCC, LIST, CGS, DSSH and DMPS5 are dummy variables. LCC is a dummy variable that
takes the value 1 if the company is a low cost carrier, and 0 otherwise. LIST is a dummy
variable that takes the value 1 if the company is listed on the stock exchange and 0 if not. CGS
is a dummy variable that takes the value 1 if the company’s country is Anglo-Saxon and 0
otherwise. DSSH and DMPS5 are ownership dummy variables. The first one controls for state
ownership, and takes the value 1 if the state has the majority of the voting shares and 0
otherwise. The second dummy takes the value 1 if the five major private shareholders have the

15
majority of voting shares and 0 if not.
Our aim is to draw conclusions about the sign and the significance of the coefficient b1. We
include CGS as a control variable because, as we said before, literature reports that corporate
governance mechanisms differ between Anglo-Saxon countries and the others (see, among
others, Shleifer and Vishny, 1997; Schmidt and Tyrell, 1997; and Franks and Mayer, 2001).
The variable LIST is included because listed companies are subject to some organisational
constraints that are not applicable tonon listed companies.8
It has been suggested that the scope of operations influences the size of the board (BOD) and
structure (Fama and Jensen, 1983; Lehn et al., 2004; and Coles et al., 2005). Therefore it is
necessary to control the effect on board size and those variables that are connected with it
(ESO, CGI1 and CGI2) by a variable that expresses the size of airlines (SZ). In the air travel
industry it is not adequate to evaluate a firm’s size by its assets. A suitable measure is output,
which is computed (Holloway, 2003) as the number of ASKs (available seat kilometres). The
variable SZ represents the size of airlines, measured as the average of the number of ASKs in
the last two years, and DSZ is a dummy that takes the value of 1 if the airline has a number of
ASKs higher than the median of SZ, and 0 otherwise.
In the probit model we estimate one equation:
LCC = b0 + b1CGI1 + b2WEB + b3NCOM + b4 DSC + b5EOW + b6VR + b7SZ. [2]
We intend to obtain information about how any of the independent variables indicates if an
airline is a LCC or not. With this information, it may be concluded which corporate governance
features are different in LCCs and FSCs.
8 Consider, for instance, the effect of the Sarbanes-Oxley act on companies listed in the US.

16
5. EMPIRICAL RESULTS
5.1 DUMMY VARIABLE REGRESSIONS
Results of the dummy variable regressions are presented in Table 2. We can divide the 15
dummy equations into four groups. Equations (1) to (5) are related to corporate governance
costs. Equations (1) to (8) refer to the airlines’ decision-making processes, independent
variables regarding the board of directors, namely its composition and structure, and the
number of committees depending on it.9 Equations (5), (6), (7) and (8) also provide
information about management control mechanisms in LCCs and FSCs. Equations (12) to (15)
aim to eventually distinguish shareholding structures between both types of airlines, ownership
structure allowing an analysis of the way executives are effectively monitored and controlled
by shareholders. Finally, equations (11) and (12) allow us to check whether the two types of
airlines are different as regards mechanisms that promote the coincidence of shareholder and
executive interests, which may reduce agency problems.
- Insert Table 2 -
(i) Do LCCs have less expensive and less complex decision-making structures?
Results clearly suggest that LCC governance structure enables less expensive and less complex
decision-making processes. Equations 1 to 4 show that LCCs have smaller boards of directors
and a smaller number of senior executives.10 According to our results, the size of boards in
FSCs exceeds by 3.30 members the size of boards in LCCs (equation 1). The same difference 9 We suppose that smaller boards and numbers of committees increase the celerity of decision-making processes. 10 We have built a shorter version of equations (1) to (12), by withdrawing but decided not to include it in the text. In this version, conclusions about LCC coefficients and significances remain the same. This former version may be requested from the authors.

17
is of 4.66 for the number of senior executives (ESO) (equation 3). This means, at least
potentially, fewer corporate governance costs. Thus, both everyday decisions and strategic ones
are made and controlled by a smaller number of people in LCCs, which indicates that the
respective process is potentially quicker in these companies.
The number of committees is also smaller in LCCs, though the significance of the respective
coefficient is only of 10% (equation 5). The existence of a large number of committees
increases corporate governance costs and the complexity of decision-making, both by creating
several decision centres and by requiring additional formalisation of the decisions.11
Another characteristic that distinguishes the LCC from the FSC is the weight of outside
directors on the board. The variable WEB corresponds to the percentage of executive (thus,
inside) directors of the total number of members of the board. Some literature reports evidence
that boards of directors dominated by outsiders are slower in deciding and have less propensity
to carry out spending on R&D (Baysinger et al., 1991) or to continue pursuing consistent
strategies of innovation aimed at the creation of new areas of business and in the assumption of
commercial risks (Zahra, 1996). The dominant idea is that outside directors have neither
enough information nor knowledge to quickly understand the component techniques of their
respective businesses (Zechauser and Pound, 1990), and they do not dedicate enough time to
company matters (Porter, 1992; and Turnbull, 2000). Thus the variable WEB will be positively
correlated with the agility and quickness of the decision process. Equation 6 shows that LCCs
have a higher percentage of executives on the board, thus being more compatible with a quick
pace business model.
11 Consider, for instance, the nomination process with and without a nominations committee or the investment decisions with or without investments committees.

18
The difference between LCCs and FSCs at the level of decision structures, in terms of the
potential agility of the decision process, is also visible in the corporate governance index built
for that effect (CGI1). The negative and significant coefficient obtained for variable LCC
(equation 7), expresses evidence that LCCs have lighter governance structures, and so
decision-making is faster, which accounts for a quick business pace, as defined in section 1.12
However lower corporate governance costs and faster and easier decision-making processes
may be countervailed by a smaller power of monitoring and controlling management. The next
question refers to the possible existence of a trade-off between these apparently opposing
features.
(ii) Are LCC corporate governance structures less prone to control and monitor management?
Results for the next set of equations suggest that LCC control and monitoring structures are
neither (at least, not as much as those of the FSC) follow the usual recommendations of good
governance codes (Denis and McConnel, 2003)13 nor are they what literature often refers to as
efficient for the sake of management control and monitoring (Dahya et al., 2002). A smaller
number of board committees and a lower percentage of outside directors may be understood as
leading to a potentially smaller control over acts and omissions of executives.
The second corporate governance score, CGI2, was regressed against the same dummies, and
results show that the coefficient of LCC is negative (as expected) but not significant. This
result holds when DSZ is included. It is therefore not possible to conclude that there are
12 When the variable DSZ is added, results do not change much. DSZ is not significant in any of the equations where it was included. The variable LCC coefficient always keeps the sign and the significance level. 13 In some countries, these recommendations were codified into law. This is the case of the Sarbanes-Oxley Act of 2002, in the US, which includes, for example, a requirement that boards have audit committees that consist only of independent outside directors.
19
relevant differences in this score for the two types of firms.14 So, while the numbers of board
members, executives and committees suggest that LCCs are organisations that do not allow for
management control and monitoring as much as FSCs do, the index CGI2 does not reveal the
same conclusions.
Coefficients for LIST and CGS are as expected. In fact, firms from Anglo-Saxon countries
have larger numbers of board committees (equation 5), which confirms that internal control (or
the control of the board over management) is a priority in these countries (Shleifer and Vishny,
1997; Schmidt and Tyrell, 1997; and Franks and Mayer, 2001). But monitoring mechanisms
are not the only instruments for controlling firms’ top executives. It is usually recognised that
their discretionary power is smaller in firms with higher ownership concentration (Zeckhauser
and Pound, 1990) and that a firm’s performance is positively related to inside directors’
shareholding (Morck et al., 1988 and McConnell and Servaes, 1990). Moreover, it is also
widely recognised that a managers’ remuneration mechanism that has a higher share depending
on their performance contributes to a coincidence of interests between them and shareholders
(Hall and Liebman, 1998; and Morgan and Poulsen, 2001). Next we address this question, in
order to evaluate if the non-conclusive result for CGI2 may be enlightened by means of the
analysis of these variables for LCCs and FSCs.
(iii) Do LCCs and FSCs have different ownership structures?
Results presented in Table 2 show that there are significant differences between LCCs and
FSCs concerning executive ownership (equation 12), State ownership (equation 10) and State
plus major shareholders ownership (equation 15). However, the same differences are not found
in the case of the five major private shareholder ownership (equation 9). Executive ownership
14 We tested other versions of CGI2, by changing the score of the variables it includes, but we never obtained significance for the results. These tests are omitted here but may be requested from the authors.

20
is significantly higher in LCCs. This leads to a tighter coincidence of interests between them
and shareholders, and results suggest that a higher executive ownership is the incentive LCCs
have adopted to promote the closeness of interests between shareholders and managers and
thus better performance.
Though not significant, LCC has a positive coefficient in equation (13). Furthermore, the LCC
coefficient has a higher absolute value in equation (14) than in equation (15), suggesting that it
is the State capital that makes the difference. This may be a hint that private ownership
concentration is higher in LCCs.
(iv) Do LCCs and FSCs have different remuneration schemes?
Equation (11) shows that there are no relevant differences in remuneration schemes between
the two types of carriers. We regressed VR, the share of variable in total remuneration against
the same dummies, and LCC proves not to be statistically significant, though it has a positive
coefficient. However, VR is higher in listed and in Anglo-Saxon airlines. This last result
confirms the numbers reported by Charkam (1995).
(v) Are there other relevant variables?
Other control variables might be added in the dummies’ regressions. First, if a company is
distressed, this may account for eventual changes in corporate governance models, as a result
of shareholder intervention in order to re-establish financial equilibrium, and models may
differ from those the company chooses in a normal situation. In our database, we found two
companies in a distress situation. To account for this fact, we used two alternative procedures.
First, we performed all regressions excluding the observations for these two companies.
Results did not differ from the original ones. Then we built another dummy variable (DIS) that
accounts for the fact that a company is (or not) distressed, and performed all regressions adding

21
this variable. Again, no substantial change in results regarding the significance and coefficients
of variables was found. Coefficients of LCC keep the same sign and significance. DIS is only
significant when explaining the variable BOD. This is an interesting finding, meaning that in
distressed firms the number of board members increases by an average of 6.3 members as a
result of the need for more control over executives. Also, DIS is not significant in explaining
the variable ESO.
Second, we have controlled for the age of airlines and this variable did not show any
significance. It is true that LCCs are younger firms. In spite of that fact, FSCs seem to have a
corporate governance model that is more according both to OECD’s principles (OECD, 2004)
and with currently considered corporate governance best practices, such as regarding the
separation between chairman and CEO, the existence of a number of board committees and a
higher proportion of outsiders in the boards.
5.2. Probit Regressions
In order to confirm the previous dummy variables results we estimated a probit model, like in
Bhagat and Jefferis (2005). Now the dependent variable is the dummy LCC, which assumes
the value “1” if the airline is a LCC and the value “0” if it is a FSC, while independent
variables are continuous and represent several corporate governance dimensions. This
procedure makes it possible to estimate simultaneously the effects of several dimensions of
corporate governance, such as the celerity of decision-making, control and monitoring
structures and ownership structure. Table 3 summarises the results.
22
- Insert Table 3 -
The model leads to the conclusion that the CGI1 score is significant. This second methodology
confirms that LCC decision mechanisms are less complex. This confirmation makes more
robust the result that LCC governance systems are designed in order to have a priority for
smaller and more agile decision structures, in the characteristics that CGI1 captures.
Variables WEB and NCOM, which were significant in the dummies regressions, are not here
any more. Therefore, LCCs and FSCs are not significantly different from the point of view of
the number of board committees and executive members, which confirms the results obtained
in the previous section.
This model also confirms that executive shareholding (EOW) is a relevant variable in
distinguishing the two types of airlines. And here the difference concerning management
incentives is reinforced by the statistical significance of VR, the percentage of manager
variable remuneration. This model enlightens a fact that had been left somewhat ambiguous in
the previous section. Here it is clear that LCCs have a greater coincidence of interests between
top executives and shareholders than FSCs, and therefore fewer potential agency costs.
However, the results with the inclusion of SZ may change this conclusion. CGI1 and EOW are
still significant at less than 5%, but VR loses its significance. This suggests that LCCs use
higher executive shares in capital as incentives for a better performance and for reducing
agency problems, rather than a higher share of variable remuneration.
6. CONCLUSION
23
The main objective of this paper was to investigate whether LCCs have different corporate
governance systems, when compared with FSCs. In fact, much has been written about LCC
competitive conditions, but very little about their corporate governance systems as allowing for
these conditions. Some papers establish the relationship between the scope and the complexity
of the firm and some corporate governance issues. However, no relationship has been
established between the firm’s corporate governance model and its business model. Also, and
as far as we know, there are no available studies on the relationship between LCCs and FSCs
and their corporate governance systems. But some previous studies provide a few interesting
insides that allow us to consolidate some of our hypotheses. In other words, little has been said
about the inside of LCCs when considered as firms. This paper contributes towards filling this
gap.
We first established a relationship between the two types of carrier business models, as
described in literature, and corporate governance dimensions that would make those models
work. Then, two sets of regressions were performed in order to establish the differences in
corporate governance systems between LCCs and FSCs. The use of the bootstrap technique
avoids endogeneity problems and makes our results more solid.
Our findings indicate that: (i) LCCs have lighter and smaller governance structures, with fewer
board committees, making way for faster and more agile and flexible decision-making
processes, (ii) LCCs offer higher incentives to managers, based mainly in senior executive
shareholdings, which reduces potential agency costs and encourages better performances.
Our findings have several implications. First, they suggest that a successful LCC should opt for
corporate governance models exhibiting the above-mentioned characteristics. Heavier
governance structures (inherited or belonging to the “parent” airline) may represent an

24
additional reason in explaining the failure of some FSC low-cost subsidiaries. Second, when
studying the effects of LCC entry in many markets, a subject about which there is extensive
literature, corporate governance should be an important component of competitive conditions
and not only costs and networks. Third, any kind of business model should be related to a
corporate governance mechanism that is adapted to it and that makes it work, and so this may
also happen, for instance, with regional airlines. And, fourth, when positioning LCCs in the air
travel industry under new conditions (as with open skies or the sixth right), it is important to
consider the impact of the eventual changes on their business models (for instance hubbing,
long-haul, and consequent network changes) in their governance structures.

25
REFERENCES:
Agrawal, A. and Knoeber, C., 1996. Firm performance and mechanisms to control agency problems between managers and shareholders. Journal of Financial and Quantitative Analysis, 31 (3), 377-397.
Baysinger, B., Kosnik, R. and Turk, T., 1991. Effects of board and ownership structure on corporate R&D strategy. Academy of Management Journal, 34 (1), 205-214.
Bhagat, S. and B. Black (2002). The non-correlation between board independence and long-term firm performance. Journal of Corporation Law, 27, 231-273.
Bhagat, S. and Jefferis, R. Jr., 2005. The Econometrics of Corporate Governance Studies, MIT Press.
Boon, A., Field, L. Karpoff, J. and Raheja, C., 2004. The determinants of corporate board size and composition: An empirical analysis. University of Pennsylvania State Working Paper.
Breuer, R., 1998. The role of financial intermediaries and capital markets. In Hopt, K., H. Kanda, M. Roe, E. Wymeersch and S. Prigge (editors), Comparative Corporate Governance - The State of The Art and Emerging Research, 537-544, Oxford and New York: Oxford University Press.
Carney, M. and Dostaler, I., 2006. Airline ownership and control: A corporate governance perspective. Journal of Air Transport Management, 12(2), 63-75.
Charkham, J., 1995. Keeping Good Company: A Study of Corporate Governance in Five Countries, Oxford and New York: Oxford University Press.
Coles, J., Daniel, N. and L. Naveen (2005). Boards: Does one size fit all?. Arizona State University Working Paper.
Dahya, J., McConnell, J., and Travos, N., 2002. The Cadbury committee, corporate performance, and top management turnover. Journal of Finance, Vol. 57 (1), 461-483.
Denis, D. and Sarin, A., 1999. Ownership and board structure in publicly traded corporations. Journal of Financial Economics 52, 187-223.
Denis, D. and McConnell. J., 2003. International corporate governance. Journal of Financial and Quantitative Analysis 38, 1-36.
ECA, European Cockpit Association, 2002. ECA ISG presentation on low cost carriers, IFALPA Conference, Stavanger.
Efron, B. and Tibshirani, R., 1993. An Introduction to the Bootstrap. Chapman & Hall.
Fama, E. and Jensen, M., 1983. Separation of ownership and control. Journal of Law and Economics 26, 301-325.
Franke, M., 2004. Competition between network carriers and low-cost carriers-Retreat battle or breakthrough to a new level of efficiency? Journal of Air Transport Management, 10 (1), 15-22.

26
Franks, J. and Mayer, C., 1996. Hostile takeovers and the correction of managerial failure. Journal of Financial Economics, 40 (2), 163-181.
Franks, J. and Mayer, C., 2001. The ownership and control of German corporations. CEPR Discussion Paper, no. 2898.
Gompers, P., Ishii, J. and Metrick, A., 2003. Corporate governance and equity prices. Quarterly Journal of Economics, 118, 141-163.
Hall, B. and J. Liebman, J., 1998. Are CEOs really paid like bureaucrats? Quarterly Journal of Economics 113 (3), 653-691.
Hermalin, B. and Weisbach, M., 2003. Boards of directors as an endogenously determined institution: A survey of economic literature. FRBNY Economic Policy Review 9, 7-26.
Holloway, S., 2003. Straight and Level: Practical Airline Economics, Ashgate Publishing Group, 2nd edition.
Hansson, T., Ringbeck, J., and Franke, M., 2003. Flight for survival: A new business model for the airline industry, Strategy+Business, 31, 78-85.
Holmstrom, B. and Kaplan, S., 2001. Corporate governance and merger activity in the United States: making sense of the 1980s and 1990s. Journal of Economic Perspectives, 15 (2), 121-144.
Jensen, M., 1988. Takeovers: Their causes and consequences. Journal of Economic Perspectives, 2, 21-48.
Jensen, M. and Meckling, W., 1976. Theory of the firm: Managerial behavior, agency costs, and ownership structure. Journal of Financial Economics, Vol. 3 (4), 305-360.
Kole, S. and Lehn, K., 1999. Deregulation and the adaptation of governance structure: The case of the US airline industry. Journal of Financial Economics, 52, 79-117.
La Porta, R., Lopez-De-Silanes, F., Shleifer, A. and Vishny, R., 1997. Legal determinants of external finance. Journal of Finance, Vol. 52 (3), 1131-1150.
La Porta, R., Lopez-De-Silanes F. and Shleifer, A. 1999. Corporate ownership around the world. Journal of Finance, 54 (2), 471-518.
Lehn, K., Patro, J. and Yang, T., 2004. Determinants of the size and structure of corporate boards: 1935-2000. University of Pittsburgh Working Paper.
McConnell, J. and Servaes, h., 1990. Additional evidence on equity ownership and corporate value. Journal of Financial Economics, 27 (2), 595-612.
Morck, R., Shleifer, a. and Vishny, r., 1988. Management ownership and market valuation. Journal of Financial Economics, 20, 293-315.
Morgan, A. and Poulsen, A., 2001. Linking pay to performance compensation proposals in the S&P 500. Journal of Financial Economics, 62 (3), 489-523.
27
Morrell, P., 2005. Airlines within airlines: An analysis of the US network airline responses to low cost carriers. Journal of Air Transport Management, Vol. 11 (5), 303-312.
Myers, S. and Majluf, N., 1984. Corporate financing and investment decisions when firms have information that investors do not have. Working Paper, no. W1396, National Bureau of Economic Research.
Nickell, S., 1996. Competition and corporate performance. Journal of Political Economy, Vol. 104 (4), 724-746.
OECD (2004). OECD Principles of corporate governance. OECD Publications, www.oecd.org.
Porter, M., 1992. Capital disadvantage: America’s failing capital investment system. Harvard Business Review, Vol. 70 (5), 65-82.
Prigge, S., 1998. A survey of German corporate governance. in Hopt, K., Kanda, H., Roe, M., Wymeersch, E. and Prigge, S. (Eds.), Comparative Corporate Governance - The State of The Art and Emerging Research, pp. 1045-1199, Oxford and New York: Oxford University Press.
Roe, M., 1994. Strong Managers Weak Owners: The Political Roots of American Corporate Finance. In: Keasey, K., Thompson, S. e Wright, M. (Eds.), Corporate Governance, Vol. I, pp. 87-145, Cheltenham (UK) and Northampton (Mass., EUA): Edward Elgar Publishing Limited.
Schmidt, R. and Tyrell, M., 1997. Professional forum: Financial systems, corporate finance and corporate governance. European Financial Management, Vol. 3 (3), 333-361.
Shleifer, A. and Vishny, R., 1997. A survey of corporate governance. Journal of Finance 52 (2), 737-783.
Turnbull, S., 2000. Ethics under the carpet. Journal of the Securities Institute of Australia 1, 28-34.
Wymeersch, E., 1998. A status report on corporate governance rules and practices in some Continental European states. in Hopt, K., Kanda, H. Roe, M., Wymeersch, E., and Prigge, S. (Eds.), Comparative Corporate Governance - The State of The Art and Emerging Research, pp. 943-1044, Oxford and New York: Oxford University Press.
Zahra, S., 1996. Governance, ownership, and corporate entrepreneurship: The moderating impact of industry technological opportunities. Academy of Management Journal 39 (6), 1713-1775.
Zechauser, R. and Pound, J. 1990. Are large shareholders effective monitors?: An investigation of share ownership and corporate performance. in Glenn Hubbard (Ed.), Asymmetric Information, Corporate Finance, and Investment, Chicago: University of Chicago Press, 1990, 149-180.

28
APPENDIX 1
LIST AND DESCRIPTION OF VARIABLES
DUMMIES
LCC = 1 if the airline is a LCC and 0 if it is a FSC; CGS = 1 if the airline is from an Anglo-Saxon country and 0 otherwise (we considered Anglo-Saxon countries as those belonging to the British Commonwealth of Nations, in January 2006); CHAIR = 1 if there is a separation between Chairman and CEO and 0 otherwise; LIST = 1 if the airline is listed on any stock exchange and 0 otherwise; CAR = 1 if the airline has an evaluation and remuneration committee and 0 otherwise; ICAUD = 1 if the airline has an audit committee and the outside directors are the majority of the members of this committee and 0 otherwise; DMPS5 = 1 if the five major shareholders hold more than 50% of the capital and 0 otherwise; DSSH = 1 if the share of voting capital belonging to the State is higher than 50% and 0 otherwise, DSZ = 1 if SZ (see below) is higher than its median and 0 otherwise. OTHER VARIABLES BOD = number of members of the board of directors; EMB = number of members of the executive committee who also belong to the board of directors; WEB=EMB/BOD = percentage of executives on the board; ESO = number of senior executives; NCOM = number of board committees (Audit Committee, Nomination Committee, Evaluation and Remuneration Committee, Corporate Governance Committee, Strategic Committee, Finance and Investment Committee, etc.), but not the Executive Committee; VR = share of variable remuneration of senior executives; SSH = share of voting capital belonging to the State; MPS5 = percentage of capital held by the five major shareholders DSC = percentage of free float = 1-SSH-MPS5; CSC = percentage of concentrated shareholder voting capital = 1-DSC; EOW = percentage of executive ownership; SZ = million ASKs, average of the last two years CORPORATE GOVERNANCE INDEX VARIABLES CGI1 = CHAIR*4 + Quartile of ESO (“4” points for the major, “3” points for the second, “2” points for the third and “1” point for the minor) + Quartile of BOD (“4” points for the major, “3” points for the second, “2” points for the third and “1” point for the minor) + (NCOM/MaxNCOM)*4 + “2” points if the majority of the board of directors are outside members + “2” points if 2/3 of the board of directors are outside members. CGI2= CHAIR*4 + “4” points if the number of executives lies between 4 and 7, “0” otherwise + “2” points if the majority of the board of directors are outside members + “2” points if 2/3 of the board of directors are outside members + CAR*2 + CN*2 + ICAUD*4.
29
TABLE 1 - SUMMARY STATISTICS OF VARIABLES
Variables Median MeanStandard Deviation Yes No
ESO 6.0 7.6 5.1 LCC 15 34EMB 1.0 2.4 3.2 LIST 43 6BOD 10 10.5 4.3 CAR 36 13WEB 16.7% 22.0% 24.0% CN 19 30
NCOM 3.0 2.3 1.6 CAUD 38 11FR 71.0% 70.9% 20.7% ICAUD 35 14VR 31.3% 30.2% 21.8% CHAIR 18 31SSH 0.0% 19.4% 29.1% DSSH 12 37
MPS1 15.3% 24.4% 21.8% DMPS5 19 31MPS5 37.2% 41.4% 27.1% DSZ 25 24EOW 0.1% 3.6% 8.1%SSSH 0.0% 19.4% 29.1% Anglo-
SZ 26.2 53.3 69.2 Saxonic ContinentalCGI1 14.0 13.7 3.2CGI2 14.0 12.9 4.6 CGS 26 23CGI3 22.0 20.9 5.4
Obs.: SZ in million ASKs
Panel I - Continuous Variables Panel II - Dummy Variables

30
TABLE 2 - DUMMY VARIABLE REGRESSIONS
Obs.: i) T-statistics based on the bootstrap estimates are noted below the coefficients. Each set of estimates is based on bootstrap 200 replications of the sample. In each resample, without replacement, 40 observations were included; ii) N is the number of companies included in each pool of regressions (the number varies because of missing financial data); the dependent and independent variables were calculated as described in the appendix; iii) the symbols ***, ** and * show statistical significance at 1%, 5% and 10%, respectively; iv) the alternative hypothesis is one-sided.
Dependent Variables N LCC LIST CGS DSSH DMPS5 DSZ
[1] BOD 49 10.50 *** -3.30 ** 1.45 1.29 -2.18 * -1.114.42 -2.26 0.68 0.92 -1.30 -0.77
[2] BOD 49 10.97 *** -3.84 *** 2.04 1.30 -2.37 * -1.39 -1.344.38 -2.34 0.88 0.91 -1.33 -0.92 -0.86
[3] ESO 49 9.91 *** -4.66 *** -0.98 -1.47 -0.77 1.993.59 -2.67 -0.40 -0.87 -0.39 1.16
[4] ESO 49 10.21 *** -5.00 *** -0.60 -1.46 -0.89 1.82 -0.863.54 -2.57 -0.22 -0.86 -0.42 1.03 -0.46
[5] NCOM 49 1.74 ** -0.76 * 0.27 1.60 *** -0.49 -0.122.03 -1.44 0.36 3.18 -0.82 -0.24
[6] WEB 49 0.35 *** 0.11 * -0.16 * 0.00 0.03 -0.082.58 1.32 -1.31 -0.03 0.31 -0.93
[7] CGI1 49 11.16 *** -3.18 *** 1.87 0.63 -0.32 1.88 **6.63 -3.07 1.25 0.63 -0.27 1.83
[8] CGI1 49 10.64 *** -2.58 *** 1.22 0.61 -0.11 2.18 ** 1.49 *6.69 -2.36 0.82 0.65 -0.09 2.18 1.43
[9] CGI2 49 10.35 *** -1.16 1.38 3.36 ** -0.46 0.533.91 -0.72 0.59 2.17 -0.25 0.34
[10] CGI2 49 9.61 *** -0.30 0.45 3.34 ** -0.16 0.96 2.11 *3.73 -0.18 0.19 2.24 -0.09 0.62 1.30
[11] VR 43 0.03 0.01 0.19 ** 0.16 * 0.01 0.020.24 0.18 2.11 1.95 0.14 0.29
[12] EOW 44 0.03 * 0.07 *** -0.02 -0.01 -0.01 0.011.31 3.87 -0.74 -0.77 -0.62 0.77
[13] MPS5 49 0.28 ** 0.09 0.05 0.15 **1.77 0.93 0.30 1.71
[14] SSH 49 0.53 *** -0.23 *** -0.23 ** -0.13 **4.13 -2.53 -1.81 -1.58
[15] CSC 49 0.86 *** -0.12 * -0.24 * 0.005.81 -1.29 -1.61 0.00
Constant Independent Variables

31
TABLE 3 - PROBIT REGRESSION
Obs.: i) Z-statistics based on the bootstrap estimates are noted below the coefficients. Each set of estimates is based on 200 bootstrap replications of the sample. In each resample, without replacement, 40 observations were included; ii) the dependent variable has a value of 1 if the company is a LCC, and 0 otherwise; iii) independent variables were calculated as described in the appendix; iv) the symbols ***, ** and * show statistical significance at 1%, 5% and 10%, respectively; v) the alternative hypothesis is one-sided.
CGI1 WEB NCOM VR EOW DSC SZ2.68 -0.49 ** 0.29 0.00 3.83 ** 29.28 ** 2.250.87 -1.71 0.10 0.00 1.46 1.66 0.95
2.80 -0.55 ** 1.27 0.12 2.76 31.66 ** 2.27 0.080.83 -1.78 0.39 0.28 1.00 1.56 0.98 0.94
Independent VariablesConstant

Recent FEP Working Papers
Nº 230 Ana Paula Delgado and Isabel Maria Godinho, “Long term evolution of the size distribution of Portuguese cities”, September 2006
Nº 229 Sandra Tavares Silva and Aurora A. C. Teixeira, “On the divergence of evolutionary research paths in the past fifty years: a comprehensive bibliometric account”, September 2006
Nº 228 Argentino Pessoa, “Public-Private Sector Partnerships in Developing Countries: Prospects and Drawbacks”, September 2006
Nº 227 Sandra Tavares Silva and Aurora A. C. Teixeira, “An evolutionary model of firms' institutional behavior focusing on labor decisions”, August 2006
Nº 226 Aurora A. C. Teixeira and Natércia Fortuna, “Human capital, trade and long-run productivity. Testing the technological absorption hypothesis for the Portuguese economy, 1960-2001”, August 2006
Nº 225 Catarina Monteiro and Aurora A. C. Teixeira, “Local sustainable mobility management. Are Portuguese municipalities aware?”, August 2006
Nº 224 Filipe J. Sousa and Luís M. de Castro, “Of the significance of business relationships”, July 2006
Nº 223 Pedro Cosme da Costa Vieira, “Nuclear high-radioactive residues: a new economic solution based on the emergence of a global competitive market”, July 2006
Nº 222
Paulo Santos, Aurora A. C. Teixeira and Ana Oliveira-Brochado, “The ‘de-territorialisation of closeness’ - a typology of international successful R&D projects involving cultural and geographic proximity”, July 2006
Nº 221 Manuel M. F. Martins, “Dilemas macroeconómicos e política monetária: o caso da Zona Euro”, July 2006
Nº 220 Ana Oliveira-Brochado and F. Vitorino Martins, “Examining the segment retention problem for the “Group Satellite” case”, July 2006
Nº 219 Óscar Afonso Rui and Henrique Alves, “To Deficit or Not to Deficit”: Should European Fiscal Rules Differ Among Countries?”, July 2006
Nº 218 Rui Henrique Alves and Óscar Afonso, “The “New” Stability and Growth Pact: More Flexible, Less Stupid?”, July 2006
Nº 217 J Maciej Cieślukowski and Rui Henrique Alves, “Financial Autonomy of the European Union after Enlargement”, July 2006
Nº 216 Joao Correia-da-Silva and Carlos Hervés-Beloso, “Prudent Expectations Equilibrium in Economies with Uncertain Delivery”, June 2006
Nº 215 Maria Rosário Moreira and Rui Alves, “How far from Just-in-time are Portuguese firms? A survey of its progress and perception”, June 2006
Nº 214 Maria Fátima Rocha and Aurora A.C. Teixeira, “A cross-country evaluation of cheating in academia: is it related to ‘real world’ business ethics?”, June 2006
Nº 213 Maria Rosário Moreira and Rui Alves, “Does Order Negotiation Improve The Job-Shop Workload Control?”, June 2006
Nº 212 Pedro Cosme da Costa Vieira and Aurora A. C. Teixeira, “Human capital and corruption: a microeconomic model of the bribes market with democratic contestability”, May 2006
Nº 211 Ana Teresa Tavares and Aurora A. C. Teixeira, “Is human capital a significant determinant of Portugal’s FDI attractiveness?”, May 2006
Nº 210 Maria Rosário Moreira and Rui Alves, A new input-output control order release mechanism: how workload control improves manufacturing operations in a job shop, April 2006
Nº 209 Patrícia Teixeira Lopes and Lúcia Lima Rodrigues, Accounting for Financial Instruments: An Analysis of the Determinants of Disclosure

in the Portuguese Stock Exchange, April 2006
Nº 208 Pedro Cosme Costa Vieira, Energia nuclear: Uma solução para Portugal?, April 2006
Nº 207 Aurora A.C. Teixeira and Joana Costa, What type of firm forges closer innovation linkages with Portuguese Universities?, March 2006
Nº 206 Joao Correia-da-Silva and Carlos Hervés-Beloso, Rational Expectations Equilibrium in Economies with Uncertain Delivery, March 2006
Nº 205 Luís Delfim Santos and José Varejão, Employment, Pay and Discrimination in the Tourism Industry, February 2006
Nº 204 Carlos F. Alves and Victor Mendes, Mutual fund flows’ performance reaction: does convexity apply to small markets?, February 2006
Nº 203 Carlos F. Alves and Victor Mendes, Are mutual fund investors in jail?, February 2006
Nº 202 Óscar Afonso and Paulo B. Vasconcelos, Numerical computation for initial value problems in economics, February 2006
Nº 201 Manuel Portugal Ferreira, Ana Teresa Tavares, William Hesterly and Sungu Armagan, Network and firm antecedents of spin-offs: Motherhooding spin-offs, February 2006
Nº 200 Aurora A.C. Teixeira, Vinte anos (1985-2005) de FEP Working Papers: um estudo sobre a respectiva probabilidade de publicação nacional e internacional, January 2006
Nº 199 Samuel Cruz Alves Pereira, Aggregation in activity-based costing and the short run activity cost function, January 2006
Nº 198
Samuel Cruz Alves Pereira and Pedro Cosme Costa Vieira, How to control market power of activity centres? A theoretical model showing the advantages of implementing competition within organizations, January 2006
Nº 197 Maria de Fátima Rocha and Aurora A.C. Teixeira, College cheating in Portugal: results from a large scale survey, December 2005
Nº 196 Stephen G. Donald, Natércia Fortuna and Vladas Pipiras, Local and global rank tests for multivariate varying-coefficient models, December 2005
Nº 195 Pedro Rui Mazeda Gil, The Firm’s Perception of Demand Shocks and the Expected Profitability of Capital under Uncertainty, December 2005
Nº 194 Ana Oliveira-Brochado and Francisco Vitorino Martins, Assessing the Number of Components in Mixture Models: a Review., November 2005
Nº 193 Lúcia Paiva Martins de Sousa and Pedro Cosme da Costa Vieira, Um ranking das revistas científicas especializadas em economia regional e urbana, November 2005
Nº 192 António Almodovar and Maria de Fátima Brandão, Is there any progress in Economics? Some answers from the historians of economic thought, October 2005
Nº 191 Maria de Fátima Rocha and Aurora A.C. Teixeira, Crime without punishment: An update review of the determinants of cheating among university students, October 2005
Nº 190 Joao Correia-da-Silva and Carlos Hervés-Beloso, Subjective Expectations Equilibrium in Economies with Uncertain Delivery, October 2005
Editor: Prof. Sandra Silva ([email protected]) Download available at: http://www.fep.up.pt/investigacao/workingpapers/workingpapers.htmalso in http://ideas.repec.org/PaperSeries.html

www.fep.up.pt