capacity planning and demand management
TRANSCRIPT

The Intelligence behind Successful Software Projects
IT DEMAND MANAGEMENT AND CAPACITY PLANNING: WHY ESTIMATION IS VITAL TO BALANCING THE SCALE
-1-
The Intelligence behind Successful Software Projects
Quantitative Software Management
ExecutiveSummary
-2-
Agenda
Challenges associated with demand management & capacity planning:
• “Realistic” demand estimation• Effective resource optimization• Detailed resource planning to support
capacity utilization

The Intelligence behind Successful Software Projects
Quantitative Software Management
ExecutiveSummary
Why Is IT Development Capacity Planning so
Difficult?
-3-
The Intelligence behind Successful Software Projects
Quantitative Software Management
ExecutiveSummary
-4-
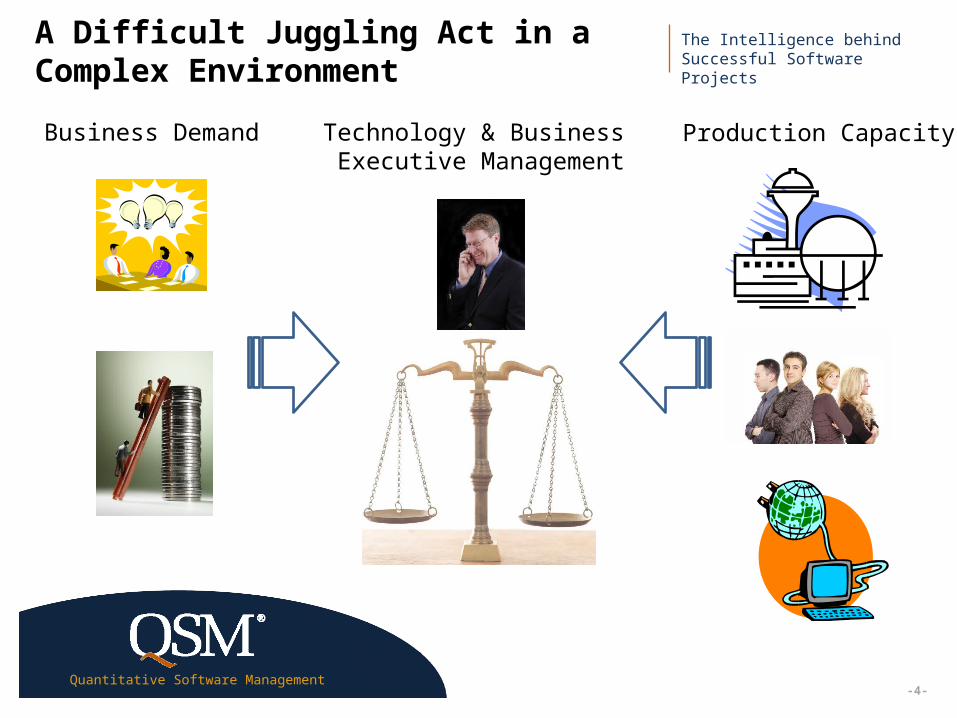
A Difficult Juggling Act in a Complex Environment
Production CapacityBusiness Demand Technology & Business Executive Management
The Intelligence behind Successful Software Projects
Quantitative Software Management
ExecutiveSummary
-5-
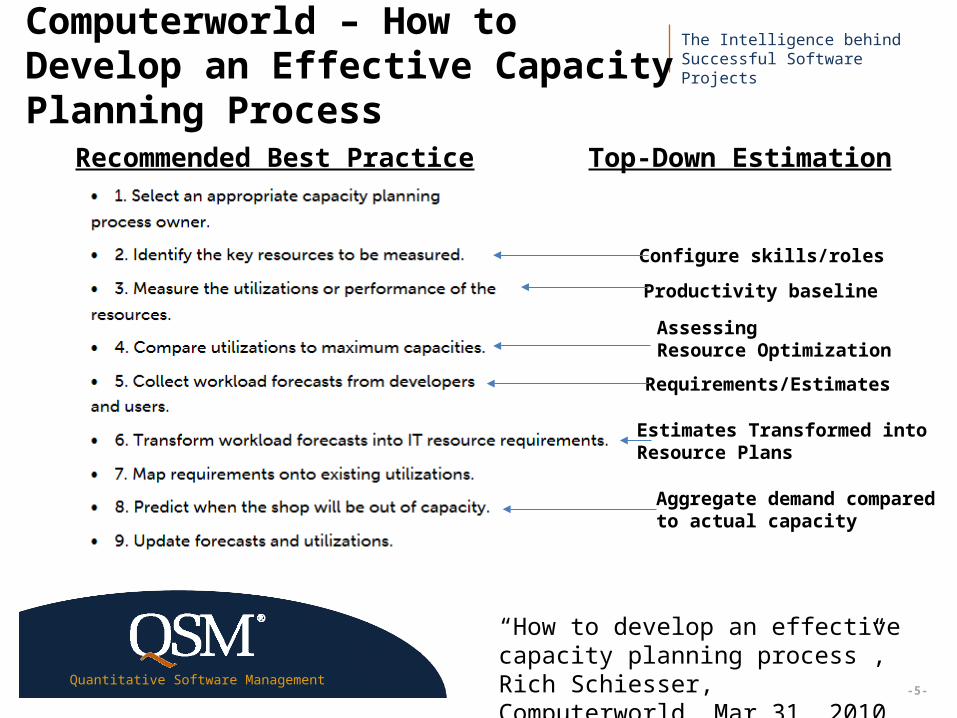
Computerworld – How to Develop an Effective Capacity Planning Process
Requirements/Estimates
Productivity baseline
Estimates Transformed into Resource Plans
Aggregate demand compared to actual capacity
Recommended Best Practice
AssessingResource Optimization
“How to develop an effective capacity planning process”, Rich Schiesser, Computerworld, Mar 31, 2010
Configure skills/roles
Top-Down Estimation
The Intelligence behind Successful Software Projects
Quantitative Software Management
ExecutiveSummary
-6-
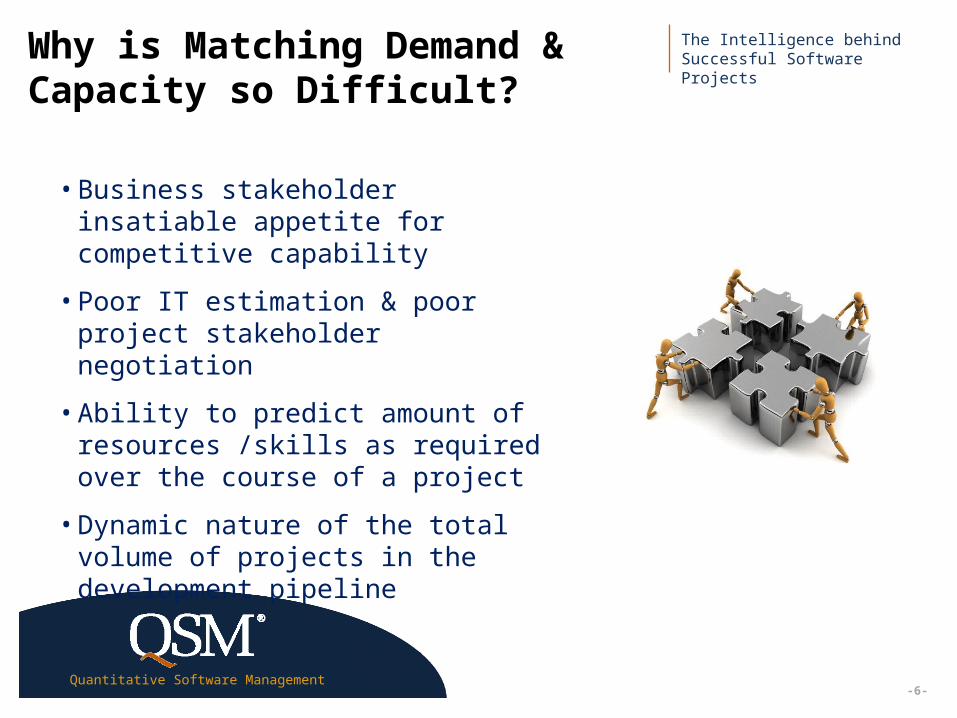
Why is Matching Demand & Capacity so Difficult?
• Business stakeholder insatiable appetite for competitive capability
• Poor IT estimation & poor project stakeholder negotiation
• Ability to predict amount of resources /skills as required over the course of a project
• Dynamic nature of the total volume of projects in the development pipeline
The Intelligence behind Successful Software Projects
Quantitative Software Management
ExecutiveSummary
“Realistic” Demand Estimation
-7-
The Intelligence behind Successful Software Projects
Quantitative Software Management
ExecutiveSummary
-8-
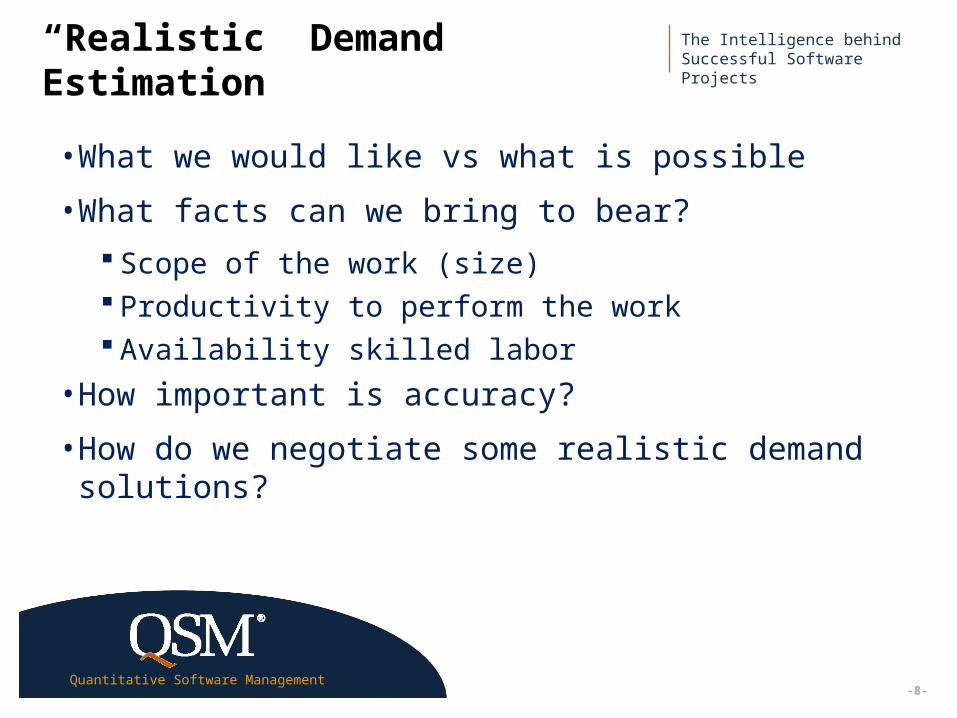
“Realistic” Demand Estimation
• What we would like vs what is possible
• What facts can we bring to bear?
Scope of the work (size) Productivity to perform the work Availability skilled labor
• How important is accuracy?
• How do we negotiate some realistic demand solutions?
-9-
The Intelligence behind Successful Software Projects
Quantitative Software Management
ExecutiveSummary
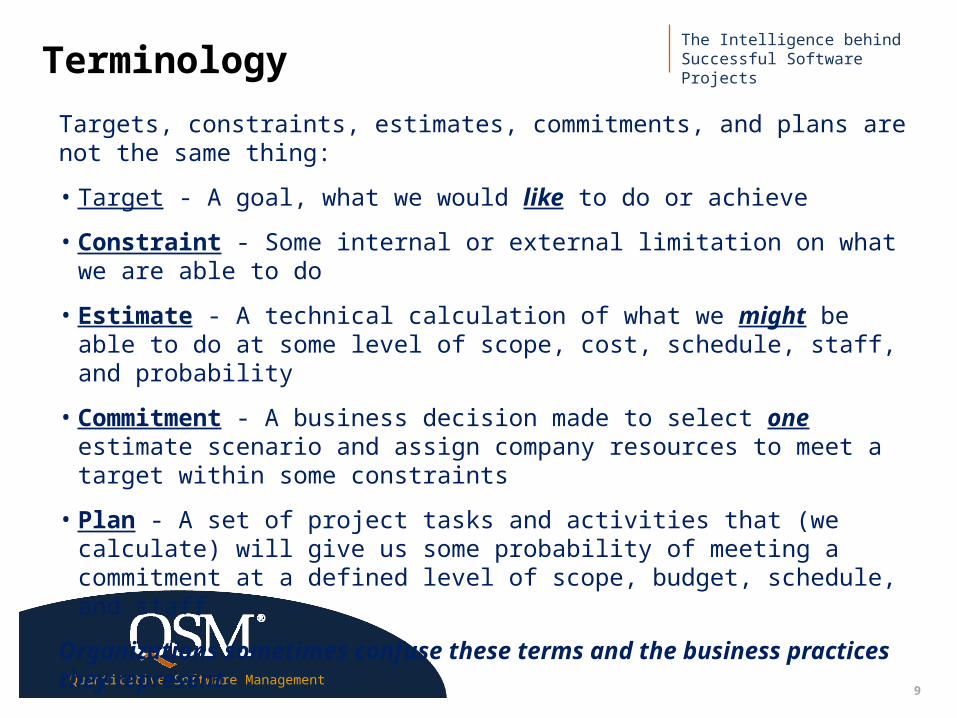
Terminology
Targets, constraints, estimates, commitments, and plans are not the same thing:
• Target - A goal, what we would like to do or achieve
• Constraint - Some internal or external limitation on what we are able to do
• Estimate - A technical calculation of what we might be able to do at some level of scope, cost, schedule, staff, and probability
• Commitment - A business decision made to select one estimate scenario and assign company resources to meet a target within some constraints
• Plan - A set of project tasks and activities that (we calculate) will give us some probability of meeting a commitment at a defined level of scope, budget, schedule, and staff
Organizations sometimes confuse these terms and the business practices they represent.
The Intelligence behind Successful Software Projects
Quantitative Software Management
ExecutiveSummary
-10-
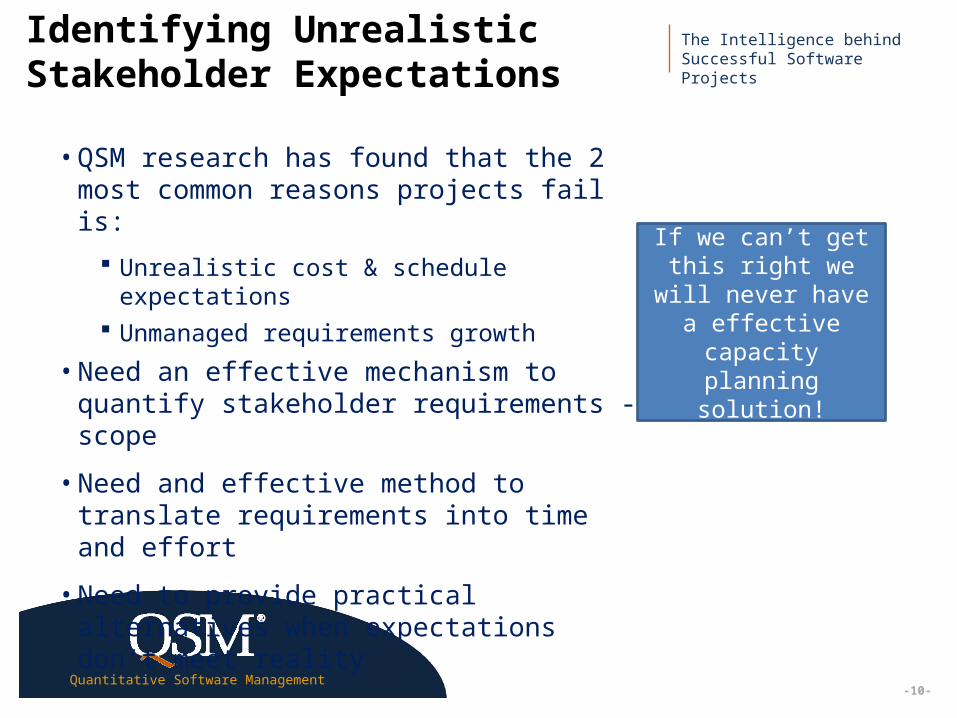
Identifying Unrealistic Stakeholder Expectations
• QSM research has found that the 2 most common reasons projects fail is:
Unrealistic cost & schedule expectations Unmanaged requirements growth
• Need an effective mechanism to quantify stakeholder requirements - scope
• Need and effective method to translate requirements into time and effort
• Need to provide practical alternatives when expectations don’t meet reality
If we can’t get this right we will never have a effective
capacity planning solution!
The Intelligence behind Successful Software Projects
Quantitative Software Management
ExecutiveSummary
-11-
How? Top-Down Scope-Based Estimation
Particularly good at identifying unrealistic expectations:
• Doesn’t require a lot of detailed information
• Relatively quick
• Few hidden assumptions
• Explicitly calibrated from history (local or industry)
• Very flexible for scope, staffing, duration, etc., changes
• Considered industry “best practice”
-12-
The Intelligence behind Successful Software Projects
Quantitative Software Management
ExecutiveSummary
orem ipsum dolor sit amet, consectetur adipiscing elit, sed do eiusmod tempor incididunt ut labore et dolore magna aliqua. Ut enim ad minim veniam, quis nostrud exercitation ullamco laboris nisi ut aliquip ex ea commodo consequat.
orem ipsum dolor sit amet, consectetur adipiscing elit, sed do eiusmod tempor incididunt ut labore et dolore magna aliqua. Ut enim ad minim veniam, quis nostrud exercitation ullamco laboris nisi ut aliquip ex ea commodo consequat.
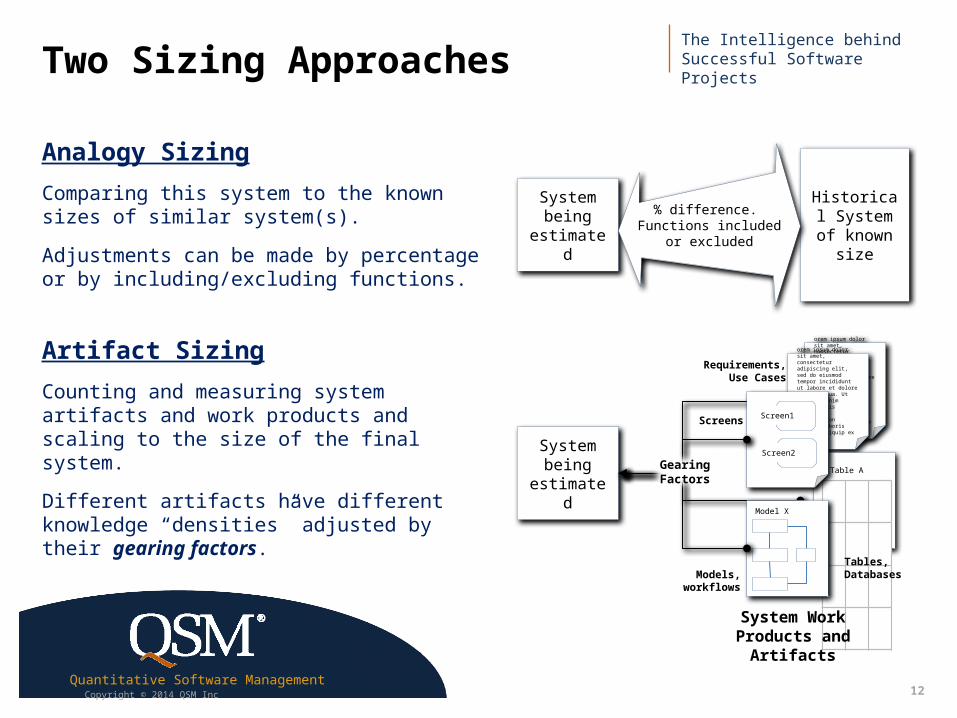
Two Sizing Approaches
Analogy Sizing
Comparing this system to the known sizes of similar system(s).
Adjustments can be made by percentage or by including/excluding functions.
Artifact Sizing
Counting and measuring system artifacts and work products and scaling to the size of the final system.
Different artifacts have different knowledge “densities” adjusted by their gearing factors.
Copyright © 2014 QSM Inc
Historical System of known size
System being
estimated
% difference. Functions included or excluded
System being
estimated
Table A
Screen1
Screen2
Model X
GearingFactors
Requirements,Use Cases
Screens
Tables,DatabasesModels,
workflows
System Work Products and
Artifacts

The Intelligence behind Successful Software Projects
Quantitative Software Management
ExecutiveSummary
-13-
Gearing Factor
As long as we work in a single unit for history, calibration, and estimation, we do not need a Gearing Factor
If we want to compare or sum sizing in different units or to use industry databases, we have to normalize to a common unit
The Gearing Factor is the normalizing base
We can calculate the Gearing Factor from history

Copyright © 2014 by QSM, Inc.
The Intelligence behind Successful Software Projects
14 ®
Gearing Factor
As long as we work in a single unit for history, calibration, and estimation, we do not need a Gearing Factor
If we want to compare or sum sizing in different units or to use industry databases, we have to normalize to a common unit
The Gearing Factor is the normalizing base
We can calculate the Gearing Factor from history
The Intelligence behind Successful Software Projects
Quantitative Software Management
ExecutiveSummary
-15-
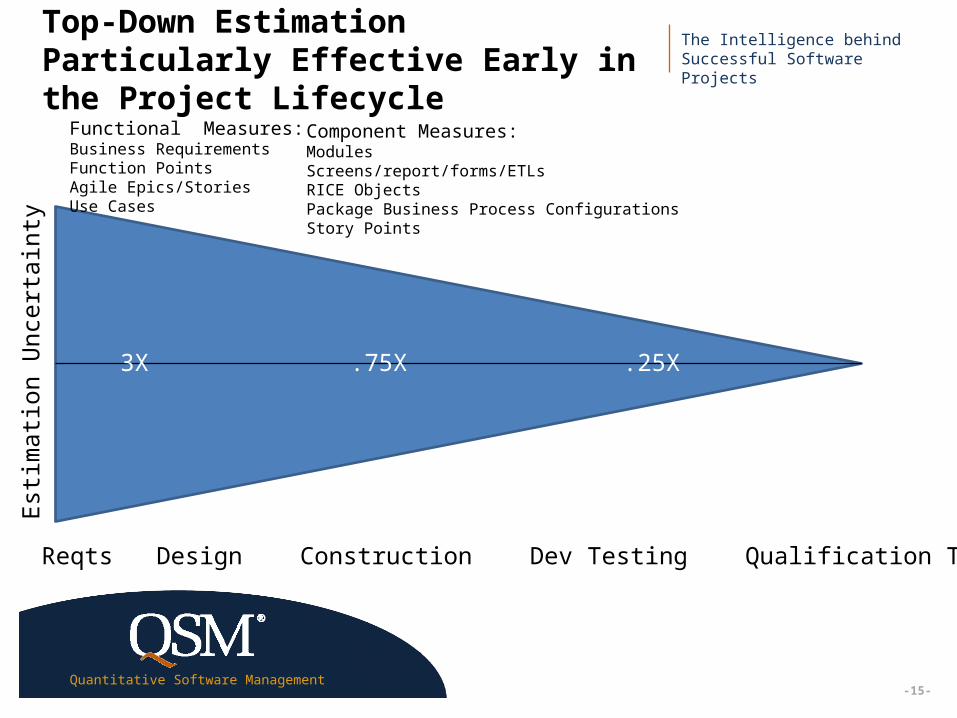
Top-Down Estimation Particularly Effective Early in the Project Lifecycle
Est
imat
ion
Unc
erta
inty
Concept Reqts Design Construction Dev Testing Qualification Testing
Functional Measures: Business RequirementsFunction PointsAgile Epics/StoriesUse Cases
Component Measures:ModulesScreens/report/forms/ETLsRICE ObjectsPackage Business Process ConfigurationsStory Points
7X 5X 3X .75X .25X .05X

The Intelligence behind Successful Software Projects
Quantitative Software Management
ExecutiveSummary
-16-
Top-Down Estimation Particularly Effective Early in the Project Lifecycle
Est
imat
ion
Unc
erta
inty
Concept Reqts Design Construction Dev Testing Qualification Testing
Functional Measures: Business RequirementsFunction PointsAgile Epics/StoriesUse Cases
Component Measures:ModulesScreens/report/forms/ETLsRICE ObjectsPackage Business Process ConfigurationsStory Points
7X 5X 3X .75X .25X .05X
The Intelligence behind Successful Software Projects
Quantitative Software Management
ExecutiveSummary
-17-
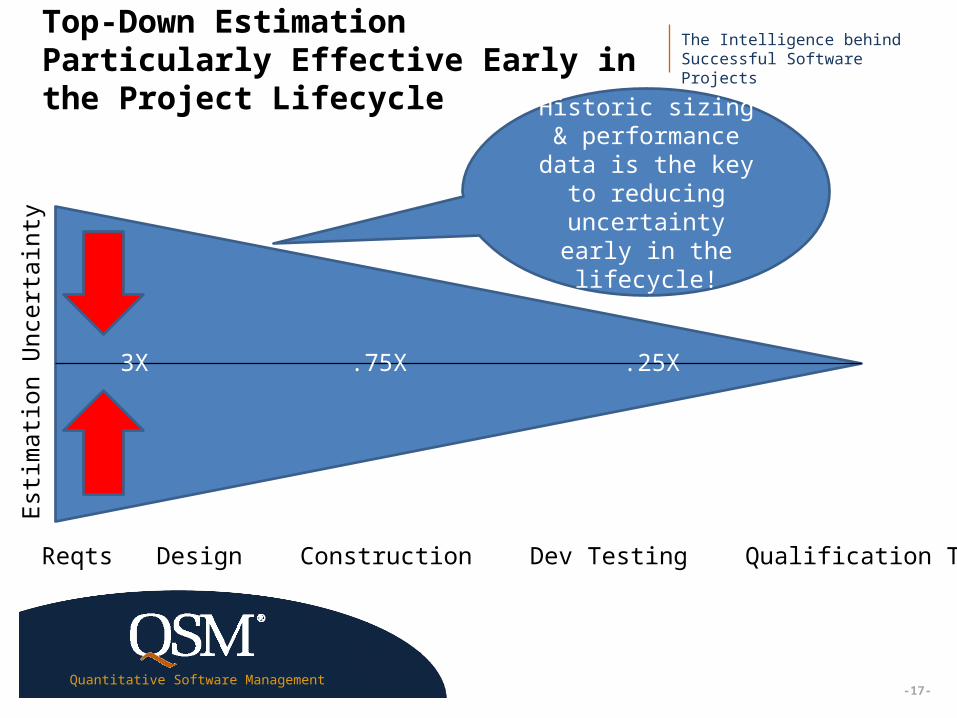
Top-Down Estimation Particularly Effective Early in the Project Lifecycle
Est
imat
ion
Unc
erta
inty
Concept Reqts Design Construction Dev Testing Qualification Testing
7X 5X 3X .75X .25X .05X
Historic sizing & performance data
is the key to reducing
uncertainty early in the lifecycle!

The Intelligence behind Successful Software Projects
Quantitative Software Management
ExecutiveSummary
-18-
Estimates are Uncertain By Their Nature
Estimates are always uncertain
The job of the estimation process is not to remove the uncertainty, it is to measure it
SLIM-Estimate simply translates uncertainty into risk
We accept and deal with uncertainty in many aspects of our lives
“Forecasts of the future are inherently uncertain.”
Larry Putnam Sr.Measures for Excellence
Yourdon Press 1992 p.207
“The key issue… is documenting the estimate’s uncertainty…”
Steve McConnell.Software Estimation
Microsoft Press 2006 p.251
“Prediction is difficult, especially if it involves the future.”
Niels Bohr.Physicist and
Nobel Laureate
The Intelligence behind Successful Software Projects
Quantitative Software Management
ExecutiveSummary
-19-
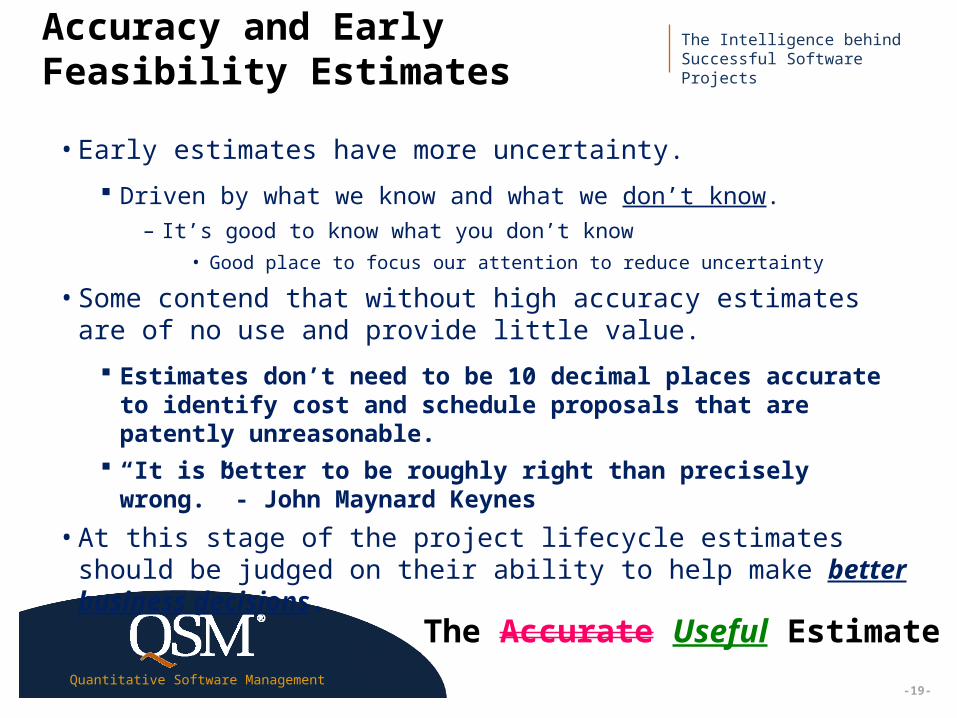
Accuracy and Early Feasibility Estimates
• Early estimates have more uncertainty.
Driven by what we know and what we don’t know.– It’s good to know what you don’t know
• Good place to focus our attention to reduce uncertainty
• Some contend that without high accuracy estimates are of no use and provide little value.
Estimates don’t need to be 10 decimal places accurate to identify cost and schedule proposals that are patently unreasonable.
“It is better to be roughly right than precisely wrong.” - John Maynard Keynes
• At this stage of the project lifecycle estimates should be judged on their ability to help make better business decisions.
The Accurate Useful Estimate
The Intelligence behind Successful Software Projects
Quantitative Software Management
ExecutiveSummary
-20-
Trapping High Risk Proposals
• Most projects start off as proposals that need to be prioritized and justified.
Priorities are usually aligned with the organizations strategic goals.
Justification may be based on benefits to the organization.– New revenue to be realized
– Savings or cost efficiencies
Many times the benefit is expressed in terms of ROI , IRR or payback period.
• Most proposals have some high level description of capabilities that relate to the size & scope to be developed and implemented.
• Most proposals have a target or desired schedule and cost.
• This is enough information to generate a useful feasibility estimate.
The Intelligence behind Successful Software Projects
Quantitative Software Management
ExecutiveSummary
-21-
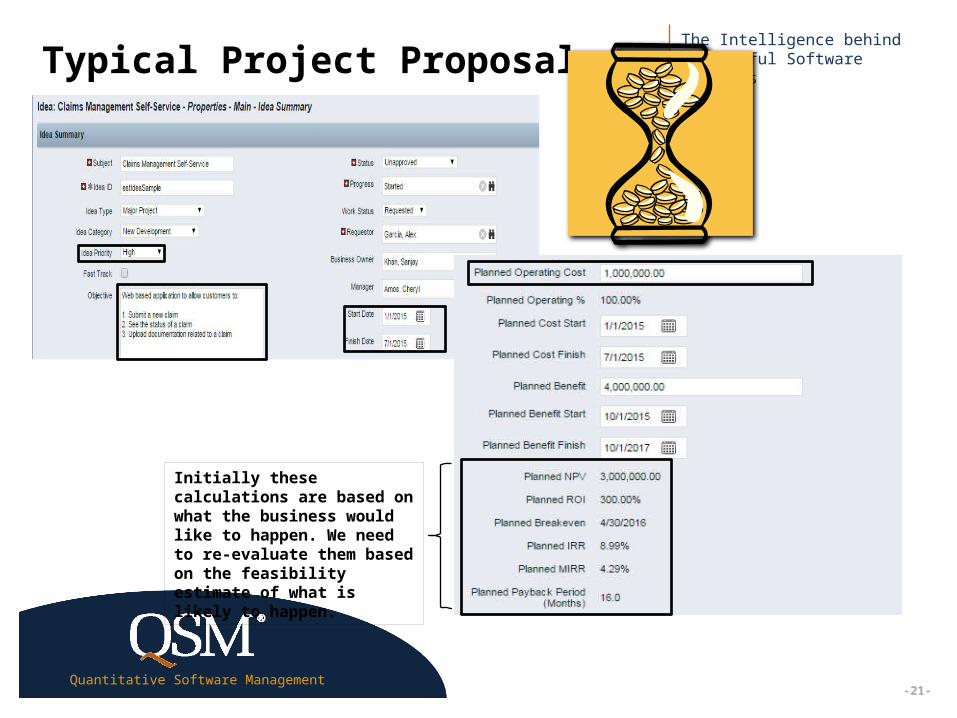
Typical Project Proposal
Initially these calculations are based on what the business would like to happen. We need to re-evaluate them based on the feasibility estimate of what is likely to happen.
The Intelligence behind Successful Software Projects
Quantitative Software Management
ExecutiveSummary
-22-
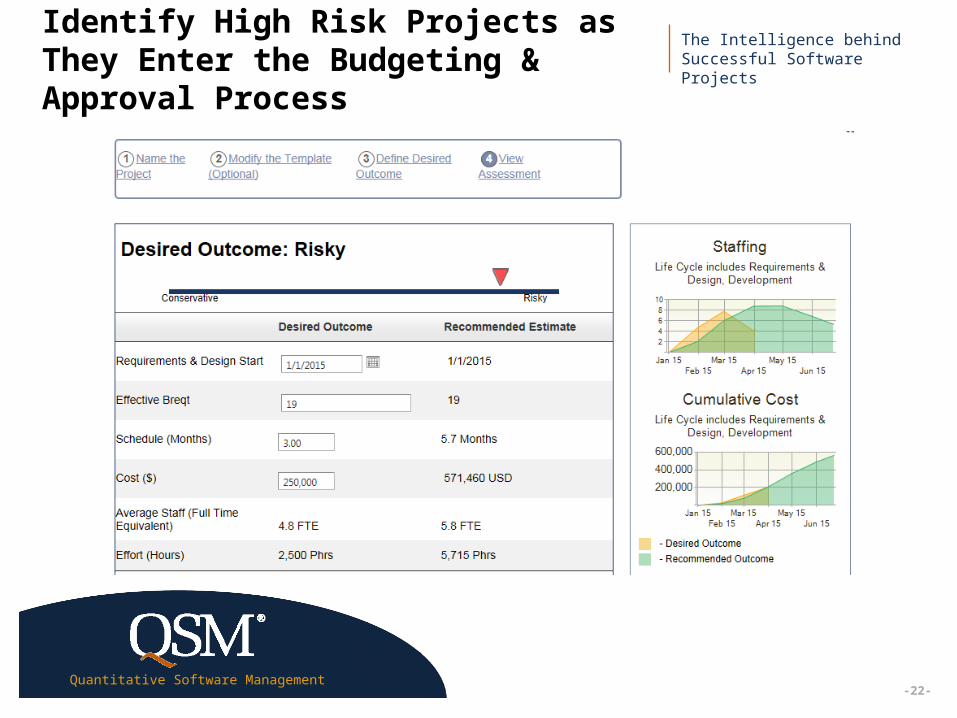
Identify High Risk Projects as They Enter the Budgeting & Approval Process
The Intelligence behind Successful Software Projects
Quantitative Software Management
ExecutiveSummary
-17-
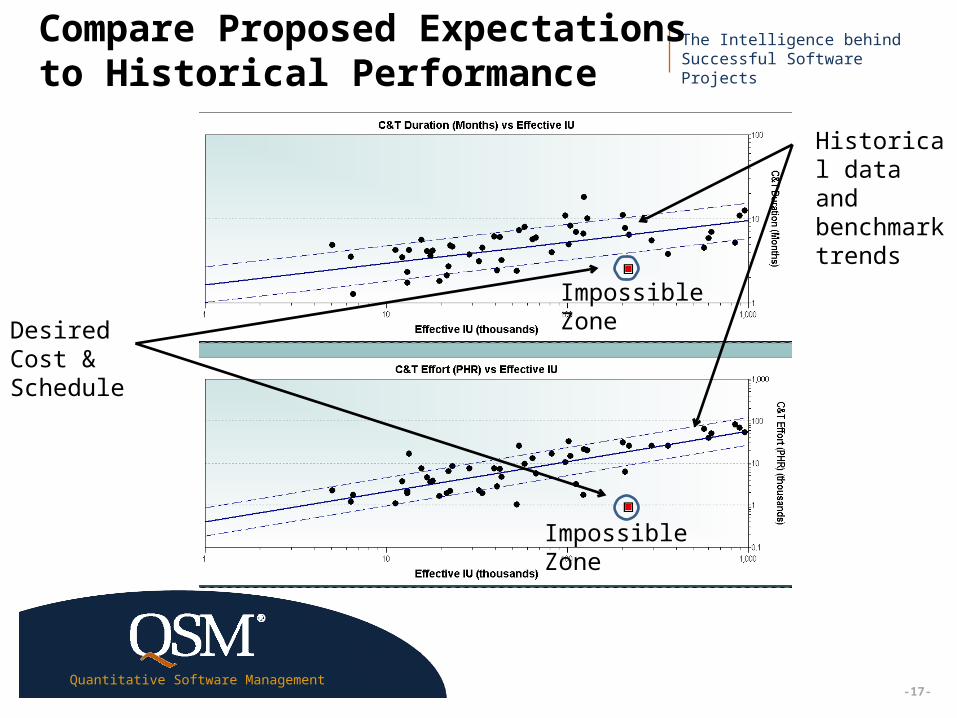
Compare Proposed Expectations to Historical Performance
Desired Cost & Schedule
Historical data and benchmark trends
Impossible Zone
Impossible Zone
The Intelligence behind Successful Software Projects
Quantitative Software Management
ExecutiveSummary
-17-
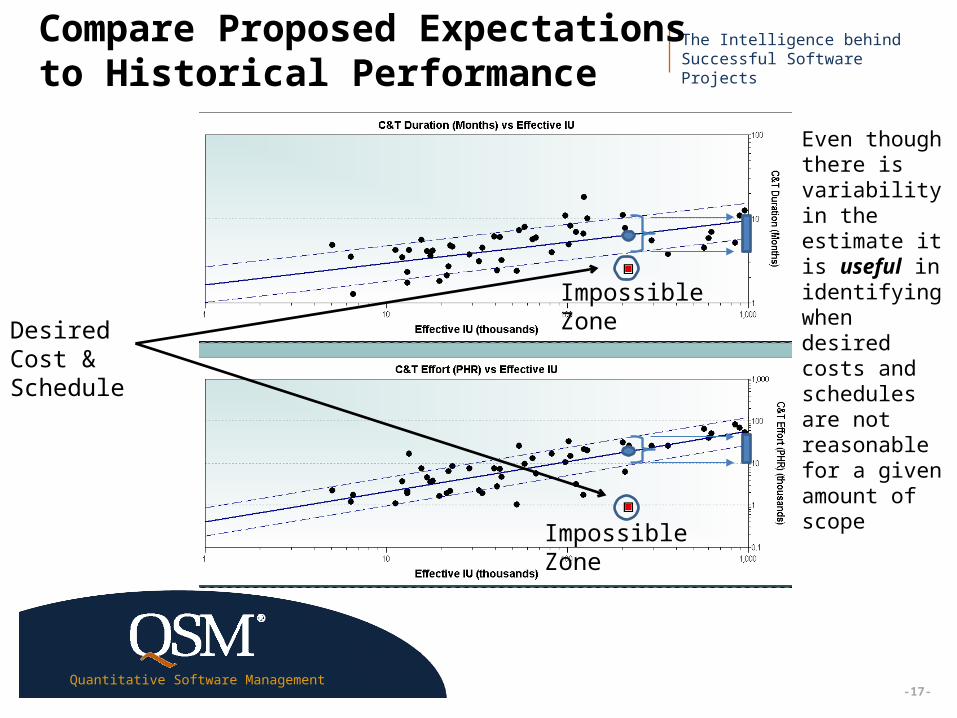
Compare Proposed Expectations to Historical Performance
Desired Cost & Schedule
Even though there is variability in the estimate it is useful in identifying when desired costs and schedules are not reasonable for a given amount of scope
Impossible Zone
Impossible Zone
The Intelligence behind Successful Software Projects
Quantitative Software Management
ExecutiveSummary
-25-
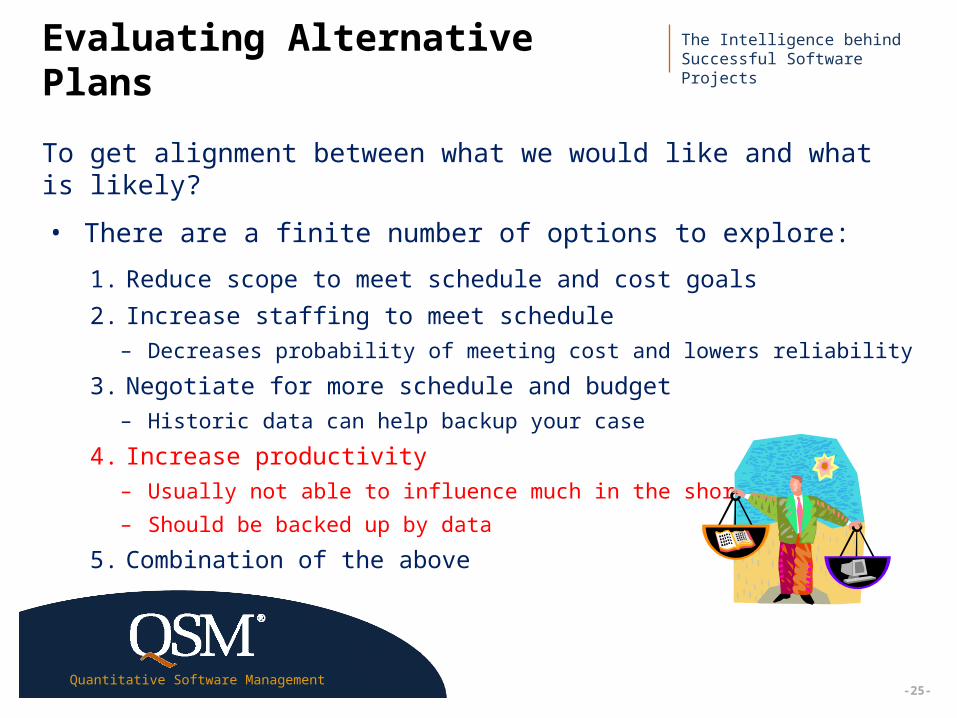
Evaluating Alternative Plans
To get alignment between what we would like and what is likely?
• There are a finite number of options to explore:
1. Reduce scope to meet schedule and cost goals
2. Increase staffing to meet schedule– Decreases probability of meeting cost and lowers reliability
3. Negotiate for more schedule and budget– Historic data can help backup your case
4. Increase productivity– Usually not able to influence much in the short term
– Should be backed up by data
5. Combination of the above
The Intelligence behind Successful Software Projects
Quantitative Software Management
ExecutiveSummary
Effective Resource Optimization
-26-
The Intelligence behind Successful Software Projects
Quantitative Software Management
ExecutiveSummary
-27-
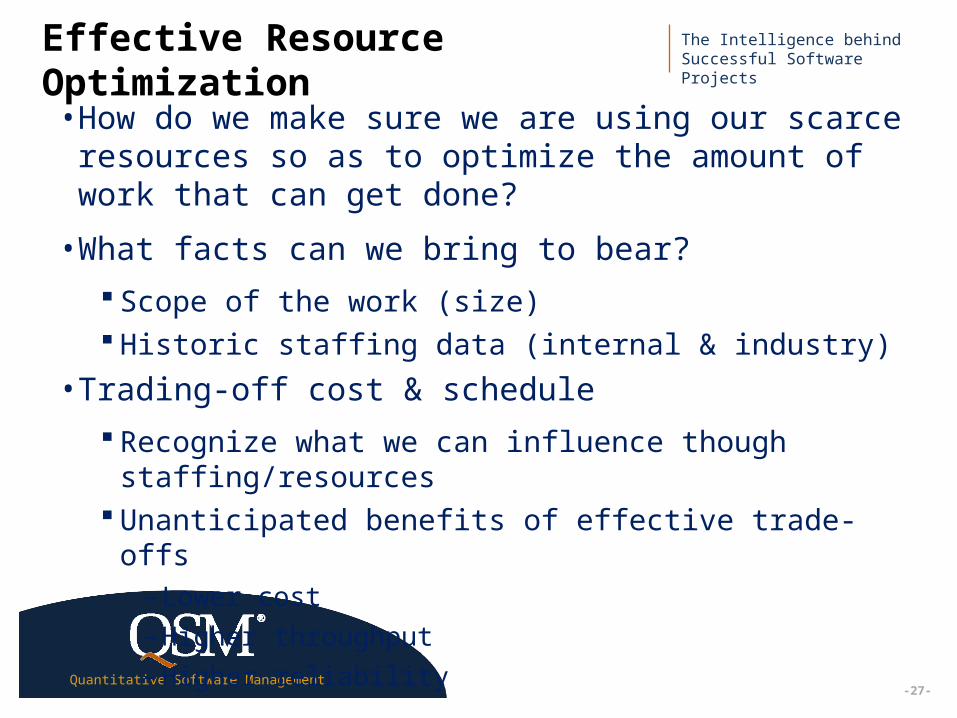
Effective Resource Optimization• How do we make sure we are using our scarce resources so as to optimize the amount of work that can get done?
• What facts can we bring to bear?
Scope of the work (size) Historic staffing data (internal & industry)
• Trading-off cost & schedule
Recognize what we can influence though staffing/resources
Unanticipated benefits of effective trade-offs– Lower cost– Higher throughput– Higher reliability
The Intelligence behind Successful Software Projects
Quantitative Software Management
ExecutiveSummary
-28-
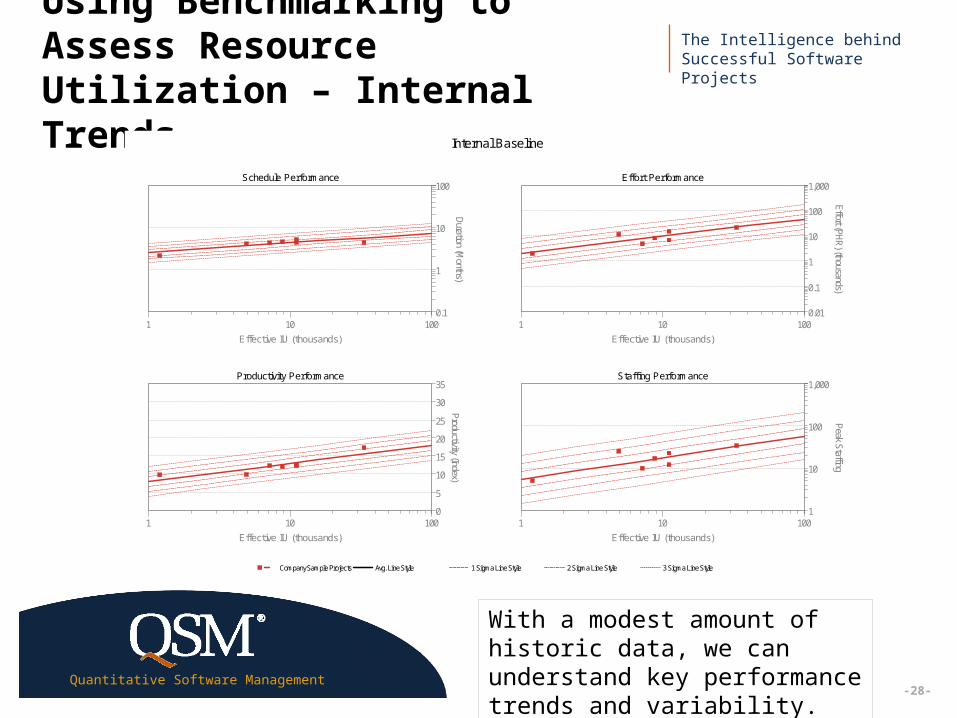
Using Benchmarking to Assess Resource Utilization – Internal Trends
Internal Baseline
Schedule Performance
1 10 100
Effective IU (thousands)
0.1
1
10
100
Duration (Months)
Effort Performance
1 10 100
Effective IU (thousands)
0.01
0.1
1
10
100
1,000
Effort (PHR) (thousands)
Productivity Performance
1 10 100
Effective IU (thousands)
0
5
10
15
20
25
30
35
Productivity (Index)
Staffing Performance
1 10 100
Effective IU (thousands)
1
10
100
1,000
Peak Staffing
Company Sample Projects Avg. Line Style 1 Sigma Line Style 2 Sigma Line Style 3 Sigma Line Style
With a modest amount of historic data, we can understand key performance trends and variability.
The Intelligence behind Successful Software Projects
Quantitative Software Management
ExecutiveSummary
-29-
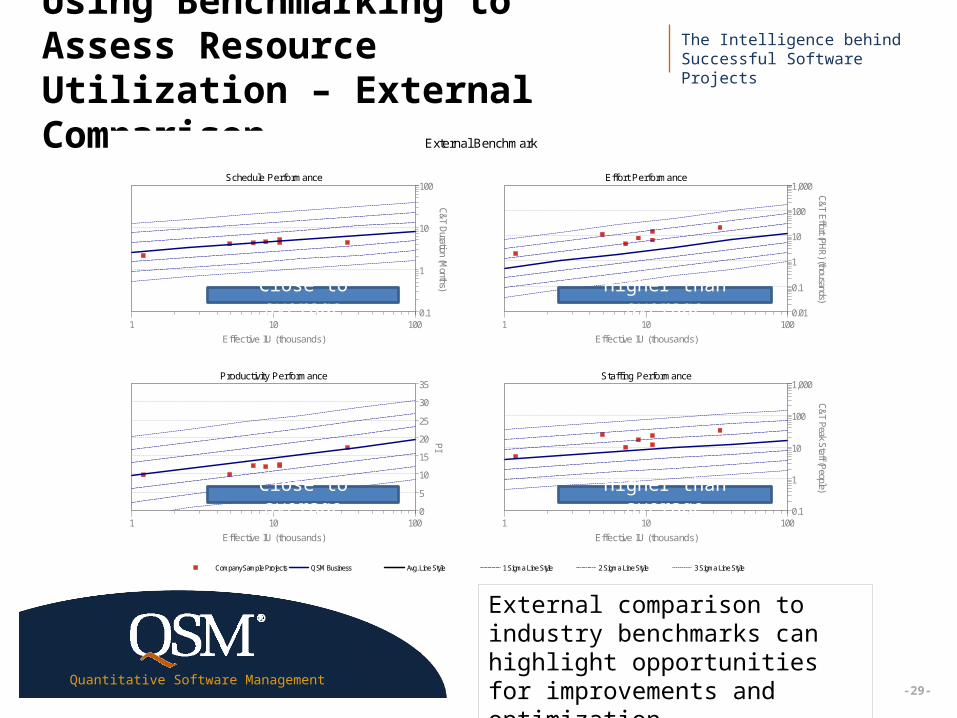
Using Benchmarking to Assess Resource Utilization – External Comparison
External Benchmark
Schedule Performance
1 10 100
Effective IU (thousands)
0.1
1
10
100
C&T Duration (Months)
Effort Performance
1 10 100
Effective IU (thousands)
0.01
0.1
1
10
100
1,000
C&T Effort (PHR) (thousands)
Productivity Performance
1 10 100
Effective IU (thousands)
0
5
10
15
20
25
30
35
PI
Staffing Performance
1 10 100
Effective IU (thousands)
0.1
1
10
100
1,000
C&T Peak Staff (People)
Company Sample Projects QSM Business Avg. Line Style 1 Sigma Line Style 2 Sigma Line Style 3 Sigma Line Style
External comparison to industry benchmarks can highlight opportunities for improvements and optimization.
Close to average
Close to average Higher than average
Higher than average
The Intelligence behind Successful Software Projects
Quantitative Software Management
ExecutiveSummary
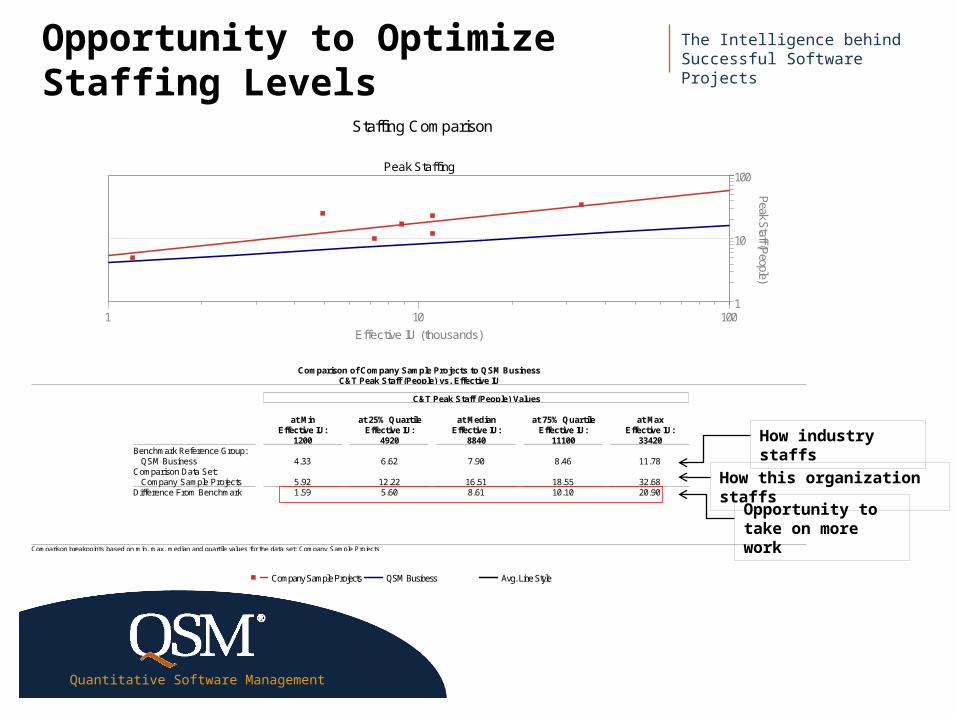
Opportunity to Optimize Staffing Levels
Staffing Comparison
Peak Staffing
1 10 100
Effective IU (thousands)
1
10
100Peak Staff (People)
Comparison of Company Sample Projects to QSM BusinessC&T Peak Staff (People) vs. Effective IU
C&T Peak Staff (People) Values
Benchmark Reference Group: QSM BusinessComparison Data Set: Company Sample ProjectsDifference From Benchmark
at MinEffective IU:
1200
4.33
5.921.59
at 25% QuartileEffective IU:
4920
6.62
12.225.60
at MedianEffective IU:
8840
7.90
16.518.61
at 75% QuartileEffective IU:
11100
8.46
18.5510.10
at MaxEffective IU:
33420
11.78
32.6820.90
Comparison breakpoints based on min, max, median and quartile values for the data set: Company Sample Projects
Company Sample Projects QSM Business Avg. Line Style
How industry staffs
How this organization staffs
Opportunity to take on more work
The Intelligence behind Successful Software Projects
Quantitative Software Management
ExecutiveSummary
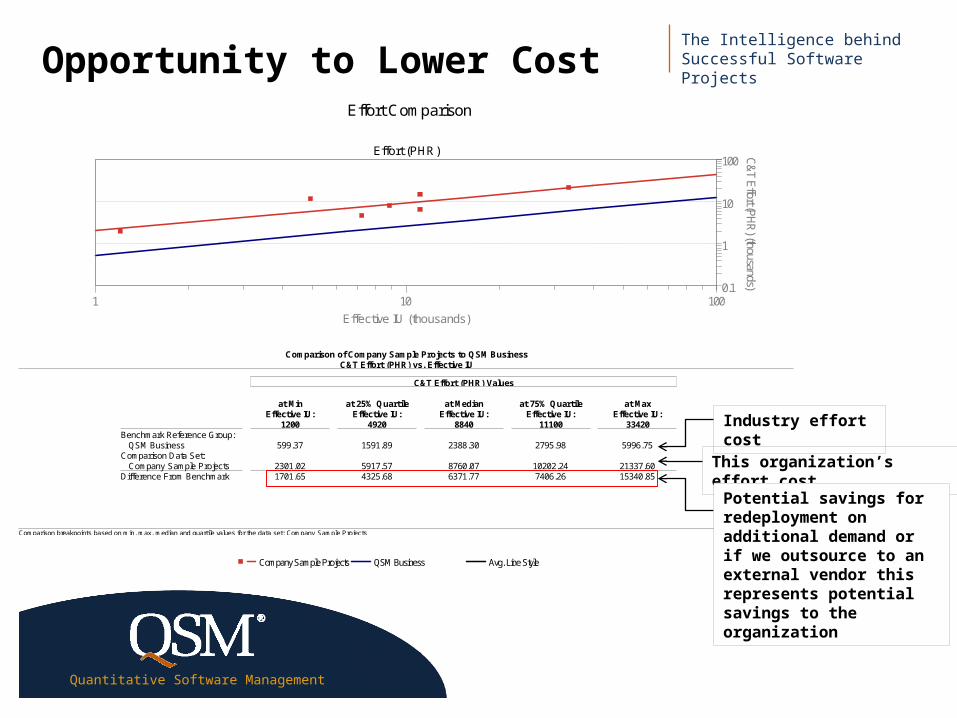
Opportunity to Lower CostEffort Comparison
Effort (PHR)
1 10 100
Effective IU (thousands)
0.1
1
10
100 C&T Effort (PHR
) (thousands)
Comparison of Company Sample Projects to QSM BusinessC&T Effort (PHR) vs. Effective IU
C&T Effort (PHR) Values
Benchmark Reference Group: QSM BusinessComparison Data Set: Company Sample ProjectsDifference From Benchmark
at MinEffective IU:
1200
599.37
2301.021701.65
at 25% QuartileEffective IU:
4920
1591.89
5917.574325.68
at MedianEffective IU:
8840
2388.30
8760.076371.77
at 75% QuartileEffective IU:
11100
2795.98
10202.247406.26
at MaxEffective IU:
33420
5996.75
21337.6015340.85
Comparison breakpoints based on min, max, median and quartile values for the data set: Company Sample Projects
Company Sample Projects QSM Business Avg. Line Style
Industry effort cost
This organization’s effort cost
Potential savings forredeployment on additional demand or if we outsource to an external vendor this represents potential savings to the organization
The Intelligence behind Successful Software Projects
Quantitative Software Management
ExecutiveSummary
-32-
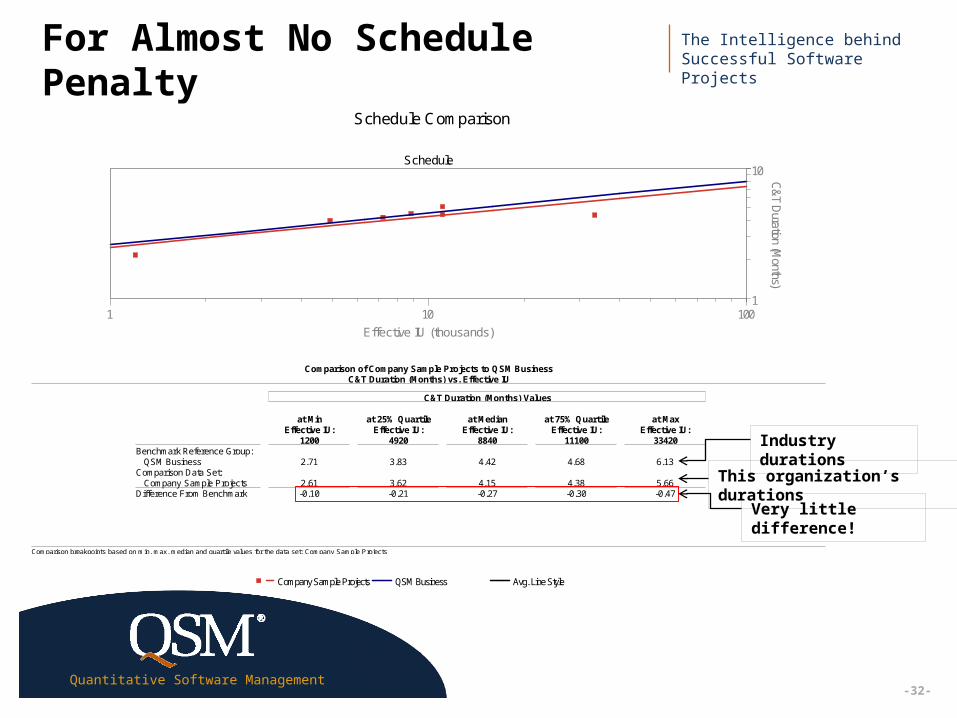
For Almost No Schedule Penalty
Schedule Comparison
Schedule
1 10 100
Effective IU (thousands)
1
10C
&T Duration (M
onths)
Comparison of Company Sample Projects to QSM BusinessC&T Duration (Months) vs. Effective IU
C&T Duration (Months) Values
Benchmark Reference Group: QSM BusinessComparison Data Set: Company Sample ProjectsDifference From Benchmark
at MinEffective IU:
1200
2.71
2.61-0.10
at 25% QuartileEffective IU:
4920
3.83
3.62-0.21
at MedianEffective IU:
8840
4.42
4.15-0.27
at 75% QuartileEffective IU:
11100
4.68
4.38-0.30
at MaxEffective IU:
33420
6.13
5.66-0.47
Comparison breakpoints based on min, max, median and quartile values for the data set: Company Sample Projects
Company Sample Projects QSM Business Avg. Line Style
Industry durations
This organization’s durations
Very little difference!
The Intelligence behind Successful Software Projects
Quantitative Software Management
ExecutiveSummary
-33-
Resource Optimization Takeaways
• Use historical data to assess current resource utilization.
• Compare current resource utilization to outside industry benchmarks.
• Identify opportunities for optimization (don’t over staff!).
Make the time-effort tradeoff relationship work for us.– You pay almost no schedule penalty.
– Cost goes down and reliability goes up.
For more information on this - http://www.qsm.com/research Document the results and benefits of making better business
decisions.
The Intelligence behind Successful Software Projects
Quantitative Software Management
ExecutiveSummary
Translating Estimates into Resource Demands
-34-
The Intelligence behind Successful Software Projects
Quantitative Software Management
ExecutiveSummary
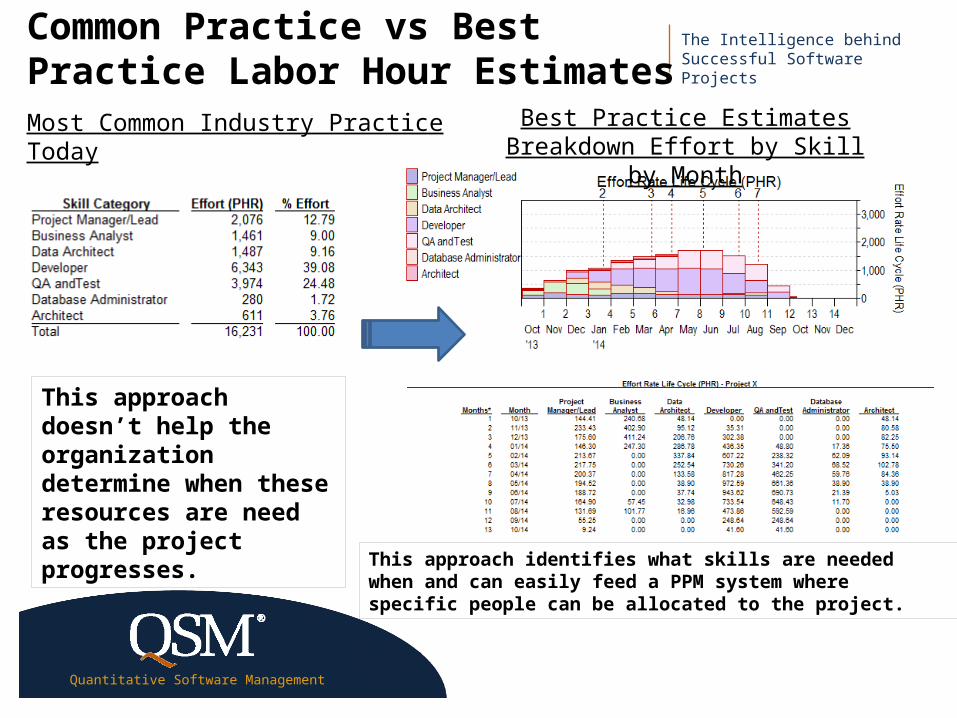
Common Practice vs Best Practice Labor Hour EstimatesMost Common Industry Practice Today Best Practice Estimates Breakdown
Effort by Skill by Month
This approach doesn’t help the organization determine when these resources are need as the project progresses.
This approach identifies what skills are needed when and can easily feed a PPM system where specific people can be allocated to the project.
The Intelligence behind Successful Software Projects
Quantitative Software Management
ExecutiveSummary
-36-
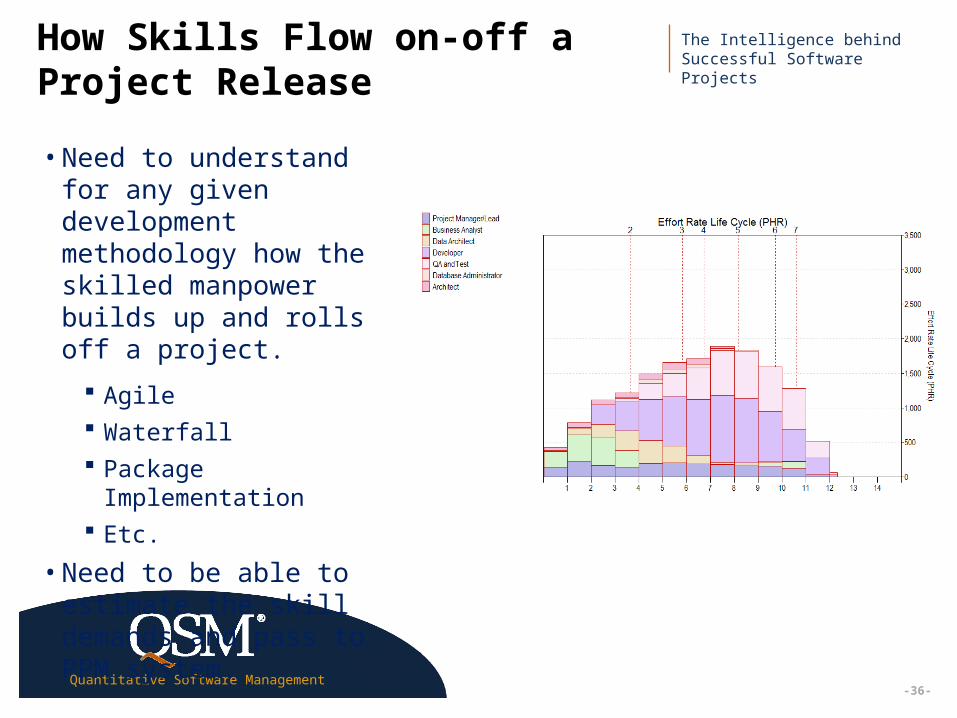
How Skills Flow on-off a Project Release
• Need to understand for any given development methodology how the skilled manpower builds up and rolls off a project.
Agile Waterfall Package
Implementation Etc.
• Need to be able to estimate the skill demands and pass to PPM system.
-37-
The Intelligence behind Successful Software Projects
Quantitative Software Management
ExecutiveSummary
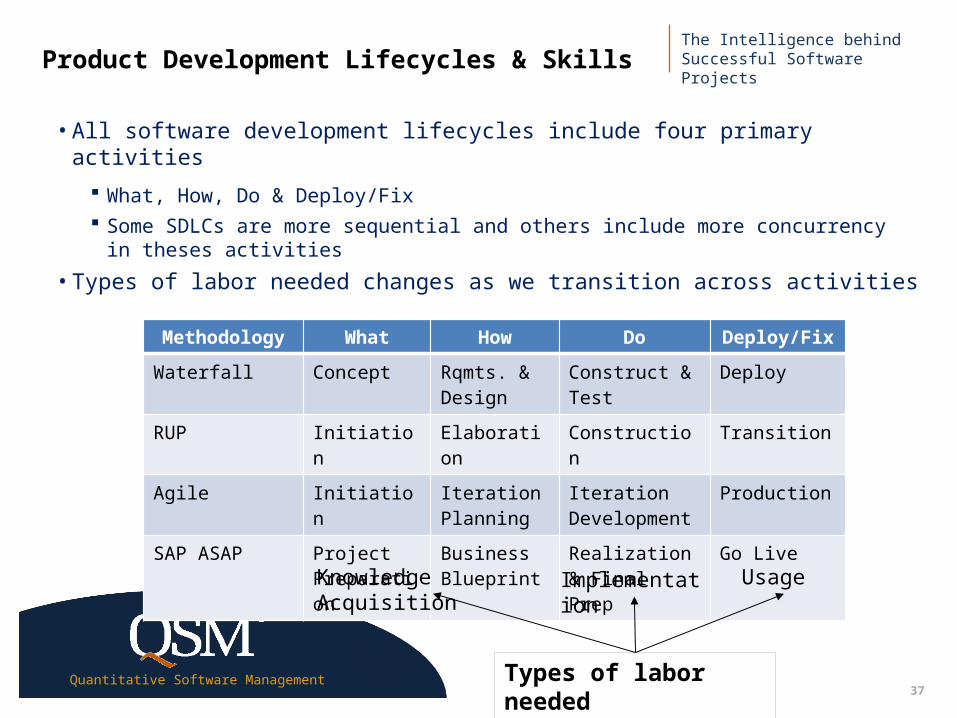
Product Development Lifecycles & Skills
• All software development lifecycles include four primary activities
What, How, Do & Deploy/Fix Some SDLCs are more sequential and others include more
concurrency in theses activities
• Types of labor needed changes as we transition across activities
Methodology What How Do Deploy/Fix
Waterfall Concept Rqmts. & Design
Construct & Test
Deploy
RUP Initiation Elaboration Construction Transition
Agile Initiation Iteration Planning
Iteration Development
Production
SAP ASAP Project Preparation
Business Blueprint
Realization & Final Prep
Go Live
Knowledge Acquisition Implementation Usage
Types of labor needed
The Intelligence behind Successful Software Projects
Quantitative Software Management
ExecutiveSummary
-38-
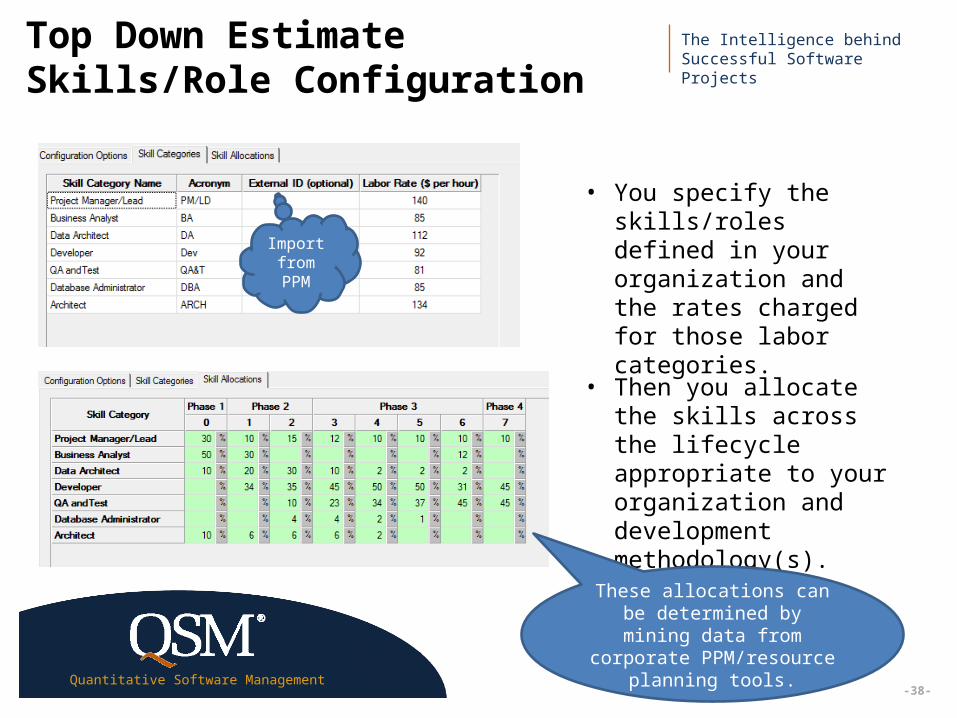
Top Down Estimate Skills/Role Configuration
• You specify the skills/roles defined in your organization and the rates charged for those labor categories.
• Then you allocate the skills across the lifecycle appropriate to your organization and development methodology(s).
These allocations can be determined by mining data from corporate
PPM/resource planning tools.
Import from PPM
The Intelligence behind Successful Software Projects
Quantitative Software Management
ExecutiveSummary
-39-
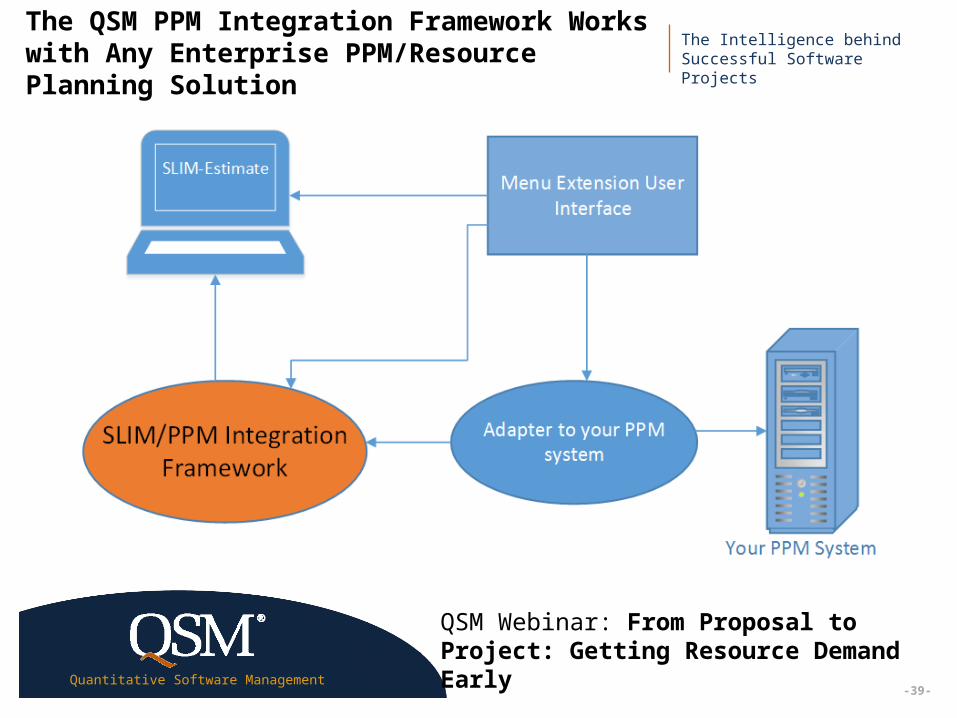
The QSM PPM Integration Framework Works with Any Enterprise PPM/Resource Planning Solution
QSM Webinar: From Proposal to Project: Getting Resource Demand Early
The Intelligence behind Successful Software Projects
Quantitative Software Management
ExecutiveSummary
-40-
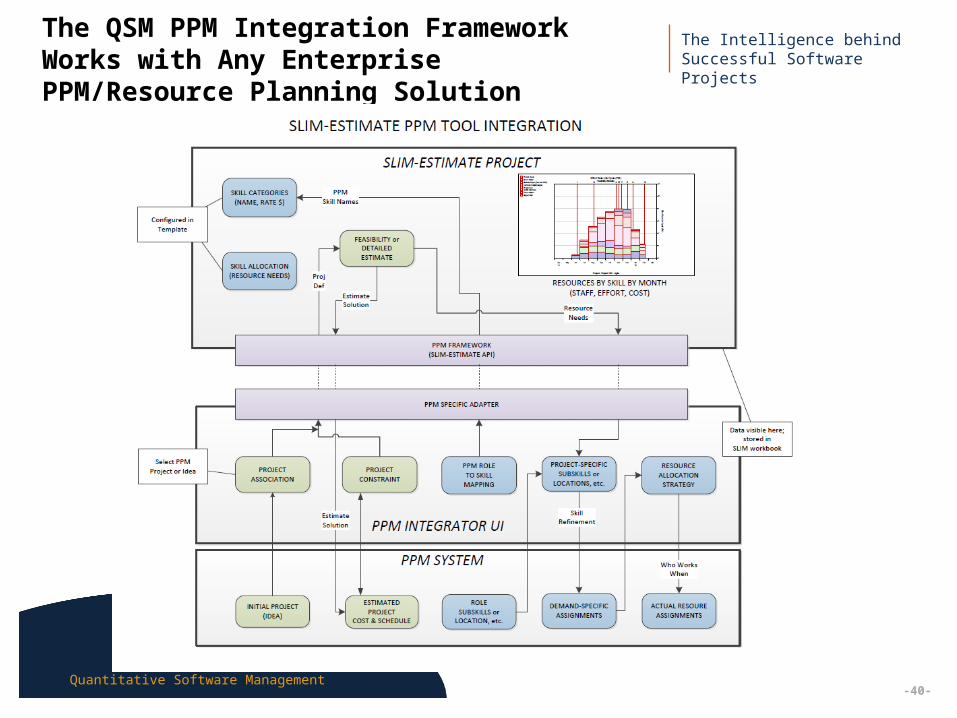
The QSM PPM Integration Framework Works with Any Enterprise PPM/Resource Planning Solution
The Intelligence behind Successful Software Projects
Quantitative Software Management
ExecutiveSummary
Determining Aggregate Demand and Matching Demand to Capacity
-41-
The Intelligence behind Successful Software Projects
Quantitative Software Management
ExecutiveSummary
Schedule Staffing Effort & Cost
Monthly Avg Staff (L0)< Ireland, India & US >
3 6 9 12 15 18 21 24 27Oct'13
Jan'14
Apr Jul Oct Jan'15
Apr Jul Oct Jan'16
0
50
100
150
200
250
300
350
people
Monthly Avg Staff (L1)< Ireland, India & US >
3 6 9 12 15 18 21 24 27Oct'13
Jan'14
Apr Jul Oct Jan'15
Apr Jul Oct Jan'16
0
25
50
75
100
125
150
175
people
Monthly Avg Staff (L2)< Ireland, India & US >
3 6 9 12 15 18 21 24 27Oct'13
Jan'14
Apr Jul Oct Jan'15
Apr Jul Oct Jan'16
0
20
40
60
80
people
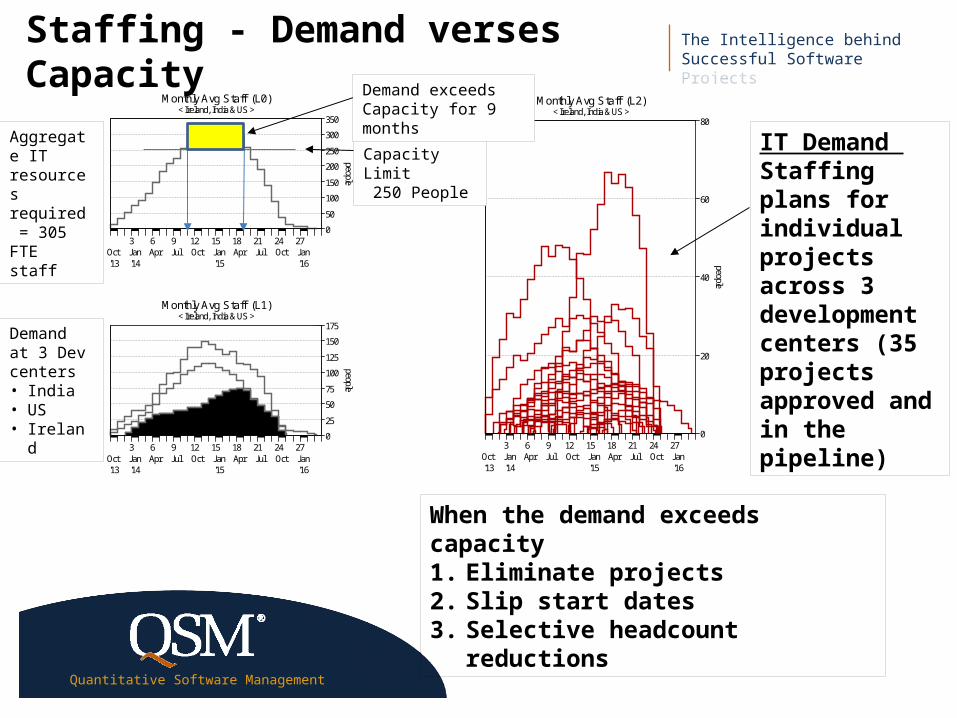
Staffing - Demand verses Capacity
IT Demand Staffing plans for individual projects across 3 development centers (35 projects approved and in the pipeline)
Demand at 3 Dev centers• India• US• Ireland
Aggregate IT resources required = 305 FTE staff
Capacity Limit 250 People
When the demand exceeds capacity 1. Eliminate projects2. Slip start dates3. Selective headcount reductions
Demand exceeds Capacity for 9 months

The Intelligence behind Successful Software Projects
Quantitative Software Management
ExecutiveSummary
-43-
Adjust Start Dates on the Future Projects in Order to Match Demand to Capacity
Staffing & Schedule
Monthly Gantt Chart (L3)< Start dates adjusted to not exceed 250 Max capacity >
3 6 9 12 15 18 21 24 27Oct'13
Jan'14
Apr Jul Oct Jan'15
Apr Jul Oct Jan'16
IRELAND DEVELOPMENT... Ireland Project 001 Ireland Project 002 Ireland Project 003 Ireland Project 004 Ireland Project 005 Ireland Project 006 Ireland Project 007 Ireland Project 008 Ireland Project 009 Ireland Project 010 Ireland Project 011 Ireland Project 012 Ireland Project 013 Ireland Project 014 Ireland Project 015INDIA DEVELOPMENT CEN... India DC Project 001 India DC Project 002
Monthly Avg Staff (L2)< Start dates adjusted to not exceed 250 Max capacity >
3 6 9 12 15 18 21 24 27Oct'13
Jan'14
Apr Jul Oct Jan'15
Apr Jul Oct Jan'16
0
20
40
60
80
people
Projects start dates are moved out in time in order to drop the total aggregate staffing under 250 which is the maximum capacity.
The Intelligence behind Successful Software Projects
Quantitative Software Management
ExecutiveSummary
-44-
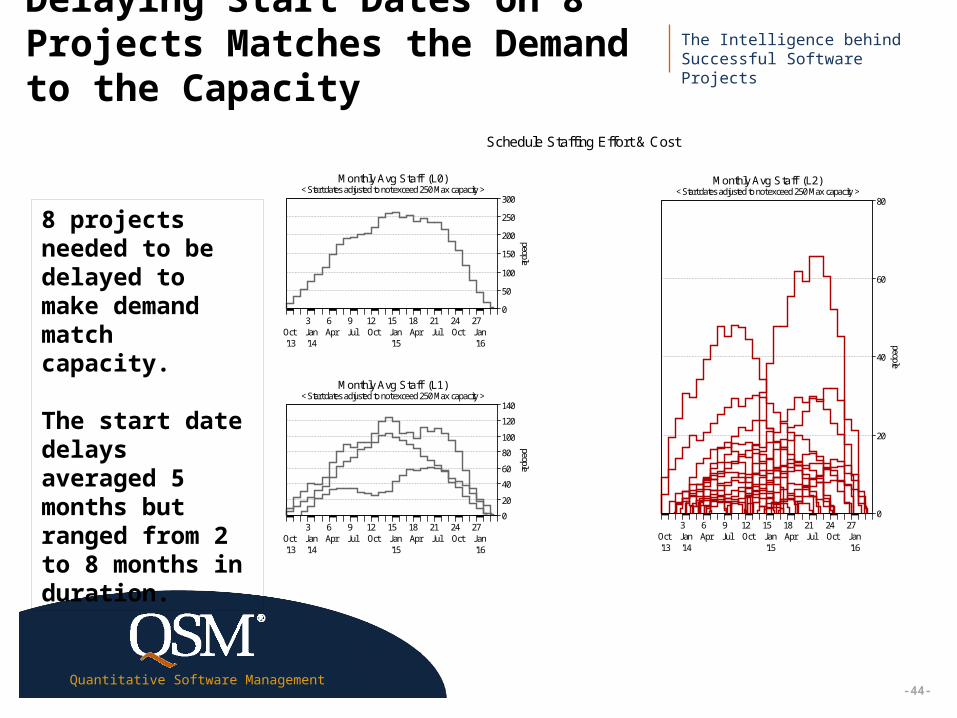
Delaying Start Dates on 8 Projects Matches the Demand to the Capacity
Schedule Staffing Effort & Cost
Monthly Avg Staff (L0)< Start dates adjusted to not exceed 250 Max capacity >
3 6 9 12 15 18 21 24 27Oct'13
Jan'14
Apr Jul Oct Jan'15
Apr Jul Oct Jan'16
0
50
100
150
200
250
300
people
Monthly Avg Staff (L1)< Start dates adjusted to not exceed 250 Max capacity >
3 6 9 12 15 18 21 24 27Oct'13
Jan'14
Apr Jul Oct Jan'15
Apr Jul Oct Jan'16
0
20
40
60
80
100
120
140
people
Monthly Avg Staff (L2)< Start dates adjusted to not exceed 250 Max capacity >
3 6 9 12 15 18 21 24 27Oct'13
Jan'14
Apr Jul Oct Jan'15
Apr Jul Oct Jan'16
0
20
40
60
80
people
8 projects needed to be delayed to make demand match capacity.
The start date delays averaged 5 months but ranged from 2 to 8 months in duration.

The Intelligence behind Successful Software Projects
Quantitative Software Management
ExecutiveSummary
What Is the Demand for Skills Across the portfolio?
-45-
The Intelligence behind Successful Software Projects
Quantitative Software Management
ExecutiveSummary
-46-
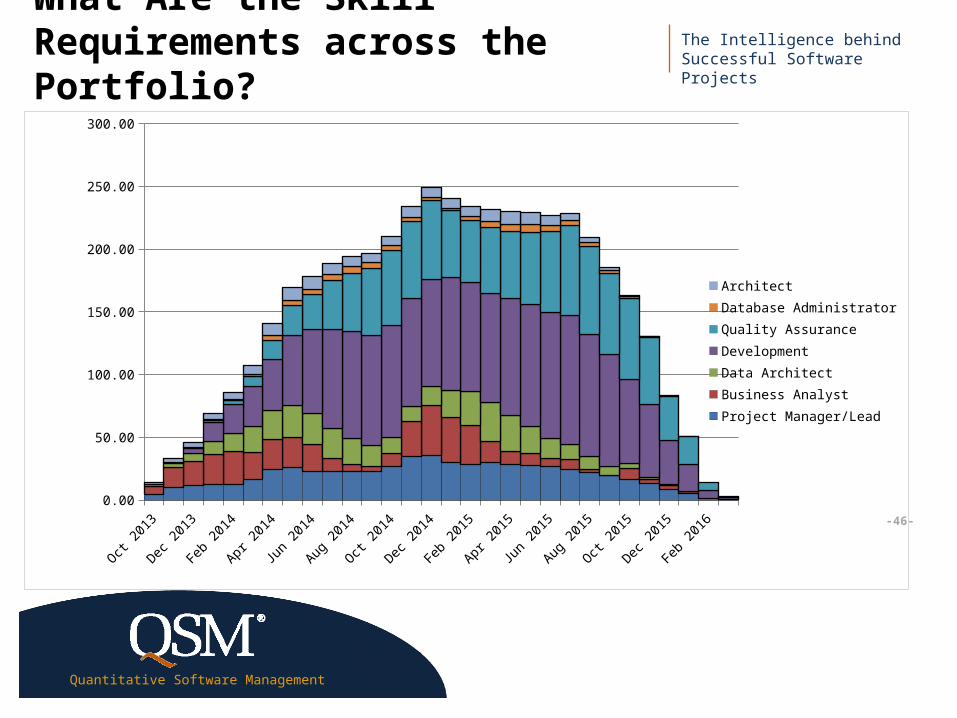
What Are the Skill Requirements across the Portfolio?
Oct 2
013
Dec 2
013
Feb
2014
Apr 2
014
Jun
2014
Aug 2
014
Oct 2
014
Dec 2
014
Feb
2015
Apr 2
015
Jun
2015
Aug 2
015
Oct 2
015
Dec 2
015
Feb
2016
0.00
50.00
100.00
150.00
200.00
250.00
300.00
ArchitectDatabase AdministratorQuality AssuranceDevelopmentData ArchitectBusiness AnalystProject Manager/Lead
The Intelligence behind Successful Software Projects
Quantitative Software Management
ExecutiveSummary
-47-
Summary
• Capacity Planning and Demand Management go hand in hand. It requires:
Sound estimation capability early in the lifecycle
Effective stakeholder negotiations of time/effort/capability
Ability to forecast effort by skill level by month and feed a PPM system
Ability to perform what-if analysis on the portfolio quickly when IT Demand exceed Capacity