1 production capacity versus customer demand by … capacity versus customer demand by toddm. wolf...
TRANSCRIPT

Production Capacity
Versus
Customer Demand
By
ToddM. Wolf
A Research Paper Submitted in Partial Fulfillment of the
Requirements for the Master of Science Degree
In
Technology Management
Approved: Approve 2 Semester Credits
Thomas A. Lacksonen
The Graduate School
University of Wisconsin - Stout
August 2011
1
2
The Graduate School
University of Wisconsin - Stout
Menomonie, Wisconsin
Author: Wolf, Todd M.
Title: Production Capacity Versus Customer Demand
Graduate Degree / Major: MS Technology Management
Research Advisor: Thomas Lacksonen, PhD
Month / Year: August 2011
Number of Pages: 38
Style Manual Used: Publication Manual of the American Psychological Association, Sixth
Edition
ABSTRACT
Company XYZ has continual problems balancing their production capacity with the ever-
changing sales and customer demands. The company has been forced to accommodate to the
customers’ needs through increased overtime. This problem has created breaks in the
manufacturing process of the customers’ orders as well which cause late deliveries and partial
shipments.
The purpose of this project is to review the company’s current production capacity
restrictions and compare it to their sales and customers' demands. Reviewing the data will assist
in configuring a short-term and long-term solution option. This paper will:
1. Evaluate the current production capacity of the main production machinery with
efficiency and utilization calculations taken into consideration.
2. Evaluate the current production Overall Equipment Effectiveness.
3. Generate options for process improvement from findings.

3
Acknowledgements
Thank you to my family and friends who have encouraged me to succeed in my career
and schooling, particularly my wife and two daughters. Without their daily support and
continued understanding, my achievements would not have been made possible.

4
Table of Contents
…………………………………………………………………………………………………Page
Abstract…………………………………………………………………………………………….. 2
List of Tables………………………………………………………………………………………. 6
Chapter I: Introduction……………………………………………………………........................... 7
Problem Statement…………………………………………………………………………. 10
Purpose of the Study...……………………………………………………........................... 10
Objectives or Goals………………………………………………………………………… 11
Limitations of the Study……………………………………………….……………………11
Chapter II: Literature Review……………………………………………………………………… 12
Definitions……….………………………………………………………………………….12
Summary……………………………………………………………………........................ 17
Chapter III: Methodology………………………………………………………….......................... 18
Data Collection Procedure..................................................................................................... 18
Data Analysis……………………………………………………………….….…………... 19
Chapter IV: Results………………………………………………………….…………………….. 23
Rated Capacity……………………………………………………………………............... 23

5
Overall Equipment Effectiveness, OEE……………………………….…………………… 27
Chapter V: Discussion……………………………………………………………………………... 33
Capacity calculation recommendation………………………………………...................... 33
Conclusions……………………………….………………………………………............... 36
References……………………………………………………………………..…................ 38
6
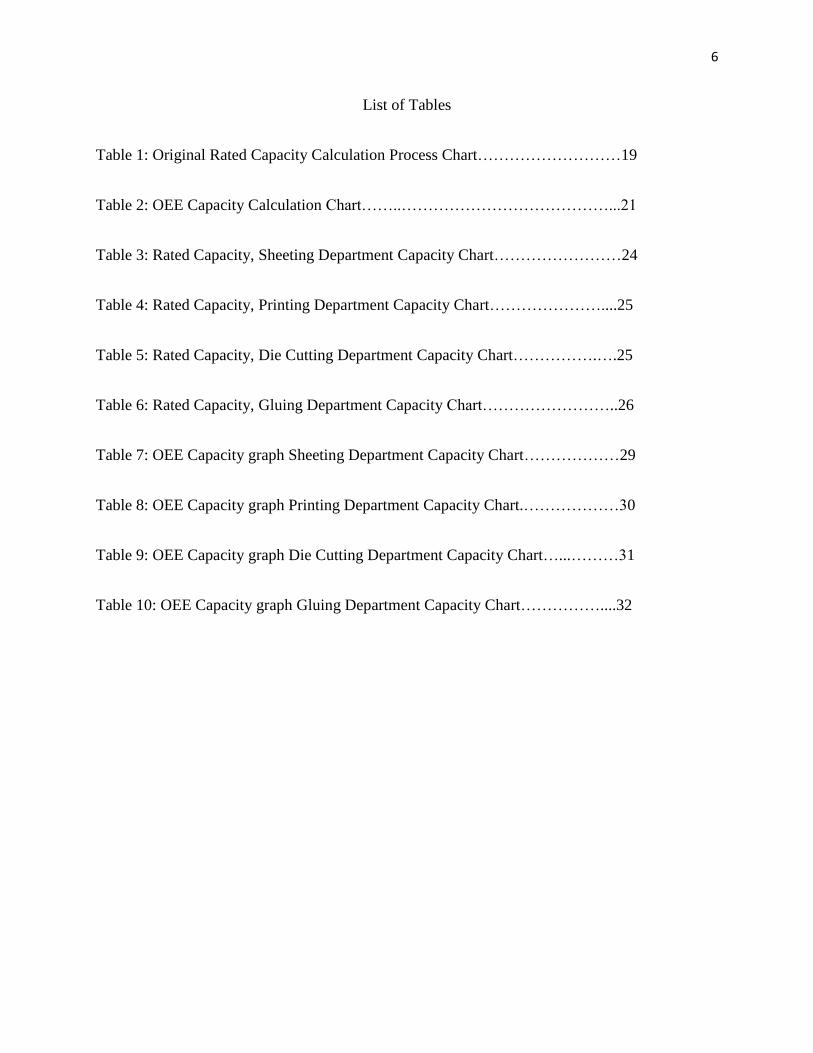
List of Tables
Table 1: Original Rated Capacity Calculation Process Chart………………………19
Table 2: OEE Capacity Calculation Chart……..…………………………………...21
Table 3: Rated Capacity, Sheeting Department Capacity Chart……………………24
Table 4: Rated Capacity, Printing Department Capacity Chart…………………....25
Table 5: Rated Capacity, Die Cutting Department Capacity Chart…………….….25
Table 6: Rated Capacity, Gluing Department Capacity Chart……………………..26
Table 7: OEE Capacity graph Sheeting Department Capacity Chart………………29
Table 8: OEE Capacity graph Printing Department Capacity Chart.………………30
Table 9: OEE Capacity graph Die Cutting Department Capacity Chart…...………31
Table 10: OEE Capacity graph Gluing Department Capacity Chart……………....32

7
Chapter I: Introduction
Company XYZ manufactures folding carton packaging solutions for customers to
package their final consumer product in. This company has been in business for over 88 years
and has hundreds of customers and a high capital investment in its manufacturing equipment.
Company XYZ does packaging for many various industries with a large focus in the food
industry. The packaging is designed specifically for the customers' operations of manual filling
and high-speed, auto-filling machines. The design of the product also allows for the company to
look for ways to improve the customers’ efficiencies of process as well as cost. The company is
considered a job shop with diverse customer product requirements. This means that each job
going through the plant has different production needs and levels of complexity. This
complexity can be in the form of a carton’s many different board substrates to design
configurations, depending on the customers' end-user needs. The company's customers are
incessantly pushing for quicker production turns and reduced pricing. Customers’ production
jobs range in size from 5,000 pieces to over 1,000,000 pieces per product, with multiple product
lines. The company is a make-to-order manufacturer that carries a large amount of raw materials
on hand to reduce the delay in outside raw material backlogs and customer delivery time.
The company has four main production centers that all of the business flows through.
The company has a traditional five-day workweek with multiple shifts creating the crewed hours.
Many times the weekends are used to make up for increased customer capacity or production
shortfalls. The company does sheet all of its board rolls from material that they purchase directly
from the paper mills which means they convert it from roll form to cut sheet form. This is the
process of taking the roll of material and cutting it into sheet form to the exact size to be printed.
They then print all of the graphics in a sheet-fed offset process onto the board material to create

8
cartons from the digital files the customers provide. This offset process of printing can be up to
seven colors at a time with an aqueous or UV coating to protect the packaging from shipping and
fulfillment processes. They then die cut all of the printed sheets into the form of a carton from
tooling made in-house. The tooling is made from a CAD program and then the in-house laser
cuts the die, strippers, and blanker. Finally, they fold and glue the cartons at high speeds using
many forms of detection devices to determine product accuracy. This detection can eliminate
mixed cartons, color variances, and missing glue to eject those of poor quality before they are put
into corrugated boxes for palletizing and shipping to the customer. The load balancing of the
manufacturing departments for capacity is difficult due to the many levels of carton complexity
and the variety of large and small quantities of customer cartons ordered.
Company XYZ presently backward schedules the production process from the customer's
due date. This is where the company’s estimating department reviews the job ticket with the
production department for manufacturing rates along with existing jobs in process. They take
the due date along with each department's estimated production standard of process time and
determine the department production date with consideration to the existing load of jobs in
process. Too often the customer's due date clashes with the present load and creates trouble in
the schedule. It is important that each job is accurate to the company’s standard time estimated
as there is no downtime or slack time scheduled in.
The company has many variables in their present manufacturing process, and they have a
misconception of what their true capacity is. The company has used historic machine rates as the
expected standard of capacity that they can anticipate, multiplying it by the crewed hours of
business. The company also calculates the crewed hours at 90% of actual availability to cover for
machine downtime and maintenance. This issue creates problems in scheduling and creates

9
breaks in jobs as well as late deliveries to the customer. They do not regularly schedule or
regulate their machineries’ downtime for improvements. The company uses overtime to make
up for machinery breakdowns and performance issues along with breaking jobs to make
customer deliveries on time.
They presently measure standard estimated hours versus actual as a process to gauge
budgeted production efficiency. They do review jobs at the completion to define overall process
improvement from the estimated standard versus actual hours. Part of the problem is that they
pad the standards to cover for production shortfalls. Another issue is that the company combines
the customers’ multiple carton quantities and develops production jobs that are invasive and thus
tie up the production schedule so that other customers’ jobs cannot be worked on in a timely
manner. Additionally, production downtime is not measured as a process for improvement, but
more as a part of doing business. This area needs to be better measured and defined as this
reduces the company’s expected capacity and scheduling. One benefit that the company does
have is that many of the customer due dates are for releases of part of the original order quantity.
This allows the company to break the large jobs when customer due dates are in jeopardy of
missing the delivery.
The existing job review does not take into consideration the actual production efficiency
and utilization for process improvements. This can create problems for production if constraints
(i.e., maintenance, breakdowns, absenteeism, and lack of materials) are not taken into
consideration and can contribute to the reduction in the machine’s utilization and overall
efficiency level. This present process creates scheduling problems when customers' demands are
tight and sales volumes are large.
10
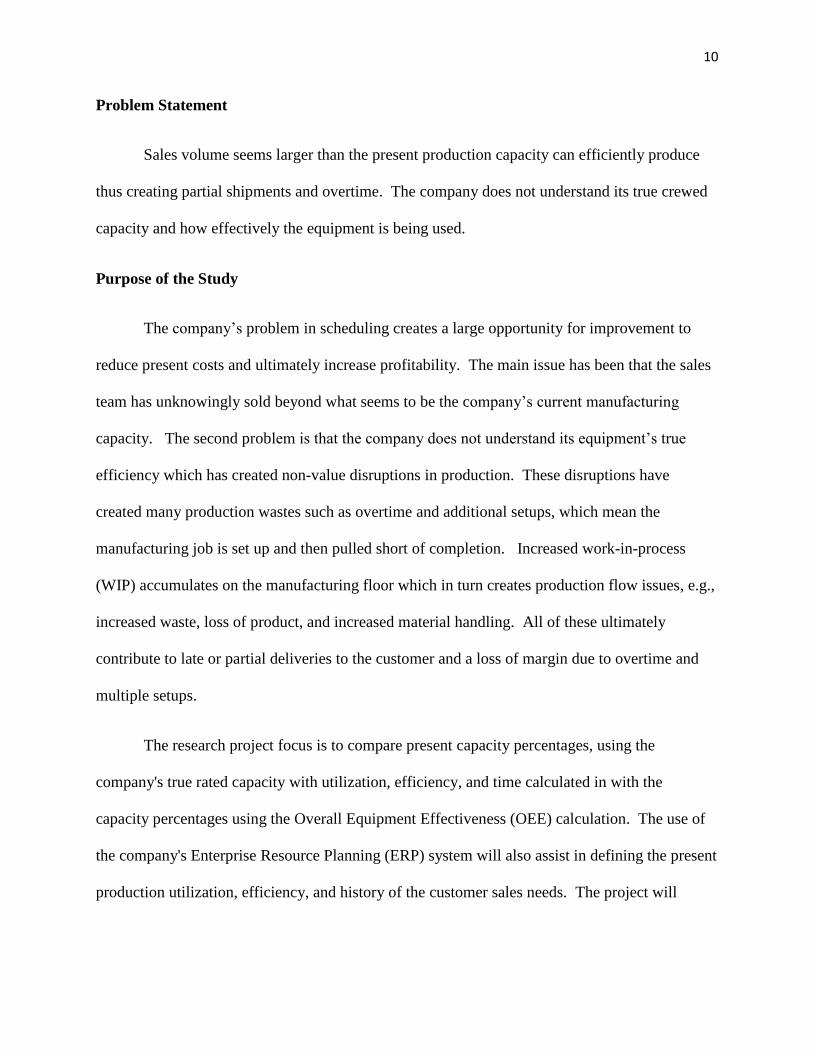
Problem Statement
Sales volume seems larger than the present production capacity can efficiently produce
thus creating partial shipments and overtime. The company does not understand its true crewed
capacity and how effectively the equipment is being used.
Purpose of the Study
The company’s problem in scheduling creates a large opportunity for improvement to
reduce present costs and ultimately increase profitability. The main issue has been that the sales
team has unknowingly sold beyond what seems to be the company’s current manufacturing
capacity. The second problem is that the company does not understand its equipment’s true
efficiency which has created non-value disruptions in production. These disruptions have
created many production wastes such as overtime and additional setups, which mean the
manufacturing job is set up and then pulled short of completion. Increased work-in-process
(WIP) accumulates on the manufacturing floor which in turn creates production flow issues, e.g.,
increased waste, loss of product, and increased material handling. All of these ultimately
contribute to late or partial deliveries to the customer and a loss of margin due to overtime and
multiple setups.
The research project focus is to compare present capacity percentages, using the
company's true rated capacity with utilization, efficiency, and time calculated in with the
capacity percentages using the Overall Equipment Effectiveness (OEE) calculation. The use of
the company's Enterprise Resource Planning (ERP) system will also assist in defining the present
production utilization, efficiency, and history of the customer sales needs. The project will

11
utilize the company’s 2010 data as a model to define and allow the company to better understand
its true calculated capacity versus it sales and develop a plan to correct the constraints.
Objectives or Goals
The project’s objective is to first review the company’s ERP data from the year 2010 and
compare it to the company’s present capacity. Second, compare the data from the company’s
ERP system to define the company’s present rated capacity level with efficiency, utilization, and
work schedules. Third, define the company’s capacity according to OEE. This will present
information that will allow the company to identify what constraints are truly causing issues in
the company’s capacity.
Limitations of the Study
The research project will be limited to the review of the present production flow to the
main four production departments. The four departments covered are the sheeting department,
the printing department, the die cutting department, and finally the gluing department. The
research project will review the machine centers’ present capacity outputs from the ERP data of
2010. Then it will look at whether the manufacturing capacity percentage is balanced evenly
throughout the processes. The data is limited to data compiled from the calendar year of 2010.
The project will not look at any other issues such as customer release changes, graphics issues, or
material backlogs. The project will use overall averages from the overall annual data. Knowing
that there are many variables, the project will limit the scope to just averaged capacity
percentages versus rated capacity percentages and measure the two versus their present capacity.
The project will finally review if the company's rated capacity has areas that are limiting the
company’s capacity.

12
Chapter II: Literature Review
Capacity first needs to be defined and understood as this is the most critical part in an
operations manager’s control. Regardless of which process model Company XYZ chooses to
follow, the decision affects a large portion of the company's fixed cost. This issue is important
as it defines the overall sales capabilities in our just-in-time world. “Good capacity management
makes it possible to have the product available when and where the customer demands it”
(Blackstone, 2002, p. 1). So, if the facility is too large, the machinery may sit idle and create
layoffs during slow times. If the facility is too small, it is forced to utilize overtime, run less
efficiently, outsource, and ultimately lose customers due to missed delivery dates. “Capacity
cannot be stored or saved. If the manufacturing system is not used in a period because of lack of
demand, the related portion of capacity is wasted and cannot be utilized in the future” (Matta &
Semeraro, 2005, p.1). This capacity versus sales problem is a balance in achieving high levels of
utilization for a company and is crucial to long-term longevity and profitability.
Definitions
Development of manufacturing capacity and sizing of facilities has been discussed for
years. In Whitmore’s 1907 article (as cited in Matta & Semeraro, 2005) “an important work of
organizations includes taking stock of the resources at one’s command and planning the fullest
use of them all”. One first need to review and understand some of the many definitions of
capacity. Capacity is “productive ability or potential (a plant with a capacity of 50 metric tons a
month).” “Merriam – Webster, 1987,p.138”. Another definition of capacity is “the set of any
kind of resources that can be used to create value for the customer and, in general, the cost of
capacity is lower than the value the customer pays to acquire the product or service provided”

13
(Matta & Semeraro, 2005, p. 3). Another example is “Capacity is the rate at which work is
withdrawn from the system. Load is the volume of work in the system” (Blackstone, 2002, p. 7).
From this we see that capacity has several, similar definitions which question how any company
defines their capacity. There are several sub points that develop into what is defined as capacity,
and if they are not fully taken into consideration, a company will ultimately run into productivity
issues and continual constraints in their growth and profitability.
When looking at the many different ways that capacity is referenced, there are several of
the definitions used in the capacity process. Capacity planning is the “process of determining the
amount of capacity required to produce in the future” (Blackstone, 2010, p. 19). This is the first
step in the overall planning and scheduling of the resources a company has presently in place. At
some point this would also include a company’s plans for future capacity growth which would
take considerable lead time, e.g., the purchase of a new machine.
Most companies understand, to some level, what is called design capacity, which is “the
maximum theoretical output of a system in a given period. It is normally expressed as a rate,
such as the number of tons of steel that can be produced per week, per month, per year” (Heizer
& Render, 2001, p. 252). This concept of capacity can throw companies into confusion. As an
example, if the company does not understand their manufacturing units of measure throughout
their processes and the changes that occur, a misunderstanding can cause problems if it is not
taken into proper calculation. The units of measure need to be common throughout the
manufacturing process. This issue can be a definite issue when it comes to line balancing and
identifying true bottlenecks within the processes.

14
Rated or nominal capacity is “the expected output capability of a resource or system.
Capacity is traditionally calculated from such data as planned hours, efficiency, and utilization.
The rated capacity is equal to hours available times efficiency times utilization” (Blackstone,
2010, p. 126). This rated or nominal capacity does take into consideration the issues of overall
performance in materials, employee skill, absenteeism coverage, machine maintenance, and the
overall performance issues of the process. Furthermore design capacity is the “theoretical
maximum output of a system in a given period. Most organizations operate their facilities at a
rate less than the design capacity. They do so because they have found that they can operate
more efficiently when their resources are not stretched to the limit. Instead they expect to
operate at perhaps 92% of design capacity” (Heizer & Render, 2001, p. 252).
Effective capacity is “the capacity a firm expects to achieve given the current operating
constraints. Effective capacity is often lower than the design capacity, because the facility may
have been designed for an earlier version of the product or a different product mix than is
currently being produced” (Heizer & Render, 2001, p. 252). The effective capacity tends to be
the softer side of capacity planning as the rates tend to have the company XYZ’s history taken
into consideration. A company may also use more of an effective capacity standard as they
maintain old machines that may have more maintenance or failure rates, also when implementing
new equipment and or the initial process is still new. Companies’ also use effective capacity as
they may try to compensate for issues with material, man power, training, and equipment short
falls.
Two additional areas for measurement of machinery performance that need to be taken
into consideration when calculating effective or rated capacity are equipment efficiency and
utilization. Efficiency is the “standard hours produced divided by the actual hours worked.
15
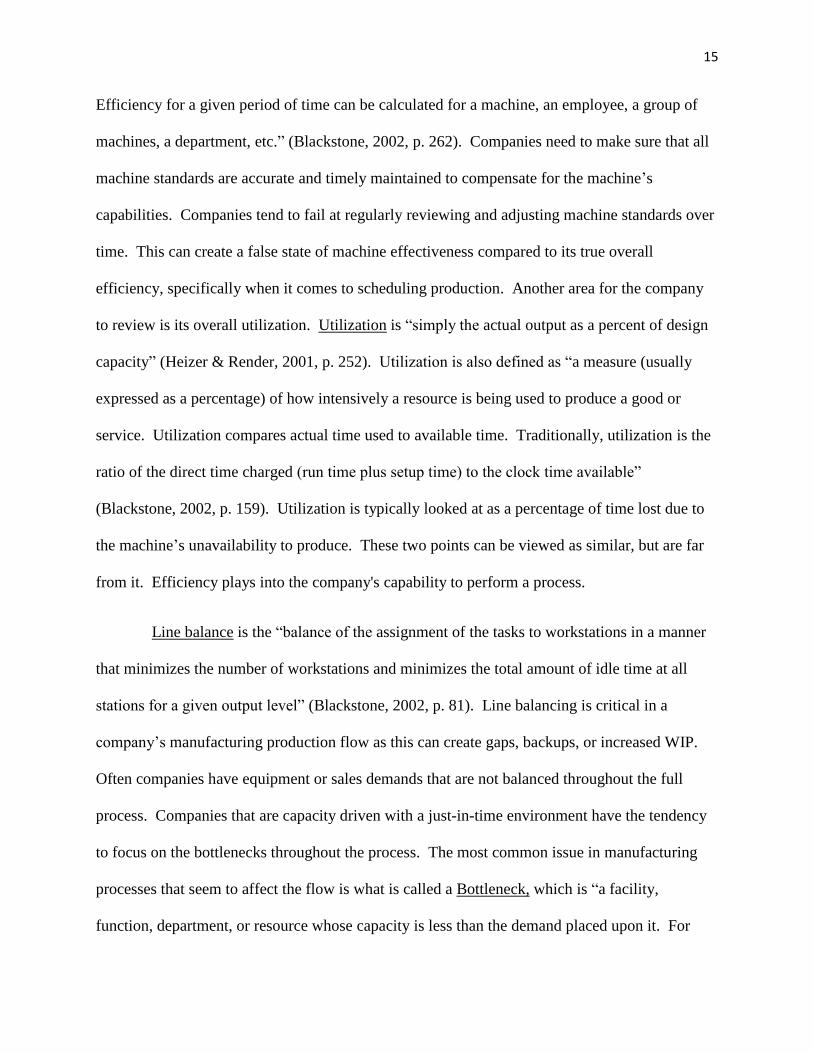
Efficiency for a given period of time can be calculated for a machine, an employee, a group of
machines, a department, etc.” (Blackstone, 2002, p. 262). Companies need to make sure that all
machine standards are accurate and timely maintained to compensate for the machine’s
capabilities. Companies tend to fail at regularly reviewing and adjusting machine standards over
time. This can create a false state of machine effectiveness compared to its true overall
efficiency, specifically when it comes to scheduling production. Another area for the company
to review is its overall utilization. Utilization is “simply the actual output as a percent of design
capacity” (Heizer & Render, 2001, p. 252). Utilization is also defined as “a measure (usually
expressed as a percentage) of how intensively a resource is being used to produce a good or
service. Utilization compares actual time used to available time. Traditionally, utilization is the
ratio of the direct time charged (run time plus setup time) to the clock time available”
(Blackstone, 2002, p. 159). Utilization is typically looked at as a percentage of time lost due to
the machine’s unavailability to produce. These two points can be viewed as similar, but are far
from it. Efficiency plays into the company's capability to perform a process.
Line balance is the “balance of the assignment of the tasks to workstations in a manner
that minimizes the number of workstations and minimizes the total amount of idle time at all
stations for a given output level” (Blackstone, 2002, p. 81). Line balancing is critical in a
company’s manufacturing production flow as this can create gaps, backups, or increased WIP.
Often companies have equipment or sales demands that are not balanced throughout the full
process. Companies that are capacity driven with a just-in-time environment have the tendency
to focus on the bottlenecks throughout the process. The most common issue in manufacturing
processes that seem to affect the flow is what is called a Bottleneck, which is “a facility,
function, department, or resource whose capacity is less than the demand placed upon it. For

16
example, a bottleneck machine or work center exists where jobs are processed at a slower rate
than they are demanded” (Blackstone, 2010, p. 15). Bottlenecks can move from one production
point to another as they are addressed.
Capacity measuring has been a manufacturing problem for many years and in many
ways. The process of manufacturing a product for a customer is relative to all areas of doing
business whether in the manufacturing or service industries. The customer tends to want the
product or materials with the highest level of quality at the lowest price and, of course, as fast as
possible. These topics can create a company problem in maintaining and achieving a profitable
bottom line.
Additional processes and definitions that can assist in improving some capacity problems
would start with some overall Lean processes. The first would be the understanding of Total
Productive Maintenance (TPM), which is the “preventive maintenance plus continuing efforts to
adapt, modify, and refine equipment to increase flexibility, reduce material handling, and
promote continuous flows” (Blackstone, 2010, p. 154). This process opens up several Lean
options to improve the company’s overall capacity and timely throughput. A Lean process that
deals with the key concepts of maintenance and the overall loss and effectiveness of the
equipment is OEE. OEE is “a hierarchy of metrics that focus on how effectively a
manufacturing operation is utilized” (Stamatis, 2010, p. 21). OEE has six defined losses in
equipment: 1. Break downs 2. Setups/adjustments or make readies 3. Idle/stops that are not
planned 4.Rreduced machine speeds 5. Scrap or waste 6. Start-up yield. Overall OEE looks
specifically at three main areas. The first is availability, which is the time scheduled or uptime.
Next is efficiency or performance, which reviews the total parts good and bad produced in a
particular time compared to standard. Last is the quality rate, which reviews the amount of total

17
good, divided by the total production run creating the percentage of quality to be used in the
formulation of OEE. Overall OEE monitors and reviews machine performance and downtime to
assist in root cause analysis.
The additional problems that have surfaced over the years are the company’s ability to
control and understand their capacity in relationship to their sales needs. Companies tend to fail
in regularly and properly measuring capacity, and as their sales grow, they tend to react
haphazardly in forecasting future capacity requirements. This is mainly due to the lack of a true
understanding of what their present capacity is and also the sales demand needs. Companies also
tend to overlook machine downtime and overall view it as a part of doing business. This can be
a large area for improvements if one measures and reviews the root cause of these issues.
If capacity and sales are not measured and equal, the company will have problems.
Summary
In review, the process of capacity management starts in the full understanding and
measurement of a facility’s manufacturing processes. The company process needs to take into
consideration the overall availability, utilization, and efficiency of the equipment throughout the
manufacturing processes with the overall quality. This understanding and the use of
performance data allows for companies to react and control the ever-changing sales needs while
maintaining company profitability. The company also needs to understand and define their
manufacturing downtime for areas of improvement as this can be a large area of waste in overall
efficiency and utilization. Waste is not always measured in material, but also in lost time or poor
manufacturing efficiencies. Company XYZ will use the OEE data to determine its true current
capacity.

18
Chapter III: Methodology
Capacity has been a continual problem for Company XYZ. This company has been in
business for over 88 years with a large emphasis in food markets. With continued customer
focus on quicker production turns and reduced pricing, the problem of capacity creates a large
opportunity for improvement to reduce present costs and ultimately increase profitability. The
company is considered a large format manufacturer in the manufacture of paper board packaging
also known as a folding carton, although they also compete with both small to large production
runs. The main issue has been that the sales team is unknowingly selling beyond the company’s
manufacturing capacity. This issue is creating non-value disruptions in production trying to
achieve the customers’ manufacturing due dates. These disruptions are creating increased
production waste, overtime, poor production efficiencies and additional setups as well as split
production runs and late or partial deliveries to the customer. This is also causing an increase in
WIP on the manufacturing floor which in turn creates production flow issues.
Data Collection Procedure
The project first started with compiling the company’s data for their standards of
manufacturing capacity in each of the four manufacturing departments. This was accomplished
by pulling information from the company’s computerized ERP system. A summary of the
Production Efficiency Reports and the detail reports for the production centers were used. The
2010 data was collected and provided more information than was needed for this project. The
ERP data reports provided quantities of good product as well as the exact amount of reported
waste per production center.

19
The production summary report also provided the average run standard which is what the
production center achieved in production. The company’s standards are the companies’
historical rates used in estimating the production time whether it’s the setup or run time for
estimating costing and scheduling. The reports also provided the actual manufacturing machine
output or actual time.
Data Analysis
Using the company’s ERP data from the year 2010, Rated capacity was calculated for the
four manufacturing departments. Table 1 reviews the calculation process for calculating rated
capacity for all production departments.
Table 1: Original Rated Capacity Calculation Process Chart
This calculation will provide a percentage of utilization and efficiency to use with the
time available to equal rated capacity that the company presently has. First I calculated each
production department’s utilization by annual hours available minus hours down divided by the
total hours available. (Annual work hours available are calculated at 251 workdays multiplied by
8 hours per shift.) Second I calculated each production department’s efficiency with the standard
hours produced divided by hours worked. Both calculations are then individually multiplied by
100 to provide the respective percentage. Then both percentages are multiplied by the time
available to equal the rated capacity. The calculated number equals the production time it should

20
have taken the production center with the variables taken into consideration. By taking the
calculated capacity number and dividing it by the number of work days (251 for our calculations)
this then provides the number of production hours per work day. Then by subtracting the
production hours per work day from the crewed hours available you have the hours of lost
productivity per crewed day.
The calculated rated capacity provides the company with what the actual hours produced
for the allotted time should be with the utilization and efficiency variables taken into
consideration. This compared to the company’s historical efficiency standard will show a
production gap for root cause analysis. This is important for the company as it provides the
ability to review the difference in percentage to use in calculating capacity moving forward.
This also allows the company to understand the difference and define a way to measure for the
sales they are presently at. This can be calculated on a weekly or monthly basis to measure
changes in the company’s processes and overall capacity difference. The rated capacity also
allows the management to monitor the individual production areas of utilization, efficiency, and
time available. This will allow a quicker understanding for management to maintain on a daily
basis for the machine’s manufacturing processes.
The calculated OEE process used the same data from the company’s ERP reports when
calculating the rated capacity. The OEE process broke down the production components into a
framework of three calculations which are availability, efficiency, and quality. The three
components provided the company with individual efficiency percentages for each production
department component. The OEE is the multiplication total of the three production components,
calculations are summarized in Table 2 using the companies ERP data.

21
Table 2: OEE Capacity Calculation Chart
First, look at availability which was the company’s overall total available work hours.
This was calculated as 251 workdays multiplied by 24 work hours. Company XYZ only
operates manufacturing on a five-day workweek. The opportunity for overtime is looked at as a
capacity buffer for weekend working only. The company does not want to rely as it presently
does on weekend work. The overtime hours are then added to the regular hours subtracting any
planned downtime. Then the manufacturing operating time is divided by the net available hours
to provide the percentage of available time. This percentage will be used later in calculating the
OEE.
Second, I calculated the OEE’s efficiency, which takes Company XYZ total sheets of
product processed in that particular machine process. The Difficult part is that the company
22
needs to define the machine’s run standard. Company XYZ presently uses its historical
standards for the production machine. Instead this could be the machine’s theoretical run
standards or it could be the average rate that the company has from the ERP data reports. This
allows the company to provide growth goals and assist in reviewing gaps in production. The
present problem is that many of the production machines are running above one hundred percent
and this leaves the employees feeling that they are already performing above 100% efficiency
and throws off the production schedule. Next the company takes the standard hours of operating
time and divides it by the actual operating time. This can also cause a problem if the company’s
estimating standards are not accurate and updated on a regular basis.
Third, I calculate the OEE’s quality, which takes Company XYZ’s total production
through the machine and subtracts the nonconforming product. Then I divide the good quantity
by the total production to provide the percentage of quality in this machine process. Quality is
the easiest to define at this step as either good or bad for calculating purposes.
Last, we take the three percentages and multiply them together to provide us with the
OEE’s percentage. This calculation is more detailed than rated capacity and allows for more
review of important areas of production like planned down time.
Recommendations were made to Company XYZ that when manufacturing processes use
this percentage number on a daily basis, they tend to be more mindful of the daily problems that
affect the percentages. This also allows the company to focus on an overall percentage versus a
job-by-job performance number. The additional concept in OEE is to continually improve and
review the parts of the process.

23
Chapter IV: Results
Through the data collection and analysis process, this research project was able to
calculate the Company XYZ’s rated capacity and OEE capacity percentages. Through this data,
I compared and identified that the company has significant capacity calculation gaps and room
for improvement. Furthermore, the company’s present rated capacity efficiency versus the OEE
capacity calculation shows discrepancies. As an example of the gap between the rated capacity
efficiency component equaling 131%, and OEE efficiency of 92% on the sheeter. The printing
department which is the most costly in hourly rates and an overall schedule constrictor has a
118% present rated efficiency compared to OEE of 66% efficiency.
Rated Capacity
First I gathered the company’s computerized ERP system reports of the annual data for
the four main production centers. Through summary and detailed reports this data provided the
actual hours of production. These reports listed actual hours worked versus hours crewed for the
production centers. This data also gave what the company’s efficiency is presently considered
with averaging all of the annual production. Both of the capacity calculations were based on a
251 - working day period per year. All shifts were considered to be 8 hours 5 days a week. It
was also important in calculating the rated and OEE capacities that the data nomenclature in the
charts was kept separate and consistent for each of the two capacity calculations.
Next I calculated the four production centers according to the rated capacity process
chart. The first of the four main machine centers for this project was the sheeting department.
This is the department where the materials come directly from the board mill in roll form. The
sheeter cuts the rolls into a sheet form to be consumed by the printing department. All processes
except for the gluer are sheet form processes.
24
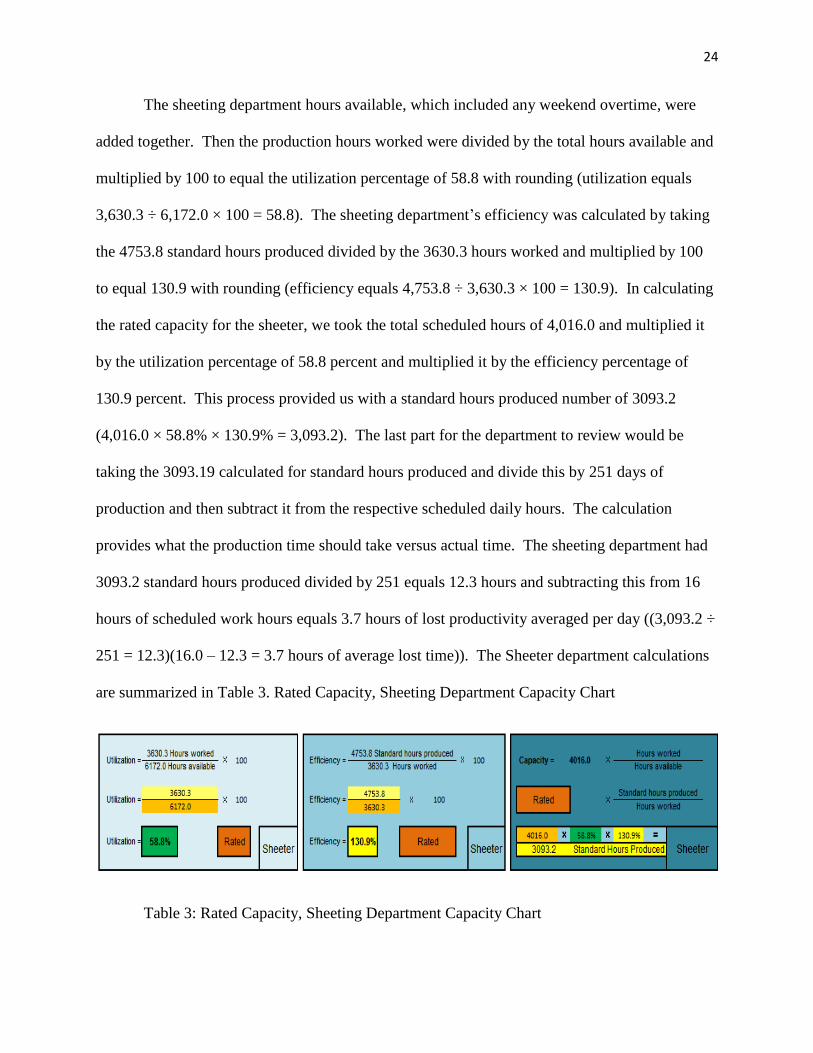
The sheeting department hours available, which included any weekend overtime, were
added together. Then the production hours worked were divided by the total hours available and
multiplied by 100 to equal the utilization percentage of 58.8 with rounding (utilization equals
3,630.3 ÷ 6,172.0 × 100 = 58.8). The sheeting department’s efficiency was calculated by taking
the 4753.8 standard hours produced divided by the 3630.3 hours worked and multiplied by 100
to equal 130.9 with rounding (efficiency equals 4,753.8 ÷ 3,630.3 × 100 = 130.9). In calculating
the rated capacity for the sheeter, we took the total scheduled hours of 4,016.0 and multiplied it
by the utilization percentage of 58.8 percent and multiplied it by the efficiency percentage of
130.9 percent. This process provided us with a standard hours produced number of 3093.2
(4,016.0 × 58.8% × 130.9% = 3,093.2). The last part for the department to review would be
taking the 3093.19 calculated for standard hours produced and divide this by 251 days of
production and then subtract it from the respective scheduled daily hours. The calculation
provides what the production time should take versus actual time. The sheeting department had
3093.2 standard hours produced divided by 251 equals 12.3 hours and subtracting this from 16
hours of scheduled work hours equals 3.7 hours of lost productivity averaged per day ((3,093.2 ÷
251 = 12.3)(16.0 – 12.3 = 3.7 hours of average lost time)). The Sheeter department calculations
are summarized in Table 3. Rated Capacity, Sheeting Department Capacity Chart
Table 3: Rated Capacity, Sheeting Department Capacity Chart
25
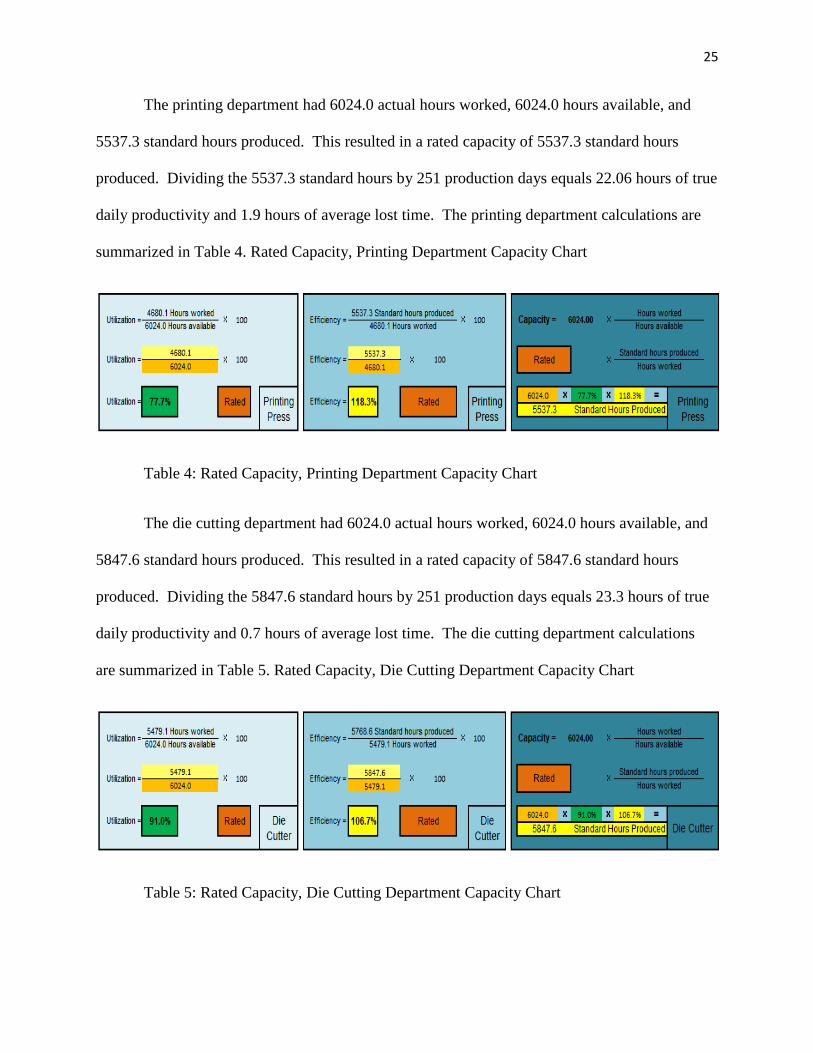
The printing department had 6024.0 actual hours worked, 6024.0 hours available, and
5537.3 standard hours produced. This resulted in a rated capacity of 5537.3 standard hours
produced. Dividing the 5537.3 standard hours by 251 production days equals 22.06 hours of true
daily productivity and 1.9 hours of average lost time. The printing department calculations are
summarized in Table 4. Rated Capacity, Printing Department Capacity Chart
Table 4: Rated Capacity, Printing Department Capacity Chart
The die cutting department had 6024.0 actual hours worked, 6024.0 hours available, and
5847.6 standard hours produced. This resulted in a rated capacity of 5847.6 standard hours
produced. Dividing the 5847.6 standard hours by 251 production days equals 23.3 hours of true
daily productivity and 0.7 hours of average lost time. The die cutting department calculations
are summarized in Table 5. Rated Capacity, Die Cutting Department Capacity Chart
Table 5: Rated Capacity, Die Cutting Department Capacity Chart

26
The gluing department had 6024.0 actual hours worked, 6024.0 hours available, and
4696.7 standard hours produced. This resulted in a rated capacity of 4696.7 standard hours
produced. Dividing the 4696.7 standard hours by 251 production days equals 18.7 hours of true
daily productivity and 5.3 hours of average lost time. The gluing department calculations are
summarized in Table 6. Rated Capacity, Gluing Department Capacity Chart
Table 6: Rated Capacity, Gluing Department Capacity Chart
Rated capacity provides some idea for lost hours of improvement on an averaged out
daily basis. This process provides a percentage that can be reviewed daily versus annually. One
concern is that Company XYZ has standard rates that are above 100 percent. This issue shows
that the machines are either performing better then the machines are manufactured to produce or
the company has a built-in fluff standard calculated in. The company should have as close to
actual machine production rates for a standard as this allows reviewing true areas for
improvement. The rated capacity falls short in providing detailed capacity improvements
especially if the company has rates that are either old or above 100 percent.

27
Overall Equipment Effectiveness, OEE
The next section will review the calculating capacity process using OEE. This process
will provide additional data and details for the company to review. OEE calculations were
performed on each of the four main manufacturing departments.
The OEE process has six areas where manufacturing machines seem to have their biggest
losses: 1. Breakdowns 2. Setup / adjustments 3. Idle/stops 4. Reduced speed 5. Scrap 6. Start-up
yield. These areas should be reviewed as high areas for improvements. The company should
break each of the six points down, and when a time losses falls into one of them, they can look
for the root cause of the problem and correct it. This process will at first be time-consuming and
frustrating. This is typical since it is easier to perform at a reduced speed rather than correct the
problem and run appropriately. If involved, the employees can and will become highly
productive in correcting the processes over time.
The OEE provides additional information for the company when implemented to its
fullest. One use is Total Effective Equipment Performance (TEEP), which measures the
effectiveness based on the calendar hours as OEE measures effectiveness against scheduled
hours. Another area that OEE provides guidance in is the TPM, which provides additional
means to monitoring and improving your manufacturing machine processes from a maintenance
perspective. OEE identifies many of the problems that are maintenance related and preventable.
The process of using OEE may be used as a benchmark for performance and capacity as well as
measuring benchmarks for improvements. It is an effective tool to be used in measuring and
monitoring areas for improvement. This process provides a means to measuring and reviewing
of data in specific areas for continual improvement.

28
The sheeting department’s OEE is divided into three areas of calculation. The first area
is Available, which starts with regular work hours available of 6024.0. Adding the overtime
hours of 148.0 provided an available hours amount of 6172.0. The sheeting department has a
planned downtime of 2008.0 hours due to the fact that it is only a two-shift department and one
shift equals 2008.0 hours annually. I take the 6172.0 hours and subtract the 2008.0 hours of
planned downtime to equal the net available hours of 4164.0. By taking the actual operating
time of 3630.0 hours of time it took to produce the work from the net available hours, you get
534.0 hours of unplanned downtime. To calculate the total downtime for the sheeter, I subtract
the total operating time from the available hours which equals 2542.0. To calculate the available
percentage, we divide the operating time of 3630.0 by the net available hours of 4164.0 to equal
0.872 or 87.2%.
The second area of calculating the OEE is efficiency that starts with filling in the
actual production which for the sheeter is sheets of board stock equaling 26,873,492. The next
entry is the standard sheets per hour. Company XYZ’s 2010 average rate of 8046.0 as the
sheeter machine’s standard is high, and the company has not adjusted its estimated rates yet. The
next entry is the calculation of standard cycle times per hour which is 1.0 divided by the 8046.0
sheets per hour equaling 0.000124. Next take the total actual production quantity of 26,873,492
sheets and divide this by the standard sheets per hour of 8046.0 to equal the standard time of
3340.0 hours. The last entry for efficiency is the operating time of 3630.3. The efficiency
percentage is calculated by taking the standard time of 3,340.00 and dividing it by the operating
time of 3,630.29 to equal 0.920 or 92% efficiency.
The last area of the OEE’s three calculations is the quality calculation. First enter in the
actual production of 26,873,492 sheets. Then enter in the rejects or waste of 193,200 sheets.

29
Next subtract the rejects or waste from the total actual production to equal the good production.
The quality percentage is calculated by taking the good production of 26,680,292 sheets and
dividing it by the actual production of 26,873,492 sheets, which equals 0.992 or 99.2%.
The final part in calculating the OEE is to take the availability percentage of 0.872 and
multiply that by the efficiency percentage of 0.920 and multiply that by the quality percentage of
0.993 which equals 0.796 or 80% OEE. World-class OEE is anything above 85% so there is
room for improvement in the sheeting department. Data and calculations for the Sheeter
department OEE is summarized in Table 7. OEE Capacity graph Sheeting Department Capacity
Chart.
Table 7: OEE Capacity graph Sheeting Department Capacity Chart

30
The printing department had 6024.0 actual hours available and worked an additional
1251.0 hours of overtime, and 208.0 hours of planned downtime, resulting in an availability of
66.2%. The printer had actual production of 22,918,619 sheets at a standard of 7445.0 standard
sheets per hour, resulting in efficiency of 65.8%. The printer had 1,063,907 rejects, resulting in a
quality of 95.4%. OEE for the Printer was 0.415 or 41.5%. Calculations are summarized in
Table 7. World-class OEE is anything above 85%, so the printing department has some serious
issues to review for improvement. Data and calculations for the Printing department OEE is
summarized in Table 8. OEE Capacity graph Printing Department Capacity Chart.
Table 8: OEE Capacity graph Printing Department Capacity Chart

31
The die cutting department had 6024.0 actual hours available and worked an additional
408.0 hours of overtime, and 444.0 hours of planned downtime, resulting in an availability of
91.5%. The die cutter had actual production of 25,034,706 sheets at a standard of 5738.0
standard sheets per hour, resulting in efficiency of 79.6%. The die cutter had 12,897 rejects,
resulting in a quality of 99.9%. OEE for the Die Cutter was 0.728 or 72.8%. Calculations are
summarized in Table 8. World-class OEE is anything above 85%, the die cutting department has
some serious issues to review for improvement. Data and calculations for the Die cutting
department OEE is summarized in Table 9. OEE Capacity graph Die cutting Department
Capacity Chart.
Table 9: OEE Capacity graph Die Cutting Department Capacity Chart

32
The gluing department had 6024.0 actual hours available and worked an additional 480.0
hours of overtime, and 486.3.0 hours of planned downtime, resulting in an availability of 68.2%.
The gluer had actual production of 231,345,750 sheets at a standard of 61,928.0 standard cartons
per hour, resulting in efficiency of 91.0%. The gluer had 1,921,396 rejects, resulting in a quality
of 99.2%. OEE for the Gluer was 0.616 or 61.6%. Calculations are summarized in Table 9.
World-class OEE is anything above 85%, the gluing department has some serious issues to
review for improvement. Data and calculations for the Gluing department OEE is summarized
in Table 10. OEE Capacity graph Gluing Department Capacity Chart.
Table 10: OEE capacity graph Gluing Department Capacity Chart

33
Chapter V: Discussion
The purpose of this study was to calculate and identify what the Company XYZ’s
capacity was with the data from the year 2010. I first calculated the company’s rated capacity
percentages and defined it to the four main manufacturing departments. I also defined and
calculated the OEE capacity percentages with the same 2010 data. This also allowed the
identification of several areas that can cause some misunderstandings and conclusions to help the
company.
In the first part of reviewing the two capacity calculations and determining which
capacity process is best suited, it is important to understand that Company XYZ has a problem
achieving capacity for its present sales volume. This issue allowed us to calculate the company’s
capacity to define if this was a true problem or a symptom. I then chose two separate processes
to define and calculate capacity for the company.
Capacity calculation recommendation
The rated capacity process allowed the data to be configured in a standard that could be
duplicated and monitored. The problem was that there was little explanation in the area of
making suggestions for improvements. It was also found that when the departments that were
crewed for three shifts the standard hours produced data entered in the efficiency calculation to
equal the final standard hours produced. This created a quandary as the final calculation of
standard hours produced has the Utilization of the total availability calculated in along with
Efficiency of the actual companies’ machine standards compared to actual time taken. The final
calculation uses the other two data calculations and the only variable was that the sheeter
department did not operate at 24 hours compared to the other three departments.

34
In the rated capacity process, first look at the department’s utilization. This was found to
be misleading since not all departments were scheduled for 24 hours of production, and it really
did not include overtime hours worked as part of the hours available. This may be a better
reflection for a company that is scheduled for 24/7 operations as then you do not have
unscheduled hours of production opportunities to fall back on during capacity constraints. The
review of the rated capacity efficiency portion created the largest area of concern in this capacity
calculation as it is dependent on the company’s machine rates being as accurate. Rated
efficiency I had efficiency ratings from a low of 107% to a high of 131%. This creates false
ideas with capacity constraints in getting the workload out. This can also create scheduling
problems if there is not a consistency in the four machine efficiency rates. Efficiencies above
100% were overshadowing the downtime creating two independent areas of scheduling
constraints and misconceptions. The last part in the rated capacity process was multiplying the
time available with the utilization and efficiency percentages to equal the rated capacity’s
standard hours produced. This basically told you that when you use the company’s utilization
and efficiency you get the machine’s standard hours. This may work for some companies, but
this company is in need of details in what they can improve on and the standard of hours
produced would not work. So the company should use the OEE capacity process.
The OEE process has three important points. One is a measure that identifies equipment
potential, another is that it identifies and tracks departmental loss, and the third is that it
identifies opportunities.
The first focus was on what was being scheduled as available hours. This also
independently identified the overtime hours, planned downtime, unplanned downtime, and the
overall downtime. This information was useful at a glance; it meant that management would at a
35
minimum have to review this information for improvements. Company XYZ has planned
downtime defined as scheduled maintenance, repairs, or schedule gaps. Unscheduled downtime
is defined as time when the machine breaks down due to poor maintenance or repairs. Another
area that was identified was downtime due to unscheduled employee absenteeism’s which
created crewing deficiencies.
The second area for the OEE chart entry was the efficiency. This area had some of the
same issues that the rated capacity process had. The company’s machine standards are not
accurate and this creates a huge false understanding. Another issue is that the company needs to
address the manufacturing speeds that should be used in this section. This along with reviewing
machine standards will assist in a true measurement of the company’s capacity. As an example
we found an efficiency spread from 66% to 92%. This questions if Company XYZ truly
understands what their capacity is on a daily basis. It, also identified that Company XYZ had a
shift’s worth of underutilized machines. This is a huge concern for scheduling and overall
capacity constraints.
The last part of the OEE was quality. This was not taken into consideration in the rated
capacity process and as quality is detrimental to all processes, it was refreshing to see it included
as the cost of nonconforming product and rework can be extremely costly to the bottom line.
This provides the company with a review of their hidden waste area. The company has a high
quality standard which helps in the world of competitiveness.

36
Conclusions
The conclusions of this study are that there are several areas that Company XYZ needs to
address before true capacity can be reviewed and determined more accurately. If the company
does not review these areas then continued manufacturing frustration, overtime, and late
customer deliveries will continue at the present sales levels. Also the sales group will continue
to sell beyond the companies present capability as it stands. The company is sacrificing its true
efficiencies and continually creating overtime to adjust for the true standards along with
misunderstood down time. This has a definite affect on the bottom line and is a large area for
easy improvement.
The first area to review is the four manufacturing machine standards as this has an effect
on the production schedule and overhead rates. This will influence the machine run standards as
well as the make-ready standards. The company needs to define and review the actual machine
standards that they are using. They need to define and measure the standards and make them
accurate so that the efficiency gaps are reduced from the present standard to the machine actual
ability. The standards need to match the material sizes and accurate run speeds of the
manufacturing machines. The company also needs to review and examine the make ready times
that are appropriate to the specific jobs. This may be difficult at first since the employees need
to understand that what they were doing can be done more efficiently. It is hard to communicate
improvement needs when the manufacturing processes are above 100% already.
The second area of concern is in the OEE process that there is a large amount of
identified unplanned downtime, specifically in the printing and gluing departments. These two
departments incurred the most annual overtime hours to balance the sales demand. The
37
unplanned downtime seemed to average almost a third of the production’s available time which
is equivalent to a shift. This alone is a huge concern and area for improvement. This also has a
huge affect to machine utilization and overall scheduling. The company needs to identify the
issues and find out what comprises the unplanned downtime in order to address them for what
they are. The company may find that the unplanned downtime is a combination of poor
maintenance and a lack of equipment repair needs along with possible poor scheduling practices.
The maintenance issues are a typical problem and one that OEE can assist in addressing overall
with the introduction of a TPM program.
Additional recommendations would be that the company implements some Lean
processes like such as 6S and value stream mapping. 6S is easy and assists in organizing and
developing processes for the employees to maintain their machine processes on a daily manner.
The 6s program is easy and mainly assists in organizing along with process SOP’s for
consistency from employee to employee. The use of value stream mapping would assist the
company in identifying the value added and non-value added portions within the processes. This
allows the company to eliminate the idle wasted time and identify the eight wastes found in all
processes. Additionally this will assist in streamlining or line balancing the overall
manufacturing plant flow, and with employee involvement, it could assist them in seeing the
value of accurate machine standards as well as finding ways to work smarter not harder.
The company will see improvements in efficiencies and improvements in the production
schedule with accurate setup and run standards. This will also reduce if not eliminate overtime
issues and the applicable cost associated. The company will also be able to identify machine
maintenance needs which will assist in reducing the unplanned downtime along with increase the
overall life of the machines. This will in due course add to the companies bottom line.

38
References
Blackstone, J. (2010). APICS Dictionary (13th ed.) [Adobe Digital Editions version]. Retrieved from
http://www.apics.org/APICS/Bookstore/ProductDetail.aspx?CS_ProductID=6506&CS_Catalog=
APICS+Bookstore
Blackstone, J. (2002). Capacity Management. Mason, OH: South-Western College Publishing
Heizer, J., & Render, B. (2001). Operations Management. Upper Saddle River, NJ: Prentice Hall.
Merriam – (1987). Webster’s Ninth New Collegiate Dictionary. Springfield, MA: Merriam – Webster
INC., Publisher
Matta, A., & Semeraro, Q. (2005). Design of Advanced Manufacturing Systems. Dordrecht, The
Netherlands: Springer.
Stamatis, D.H. (2010). The OEE Primer. New York, NY: Productivity Press.