gdch0004mar global demand, capacity and … demand, capacity and prices for polypropylene - end-use...
TRANSCRIPT
REFERENCE CODE GDCH0004MAR | PUBLICAT ION DATE JUNE 2014
GLOBAL DEMAND, CAPACITY AND PRICES FOR POLYPROPYLENE - END-USE SECTORS IN ASIA-
PACIFIC TO DRIVE GROWTH
Global Demand, Capacity and Prices for Polypropylene - End-Use Sectors in Asia-Pacific to Drive Growth 2 © GlobalData. This report is a licensed product and is not to be copied, reproduced, shared or resold in any form.
GLOBAL DEMAND, CAPACITY AND PRICES FOR POLYPROPYLENE - END-USE SECTORS IN ASIA-PACIFIC TO DRIVE GROWTH
Executive Summary
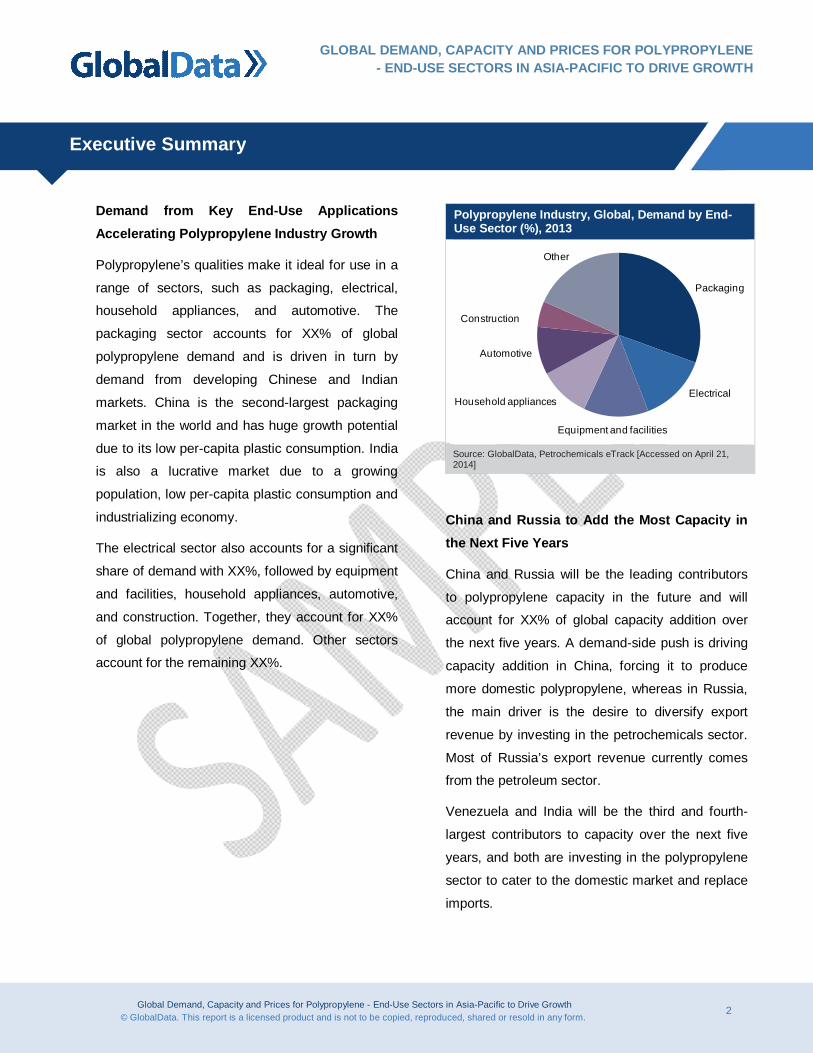
Demand from Key End-Use Applications Accelerating Polypropylene Industry Growth
Polypropylene’s qualities make it ideal for use in a
range of sectors, such as packaging, electrical,
household appliances, and automotive. The
packaging sector accounts for XX% of global
polypropylene demand and is driven in turn by
demand from developing Chinese and Indian
markets. China is the second-largest packaging
market in the world and has huge growth potential
due to its low per-capita plastic consumption. India
is also a lucrative market due to a growing
population, low per-capita plastic consumption and
industrializing economy.
The electrical sector also accounts for a significant
share of demand with XX%, followed by equipment
and facilities, household appliances, automotive,
and construction. Together, they account for XX%
of global polypropylene demand. Other sectors
account for the remaining XX%.
Polypropylene Industry, Global, Demand by End-Use Sector (%), 2013
Packaging
Electrical
Equipment and facilities
Household appliances
Automotive
Construction
Other
Source: GlobalData, Petrochemicals eTrack [Accessed on April 21, 2014]
China and Russia to Add the Most Capacity in the Next Five Years
China and Russia will be the leading contributors
to polypropylene capacity in the future and will
account for XX% of global capacity addition over
the next five years. A demand-side push is driving
capacity addition in China, forcing it to produce
more domestic polypropylene, whereas in Russia,
the main driver is the desire to diversify export
revenue by investing in the petrochemicals sector.
Most of Russia’s export revenue currently comes
from the petroleum sector.
Venezuela and India will be the third and fourth-
largest contributors to capacity over the next five
years, and both are investing in the polypropylene
sector to cater to the domestic market and replace
imports.
Global Demand, Capacity and Prices for Polypropylene - End-Use Sectors in Asia-Pacific to Drive Growth 4 © GlobalData. This report is a licensed product and is not to be copied, reproduced, shared or resold in any form.
Table of Contents
GLOBAL DEMAND, CAPACITY AND PRICES FOR POLYPROPYLENE - END-USE SECTORS IN ASIA-PACIFIC TO DRIVE GROWTH
1 Table of Contents
1 Table of Contents ....................................................................................................................... 4
1.1 List of Tables ...................................................................................................................... 6
1.2 List of Figures ..................................................................................................................... 7
2 Introduction ................................................................................................................................. 8
2.1 Overview ............................................................................................................................. 8
2.2 GlobalData Report Guidance .............................................................................................. 8
3 Global Polypropylene Capacity – Growth in the Packaging Sector to Trigger Expansion .......... 10
3.1 Global Polypropylene Industry, Supply Scenario, 2003–2018 ........................................... 12
3.2 Global Planned Polypropylene Plants – China and Russia to Add the Most Capacity to
2018 .................................................................................................................................. 14
3.3 Global Polypropylene Industry, Company Share, 2013 ..................................................... 18
4 Asia-Pacific to Drive Global Polypropylene Demand ................................................................. 20
4.1 Global Polypropylene Industry, Demand Value, 2003–2018 .............................................. 20
4.2 Global Polypropylene Production, 2003–2018................................................................... 26
4.3 Global Polypropylene Demand by End-Use Sector, 2013 ................................................. 29
4.4 Global Polypropylene Price Forecast, 2003–2018 ............................................................. 30
5 Major Companies Active in the Global Polypropylene Industry ................................................. 32
5.1 LyondellBasell Industries .................................................................................................. 32
5.1.1 Company Overview ....................................................................................................... 32
5.1.2 LyondellBasell, Global Polypropylene Capacity, 2003–2018 ......................................... 33
5.1.3 LyondellBasell, Active Polypropylene Plants, 2013........................................................ 34
5.2 Braskem............................................................................................................................ 36

Global Demand, Capacity and Prices for Polypropylene - End-Use Sectors in Asia-Pacific to Drive Growth 5 © GlobalData. This report is a licensed product and is not to be copied, reproduced, shared or resold in any form.
Table of Contents
GLOBAL DEMAND, CAPACITY AND PRICES FOR POLYPROPYLENE - END-USE SECTORS IN ASIA-PACIFIC TO DRIVE GROWTH
5.2.1 Company Overview ....................................................................................................... 36
5.2.2 Braskem, Global Polypropylene Capacity, 2003–2018 .................................................. 36
5.2.3 Braskem’s Active Polypropylene Plants, 2013 ............................................................... 38
5.3 China Petroleum & Chemical Corporation (Sinopec) ......................................................... 40
5.3.1 Company Overview ....................................................................................................... 40
5.3.2 Sinopec, Total Installed Capacity, 2003–2018 ............................................................... 40
5.3.3 Sinopec, Active Polypropylene Plants, 2013 ................................................................. 42
6 Conclusion ................................................................................................................................ 45
7 Appendix................................................................................................................................... 46
7.1 Definitions ......................................................................................................................... 46
7.1.1 Installed Capacity .......................................................................................................... 46
7.1.2 Process ......................................................................................................................... 46
7.1.3 Technology ................................................................................................................... 46
7.2 Abbreviations .................................................................................................................... 46
7.3 Bibliography ...................................................................................................................... 47
7.4 GlobalData’s Research Methodology ................................................................................ 47
7.4.1 Coverage ...................................................................................................................... 47
7.4.2 Secondary Research ..................................................................................................... 48
7.4.3 Primary Research ......................................................................................................... 48
7.4.4 Expert Panel Validation ................................................................................................. 49
7.5 Disclaimer ......................................................................................................................... 49

Global Demand, Capacity and Prices for Polypropylene - End-Use Sectors in Asia-Pacific to Drive Growth 6 © GlobalData. This report is a licensed product and is not to be copied, reproduced, shared or resold in any form.
Table of Contents
GLOBAL DEMAND, CAPACITY AND PRICES FOR POLYPROPYLENE - END-USE SECTORS IN ASIA-PACIFIC TO DRIVE GROWTH
1.1 List of Tables
Table 1: Polypropylene Industry, Global, Capacity by Region (mmty), 2003–2018 ..................................... 13
Table 2: Polypropylene Industry, Global, Capacity CAGR by Region (%), 2003–2018 ............................... 13
Table 3: Polypropylene Industry, Global, Major Planned Plants, 2014–2018 .............................................. 15
Table 4: Polypropylene Industry, Global, Capacity by Company, 2013 ...................................................... 19
Table 5: Polypropylene Industry, Global, Demand Value by Region (US$ bil), 2003–2018 ......................... 23
Table 6: Polypropylene Industry, Global, Demand Value CAGR by Region (%), 2003–2018 ...................... 23
Table 7: Polypropylene Industry, Global, Demand Volume by Region (mmty), 2003–2018......................... 25
Table 8: Polypropylene Industry, Global, Demand Volume CAGR by Region (%), 2003–2018 ................... 25
Table 9: Polypropylene Industry, Global, Production Volume by Region (mmty), 2003–2018 ..................... 28
Table 10: Polypropylene Industry, Global, Production Volume CAGR by Region (%), 2003–2018 ............... 28
Table 11: Polypropylene Industry, Global, Demand by End-Use Sector (%), 2013 ....................................... 29
Table 12: Polypropylene Industry, Global, Average Price by Region (US$/ton), 2003–2018......................... 31
Table 13: LyondellBasell, Key Facts, 2013 .................................................................................................. 32
Table 14: LyondellBasell, Installed Polypropylene Capacity (mmty), 2003–2018.......................................... 34
Table 15: LyondellBasell, Active and Planned Polypropylene Plants, 2013 .................................................. 35
Table 16: Braskem, Installed Polypropylene Capacity (mmty), 2003–2018 .................................................. 38
Table 17: Braskem, Active and Planned Polypropylene Plants, 2013........................................................... 39
Table 18: Sinopec, Installed Polypropylene Capacity (mmty), 2003–2018 ................................................... 42
Table 19: Sinopec, Active and Planned Polypropylene Plants, 2013 ............................................................ 43

Global Demand, Capacity and Prices for Polypropylene - End-Use Sectors in Asia-Pacific to Drive Growth 7 © GlobalData. This report is a licensed product and is not to be copied, reproduced, shared or resold in any form.
Table of Contents
GLOBAL DEMAND, CAPACITY AND PRICES FOR POLYPROPYLENE - END-USE SECTORS IN ASIA-PACIFIC TO DRIVE GROWTH
1.2 List of Figures
Figure 1: Polypropylene Industry, Global, Capacity by Region (mmty), 2003–2018 ..................................... 12
Figure 2: Polypropylene Industry, Global, Capacity by Company, 2013 ...................................................... 18
Figure 3: Polypropylene Industry, Global, Demand Value by Region (US$ bil), 2003–2018 ......................... 22
Figure 4: Polypropylene Industry, Global, Demand Volume by Region (mmty), 2003–2018......................... 24
Figure 5: Polypropylene Industry, Global, Production Volume by Region (mmty), 2003–2018 ..................... 27
Figure 6: Polypropylene Industry, Global, Demand by End-Use Sector (%) 2013 ........................................ 29
Figure 7: Polypropylene Industry, Global, Average Price by Region (US$/ton), 2003–2018......................... 30
Figure 8: LyondellBasell, Installed Polypropylene Capacity (mmty), 2003–2018.......................................... 33
Figure 9: Braskem, Installed Polypropylene Capacity (mmty), 2003–2018 .................................................. 37
Figure 10: Sinopec, Installed Polypropylene Capacity (mmty), 2003–2018 ................................................... 41
Global Demand, Capacity and Prices for Polypropylene - End-Use Sectors in Asia-Pacific to Drive Growth 8 © GlobalData. This report is a licensed product and is not to be copied, reproduced, shared or resold in any form.
GLOBAL DEMAND, CAPACITY AND PRICES FOR POLYPROPYLENE - END-USE SECTORS IN ASIA-PACIFIC TO DRIVE GROWTH
Introduction
2 Introduction
2.1 Overview
GlobalData’s report: “Global Demand, Capacity, and Prices for Polypropylene – End-Use Sectors
in Asia-Pacific to Drive Growth” provides in-depth coverage of the global polypropylene industry,
looking at historic and forecast global and regional polypropylene demand and capacity, end-use
market shares and pricing trends. It also covers the companies that dominate this market,
specifically the three largest producers in the world. They are LyondellBasell Industries N.V.
(LyondellBasell), Braskem S.A. (Braskem) and China Petroleum & Chemical Corporation
(Sinopec).
Polypropylene capacity coverage takes a “bottoms-up approach” based on the sum of all global
polypropylene plant capacities. Polypropylene market coverage, consisting of demand value,
demand volume and production volume, is based on data from XX major countries, which account
for more than XX% of global polypropylene demand. These countries are China, India, Japan,
Malaysia, South Korea, Singapore, Taiwan, Thailand, Belgium, France, Germany, Italy, Poland,
Russia, Spain, the UK, Saudi Arabia, Iran, Canada, Mexico, the US, Argentina and Brazil.
The company profile section provides a business overview of the three largest polypropylene
companies based on installed polypropylene capacity. The section covers historic and forecast
polypropylene capacity and provides information about petrochemical plants, equity partnership
details and production capacity.
2.2 GlobalData Report Guidance
The report begins with the executive summary
Chapter three highlights the main features of the global polypropylene industry, providing
historical and forecast capacity by region, details of planned facilities and major company
capacity shares.
Chapter four provides historical and forecast supply and demand scenarios. It covers the size
of the polypropylene market, demand and production volume, and price trends by geographical
region from 2003 to 2018. Additionally, it provides demand by major end-use sectors in 2013.
Global Demand, Capacity and Prices for Polypropylene - End-Use Sectors in Asia-Pacific to Drive Growth 9 © GlobalData. This report is a licensed product and is not to be copied, reproduced, shared or resold in any form.
GLOBAL DEMAND, CAPACITY AND PRICES FOR POLYPROPYLENE - END-USE SECTORS IN ASIA-PACIFIC TO DRIVE GROWTH
Introduction
Chapter five profiles the major companies active in the global polypropylene industry, namely
LyondellBasell, Braskem and Sinopec.
Chapter six concludes the report with an industry overview.
Global Demand, Capacity and Prices for Polypropylene - End-Use Sectors in Asia-Pacific to Drive Growth 12 © GlobalData. This report is a licensed product and is not to be copied, reproduced, shared or resold in any form.
Growth in the Packaging Sector to Trigger Expansion
GLOBAL DEMAND, CAPACITY AND PRICES FOR POLYPROPYLENE - END-USE SECTORS IN ASIA-PACIFIC TO DRIVE GROWTH
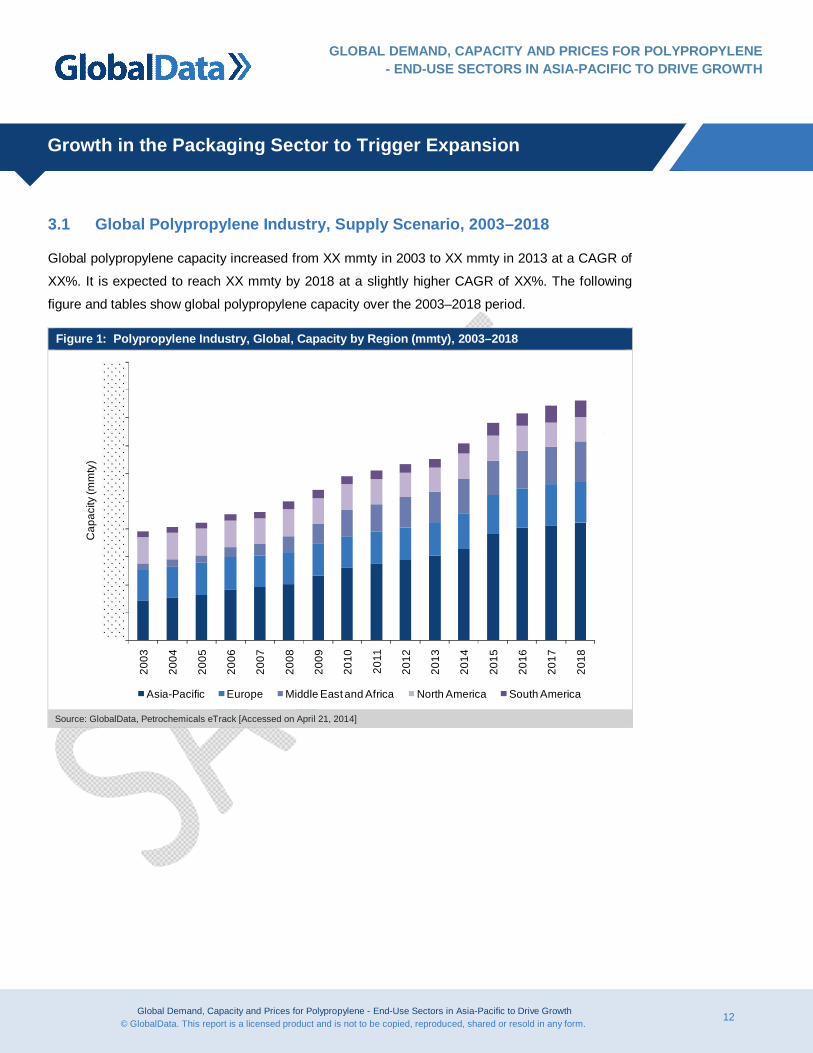
3.1 Global Polypropylene Industry, Supply Scenario, 2003–2018
Global polypropylene capacity increased from XX mmty in 2003 to XX mmty in 2013 at a CAGR of
XX%. It is expected to reach XX mmty by 2018 at a slightly higher CAGR of XX%. The following
figure and tables show global polypropylene capacity over the 2003–2018 period.
Figure 1: Polypropylene Industry, Global, Capacity by Region (mmty), 2003–2018
2003
2004
2005
2006
2007
2008
2009
2010
2011
2012
2013
2014
2015
2016
2017
2018
Cap
acity
(mm
ty)
Asia-Pacific Europe Middle East and Africa North America South America
Source: GlobalData, Petrochemicals eTrack [Accessed on April 21, 2014]
Global Demand, Capacity and Prices for Polypropylene - End-Use Sectors in Asia-Pacific to Drive Growth 13 © GlobalData. This report is a licensed product and is not to be copied, reproduced, shared or resold in any form.
Growth in the Packaging Sector to Trigger Expansion
GLOBAL DEMAND, CAPACITY AND PRICES FOR POLYPROPYLENE - END-USE SECTORS IN ASIA-PACIFIC TO DRIVE GROWTH
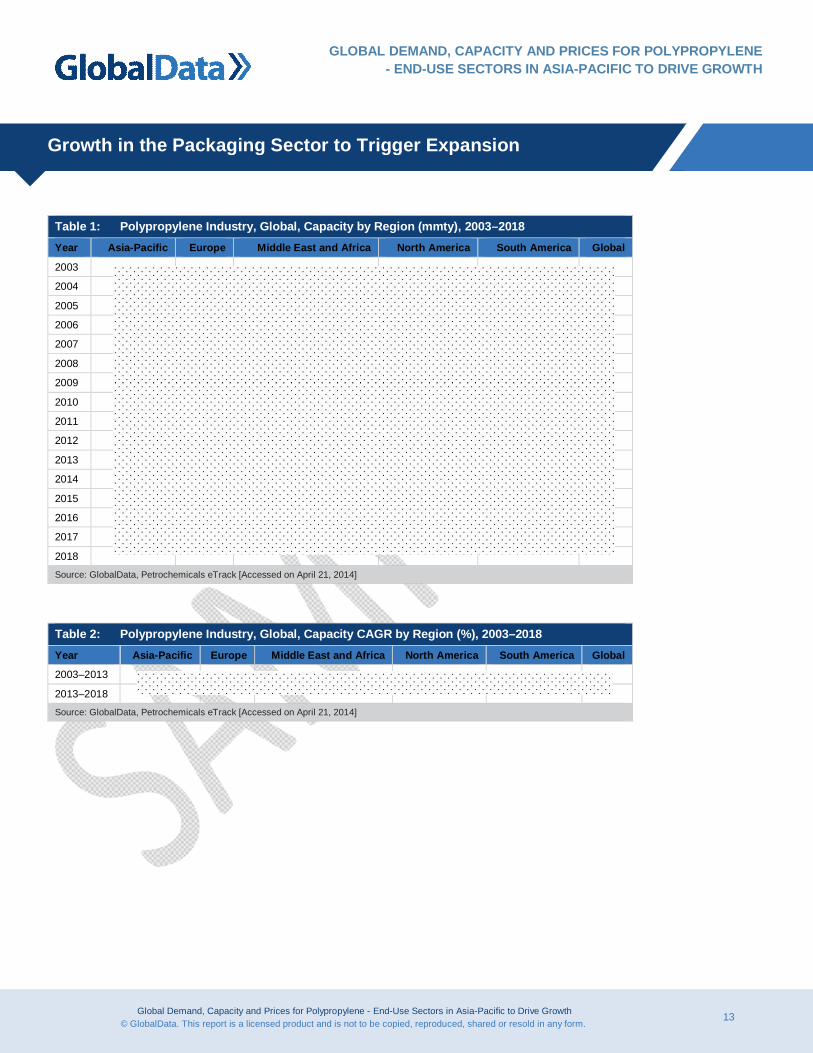
Table 1: Polypropylene Industry, Global, Capacity by Region (mmty), 2003–2018 Year Asia-Pacific Europe Middle East and Africa North America South America Global
2003
2004
2005
2006
2007
2008
2009
2010
2011
2012
2013
2014
2015
2016
2017
2018
Source: GlobalData, Petrochemicals eTrack [Accessed on April 21, 2014]
Table 2: Polypropylene Industry, Global, Capacity CAGR by Region (%), 2003–2018 Year Asia-Pacific Europe Middle East and Africa North America South America Global
2003–2013
2013–2018
Source: GlobalData, Petrochemicals eTrack [Accessed on April 21, 2014]

Global Demand, Capacity and Prices for Polypropylene - End-Use Sectors in Asia-Pacific to Drive Growth 37 © GlobalData. This report is a licensed product and is not to be copied, reproduced, shared or resold in any form.
Major Companies Active in the Global Polypropylene Industry
GLOBAL DEMAND, CAPACITY AND PRICES FOR POLYPROPYLENE - END-USE SECTORS IN ASIA-PACIFIC TO DRIVE GROWTH
5.2.2 Braskem, Global Polypropylene Capacity, 2003–2018
Braskem’s polypropylene capacity increased from XX mmty in 2003 to XX mmty in 2013 at a
CAGR of XX%. The company has a planned plant in a joint venture with Pequiven in Paraguaná,
Venezuela, which will increase its total capacity to XX mmty by 2017.
Figure 9: Braskem, Installed Polypropylene Capacity (mmty), 2003–2018
2003
2004
2005
2006
2007
2008
2009
2010
2011
2012
2013
2014
2015
2016
2017
2018
Inst
alle
d po
lypr
opyl
ene c
apac
ity (m
mty
)
Source: GlobalData, Petrochemicals eTrack [accessed April 21, 2014]

Global Demand, Capacity and Prices for Polypropylene - End-Use Sectors in Asia-Pacific to Drive Growth 38 © GlobalData. This report is a licensed product and is not to be copied, reproduced, shared or resold in any form.
Major Companies Active in the Global Polypropylene Industry
GLOBAL DEMAND, CAPACITY AND PRICES FOR POLYPROPYLENE - END-USE SECTORS IN ASIA-PACIFIC TO DRIVE GROWTH
Table 16: Braskem, Installed Polypropylene Capacity (mmty), 2003–2018
Year Installed polypropylene capacity
2003
2004
2005
2006
2007
2008
2009
2010
2011
2012
2013
2014
2015
2016
2017
2018
Source: GlobalData, Petrochemicals eTrack [accessed April 21, 2014]
Global Demand, Capacity and Prices for Polypropylene - End-Use Sectors in Asia-Pacific to Drive Growth 46 © GlobalData. This report is a licensed product and is not to be copied, reproduced, shared or resold in any form.
Appendix
GLOBAL DEMAND, CAPACITY AND PRICES FOR POLYPROPYLENE - END-USE SECTORS IN ASIA-PACIFIC TO DRIVE GROWTH
7 Appendix
7.1 Definitions
7.1.1 Installed Capacity
Installed capacity refers to the maximum rated output of a plant under specific conditions
designated by the manufacturer. It is usually indicated in units of tons on a nameplate affixed to the
plant.
7.1.2 Process
A process is a combination of unit operations used to change chemical composition of raw material
to manufacture petrochemicals.
7.1.3 Technology
Technology is a technical process used in the petrochemical industry that has been developed by a
specific business entity.
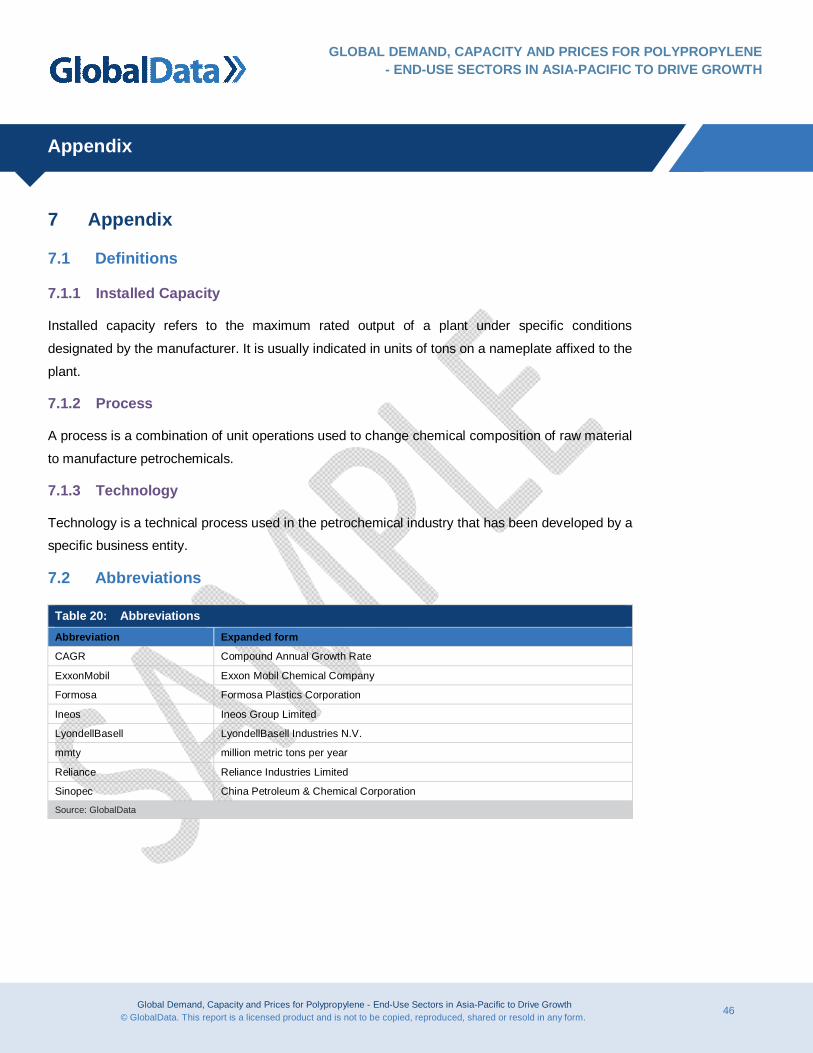
7.2 Abbreviations
Table 20: Abbreviations Abbreviation Expanded form
CAGR Compound Annual Growth Rate
ExxonMobil Exxon Mobil Chemical Company
Formosa Formosa Plastics Corporation
Ineos Ineos Group Limited
LyondellBasell LyondellBasell Industries N.V.
mmty million metric tons per year
Reliance Reliance Industries Limited
Sinopec China Petroleum & Chemical Corporation
Source: GlobalData
Global Demand, Capacity and Prices for Polypropylene - End-Use Sectors in Asia-Pacific to Drive Growth 47 © GlobalData. This report is a licensed product and is not to be copied, reproduced, shared or resold in any form.
Appendix
GLOBAL DEMAND, CAPACITY AND PRICES FOR POLYPROPYLENE - END-USE SECTORS IN ASIA-PACIFIC TO DRIVE GROWTH
7.3 Bibliography
ANZ Bank, (2014). Plastic Industry overview. Available at:
http://www.anzbusiness.com/industries/plastics.html. [Accessed April 21, 2014].
PlastIndia Foundation (2013). Plastics consumption to treble in 10 years. Available at:
http://www.business-standard.com/article/companies/plastics-consumption-to-treble-in-10-
years-111032300076_1.html. [Accessed April 21, 2014].
7.4 GlobalData’s Research Methodology
GlobalData’s dedicated research and analysis teams consist of experienced professionals with
advanced statistical expertise and marketing, market research and consulting backgrounds in the
petrochemical industry.
GlobalData adheres to the Codes of Practice of the Market Research Society (www.mrs.org.uk)
and Strategic and Competitive Intelligence Professionals (www.scip.org) .
All GlobalData databases are continuously updated and revised. The following research
methodology is followed for all databases and reports.
7.4.1 Coverage
The objective of updating GlobalData’s coverage is to ensure that it represents the most up-to-date
vision of the industry possible.
Changes to the industry taxonomy are built on the basis of extensive research of company,
association and competitor sources.
Company coverage is based on three key factors: market capitalization; revenues; and media
attention and innovation and market potential.
An exhaustive search of 56 member exchanges is conducted and companies are prioritized on
the basis of their market capitalization.
The estimated revenues of all major companies, including private and governmental, are
gathered and used to prioritize coverage.
Companies that are making news, or which are of particular interest due to their innovative
approach are prioritized.
Global Demand, Capacity and Prices for Polypropylene - End-Use Sectors in Asia-Pacific to Drive Growth 48 © GlobalData. This report is a licensed product and is not to be copied, reproduced, shared or resold in any form.
Appendix
GLOBAL DEMAND, CAPACITY AND PRICES FOR POLYPROPYLENE - END-USE SECTORS IN ASIA-PACIFIC TO DRIVE GROWTH
GlobalData aims to cover all major news events and deals in the petrochemical industry, updated
on a daily basis.
The coverage is further streamlined and strengthened with additional inputs from GlobalData’s
expert panel (see below).
7.4.2 Secondary Research
The research process begins with extensive secondary research on internal and external sources
to gather qualitative and quantitative information relating to each market.
Secondary research sources that are typically referred to include, but are not limited to:
Company websites, annual reports, financial reports, broker reports, investor presentations and
SEC filings
Industry trade journals and other literature
Internal and external proprietary databases
National government documents, statistical databases and market reports
News articles, press releases and webcasts specific to the companies operating in the market
7.4.3 Primary Research
GlobalData conducts hundreds of primary interviews a year with industry participants and
commentators in order to validate its data and analysis. A typical research interview fulfills the
following functions:
Provides first-hand information on the market size, market trends, growth trends, competitive
landscape, and future outlook
Helps to validate and strengthen the secondary research findings
Further develops the analysis team’s expertise and market understanding
Primary research involves e-mail correspondence and telephone interviews as well as face-to-face
interviews for each market, category, segment and sub-segment across geographies.
Global Demand, Capacity and Prices for Polypropylene - End-Use Sectors in Asia-Pacific to Drive Growth 49 © GlobalData. This report is a licensed product and is not to be copied, reproduced, shared or resold in any form.
Appendix
GLOBAL DEMAND, CAPACITY AND PRICES FOR POLYPROPYLENE - END-USE SECTORS IN ASIA-PACIFIC TO DRIVE GROWTH
The participants who typically take part in such a process include, but are not limited to:
Industry participants: CEOs, VPs, business development managers, market intelligence
managers and national sales managers
Outside experts: investment bankers, valuation experts, research analysts and key opinion
leaders specializing in the petrochemical industry
7.4.4 Expert Panel Validation
GlobalData uses a panel of experts to cross-verify research and forecast methodologies, and drive
its analytical content.
GlobalData’s expert panel comprises marketing managers, product specialists, international sales
managers from petrochemical companies; academics from research universities and consultants
from professional services companies.
7.5 Disclaimer
All Rights Reserved.
No part of this publication may be reproduced, stored in a retrieval system or transmitted in any
form by any means, electronic, mechanical, photocopying, recording or otherwise without the prior
permission of the publisher, GlobalData.