capacity value of wind assumptions and planning reserve margin wind capacity value... · capacity...
TRANSCRIPT

Capacity Value of Wind Assumptions and Planning Reserve Margin
APRIL 23, 2014

Effective Load Carrying Capacity (ELCC), or capacity value, of variable generation and required planning reserve margin are two important input assumptions for the 2014 Integrated Resource Plan (IRP). NS Power has re-examined these input assumptions with the present and future system configurations. Loss of Load Expectation (LOLE) methodology is an accepted method for the calculation of required planning reserve margin and, in some jurisdictions, ELCC of variable generation. NSPI conducted an LOLE study to confirm the variable energy generation ELCC results in the recent GE Energy integration study. A cumulative frequency analysis is another accepted method for capacity valuation and this analysis was also conducted using actual historical NSPI data to compare with the results of the LOLE study. NS Power will test resource plans using wind with capacity values of 12% (from the cumulative distribution analysis) and 27% (from the GE Energy integration study).
2
Executive Summary

• The required planning reserve margin was confirmed to be 20 percent. • GE Energy LOLE study concluded that the ELCC of present and committed wind generation on
NSPI system could be as high as 27 percent. ELCC estimates in other jurisdictions have typically been between 5 and 20 percent.
• NSPI’s LOLE study has largely matched the GE Energy study’s calculations.
3
LOLE Study Results
• However, the LOLE methodology may not be a suitable method to calculate wind generation capacity value on NSPI’s system. This is due to the averaging nature of the LOLE methodology and the observed bimodal distribution of wind generation output during peak demand on NSPI’s system.
• This figure shows how wind generation falls short during many of the highest system demand hours. Over valuation of wind generation capacity effectively diminishes the planning reserve leaving the system challenged to reliably serve firm peak under high demand conditions.

A cumulative distribution analysis of actual NSPI wind generation data, consistent with the methodology used in other jurisdictions, i.e. CAISO, BPA, & SPP, shows a significantly lower capacity value for wind generation. The empirical analysis expresses numerically the actual historical wind generation behaviour described on the previous page. Accepting a confidence level of 85%, this study indicates that a capacity value of wind should not exceed 12% for planning purposes. 4
Cumulative Distribution Analysis Study Results
Confidence level
ELCC of Wind Generation
95% 4%
90% 8%
85% 12%
80% 16%

5
Effective Load Carrying Capacity of Variable Generation
(LOLE Method)
6
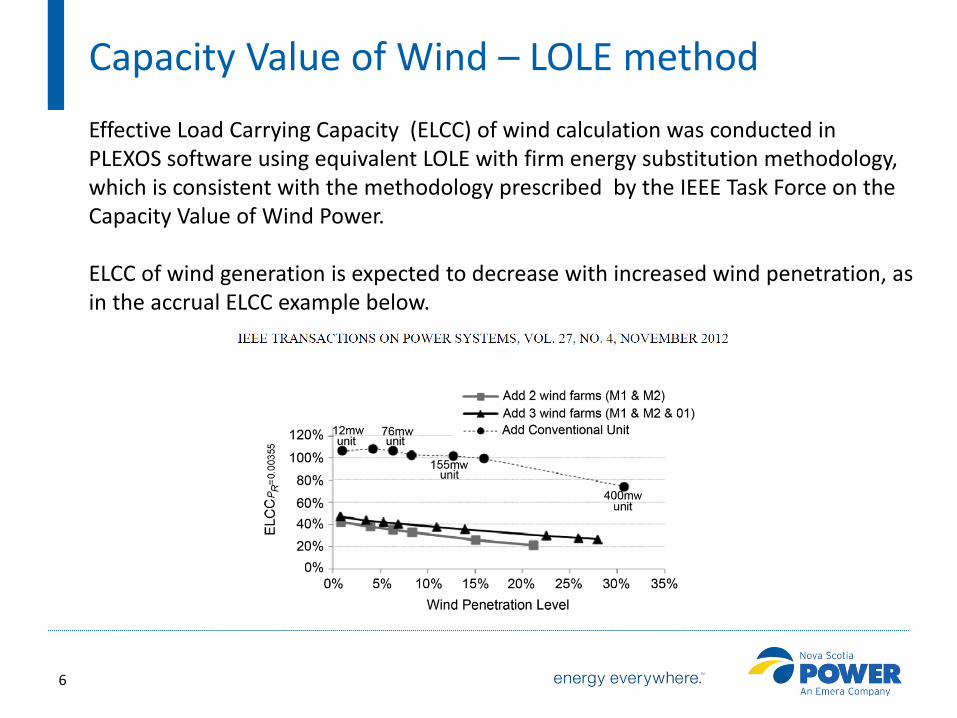
Capacity Value of Wind – LOLE method Effective Load Carrying Capacity (ELCC) of wind calculation was conducted in PLEXOS software using equivalent LOLE with firm energy substitution methodology, which is consistent with the methodology prescribed by the IEEE Task Force on the Capacity Value of Wind Power. ELCC of wind generation is expected to decrease with increased wind penetration, as in the accrual ELCC example below.

7
GE Energy LOLE study GE Energy found that the capacity value of 336 MW of wind generation was 31% or 103 MW, while the capacity value of an incremental 335MW, on top of installed and contracted ~540 MW of wind was 12%, or 40 MW. Reference: Pages 261-272 of Nova Scotia Renewable Energy Integration Study. GE reports capacity value of 540 MW of wind to be 27%, or 146 MW, on pg. 266 of the study, fig. 220, which is slightly higher but consistent with NSPI LOLE study findings. On the same page GE Energy states: “This is an indication that wind regime in Nova Scotia is well suited to the provincial power needs. Values in the range of 5-20% are more common in the northeast US. “ It is expected that the discrepancy between the two analyses is the result of the observed bi-modal behaviour of the Nova Scotia wind regime as it relates to power system peak and averaging nature of the LOLE methodology.

8
GE Energy LOLE study - Excerpts
The figures below are excerpts from GE Energy’s calculation of ELCC of wind generation. The GE Energy ELCC calculation has a notable excursion from the expected curve slope at about 550 MW of wind which is explained by increasing diversity. GE Energy Renewable Energy Integration Study, Page 266.

9
Capacity Value of Wind – ELCC
Wind penetration level
GE Energy calculated ELCC (Incremental)
NSPI calculated ELCC (Incremental)
GE Energy calculated ELCC (cumulative)
NSPI calculated ELCC (cumulative)
336 MW 31% 30.5% 31.0% 30.5%
372 MW 27% 21.2% 30.6% 29.6%
425 MW 15% 19.5% 27.6% 28.2%
~545 MW 25% 19.9% 27.1% 26%
Need to estimate incremental and cumulative effects for wind penetration between ~545 - ~900 MW
~900 MW 12% 8.5% 21.0% 19%
Cumulative values of GE Energy incremental ELCC values were calculated using a weighted average with respect to penetration levels.

10
Capacity Value of Wind – ELCC
GE Energy ELCC vs. Wind Penetration curve is similar to the one derived by NSPI using similar LOLE methodology. NOTE: The incremental values plot is equivalent to the plot in GE Energy study Figure 220.
Graphical representation of cumulative and incremental ELCC values for wind generation as calculated by GE Energy and NSPI.

11
The graph below shows the 30 highest load hours over the past 4 years and the coincident available wind capacity during those hours. In this plot it can be seen that while wind generation may be present at near nameplate capacity during some high load hours, it may not be there at all in other high load hours. While the hourly capacities shown here may average to a large figure, that ELCC would not adequately represent the true system operating requirements. In fact, in 1/3 of the peak load hours shown here wind generation is at 10% or less. apacity factor or This bi-modal wind generation behavior makes the inherent averaging LOLE method of calculating capacity value of wind, with matched load –wind shapes, rather optimistic. The risk of overstating capacity value of wind is designing a system with inadequate firm capacity to serve load in all peak hours.
Challenges applying LOLE methodology to NSPI’s system

12
LOLE is inherently an averaging quantity: LOLE = Average (LOLP)/100*8784/24 Where LOLP = Loss of Load Probability As such LOLE quantity does not adequately preserve the high LOLP values impact on the system. The plot below is an example of the LOLP distribution throughout a year and it illustrates why averaging of LOLP quantities into an annual LOLE quantity may not be the best method for calculating NSPI's capacity value of wind.
Challenges applying LOLE methodology to NSPI’s system

13
Effective Load Carrying Capacity of Variable Generation
Cumulative Frequency Analysis

Capacity Value of Wind – Empirical Analysis
14
Objective: To determine what minimum capacity factor of wind we can predict to be available to the NS Power system, in peak hours, with x% certainty Methodology: Cumulative Frequency Analysis is the
technique of analyzing a set of historical data points to see how often a particular value is exceeded • Other systems including CAISO, BPA, & SPP use variations on this
approach

Cumulative Frequency Analysis - Procedure
15
1. Collect as much logged data on wind generation as possible
– Using data in terms of hourly Capacity Factor allows us to consider a longer history, over which installed wind capacity has grown
2. Assign that data into bin(s) we are interested in – Single bin containing the top 10% of load hours
3. Fit a probability distribution to the data 4. Calculate the inverse cumulative probability for the
confidence level x; this is the value we have (1-x)% chance of being less than according to the fitted distribution (and therefore x% chance of exceeding)

Cumulative Frequency Analysis - Data Sources
16
Integrated hourly generation (MWh) for the following wind farms (299.6 MW): • Covers 94.6% of installed capacity at end of 2013
Study period was 4 full years 2010-2013 Data was cleaned to remove commissioning periods Any hourly value reported above max station capacity was
reduced to that of max capacity
– Pubnico – Gulliver (Digby) – Nuttby – Dalhousie – Maryvale
– Glen Dhu – Bearhead – Lingan – Amherst
Cumulative Frequency Analysis – Key Assumptions
17
Data within each bin are from a single population • No significant differences caused by increased diversity in later years of
study period as additional wind farms come online
Historical performance is representative of our future expectations for wind generation

Cumulative Frequency Analysis - Results
18
Within the top 10% of load hours, 2010-2013:
Confidence level
ELCC of Wind Generation
95% 4%
90% 8%
85% 12%
80% 16%

19
Required Planning Reserve Margin

20
Methodology: 1. Wind energy is substituted with firm equivalent generation
2. If LOLE is < 0.1 days per year, firm system demand will be added until LOLE is = 0.1; Total installed capacity minus added load is the required capacity for LOLE of 0.1 3. If LOLE is >0.1 days per year, firm capacity will be added until LOLE = 0.1; Total installed capacity plus added firm capacity is the required capacity for LOLE of 0.1 Planning Reserve Margin = (Required Generation Capacity – Peak Load) / Peak Load NOTE: If actual wind generation, rather than firm equivalent, was included in the calculation of the planning reserve margin, a decision would have to be made on the capacity value of wind, in order to calculate the required planning reserve for 0.1 LOLE. As such, the calculation provides the firm planning reserve margin requirement, part of which can be served by wind generation, depending on the calculated capacity value of wind.
Required Planning Reserve

21
Required Planning Reserve Planning reserve requirement calculation is based on the NPCC accepted criterion of loss of firm load no more that 1 day in ten years or 0.1 days per year. This means that the system planning reserve is such that it allows the system to fail to meet peak system demand on the average for 2.4 hours every year, on average. Methodology: Adjust capacity on the system to produce LOLE of 0.1 days per year.
MW 2016 2020 2025 Firm Peak Load Forecast [MW] 2011.2 1991.2 1966.9
Required capacity for 0.1 days LOLE [MW]
2390 2372
2362
Total Planning Reserve Requirement
(2390-2011.2)/2011.2 =378.8/2011.2 =18.8%
(2372-1991.2)/1991.2 =380.8/1991.2 =19.1%
(2362-1966.9)/1966.9 =395.1/1966.9 =20.1%
2016 – no Maritime Link (ML) – no thermal retirements 2020 – with ML both base & supplemental blocks – One Lingan unit retired 2025 – with ML base and no supplemental block – no additional steam retirements

22
Study Discussion, Conclusions and Recommendations

Planning Reserve Margin Risks with Wind Capacity Factor
23
The cost of under- or over-estimating the capacity value of wind is asymmetrical. Over-estimating the capacity value of wind and then operating the system accordingly could result in inadequate resources to meet peak system demand. That situation has much more severe consequences than under-estimating wind resources capacity and having more than adequate resources to meet peak demands, particularly as NSPI is a winter peaking utility. There are uncertainties associated with load growth. For example, we have seen the highest system peak firm load in history in January 2014, which adds to the importance of carrying adequate planning reserve margin . The planning reserve margin can be compromised by assigning a high capacity value to wind generation in the planning process. For example, a 27% capacity value for committed wind generation of 550-600 MW means that ~150-160 MW, or 40% of the required planning reserve, may or may not be available depending on the wind generation output. Furthermore, there is uncertainty associated with the integration of ~550-600 MW of committed wind capacity on the system from 2016 onward.

Study Conclusion and Recommendation
24
The required planning reserve margin was confirmed to be 20%, consistent with the assumption used in previous long term studies. Due to the nature of wind generation in Nova Scotia, the LOLE averaging methodology may overstate ELCC of wind generation, if a careful examination of risk is not allowed for. Cumulative frequency analysis of existing wind generation data shows the capacity value of wind generation within specified risk levels and can be used as a qualifier of the LOLE results. In order to be able to design the system with adequate resources to maintain system reliability, the study indicates an appropriate capacity value for wind resources is 12%, taking into account the empirical data analysis results and a reasonable level of risk. Even though the LOLE methodology had to be qualified by the empirical analysis in order to determine the absolute ELCC of wind generation, the relative slope of the ELCC vs. Wind Penetration curve can be used to calculate the ELCC of future wind generation additions.

IRP Wind Capacity Value Assumptions
25
For this long term-planning exercise, two different wind capacity value constructs will be used to test Candidate Resource Plans: • Existing and incremental values per the GE Study (page
266), 27% cumulative capacity value up to ~545 MW, and lower incremental values beyond 545 MW;
• 12% capacity value as determined by the cumulative frequency analysis study.

26
Appendix 1
Study Assumptions

•REQUIRED SYSTEM ASSUMPTIONS FOR THE LOLE STUDY
•- WIND FORECAST / HOURLY WIND SHAPE •- LOAD FORECAST / HOURLY LOAD SHAPE •- UNAVAILABILITY OF VARIABLE GENERATION •- DAFOR (DERATION ADJUSTED FORCED OUTAGE RATE) FORECAST •- CAPACITY ADDITIONS/ RETIREMENTS •- MARITIME LINK AND NB IMPORTS CAPABILITY •- FLEET MAINTENANCE SCHEDULE
27
System Assumptions

28
System Assumptions – WIND
Wind shape: Use AWS Truepower wind shape, based on 2006 wind speed measurements as provided by GE Energy. Wind Forecast: IRP wind forecast including COMFIT. Unavailability of Variable Generation: Unavailability due to transmission congestion, icing, forced outages, wind over speed, etc… will be represented by a 5% forced outage rate applied to all variable generators. This value is consistent with literature and with common practice among other jurisdictions.

29
System Assumptions – SYSTEM DEMAND
System demand without PHP will be used in this study. In order to calculate capacity value of wind and required planning reserve margin, it is irrelevant whether PHP demand is on the system or not. PHP demand is only relevant when calculating absolute system LOLE. The LOLE study was conducted with 2006 load shape in order to match load to the AWST wind shape which is based on 2006 measurements.

30
System Assumptions – CAPACITY
Capacity Additions and Retirements:
Maintenance
Generating fleet maintenance schedule will be the same maintenance schedule used in the IRP simulations.
Use DAFOR based on historical plant performance values for thermal plants. Use 5% DAFOR for wind and hydro generation. Methodology: Plexos uses convolution method, as opposed to Monte Carlo Stochastic method, to calculate ELCC of generating units as a part of the LOLP/LOLE indices computation.
Deration Adjusted Forced Outage Rate
31
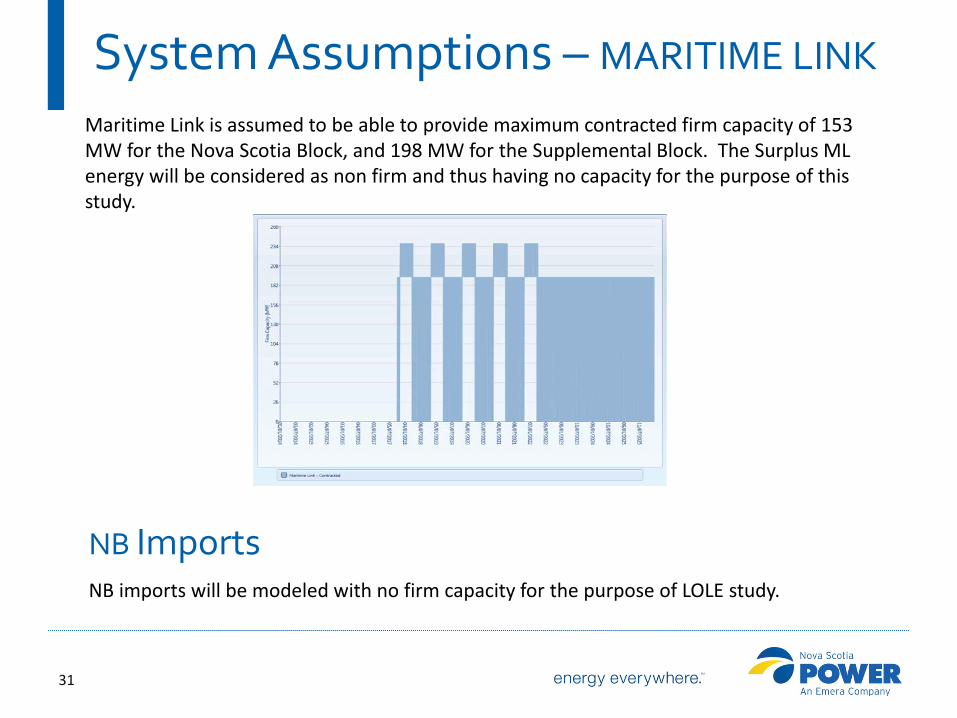
Maritime Link is assumed to be able to provide maximum contracted firm capacity of 153 MW for the Nova Scotia Block, and 198 MW for the Supplemental Block. The Surplus ML energy will be considered as non firm and thus having no capacity for the purpose of this study.
System Assumptions – MARITIME LINK
NB imports will be modeled with no firm capacity for the purpose of LOLE study.
NB Imports

32
Appendix 2
Examples of ELCC Calculation Methodologies and Results in Other Jurisdictions

33
ELCC Calculation Methods Used in Different Jurisdictions
Jurisdiction Methodology Category
Calculation Details Values
SPP Peak Period - Percentile Monthly Capacity Value: 85th Percentile of Wind Generation on Top 10% of Load Hours (up to 10 Years of Data)
CAISO Peak Period - Percentile Monthly Capacity Values: 3-Year Average of Wind Output Equal or
Exceeding the 70th percentile, 1pm - 6pm: Apr– Oct / 4pm - 9pm: Jan - Mar and Nov – Dec.
Bonneville Power Administration Peak Period – Percentile Monthly capacity factor during summers 2003 to 2008, only
considering 85th and 95th percentile values. 0%
ISO-NE Peak Period - Median Summer: 5-Year Average of Median Wind Output, 2pm - 6pm, Jun - Sep Winter: 5-Year Average of Median Wind Output, 5pm - 7pm, Oct – May
Summer Peaking Winter period values high twenties (%).
Ontario IESO Peak Period - Median
Probability Distribution of Median Wind Output for Modeled (10 Years) and Actual (7 Years) Wind Output Data [Smallest of the 2 Data Points
Used each Time]. One Distribution for Summer, One for Winter, Monthly for Shoulder Months. Wind Output for Top 5 Contiguous Daily
Peak Demand Hours.
On Summer Peak: 13.6% Winter period (Dec-Feb) values: ~33.4%
NYISO Peak Period - Average Summer: Previous Year's Wind Capacity Factor, 2pm - 6pm, Jun - Aug Winter: Previous Year's Wind Capacity Factor, 4pm - 8pm, Dec – Feb
Default Summer: 10%(onshore), 38%(offshore) Default Winter: 30%(onshore), 38%(offshore)
PJM Peak Period - Average 3-Year Average Wind Capacity Factor, 2pm - 6pm, Jun – Aug Default: 13% (summer)
BC Hydro ELCC Based on synthesized hourly wind data. 24% (onshore & offshore wind)
ERCOT ELCC Based on random wind data, not synchronized with load. 8.7% (summer)
Midwest ISO ELCC Average ELCC over 7 previous years considered. 14.1% (2014 planning yr), 13.3% (2013 planning yr), 14.7% (2012 planning yr), 12.9% (2011 planning yr)
Quebec Balancing Authority ELCC
Wind power time series obtained from meteorological data supplemented by analysis of extreme cold weather events. Winter: 30%
Sources: NERC. Methods to Model and Calculate Capacity Contributions of Variable Generation for Resource Adequacy Planning, March 2011. http://www.nerc.com/files/ivgtf1-2.pdf NREL. Summary of Time Period-Based and Other Approximation Methods for Determining the Capacity Value of Wind and Solar in the United States September 2010–February 2012. NREL/SR-5500-54338, March 2012. http://www.nrel.gov/docs/fy12osti/54338.pdf