cape coast municipality - statistical service · iii preface and acknowledgement no meaningful...
TRANSCRIPT
CAPE COAST MUNICIPALITY

ii
Copyright ©2013 Ghana Statistical Service
iii
PREFACE AND ACKNOWLEDGEMENT
No meaningful developmental activity can be undertaken without taking into account the
characteristics of the population for whom the activity is targeted. The size of the population
and its spatial distribution, growth and change over time, in addition to its socio-economic
characteristics are all important in development planning.
A population census is the most important source of data on the size, composition, growth
and distribution of a country’s population at the national and sub-national levels. Data from
the 2010 Population and Housing Census (PHC) will serve as reference for equitable
distribution of national resources and government services, including the allocation of
government funds among various regions, districts and other sub-national populations to
education, health and other social services.
The Ghana Statistical Service (GSS) is delighted to provide data users, especially the
Metropolitan, Municipal and District Assemblies, with district-level analytical reports based
on the 2010 PHC data to facilitate their planning and decision-making.
The District Analytical Report for the Cape Coast Municipality is one of the 216 district
census reports aimed at making data available to planners and decision makers at the district
level. In addition to presenting the district profile, the report discusses the social and
economic dimensions of demographic variables and their implications for policy formulation,
planning and interventions. The conclusions and recommendations drawn from the district
report are expected to serve as a basis for improving the quality of life of Ghanaians through
evidence-based decision-making, monitoring and evaluation of developmental goals and
intervention programmes.
For ease of accessibility to the census data, the district report and other census reports
produced by the GSS will be disseminated widely in both print and electronic formats. The
report will also be posted on the GSS website: www.statsghana.gov.gh.
The GSS wishes to express its profound gratitude to the Government of Ghana for providing
the required resources for the conduct of the 2010 PHC. While appreciating the contribution
of our Development Partners (DPs) towards the successful implementation of the Census, we
wish to specifically acknowledge the Department for Foreign Affairs, Trade and
Development (DFATD) formerly the Canadian International Development Agency (CIDA)
and the Danish International Development Agency (DANIDA) for providing resources for
the preparation of all the 216 district reports. Our gratitude also goes to the Metropolitan,
Municipal and District Assemblies, the Ministry of Local Government, Consultant Guides,
Consultant Editors, Project Steering Committee members and their respective institutions for
their invaluable support during the report writing exercise. Finally, we wish to thank all the
report writers, including the GSS staff who contributed to the preparation of the reports, for
their dedication and diligence in ensuring the timely and successful completion of the district
census reports.
Dr. Philomena Nyarko
Government Statistician
iv
TABLE OF CONTENTS
PREFACE AND ACKNOWLEDGEMENT ....................................................................... iii
LIST OF TABLES .................................................................................................................. vi
LIST OF FIGURES ............................................................................................................... vii
ACRONYMS AND ABBREVIATIONS ............................................................................ viii
EXECUTIVE SUMMARY .................................................................................................... ix
CHAPTER ONE: INTRODUCTION ................................................................................... 1
1.1 Background .................................................................................................................... 1
1.2 Physical and Natural Environment ................................................................................ 1
1.3 Political Administration ................................................................................................. 3
1.4 Social and Cultural Structure ......................................................................................... 3
1.5 Economy ........................................................................................................................ 4
1.6 Census Methodology, Concepts and Definitions ........................................................... 4
1.7 Organization of the Report........................................................................................... 14
CHAPTER TWO: DEMOGRAPHIC CHARACTERISTICS ......................................... 16
2.1 Introduction .................................................................................................................. 16
2.2 Population Size and Distribution ................................................................................. 16
2.3 Age and sex structure, sex and dependency ratios ....................................................... 17
2.4 Fertility, Mortality and Migration ................................................................................ 18
CHAPTER THREE: SOCIAL CHARACTERISTICS .................................................... 24
3.1 Introduction .................................................................................................................. 24
3.2 Household size, household composition and structure ................................................ 24
3.3 Marital Status ............................................................................................................... 26
3.4 Nationality.................................................................................................................... 29
3.5 Religion ........................................................................................................................ 30
3.6 Literacy and Education ................................................................................................ 30
CHAPTER FOUR: ECONOMIC CHARACTERISTICS ............................................... 34
4.1 Introduction .................................................................................................................. 34
4.2 Economic Activity Status ............................................................................................ 34
4.3 Occupation ................................................................................................................... 36
4.4 Industry ........................................................................................................................ 37
4.5 Employment Status ...................................................................................................... 38
4.6 Employment Sector ...................................................................................................... 39
CHAPTER FIVE: INFORMATION COMMUNICATION TECHNOLOGY .............. 40
5.1 Introduction .................................................................................................................. 40
5.2 Mobile Phone Ownership ............................................................................................ 40
5.3 Use of Internet.............................................................................................................. 40
5.4 Household Ownership of Desktop or Laptop Computers ............................................ 41

v
CHAPTER SIX: DISABILITY ........................................................................................... 42
6.1 Introduction .................................................................................................................. 42
6.2 Population with Disability ........................................................................................... 42
6.3 Disability and Economic Activity Status ..................................................................... 43
6.4 Disability and Education .............................................................................................. 44
CHAPTER SEVEN: AGRICULTURAL ACTIVITIES ................................................... 46
7.1 Introduction .................................................................................................................. 46
7.2 Households in Agriculture ........................................................................................... 46
7.3 Type of Farming Activities .......................................................................................... 46
7.4 Type of Livestock, other animals reared and keepers................................................. 47
CHAPTER EIGHT: HOUSING CONDITION ................................................................. 48
8.1 Introduction .................................................................................................................. 48
8.2 Housing Stock .............................................................................................................. 48
8.3 Type of Dwelling, Holding and Tenancy Arrangement .............................................. 49
8.4 Construction Material .................................................................................................. 50
8.5 Room Occupancy ......................................................................................................... 52
8.6 Access to Utility and Household Facilities .................................................................. 52
8.7 Main Sources of Water ................................................................................................ 54
8.8 Bathing and Toilet Facilities ........................................................................................ 55
8.9 Methods of Waste Disposal ......................................................................................... 57
CHAPTER NINE: SUMMARY OF FINDINGS, CONCLUSIONS AND POLICY
IMPLICATIONS ................................................................................. 58
9.1 Introduction .................................................................................................................. 58
9.2 Demographic Characteristics ....................................................................................... 58
9.3 Social Characteristics ................................................................................................... 58
9.4 Economic Characteristics............................................................................................. 59
9.5 Information Communication Technology .................................................................... 59
9.6 Disability ...................................................................................................................... 60
9.7 Agricultural Activities ................................................................................................. 60
9.8 Housing Characteristics ............................................................................................... 60
9.9 Recommendations ........................................................................................................ 61
REFERENCES ....................................................................................................................... 63
APPENDICES ........................................................................................................................ 64
LIST OF CONTRIBUTORS ................................................................................................ 73
vi
LIST OF TABLES
Table 2.1: Population by age, sex and locality of residence ................................................... 16
Table 2.2: Reported total fertility rate, general fertility rate and crude birth rate by district . 19
Table 2.3: Children ever born and children surviving by age of woman and sex of child ..... 20
Table 2.4: Deaths in the households and crude death rate by district ..................................... 20
Table 2.5: Causes of death by district ..................................................................................... 22
Table 2.6: Birthplace by duration of residence of migrants .................................................... 23
Table 3.1: Household size by locality of residence ................................................................ 24
Table 3.2: Household population by composition and sex ..................................................... 25
Table 3.3: Household population by structure and sex ........................................................... 26
Table 3.4: Population 12 years and older by sex, marital status and level of education ........ 28
Table 3.5: Marital status of persons 12 years and older by sex and economic activity status ...................................................................................................................... 29
Table 3.6: Population by nationality and sex .......................................................................... 29
Table 3.7: Population by religion and sex .............................................................................. 30
Table 3.8: Population 3 years and older by level of education, school attendance and sex ... 33
Table 4.1: Population 15 years and older by activity status and sex ...................................... 34
Table 4.2: Population 15 years and older by sex, age and activity status ............................... 36
Table 4.3: Employed population 15 years and older by occupation and sex .......................... 37
Table 4.4: Employed population 15 years and older by industry and sex .............................. 38
Table 4.5: Employment sector of the employed population 15 years and older by sex ......... 39
Table 5.1: Population 12 years and older by mobile phone ownership, internet usage and sex ......................................................................................................... 40
Table 5.2: Households having desktop or laptop computers by sex of household head ........ 41
Table 6.1: Population by disability type and sex type of locality ........................................... 43
Table 6.2: Persons 15 years and older with disability by economic activity status and sex ... 44
Table 6.3: Population 3 years and older by sex, disability type and level of education ......... 45
Table 7.1: Households by agricultural activities and locality ................................................. 47
Table 7.2: Distribution of livestock, other animals and keepers............................................. 47
Table 8.1: Stock of houses and households by type of locality .............................................. 48
Table 8.2: Type of occupied dwelling unit by sex of household head and type of locality ... 49
Table 8.3: Ownership status of dwelling by sex of household head and type of locality ....... 50
Table 8.4: Main construction material for outer wall of dwelling unit by type of locality .... 50
Table 8.5: Main construction materials for the floor of dwelling unit by type of locality ..... 51
Table 8.6: Main construction material for roofing of dwelling unit by type of locality ......... 51
Table 8.7: Households by size and number of sleeping rooms occupied in dwelling unit ..... 52
Table 8.8: Main source of water for drinking and other domestic purposes .......................... 55
Table 8.9: Method of solid and liquid waste disposal by type of locality .............................. 57
Table A1: Population 11 years and older by age group, sex and literacy status..................... 64
Table A2: Household composition by type of locality ........................................................... 65
Table A3: Persons 12 years and older by sex, age-group and marital status .......................... 67
Table A4: Population 11 years and older by sex, age and literacy status ............................... 68
vii
Table A5: Population 3 years and older by sex, disability type and level of education ........ 69
Table A6: Employed population 15 years and older by employment status and sex ............. 71
Table A7: Population by sex, number of household and houses in the 20 largest communities ........................................................................................................... 71
Table A8: Population by age group in the 20 largest communities ........................................ 72
LIST OF FIGURES
Figure 1.1: Map of Cape Coast Municipality ........................................................................... 2
Figure 2.1: Population pyramid .............................................................................................. 18
Figure 2.2: Reported age specific death rates by sex .............................................................. 21
Figure 3.1: Marital status of the population 12 years and older ............................................. 27
Figure 3.2: Literacy status by age of persons 11 years and older ........................................... 31
Figure 3.3: Language of literacy of persons 11 years and older ............................................. 31
Figure 4.1: Employment status of the employed population 15 years and older by sex ........ 39
Figure 7.1: Agricultural and non-agricultural households ...................................................... 46
Figure 8.1: Sources of light ..................................................................................................... 53
Figure 8.2: Sources of cooking fuel ........................................................................................ 53
Figure 8.3: Main source of drinking water by locality of residence ....................................... 54
Figure 8.4: Type of toilet facility used by household by type of locality ............................... 56
Figure 8.5: Bathing facilities used by household by type of locality ...................................... 56

viii
ACRONYMS AND ABBREVIATIONS
CERSGIS Centre for Remote Sensing and Geographic Information Systems
CBR Crude Birth Rate
CDR Crude Death Rate
ECOWAS Economic Commission of West African States
GSS Ghana Statistical Service
GFR General Fertility Rate
ICT Information Communication Technology
JHS Junior High School
JSS Junior Secondary School
KVIP Kumasi Ventilated Improved Pit
MDAs Ministries, Departments and Agencies
MDGs Millennium Development Goals
NCTAC National Census Technical Advisory Committee
NCSC National Census Steering Committee
PES Post Enumeration Survey
PHC Population and Housing Census
PWDs Persons with Disability
TFR Total Fertility Rate
UN United Nations
UNFPA United Nation Population Fund
SHS Senior High School
SSS Senior Secondary School
WC Water Closet

ix
EXECUTIVE SUMMARY
Introduction
The metropolis census report is the first of its kind since the first post-independence census was
conducted in 1960. The report provides basic information about the metropolis. It gives a brief
background of the metropolis, describing its physical features, political and administrative
structure, socio-cultural structure and economy. Using data from the 2010 Population and
Housing Census (2010 PHC), the report discusses the population characteristics of the
metropolis, fertility, mortality, migration, marital status, literacy and education, economic
activity status, occupation, employment; Information Communication Technology (ICT),
disability, agricultural activities and housing conditions of the metropolis. The key findings of
the analysis are as follows (references are to the relevant sections of the report):
Population size, structure and composition
The population of the Cape Coast Metropolis, according to the 2010 Population and Housing
Census, is 169,894 representing 7.7 percent of the region’s total population. Males constitute
48.7 percent and females represent 51.3 percent. Twenty three percent of the population live in
rural localities. The metropolis has a sex ratio (number of males per 100 females) of 95. The
proportion of the metropolis youth (less than 15 years) is 28.4 percent depicting not too broad
base a population pyramid which tapers off with a small number of elderly (60 years and older)
persons (4.5%). The total age dependency ratio for the metropolis is 49.1, the age dependency
ratio for males is lower (48.2) than that of females (49.9).
Fertility, mortality and migration
The Total Fertility Rate (TFR) for the metropolis 2.2 is the lowest in the region. The General
Fertility Rate (GFR) is 59.2 births per 1000 women aged 15-49 years which also is the lowest
for the region. The Crude Birth Rate (CBR) is 17.9 per 1000 population. The crude death rate
for the metropolis is 5.2 per 1000. The death rate for males is highest for age 70 and above
representing about 58 deaths per 1000 population while for the females, the highest death rate
of 35 deaths per 1000 population is for ages 70 and above. Accident/violence/homicide/suicide
accounted for 12.8 percent of all deaths while other causes constitute 87.2 percent of deaths in
the metropolis. Majority of migrants (63.0 percent) living in the metropolis were born in
another region while one-third of the migrants were born elsewhere in the Central Region. For
migrants born in another region, those born in Greater Accra Region constitute 15.6 percent
followed by Western Region with 11.5 percent.
Household size, composition and structure
The metropolis has a household population of 140,405 with a total number of 40,386
households. The average household size in the metropolis is 3.5 persons per household.
Children constitute the largest proportion of the household structure accounting for 37.1
percent. Spouses form about 9.8 percent. Nuclear households (head, spouse(s) and children)
constitute 47.7 percent of the total number of household composition in the metropolis.
Marital status
About one in three (29.8%) of the population aged 12 years and older are married, 55.5
percent have never married, 4.9 percent are in consensual unions, 4.2 percent are widowed,
3.9 percent are divorced and 1.7 percent are separated. . Among the married, 15.4 percent

x
have no education while 2.7 percent of the unmarried have never been to school. About four
in five of the married population (79.6%) are employed, 3.7 percent are unemployed and 16.7
percent are economically not active. A greater proportion of those who have never married
(71.4%) are economically not active with 4.9 percent unemployed.
Nationality
The proportion of Ghanaians by birth in the metropolis is 93.7 percent. Those who have
naturalised constitute 1.0 percent and the non-Ghanaian population in the metropolis is 2.7
percent.
Literacy and education
Of the population 11 years and above, about 90.0 percent are literate and 10.0 percent are
non-literate. The proportion of literate males is higher (94.1 %) than that of females (85.6%).
About seven out of ten people (67.2%) indicated they could speak and write both English and
Ghanaian languages.
Economic activity status
About 54.7 percent of the population aged 15 years and older are economically active while
45.3 per cent are economically not active. Of the economically active population, 90.7
percent are employed while 9.3 percent are unemployed. For those who are economically not
active, a larger percentage of them are students (73.3%), 9.3% perform household duties and
2.0 percent are disabled or too sick to work. About three out of five (59.1%) unemployed are
seeking work for the first time.
Occupation
Of the employed population, about 32.5 percent are engaged as service and sales workers,
craft and related trades workers 23.6 percent, professionals 13.2 percent, skilled agricultural
forestry and fishery workers 6.8 percent.
Employment status and sector
Of the population 15 years and older 47.0 percent are self-employed without employees, 39.0
percent are employees, 5.5 percent are self-employed with employees, 2.6 percent are
contributing family workers and 3.5 percent are apprentices. Overall, men constitute the
highest proportion in each employment category except self-employed without employees,
the contributing family workers and domestic employees (house help). The private informal
sector is the largest employer in the metropolis, employing 68.4 percent of the population
followed by the public sector with 21.4 percent.
Information Communication Technology
Of the population 12 years and above, 69.5 percent have mobile phones. Men who own
mobile phones constitute 74.1 percent as compared to 65.2 percent of females. About 32.0
percent of the population 12 years and older use internet facilities in the metropolis. Only
6,337 households representing 15.7 percent of the total households in the metropolis have
desktop/laptop computers.
Disability
About 2.5 percent of the metropolis’s total population has one form of disability or the other.
The proportion of the male population with disability is slightly lower (2.4%) than females
xi
(2.6%). The types of disability in the metropolis include sight, hearing, speech, physical,
intellect, and emotion. Persons with sight disability recorded the highest of 46.2 percent
followed by physical disability (26.9%). About 82.6 percent of the population with disability
are in the urban localities. There are more males with physical, emotional, and speech
disabilities than females. Of the population disabled, 24.9 percent have never been to school.
Agriculture
As low as 10.3 percent of households in the metropolis are engage in agriculture. In the rural
localities, a little less than 2 out of five (18.7%) are agricultural households while in the urban
localities, 7.5 percent of households are into agriculture. Most agricultural households in the
metropolis (76.6%) are involved in crop farming. Poultry (chicken) is the dominant animal
reared in the metropolis
Housing
The housing stock of Cape Coast Metropolitan Assembly is 17,738 representing 5.1 percent
of the total number of houses in the Central Region. The average number of persons per
house is 7.9.
Type, tenancy arrangement and ownership of dwelling units
Over half (58.2%) of all dwelling units in the metropolis are compound houses; 17.0 percent
are separate houses and 11.4 percent are flat/apartment houses. About 35.3 percent of the
dwelling units in the metropolis are owned by members of the household; 35.6 percent are
owned by private individuals; 19.8 percent are owned by a relative who is not a member of
the household and only 5.6 percent are owned by public or government. Less than one
percent (0.8%) of the dwelling units is owned through mortgage schemes.
Material for construction of outer wall, floor and roof
The main construction material for outer walls of dwelling units in the metropolis is cement
blocks/concrete accounting for 77.2 percent with mud/mud bricks or earth constituting 16.2
percent of outer walls of dwelling units in the metropolis. Cement (86.2%) and mud/earth
(5.7%) are the two main materials used in the construction of floors of dwelling units in the
metropolis. Slate/asbestos is the main roofing material (61.0 %) for dwelling units in the
metropolis.
Room occupancy
One room constitutes the highest percentage (67.9%) of sleeping rooms occupied by
households in housing units in the metropolis. About 26.4 percent of households with 10 or
more members occupy single rooms.
Utilities and household facilities
The three main sources of lighting in dwelling units in the metropolis are electricity (90.3%),
kerosene (5.8%) and flashlight/torch (1.8%). The main source of fuel for cooking for most
households in the metropolis is charcoal (58.6%). The proportion for rural (56.3%) is lower
than that of urban (59.4%). The four main sources of water in the metropolis are public
tap/standpipe, pipe-borne inside dwelling, pipe-borne outside dwelling, and sachet water. A
little more than 3 out of five households (65.9%) drink water from either pipe-borne inside
dwelling or public tap/standpipe.

xii
The most important toilet facility used in the metropolis is public toilet (WC, KVIP, Pit, Pan)
representing about 39.5 percent followed by water closet (38.4%). About 0.3 percent of the
population in the metropolis use bucket/pan toilet facility. A little less than two out of five
households (38.9%) in the metropolis share separate bathrooms in the same house while
about 22.3 percent own bathrooms for their exclusive use.
Waste disposal
The most widely method of solid waste disposal is by public dump in the container
accounting for 56.7 percent. About two in ten households (21.9%) dispose their solid waste
by public dump in the open space. House to house waste collection accounts for 5.5 percent.
For liquid waste disposal, throwing waste into gutter (36.0%) and through drainage system
into a gutter (25.6%) are the two most common methods used by households in the
metropolis.
1
CHAPTER ONE
INTRODUCTION
1.1 Background
The traditional name of Cape Coast ‘Oguaa’ originates from the Fante word ‘gua’ meaning
market. It was named Cabo Corso by the Portuguese meaning Short Cape and later on
changed to Cape Coast by the British. The Cape Coast Metropolitan Area is one of the oldest
districts in Ghana. It was raised to the status of municipality in 1987 by LI 1373 and upgrade
to metropolitan status in 2007 by LI 1927.
1.2 Physical and Natural Environment
1.2.1 Location
The Metropolis is bounded to the South by the Gulf of Guinea, to the West by the Komenda
Edina Eguafo Abrem Municipality (at Iture bridge), to the East by the Abura Asebu
Kwamankese District, and to the North by the Twifu Heman Lower Denkyira District. It is
located on longitude 1° 15ˈW and latitude 5°06ˈN. It occupies an Area of approximately 122
square kilometres, with the farthest point at Brabedze located about 17 kilometres from Cape
Coast, the Central Regional capital.
1.2.2 Relief and drainage
The landscape of the Cape Coast Metropolis is generally undulating with batholiths as a
dominant feature. The rock type of the Metropolis is of the Birimian formation and consists
of schist and introduced granites and pegmatite. The hills are generally overlain by sandy
and clayey silts while the valleys are overlain by clayey gravel with lateritic soils exposed in
a number of areas. In between the batholiths and the few hills are valleys of various shapes,
some occupied by rivers and streams including the Kakum – the major steam in the
Metropolis. It is the main source of water for domestic and industrial purposes. Many of the
minor streams end up in wetlands, with the largest draining into the Fosu Lagoon at Bakaano.
The landscape in the northern parts of the Metropolis is however, generally low-lying and is
suitable for crop cultivation.
1.2.3 Climate
The Cape Coast Metropolis experiences high temperatures throughout the year. The hottest
months are February and March, just before the main rainy season, while the coolest months
are June, July and August. The variability in climate in the Metropolis is influenced more by
rainfall that temperature. The Metropolis has a double maximal rainfall, with annual rainfall
total between 750 and 1,000mm.
1.2.4 Vegetation
The present vegetation of the Metropolis consists of shrubs of about 1.5 metres high, grasses
and a few scattered trees. The original vegetation of dense scrub, which the rainfall
supported, has been replaced by secondary vegetation as a result of clearing for farming,
charcoal burning, bush fires and other human activities. Presently, trees are less dense in the
area compared with the interior forest areas. The northern parts of the Metropolis are an
exception to what has been described above. In these areas, secondary forest can be found,
and has survived mainly due to lower population densities and relatively little disturbance of
the ecosystem.

2
Figure 1.1: Map of Cape Coast Municipality
Source: Ghana Statistical Service, GIS
3
1.3 Political Administration
Cape Coast Metropolis is one of the six Metropolis in Ghana and the only among the 20
districts in the Central Region. It has 67 assembly members, comprising the Metropolitan
Chief Executive, 45 elected members, two members of parliament and 19 members appointed
by the President in consultation with traditional authorities and other interest groups in the
Metropolis. The Assembly is divided into two Sub Metros: the Cape Coast South Sub Metro
and the Cape Coast North Sub Metro. It has two constituencies which are coterminous with
the Sub Metros.
1.4 Social and Cultural Structure
1.4.1 Historical perspective
A major social consequence of its long and intensive interaction with the European traders
was that Cape Coast became a centre for the spread of elements of European culture and
civilization to the rest of the country. It was the centre of secondary education, and hence the
training ground of catechists and teachers for most of the country before the Catholic and the
Basel/Presbyterian missions established themselves in the present Eastern, Volta, Ashanti,
Northern, Upper East and Upper West Regions. It was the breeding-ground of the Ghanaian
intelligentsia, the birth-place of the earliest newspapers in the country and of the first
nationalist associations and societies. It was in the vanguard of nationalist agitation in the
Gold Coast and its dependencies: the Fanti Confederation of 1870-72 and the Aborigines'
Rights Protection Society, founded in 1897, were the prototypes of the United Gold Coast
Convention (U.G.C.C.), 1947, and its offshoot, the Convention Peoples' Party. It was equally
the home of the earliest experiments in Municipal government, which began in the 1850's.
Cape Coast was also one of the earliest centres of Ghanaian entrepreneurship. It is in this
light that it is suggested that “anybody interested in a study of commercial ventures among
the people of the Gold Coast, in the latter half of the nineteenth century, and why they failed
to be transformed into industrial concerns, will have to start with the papers of the merchant
princes of Cape Coast”.
1.4.2 Ethnicity, religion and culture
The people of Cape Coast are part of a larger group of people known as Fantes found in the
central part of Southern Ghana and are among the Akans ethnic group of Ghana. The
language spoken by the people is Fante. People belonging to other ethnic groups are also
found in the Metropolis. The entire Metropolis constitutes one traditional area with the Oguaa
Omanhen as the Paramount Chief. Christianity has long been the dominant religion in the
Metropolis, although there a significant number of Muslims and traditionalist.
The matrilineal system of inheritance is practised by the people and the extended family,
otherwise known as “ebusua” or clan, is the basis of the social structure. The “odikro” or
chief is the political head of a town or village. The main festival celebrated in the
Metropolis is “the Oguaa Fetu Afahye”, which is celebrated in the first Saturday of
September every year, and usually attracts people from all walks of lives, both far and near.
1.4.3 Education
Cape Coast is endowed with many schools across the length and breadth of the Metropolis,
ranging from basic to tertiary institutions. These schools attract people from all over the

4
country and the West Africa Sub-region, who pursue various levels of academic and
professional education.
1.4.4 Health
The Metropolis is endowed with of a regional hospital, a district hospital and various clinics
that provide health care to the population. The regional hospital, one of three such facilities in
the country serves as a referral centre for the region.
1.5 Economy
1.5.1 Tourism
Cape Coast is the hub of tourism in Ghana. It is the centre for the Pan African Festival
dubbed, PANAFEST. The Metropolis is endowed with an enviable potential that predisposes
the area to tourism development. The potential of the Metropolis includes physical, historical
and cultural variants that could be developed for conventional tourism. The scenic landscape
makes the area a favourable destination for adventure-seeking and exploratory tourists. The
celebration of the annual festival of the people, the Fetu Afahye, has always attracted people
from within and outside the shores of the country and has developed over the years into a
grand cultural celebration which has enhanced tourism in the Metropolis.
Of all the cities and towns of Ghana, Cape Coast, the capital of the Gold Coast colony until
1877, has the most extensive surviving historic core of pre 1900 buildings, and the greatest
potential for revitalization and economic regeneration through repair, rehabilitation, and
where necessary, reconstruction, of the existing building stock.
1.5.2 Construction, minning and quarrying
There are a number of private sector construction industries in the Metropolis. The
establishment of block moulding factories, brick and tile, mining and quarrying of chippings,
sand and stone, and other related activities have significantly contributed to real estate
development and road construction. Similarly, the large deposits of kaolin at Ekon have
potential for large scale production
1.6 Census Methodology, Concepts and Definitions
1.6.1 Introduction
Ghana Statistical Service (GSS) was guided by the principle of international comparability
and the need to obtain accurate information in the 2010 Population and Housing Census
(2010 PHC). The Census was, therefore, conducted using all the essential features of a
modern census as contained in the United Nations Principles and Recommendations for
countries taking part in the 2010 Round of Population and Housing Censuses.
Experience from previous post independence censuses of Ghana (1960, 1970, 1984 and 2000)
was taken into consideration in developing the methodologies for conducting the 2010 PHC.
The primary objective of the 2010 PHC was to provide information on the number,
distribution and social, economic and demographic characteristics of the population of Ghana
necessary to facilitate the socio-economic development of the country.

5
1.6.2 Pre-enumeration activities
Development of census project document and work plans
A large scale statistical operation, such as the 2010 Population and Housing Census required
meticulous planning for its successful implementation. A working group of the Ghana
Statistical Service prepared the census project document with the assistance of two
consultants. The document contains the rationale and objectives of the census, census
organisation, a work plan as well as a budget. The project document was launched in
November 2008 as part of the Ghana Statistics Development Plan (GSDP) and reviewed in
November 2009.
Census secretariat and committees
A well-structured management and supervisory framework that outlines the responsibilities
of the various stakeholders is essential for the effective implementation of a population and
housing census. To implement the 2010 PHC, a National Census Secretariat was set up in
January 2008 and comprised professional and technical staff of GSS as well as staff of other
Ministries, Departments and Agencies (MDAs) seconded to GSS. The Census Secretariat was
primarily responsible for the day-to-day planning and implementation of the census activities.
The Secretariat had seven units, namely; census administration, cartography, recruitment and
training, publicity and education, field operations and logistics management, data processing,
and data analysis and dissemination.
The Census Secretariat was initially headed by an acting Census Coordinator engaged by the
United Nations Population Fund (UNFPA) in 2008 to support GSS in the planning of the
Census. In 2009, the Census Secretariat was re-organised with the Government Statistician
as the National Chief Census Officer and overall Coordinator, assisted by a Census
Management Team and a Census Coordinating Team. The Census Management Team had
oversight responsibility for the implementation of the Census. It also had the responsibility of
taking critical decisions on the census in consultation with other national committees. The
Census Coordinating Team, on the other hand, was responsible for the day-to-day
implementation of the Census programme.
A number of census committees were also set up at both national and sub-national levels to
provide guidance and assistance with respect to resource mobilization and technical advice.
At the national level, the committees were the National Census Steering Committee (NCSC),
the National Census Technical Advisory Committee (NCTAC) and the National Census
Publicity and Education Committee (NCPEC). At the regional and district levels, the
committees were the Regional Census Implementation Committee and the District Census
Implementation Committee, respectively.
The Regional and District Census Implementation Committees were inter-sectoral in their
composition. Members of the Committees were mainly from decentralized departments with
the Regional and District Coordinating Directors chairing the Regional Census
Implementation Committee and District Census Implementation Committee, respectively.
The Committees contributed to the planning of district, community and locality level
activities in areas of publicity and field operations. They supported the Regional and District
Census Officers in the recruitment and training of field personnel (enumerators and
supervisors), as well as mobilizing logistical support for the census.
6
Selection of census topics
The topics selected for the 2010 Population and Housing Census were based on
recommendations contained in the UN Principles and Recommendations for 2010 Round of
Population and Housing Censuses and the African Addendum to that document as well as the
needs of data users. All the core topics recommended at the global level, i.e., geographical
and internal migration characteristics, international migration, household characteristics,
demographic and social characteristics such as age, date of birth, sex, and marital status,
fertility and mortality, educational and economic characteristics, issues relating to disability
and housing conditions and amenities were included in the census.
Some topics that were not considered core by the UN recommendations but which were
found to be of great interest and importance to Ghana and were, therefore, included in the
2010 PHC are religion, ethnicity, employment sector and place of work, agricultural activity,
as well as housing topics, such as, type of dwelling, materials for outer wall, floor and roof,
tenure/holding arrangement, number of sleeping rooms, cooking fuel, cooking space and
Information Communication Technology (ICT).
Census mapping
A timely and well implemented census mapping is pivotal to the success of any population
and housing census. Mapping delineates the country into enumeration areas to facilitate
smooth enumeration of the population. The updating of the 2000 Census Enumeration Area
(EA) maps started in the last quarter of 2007 with the acquisition of topographic sheets of all
indices from the Survey and Mapping Division of the Lands Commission. In addition, digital
sheets were also procured for the Geographical Information System Unit.
The Cartography Unit of the Census Secretariat collaborated with the Survey and Mapping
Division of the Lands Commission and the Centre for Remote Sensing and Geographic
Information Services (CERSGIS) of the Department of Geography and Resource
Development, University of Ghana, to determine the viability of migrating from analog to
digital mapping for the 2010 PHC, as recommended in the 2000 PHC Administrative Report.
Field cartographic work started in March 2008 and was completed in February 2010.
Development of questionnaire and manuals
For effective data collection, there is the need to design appropriate documents to solicit the
required information from respondents. GSS consulted widely with main data users in the
process of the questionnaire development. Data users including MDAs, research institutions,
civil society organisations and development partners were given the opportunity to indicate
the type of questions they wanted to be included in the census questionnaire.
Documents developed for the census included the questionnaire and manuals, and field
operation documents. The field operation documents included Enumerator’s Visitation
Record Book, Supervisor’s Record Book, and other operational control forms. These record
books served as operational and quality control tools to assist enumerators and supervisors to
control and monitor their field duties respectively.
Pre-tests and trial census
It is internationally recognized that an essential element in census planning is the pre-testing
of the questionnaire and related instructions. The objective of the pre-test is to test the

7
questionnaire, the definition of its concepts and the instructions for filling out the
questionnaire.
The census questionnaire was pre-tested twice in the course of its development. The first pre-
test was carried out in March 2009 to find out the suitability of the questions and the
instructions provided. It also tested the adequacy and completeness of the responses and how
respondents understood the questions. The second pre-test was done in 10 selected
enumeration areas in August, 2009. The objective of the second pre-test was to examine the
sequence of the questions, test the new questions, such as, date of birth and migration, and
assess how the introduction of ‘date of birth’ could help to reduce ‘age heaping’. With regard
to questions on fertility, the pre-tests sought to find out the difference, if any, between proxy
responses and responses by the respondents themselves. Both pre-tests were carried in the
Greater Accra Region. Experience from the pre-tests was used to improve the final census
questionnaire.
A trial census which is a dress rehearsal of all the activities and procedures that are planned
for the main census was carried out in October/November 2009. These included recruitment
and training, distribution of census materials, administration of the questionnaire and other
census forms, enumeration of the various categories of the population (household,
institutional and floating population), and data processing. The trial census was held in six
selected districts across the country namely; Saboba (Northern Region), Chereponi (Northern
Region), Sene (Brong Ahafo Region), Bia (Western Region), Awutu Senya (Central Region),
and Osu Klottey Sub-Metro (Greater Accra Region). A number of factors were considered in
selecting the trial census districts. These included: administrative boundary issues, ecological
zone, and accessibility, enumeration of floating population/outdoor-sleepers, fast growing
areas, institutional population, and enumeration areas with scattered settlements.
The trial census provided GSS with an opportunity to assess its plans and procedures as well
as the state of preparedness for the conduct of the 2010 PHC. The common errors found
during editing of the completed questionnaires resulted in modifications to the census
questionnaire, enumerator manuals and other documents. The results of the trial census
assisted GSS to arrive at technically sound decisions on the ideal number of persons per
questionnaire, number of persons in the household roster, migration questions, placement of
the mortality question, serial numbering of houses/housing structures and method of
collection of information on community facilities. Lessons learnt from the trial census also
guided the planning of the recruitment process, the procedures for training of census field
staff and the publicity and education interventions.
1.6.3 Census enumeration
Method of enumeration and field work
All post- independence censuses (1960, 1970, 1984, and 2000) conducted in Ghana used the
de facto method of enumeration where people are enumerated at where they were on census
night and not where they usually reside. The same method was adopted for the 2010 PHC.
The de facto count is preferred because it provides a simple and straight forward way of
counting the population since it is based on a physical fact of presence and can hardly be
misinterpreted. It is thought that the method also minimizes the risks of under-enumeration
and over enumeration. The canvasser method, which involves trained field personnel visiting
houses and households identified in their respective enumeration areas, was adopted for the
2010 PHC.
8
The main census enumeration involved the canvassing of all categories of the population by
trained enumerators, using questionnaires prepared and tested during the pre-enumeration
phase. Specific arrangements were made for the coverage of special population groups, such
as the homeless and the floating population. The fieldwork began on 21st September 2010
with the identification of EA boundaries, listing of structures, enumeration of institutional
population and floating population.
The week preceding the Census Night was used by field personnel to list houses and other
structures in their enumeration areas. Enumerators were also mobilized to enumerate
residents/inmates of institutions, such as, schools and prisons. They returned to the
institutions during the enumeration period to reconcile the information they obtained from
individuals and also to cross out names of those who were absent from the institutions on
Census Night. Out-door sleepers (floating population) were also enumerated on the Census
Night.
Enumeration of the household population started on Monday, 27th September, 2010.
Enumerators visited houses, compounds and structures in their enumeration areas and started
enumerating all households including visitors who spent the Census Night in the households.
Enumeration was carried out in the order in which houses/structures were listed and where
the members of the household were absent, the enumerator left a call-back-card indicating
when he/she would come back to enumerate the household. The enumeration process took off
smoothly with enumerators poised on completing their assignments on schedule since many
of them were teachers and had to return to school. However, many enumerators ran short of
questionnaires after a few days’ work.
Enumeration resumed in all districts when the questionnaire shortage was resolved and by
17th October, 2010, enumeration was completed in most districts. Enumerators who had
finished their work were mobilized to assist in the enumeration of localities that were yet to
be enumerated in some regional capitals and other fast growing areas. Flooded areas and
other inaccessible localities were also enumerated after the end of the official enumeration
period. Because some enumeration areas in fast growing cities and towns, such as, Accra
Metropolitan Area, Kumasi, Kasoa and Techiman were not properly demarcated and some
were characterized by large EAs, some enumerators were unable to complete their assigned
tasks within the stipulated time.
1.6.4 Post enumeration survey
In line with United Nations recommendations, GSS conducted a Post Enumeration Survey
(PES) in April, 2011 to check content and coverage error. The PES was also to serve as an
important tool in providing feedback regarding operational matters such as concepts and
procedures in order to help improve future census operations. The PES field work was
carried out for 21 days in April 2011 and was closely monitored and supervised to ensure
quality output. The main findings of the PES were that:
97.0 percent of all household residents who were in the country on Census Night (26th
September, 2010) were enumerated.
1.3 percent of the population was erroneously included in the census.
Regional differentials are observed. Upper East region recorded the highest coverage
rate of 98.2 percent while the Volta region had the lowest coverage rate of 95.7
percent.
9
Males (3.3%) were more likely than females (2.8%) to be omitted in the census. The
coverage rate for males was 96.7 percent and the coverage rate for females was 97.2
percent. Also, the coverage rates (94.1%) for those within the 20-29 and 30-39 age
groups are relatively lower compared to the coverage rates of the other age groups.
There was a high rate of agreement between the 2010 PHC data and the PES data for
sex (98.8%), marital status (94.6%), relationship to head of household (90.5%) and
age (83.0%).
1.6.5 Release and dissemination of results
The provisional results of the census were released in February 2011 and the final results in
May 2012. A National Analytical report, six thematic reports, a Census Atlas, 10 Regional
Reports and a report on Demographic, Social, Economic and Housing were prepared and
disseminated in 2013.
1.6.6 Concepts and definitions
Introduction
The 2010 Population and Housing Census of Ghana followed the essential concepts and
definitions of a modern Population and Housing Census as recommended by the United
Nations (UN). It is important that the concepts, definitions and recommendations are adhered
to since they form the basis upon which Ghana could compare her data with that of other
countries.
The concepts and definitions in this report cover all sections of the 2010 Population and
Housing Census questionnaires (PHC1A and PHC1B). The sections were: geographical
location of the population, Household and Non-household population, Literacy and
Education, Emigration, Demographic and Economic Characteristics, Disability, Information
and Communication Technology (ICT), Fertility, Mortality, Agricultural Activity and
Housing Conditions.
The concepts and definitions are provided to facilitate understanding and use of the data
presented in this report. Users are therefore advised to use the results of the census within the
context of these concepts and definitions.
Region
There were ten (10) administrative regions in Ghana during the 2010 Population and Housing
Census as they were in 1984 and 2000.
District
In 1988, Ghana changed from the local authority system of administration to the district
assembly system. In that year, the then existing 140 local authorities were demarcated into
110 districts. In 2004, 28 new districts were created; this increased the number of districts in
the country to 138. In 2008, 32 additional districts were created bringing the total number of
districts to 170. The 2010 Population and Housing Census was conducted in these 170
administrative districts (these are made-up of 164 districts/municipals and 6 metropolitan
areas). In 2012, 46 new districts were created to bring the total number of districts to 216.
There was urgent need for data for the 46 newly created districts for planning and decision-
making. To meet this demand, the 2010 Census data was re-programmed into 216 districts
10
after carrying out additional fieldwork and consultations with stakeholders in the districts
affected by the creation of the new districts.
Locality
A locality was defined as a distinct population cluster (also designated as inhabited place,
populated centre, settlement) which has a NAME or LOCALLY RECOGNISED STATUS. It
included fishing hamlets, mining camps, ranches, farms, market towns, villages, towns, cities
and many other types of population clusters, which meet the above criteria. There were two
main types of localities, rural and urban. As in previous censuses, the classification of
localities into ‘urban’ and ‘rural’ was based on population size. Localities with 5,000 or more
persons were classified as urban while localities with less than 5,000 persons were classified
as rural.
Population
The 2010 Census was a “de facto” count and each person present in Ghana, irrespective of
nationality, was enumerated at the place where he/she spent the midnight of 26th September
2010.
Household
A household was defined as a person or a group of persons, who lived together in the same
house or compound and shared the same house-keeping arrangements. In general, a
household consisted of a man, his wife, children and some other relatives or a house help who
may be living with them. However, it is important to remember that members of a household
are not necessarily related (by blood or marriage) because non-relatives (e.g. house helps)
may form part of a household.
Head of household
The household head was defined as a male or female member of the household recognised as
such by the other household members. The head of household is generally the person who has
economic and social responsibility for the household. All relationships are defined with
reference to the head.
Household and non-household population
Household population comprised of all persons who spent the census night in a household
setting. All persons who did not spend the census night in a household setting (except
otherwise stated) were classified as non-household population. Persons who spent census
night in any of the under listed institutions and locations were classified as non-household
population:
(a) Educational institutions
(b) Children's and old people’s homes
(c) Hospitals and healing centres
(d) Hotels
(e) Prisons
(f) Service Barracks
11
(g) Soldiers on field exercise
(h) Floating population: The following are examples of persons in this category:
i. All persons who slept in lorry parks, markets, in front of stores and offices, public
bathrooms, petrol filling stations, railway stations, verandas, pavements, and all
such places which are not houses or compounds.
ii. Hunting and fishing camps.
iii. Beggars and vagrants (mentally sick or otherwise).
Age
The age of every person was recorded in completed years disregarding fractions of days and
months. For those persons who did not know their birthdays, the enumerator estimated their
ages using a list of district, regional and national historical events.
Nationality
Nationality is defined as the country to which a person belongs. A distinction is made
between Ghanaians and other nationals. Ghanaian nationals are grouped into Ghanaian by
birth, Ghanaian with dual nationality and Ghanaian by naturalization. Other nationals are
grouped into ECOWAS nationals, Africans other than ECOWAS nationals, and non-
Africans.
Ethnicity
Ethnicity refers to the ethnic group that a person belonged to. This information is collected
only from Ghanaians by birth and Ghanaians with dual nationality. The classification of
ethnic groups in Ghana is that officially provided by the Bureau of Ghana Languages and
which has been in use since the 1960 census.
Birthplace
The birthplace of a person refers to the locality of usual residence of the mother at the time of
birth. If after delivery a mother stayed outside her locality of usual residence for six months
or more or had the intention of staying in the new place for six or more months, then the
actual town/village of physical birth becomes the birthplace of the child.
Duration of residence
Duration of residence refers to the number of years a person has lived in a particular place.
This question is only asked of persons not born in the place where enumeration took place.
Breaks in duration of residence lasting less than 12 months are disregarded. The duration of
residence of persons who made multiple movements of one (1) year or more is assumed to be
the number of years lived in the locality (town or village) since the last movement.
Religion
Religion refers to the individual’s religious affiliation as reported by the respondent,
irrespective of the religion of the household head or the head’s spouse or the name of the
person. No attempt was made to find out if respondents actually practiced the faith they
professed.
12
Marital status
Marital status refers to the respondent’s marital status as at Census Night. The question on
marital status was asked only of persons 12 years and older. The selection of the age limit of
12 years was based on the average age at menarche and also on the practice in some parts of
the country where girls as young as 12 years old could be given in marriage.
Literacy
The question on literacy referred to the respondent's ability to read and write in any language.
A person was considered literate if he/she could read and write a simple statement with
understanding. The question on literacy was asked only of persons 11 years and older.
Education
School attendance
Data was collected on school attendance for all persons three (3) years and older. School
attendance refers to whether a person has ever attended, was currently attending or has never
attended school. In the census, school meant an educational institution where a person
received at least four hours of formal education.
Although the lower age limit of formal education is six years for primary one, eligibility for
the school attendance question was lowered to three years because pre-school education has
become an important phenomenon in the country.
Level of education
Level of education refers to the highest level of formal school that a person ever attended or
was attending. This information was obtained for persons 3 years and older.
Activity status
Activity status refers to economic or non-economic activity of respondents during the 7 days
preceding census night. Information on type of activity was collected on persons 5 years and
older. A person was regarded as economically active if he/she:
a. Worked for pay or profit or family gain for at least 1 hour within the 7 days preceding
Census Night. This included persons who were in paid employment or self-
employment or contributing family workers.
b. Did not work, but had jobs to return to.
c. Were unemployed.
The economically not active were persons who did not work and were not seeking for work.
They were classified by reasons for not being economically active. Economically not active
persons included homemakers, students, retired persons, the disabled and persons who were
unable to work due to their age or ill-health.
Occupation
This referred to the type of work the person was engaged in at the establishment where he/she
worked. This was asked only of persons 5 years and older who worked 7 days before the
census night, and those who did not work but had a job to return to as well as those
unemployed who had worked before. All persons who worked during the 7 days before the
13
census night were classified by the kind of work they were engaged in. The emphasis was on
the work the person did during the reference period and not what he/she was trained to do.
For those who did not work but had a job to return to, their occupation was the job they
would go back to after the period of absence. Also, for persons who had worked before and
were seeking for work and available for work, their occupation was on the last work they did
before becoming unemployed. If a person was engaged in more than one occupation, only the
main one was considered.
Industry
Industry referred to the type of product produced or service rendered at the respondent’s work
place. Information was collected only on the main product produced or service rendered in
the establishment during the reference period.
Employment status
Employment status refers to the status of a person in the establishment where he/she currently
works or previously worked. Eight employment status categories were provided: employee,
self-employed without employees, self-employed with employees, casual worker,
contributing family worker, apprentice, domestic employee (house help). Persons who could
not be classified under any of the above categories were classified as “other”.
Employment sector
This refers to the sector in which a person worked. The employment sectors covered in the
census were public, private formal, private informal, semi-public/parastatal, NGOs and
international organizations.
Disability
Persons with disability were defined as those who were unable to or were restricted in the
performance of specific tasks/activities due to loss of function of some part of the body as a
result of impairment or malformation. Information was collected on persons with visual/sight
impairment, hearing impairment, mental retardation, emotional or behavioural disorders and
other physical challenges.
Information Communication Technology (ICT)
Information Communication Technology ICT questions were asked for both individuals and
households. Persons having mobile phones refer to respondents 12 years and older who
owned mobile phones (irrespective of the number of mobile phones owned by each person).
Persons using internet facility refers to those who had access to internet facility at home,
internet cafe, on mobile phone or other mobile device. Internet access is assumed to be not
only via computer, but also by mobile phones, PDA, game machine and digital television.
Households having Personal Computers/Laptops refer to households who own
desktops/laptop computers. The fixed telephone line refers to a telephone line connecting a
customer’s terminal equipment (e.g. telephone set, facsimile machine) to the public switch
telephone network.
Fertility
Two types of fertility data were collected: lifetime fertility and current fertility. Lifetime
fertility refers to the total number of live births that females 12 years and older had ever had

14
during their life time. Current fertility refers to the number of live births that females 12-54
years old had in the 12 months preceding the Census Night.
Mortality
Mortality refers to all deaths that occurred in the household during the 12 months preceding
the Census Night. The report presents information on deaths due to accidents, violence,
homicide and suicide. In addition, data were collected on pregnancy-related deaths of
females 12-54 years.
Agriculture
The census sought information on household members who are engaged in agricultural
activities, including the cultivation of crops or tree planting, rearing of livestock or breeding
of fish for sale or family consumption. Information was also collected on their farms, types of
crops and number and type of livestock.
Housing conditions and facilities
The UN recommended definition of a house as “a structurally separate and independent place
of abode such that a person or group of persons can isolate themselves from the hazards of
climate such as storms and the sun’’ was adopted. The definition, therefore, covered any type
of shelter used as living quarters, such as separate houses, semi-detached houses,
flats/apartments, compound houses, huts, tents, kiosks and containers.
Living quarters or dwelling units refer to a specific area or space occupied by a particular
household and therefore need not necessarily be the same as the house of which the dwelling
unit may be a part.
Information collected on housing conditions included the type of dwelling unit, main
construction materials for walls, floor and roof, holding/tenure arrangement, ownership type,
type of lighting, source of water supply and toilet facilities. Data was also collected on
method of disposal of solid and liquid waste.
1.7 Organization of the Report
The report consists of nine chapters. Chapter one provides basic information about the
district. It gives a brief background of the district, describing its physical features, political
and administrative structure, social and cultural structure, economy and the methodology and
concepts used in the report. Chapter two discusses the population size, composition and age
structure. It further discusses the migratory pattern in the district as well as fertility and
mortality.
In chapter three, the focus is on household size, composition and headship as well as the
marital characteristics and nationality of the inhabitants of the district. The chapter also
discusses the religious affiliations and the educational statuses of the members of the district.
Chapter four focuses on economic characteristics such as economic activity status,
occupation, industries and the employment status and sectors that the people are employed.
Information Communication Technology (ICT) is discussed in chapter five. It analyses
mobile phone ownership, internet use and ownership of desktop/laptop computers while
chapter six is devoted to Persons living with disabilities (PWDs) and their socio-demographic
characteristics. Chapter seven concentrates on the agricultural activities of the households,
describing the types of farming activities, livestock rearing and numbers of livestock reared.

15
In chapter eight, housing conditions such as housing stock, type of dwelling and construction
materials, room occupancy, holding and tenancy, lighting and cooking facilities, bathing and
toilet facilities, waste disposal and source of water for drinking or for other domestic use in
the district are discussed and analyzed in detail. The final chapter, Chapter nine presents the
summary of findings and conclusions. It also discusses the policy implications of the findings
for the district.

16
CHAPTER TWO
DEMOGRAPHIC CHARACTERISTICS
2.1 Introduction
One of the most important characteristics of a population is its age and sex structure. Age
and sex influence many demographic trends. An understanding of the age and sex structure of
a population provides insights into changing population composition and highlights social
and economic challenges. All levels of government need information on age and sex
composition of the population in planning, development and provision of services. This
chapter discusses the population size and distribution, age and sex structure as well as
fertility, mortality and migration.
2.2 Population Size and Distribution
The population size and distribution of the Cape Coast Metropolis is presented in Table 2.1
which indicates that the Metropolis has a total population of 169,894 consisting of 82,810
males (48.7%) and 87,084 females (51.3%). The Metropolis is predominantly urban with
three-quarters (130,348) of the population residing in urban areas compared to 39,546
(23.3%) in rural settlements.
Table 2.1: Population by age, sex and locality of residence
Age-group
Sex
Sex
ratio
Type of locality
Both
Sexes
Male
Female Urban
Rural
Male Percent Female Percent Number Percent Number Percent
All Ages 169,894 82,810 48.7
87,084 51.3 95.1 130,348 76.7
39,546 23.3
0 - 4 17,539 8,859 50.5
8,680 49.5 102.1 12,772 72.8
4,767 27.2
9-May 14,864 7,478 50.3
7,386 49.7 101.2 11,031 74.2
3,833 25.8
14-Oct 15,837 7,535 47.6
8,302 52.4 90.8 11,969 75.6
3,868 24.4
15 - 19 22,291 9,450 42.4
12,841 57.6 73.6 18,447 82.8
3,844 17.2
20 - 24 29,566 16,356 55.3
13,210 44.7 123.8 22,727 76.9
6,839 23.1
25 - 29 16,305 8,475 52
7,830 48 108.2 12,111 74.3
4,194 25.7
30 - 34 11,338 5,654 49.9
5,684 50.1 99.5 8,345 73.6
2,993 26.4
35 - 39 8,815 4,212 47.8
4,603 52.2 91.5 6,614 75
2,201 25
40 - 44 7,326 3,409 46.5
3,917 53.5 87 5,648 77.1
1,678 22.9
45 - 49 5,895 2,672 45.3
3,223 54.7 82.9 4,607 78.2
1,288 21.8
50 - 54 5,403 2,379 44
3,024 56 78.7 4,267 79
1,136 21
55 - 59 3,834 1,826 47.6
2,008 52.4 90.9 3,069 80
765 20
60 - 64 3,182 1,440 45.3
1,742 54.7 82.7 2,468 77.6
714 22.4
65 - 69 2,090 911 43.6
1,179 56.4 77.3 1,665 79.7
425 20.3
70 - 74 2,111 891 42.2
1,220 57.8 73 1,733 82.1
378 17.9
75 - 79 1,381 576 41.7
805 58.3 71.6 1,150 83.3
231 16.7
80 - 84 1,066 381 35.7
685 64.3 55.6 867 81.3
199 18.7
85+ 1051 306 29.1
745 70.9 41.1 858 81.6
193 18.4
All Ages 169,894 82,810
87,084
95.1 130,348
39,546
0-14 48,240 23,872
24,368
98 35,772
12,468
15-64 113,955 55,873
58,082
96.2 88,303
25,652
65+ 7,699 3,065
4,634
66.1 6,273
1,426
Age-
dependency
ratio 49.1 48.2 49.9 47.6 54.2
Source: Ghana Statistical Service, 2010 Population and Housing Census

17
2.3 Age and sex structure, sex and dependency ratios
The age structure and the sex composition of the population of the Metropolis follow the
region and the national pattern. The age structure is that of a broad base and reduces
gradually in the subsequent age groups until the population becomes relatively small in the
older ages.
2.3.1 Age specific sex ratios
The Cape Coast Metropolis, as is the case with many other districts in the region, is
dominated by the female population, with 95 males to 100 females. The age specific sex
ratio ranges from about 41 males for every 100 females in the older ages of 85 years and
beyond to 124 males for every 100 females in the age group 20-24. While there are slightly
more males than females for the population below 10 years, nearly 26 percent more females
than males are observed in the age group 15-19 year (73.6), which coincides with secondary
school age in the population. Subsequently, the proportion of males greatly exceed that of
females in the age group 20- 29 years; yielding sex ratios of 123.8 for those aged 20-24 and
108.2 among those aged between 25 and 29 years. This may be reflective of the fact that
there are more males than females enrolled in our tertiary institutions, since persons in this
age group are more likely to be in such institutions. This assertion is further supported by the
fact that the subsequent age groups are female dominated.
2.3.2 Dependency ratio
The age-dependency ratio is a theoretical concept which does not apply strictly in real
population and differs from economic dependency ratio. For example although ages 15-64
are not "dependent" a large proportion of youth 15-19 are "dependent" in practice, that is
being at school or not supporting anyone. Similarly, not all persons aged 65 years and over
are dependent. The age-dependency ratio is often used as an indicator of the economic burden
that the productive portion of a population must bear. Countries with very high birth rates
coupled with low death rates usually have the highest age-dependency ratios because of the
large proportion of children in the population.
Table 2.1 indicates that there are differentials in the dependency ratio for males and females
and locality of residence. The total dependency ratio for the Metropolis is 49.1, which means
that two persons in the working age group have one person in the dependent ages to support.
Although the ratio is slightly higher in the rural areas (54.2) than it is in the urban areas (47.6)
of the Metropolis, the economic burden is lower compared to the other districts of the region.
2.3.3 Population pyramid
The age and sex structure of the metropolis is shown in the population pyramid (Figure 2.1).
The pyramid has a relatively large base, bulges out in the middle, and then tapers off towards
the older ages. The Figure provides insightful lessons regarding current and future fertility
and migration patterns to enhance policy formulation and infrastructure planning. The
pyramid generally shows the expected pattern of declines in the length of the bars for each
group with advancing age, except for the population between 10 and 24 years.
The Cape Coast Municipality has long been a center for education, drawing students from all
over the country to the many second cycle and tertiary institutions, including the Cape Coast
Polytechnic and the University of Cape Coast. The effect of this on the age and sex structure
is reflected in the relative concentration of the population of both sexes in some age groups,
creating a bulge in the age-groups 15-24 years for both sexes. Except for the bulge in that age

18
group, the pyramid would have a barreled shape for the population below 30 years. This
could be accounted for by urbanization and fertility decline among others factors, whiles
migration would be a plausible reason for the bulge.
Figure 2.1: Population pyramid
20,000 15,000 10,000 5,000 0 5,000 10,000 15,000
0-4
5-9
10-14
15-19
20-24
25-29
30-34
35-39
40-44
45-49
50-54
55-59
60-64
65-69
70-74
75-79
80-84
85+
Population
Age
FemaleMale
Source: Ghana Statistical Service, 2010 Population and Housing Census
2.4 Fertility, Mortality and Migration
Fertility, mortality and migration are important in influencing population dynamics and
development. Fertility and mortality are used to determine the natural increase or decrease of
the population.
The 2010 population and housing census collected data on fertility which is the natural
capability of producing off-springs. Mortality refers to all deaths that occurred in the
household during the 12 months preceding the Census Night, whiles migration refers to the
physical movement of persons across geographical boundaries for a given period. This is
measured by combining data on the place of birth with place of enumeration and duration of
stay at place of enumeration.
2.4.1 Fertility
Fertility refers to the actual birth performance or childbearing among a population. The general
fertility rate (GFR) is the number of births in a given year divided by the mid-year population of
women in the age group 15-49. The total fertility rate (TFR) which is widely used is the average
number of live births per 1,000 women in the childbearing age (15-49 years). In other words, it is
the average number of children a woman would give birth to by the end of her reproductive years
if current fertility rates prevailed (IUSSP, 1982). The crude birth rate indicates the number of life
births occurring during a year, per 1000 population.

19
Table 2.2 shows that the CDR of 17.9 per 1,000 for the Cape Coast Metropolis is the least in
the Central Region. It means that 18 births occur for every 1000 population in the Metropolis
per year compared to 27 in the region. The GFR which is more refined than the CBR also
shows that fertility is relatively lower in Cape Coast as 59 births per 1,000 women aged 15-
49 years is recorded annum compared to an average of 107 in the region. The more refined of
the three indicators and the widely used, TFR, is 2.21 compared to 3.6 for the region. It
implies that on the average every woman in the reproductive age has just about two children
in the Metropolis compared to between three and four per woman in the region generally.
This level of fertility has to be sustained as it has several advantages including low levels of
childhood and maternal mortality as well as economic benefits.
Table 2.2: Reported total fertility rate, general fertility rate and crude birth rate
by district
District Population
Number of
women
15-49 years
Number
of births
in last 12
months
Total
Fertility
Rate
General
Fertility
Rate
Crude
Birth
Rate
All Districts 2,201,863 553,384 59,001 3.6 106.6 26.8
Komenda-Edina-Egyafo-
Abirem 144,705 33,902 3,604 3.6 106.3 24.9
Cape Coast Metropolis 169,894 51,308 3,038 2.21 59.2 17.9
Abura-Asebu-Kwamankese 117,185 27,603 3,353 4.15 121.5 28.6
Mfantsiman Municipal 196,563 51,056 4,888 3.51 95.7 24.9
Ajumako-Enyan-Essiam 138,046 31,419 3,629 4.01 115.5 26.3
Gomoa West 135,189 32,740 3,689 3.82 112.7 27.3
Effutu Municipal 68,597 19,261 1,644 2.85 85.4 24.0
Gomoa East 207,071 54,787 6,262 3.71 114.3 30.2
Ewutu Senya 195,306 52,519 5,301 3.34 100.9 27.1
Agona East 85,920 20,368 2,434 3.97 119.5 28.3
Agona West Municipal 115,358 29,580 2,703 3.09 91.4 23.4
Asikuma-Odoben Brakwa 112,706 25,731 3,518 4.68 136.7 31.2
Assin South 104,244 23,709 3,002 4.31 126.6 28.8
Assin North Municipal 161,341 38,331 4,789 4.14 124.9 29.7
Twifo-Heman-Lower Denkyira 116,874 28,591 3,262 3.85 114.1 27.9
Upper Denkyira East
Municipal 72,810 18,690 1,986 3.53 106.3 27.3
Upper Denkyira West 60,054 13,789 1,899 4.52 137.7 31.6
Source: Ghana Statistical Service, 2010 Population and Housing Census
Children ever born and children surviving
The 2010 PHC collected information on lifetime fertility of all women 12 years and older. In
all, 122,652 children are recorded to have been born to 67,811 women 12 years and older in
the Cape Coast Metropolis. Table 2.3 shows that the number of children ever born increases
with increasing age of women and peaks among those aged 40-44. Children surviving include
all children (male and female) born alive by female 12 years and older who are still alive.
Less than one percent (0.7%) of children ever born in the Metropolis are born to teenage
mothers aged 12-19 years.

20
Table 2.3: Children ever born and children surviving by age of woman
and sex of child
Age
Number
of women
Children ever born Children surviving
Total Male Female Total Male Female
All ages 67,811 122,652 61,361 61,291 104,749 51,579 53,170
12-14 5,095 32 17 15
20 11 9
15-19 12,841 823 386 437
739 341 398
20-24 13,210 4,129 2,078 2,051
3,641 1,769 1,872
25-29 7,830 8,433 4,233 4,200
7,622 3,728 3,894
30-34 5,684 12,180 6,180 6,000
11,004 5,489 5,515
35-39 4,603 13,861 7,028 6,833
12,603 6,347 6,256
40-44 3,917 14,158 7,059 7,099
12,739 6,307 6,432
45-49 3,223 12,387 6,268 6,119
10,874 5,432 5,442
50-54 3,024 13,194 6,542 6,652
11,319 5,532 5,787
55-59 2,008 9,036 4,398 4,638
7,645 3,693 3,952
60-64 1,742 8,600 4,365 4,235
7,031 3,537 3,494
65+ 4,634 25,819 12,807 13,012 19,512 9,393 10,119 Source: Ghana Statistical Service, 2010 Population and Housing Census
2.4.2 Mortality
Mortality, as one of the three components of population change, plays an important role in
determining the growth of a population. Mortality is the occurrence of death in a population.
The level and pattern of mortality is a reflection of the health status of a population. From
Table 2.4, a total of 881 deaths were recorded in the 12 months preceding the Census Night,
yielding a crude death rate of about five deaths (5.19) in every 1,000 population. This shows
that the mortality experience in the metropolis is relatively lower than the average of the
region (7.58).
Table 2.4: Deaths in the households and crude death rate by district
District
Total
population
Deaths in
Households
Crude death
rate (per 1000)
All Districts 2,201,863 16,694 7.58
Komenda-Edina-Egyafo-Abirem 144,705 1,321 9.13
Cape Coast 169,894 881 5.19
Abura-Asebu-Kwamankese 117,185 974 8.31
Mfantsiman 196,563 1,553 7.9
Ajumako-Enyan-Essiam 138,046 1,828 13.24
Gomoa West 135,189 1,341 9.92
Effutu 68,597 502 7.32
Gomoa East 207,071 1,121 5.41
Ewutu Senya 195,306 919 4.71
Agona East 85,920 668 7.77
Agona West 115,358 889 7.71
Asikuma-Odoben Brakwa 112,706 1,114 9.88
Assin South 104,244 753 7.22
Assin North 161,341 1,080 6.69
Twifo-Heman-Lower Denkyira 116,874 794 6.79
Upper Denkyira East 72,810 542 7.44
Upper Denkyira West 60,054 414 6.89 Source: Ghana Statistical Service, 2010 Population and Housing Census
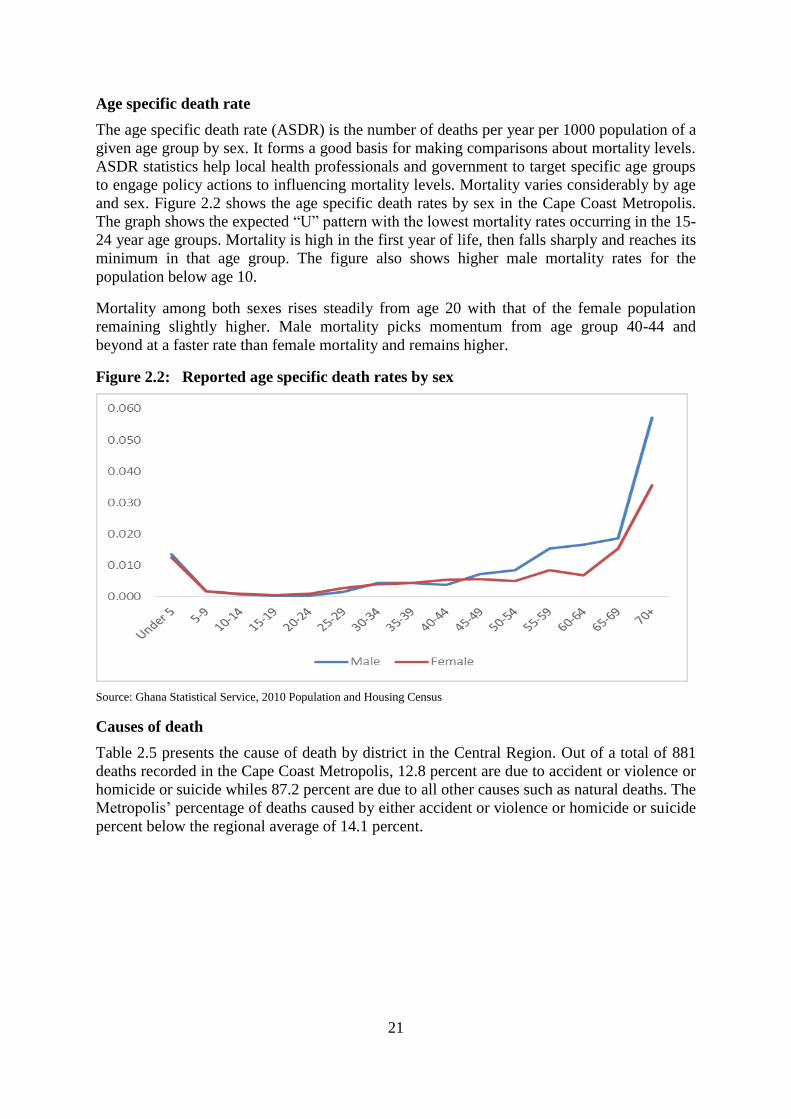
21
Age specific death rate
The age specific death rate (ASDR) is the number of deaths per year per 1000 population of a
given age group by sex. It forms a good basis for making comparisons about mortality levels.
ASDR statistics help local health professionals and government to target specific age groups
to engage policy actions to influencing mortality levels. Mortality varies considerably by age
and sex. Figure 2.2 shows the age specific death rates by sex in the Cape Coast Metropolis.
The graph shows the expected “U” pattern with the lowest mortality rates occurring in the 15-
24 year age groups. Mortality is high in the first year of life, then falls sharply and reaches its
minimum in that age group. The figure also shows higher male mortality rates for the
population below age 10.
Mortality among both sexes rises steadily from age 20 with that of the female population
remaining slightly higher. Male mortality picks momentum from age group 40-44 and
beyond at a faster rate than female mortality and remains higher.
Figure 2.2: Reported age specific death rates by sex
Source: Ghana Statistical Service, 2010 Population and Housing Census
Causes of death
Table 2.5 presents the cause of death by district in the Central Region. Out of a total of 881
deaths recorded in the Cape Coast Metropolis, 12.8 percent are due to accident or violence or
homicide or suicide whiles 87.2 percent are due to all other causes such as natural deaths. The
Metropolis’ percentage of deaths caused by either accident or violence or homicide or suicide
percent below the regional average of 14.1 percent.

22
Table 2.5: Causes of death by district
District
Total
household
deaths
Death due to
Accident / violence /
homicide /suicide All other causes
Number Percent
Number Percent
All Districts 16,694 2,350 14.1 14,344 85.9
Komenda-Edina-Egyafo-Abirem
Municipal 1,321 149 11.3
1,172 88.7
Cape Coast Metropolis 881 113 12.8
768 87.2
Cape Coast South 608 93 15.3
515 84.7
Cape Coast North 273 20 7.3
253 92.7
Abura-Asebu-Kwamankese 974 117 12.0
857 88.0
Mfantsiman 994 128 12.9
866 87.1
Ajumako-Enyan-Essiam 1,828 562 30.7
1,266 69.3
Gomoa West 1,341 179 13.3
1,162 86.7
Effutu Municipal 502 59 11.8
443 88.2
Gomoa East 1,121 114 10.2
1,007 89.8
Ewutu Senya 655 97 14.8
558 85.2
Agona East 668 59 8.8
609 91.2
Agona West Municipal 889 70 7.9
819 92.1
Asikuma-Odoben Brakwa 1,114 123 11.0
991 89.0
Assin South 753 90 12.0
663 88.0
Assin North Municipal 1,080 150 13.9
930 86.1
Twifo Ati Morkwa 339 51 15.0
288 85.0
Upper Denkyira East Municipal 542 54 10.0
488 90.0
Upper Denkyira West 414 90 21.7
324 78.3
Twifo Heman Lower Denkyira 455 54 11.9
401 88.1
Ekumfi 559 36 6.4
523 93.6
Awutu Senya East Municipal 264 55 20.8 209 79.2 Source: Ghana Statistical Service, 2010 Population and Housing Census
2.4.3 Migration
Internal migration has played an important role in spatial redistribution of the population of
Ghana. Migration is defined as a geographical movement involving a change from a usual
place of residence over a defined territory in a defined period (GSS, 2012). A migrant is a
person whose current place of residence is different from his or her place of birth or previous
place of residence. There are two types of migration, namely internal and external. Internal
migration is the movement of people between geographical boundaries within national
borders whiles external migration is the movement of people across geographical boundaries
outside national borders.
Table 2.6 also presents data on the place of birthplace by duration of residence of migrants in
the Cape Coast Metropolis. The data indicates that 72,162 persons representing 42.5 percent
of the total population are migrants. Whiles one-third (23,808) of the migrants were born in
other parts of the region, four percent (3,120) were born outside the country with remaining
63 percent born in other regions of Ghana. The data also shows that whiles 15.6 percent
(11,241) of the migrants come from Greater Accra Region and 11.5 percent (8,305) from
Western, only one percent (800) come from the Upper West Region.
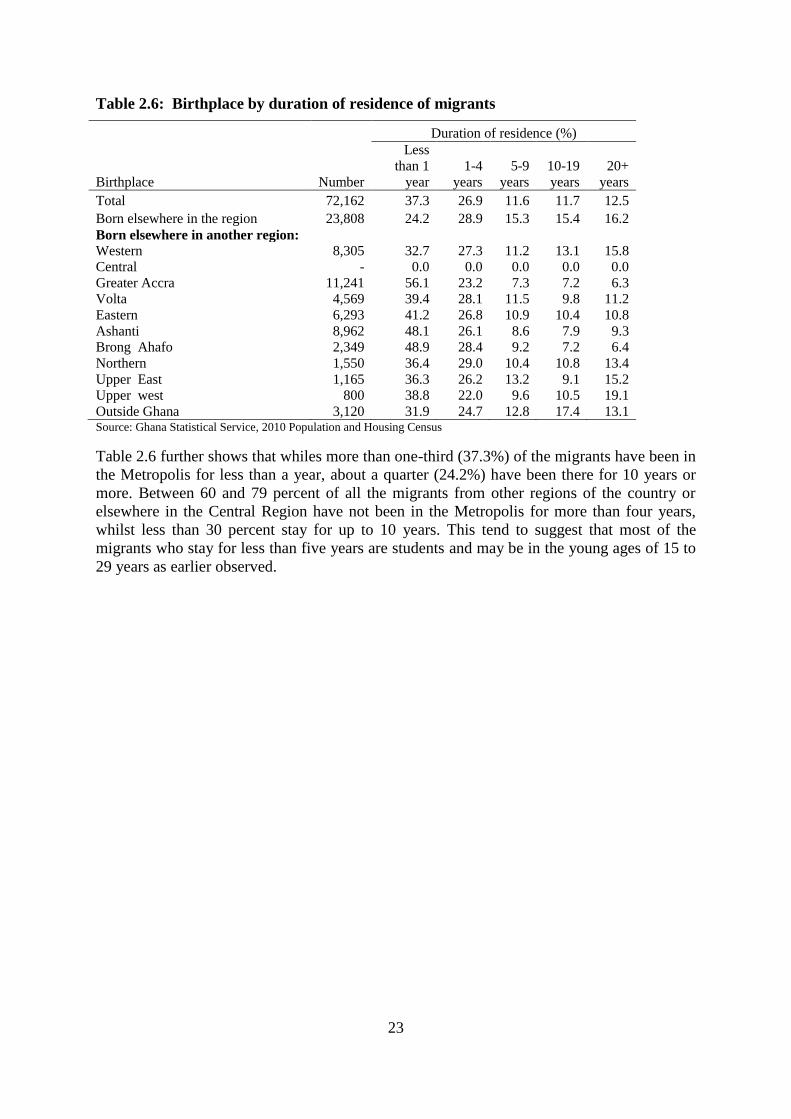
23
Table 2.6: Birthplace by duration of residence of migrants
Birthplace Number
Duration of residence (%)
Less
than 1
year
1-4
years
5-9
years
10-19
years
20+
years
Total 72,162 37.3 26.9 11.6 11.7 12.5
Born elsewhere in the region 23,808 24.2 28.9 15.3 15.4 16.2
Born elsewhere in another region:
Western 8,305 32.7 27.3 11.2 13.1 15.8
Central - 0.0 0.0 0.0 0.0 0.0
Greater Accra 11,241 56.1 23.2 7.3 7.2 6.3
Volta 4,569 39.4 28.1 11.5 9.8 11.2
Eastern 6,293 41.2 26.8 10.9 10.4 10.8
Ashanti 8,962 48.1 26.1 8.6 7.9 9.3
Brong Ahafo 2,349 48.9 28.4 9.2 7.2 6.4
Northern 1,550 36.4 29.0 10.4 10.8 13.4
Upper East 1,165 36.3 26.2 13.2 9.1 15.2
Upper west 800 38.8 22.0 9.6 10.5 19.1
Outside Ghana 3,120 31.9 24.7 12.8 17.4 13.1 Source: Ghana Statistical Service, 2010 Population and Housing Census
Table 2.6 further shows that whiles more than one-third (37.3%) of the migrants have been in
the Metropolis for less than a year, about a quarter (24.2%) have been there for 10 years or
more. Between 60 and 79 percent of all the migrants from other regions of the country or
elsewhere in the Central Region have not been in the Metropolis for more than four years,
whilst less than 30 percent stay for up to 10 years. This tend to suggest that most of the
migrants who stay for less than five years are students and may be in the young ages of 15 to
29 years as earlier observed.

24
CHAPTER THREE
SOCIAL CHARACTERISTICS
3.1 Introduction
Data on household size, composition and structure forms the basis of family relations and
social cohesion. The 2010 population and housing census collected data on these social
characteristics of the population. This chapter discusses these characteristics which include
household size and composition, marital status, nationality, religious affiliation, literacy and
education for the Cape Coast Metropolis.
3.2 Household size, household composition and structure
A household is defined as “a person or a group of persons, who live together in the same
house or compound, share the same house-keeping arrangements and recognize one person as
the head of household”. A household may include a man, his wife, children, other relatives,
and non-relatives living with them. Visitors who spent the census night with the household
were also enumerated (GSS, 2012).
3.2.1 Household size
The household is the basic unit for demographic and economic analyses. Household size
refers to the total number of persons in a household irrespective of age, sex, or relationship
status. Table 3.1 presents the household size of the Metropolis by locality of residence. There
are 40,386 households in the metropolis of which three-quarters (30,354) reside in urban
areas with the rest in rural settlements. One out every 13 households (7.7%) in the Central
Region are found in the Cape Coast Metropolis. With an average household size of 3.5
compared with four persons (4.0) per household in the region, there are more households
living in each house in Cape Coast (2.3) than in the region (1.5) on average. Whiles between
two or three households (2.6) are found in urban areas of the Metropolis, there are one or two
households per house in the rural areas.
Table 3.1: Household size by locality of residence
Categories Region
Cape Coast Metropolis
Total Urban Rural
Total household population 2,113,766 140,405 105,414 34,991
Number of households 526,763 40,386 30,354 10,032
Average households per house 1.5 2.3 2.6 1.7
Average household size 4 3.5 3.5 3.5 Source: Ghana Statistical Service, 2010 Population and Housing Census
3.2.2 Household composition
Table 3.2 presents the composition of the household population in the Cape Coast
Metropolis. Out of 169,894 persons in the Metropolis, 82.6 percent (140,405) of them live in
households whiles the rest constitute non household population. The data shows that 28.8
percent household members are heads of the household; 37.1 percent are children, 9.8 percent
are spouses whiles 8.7 percent are grandchildren of the household head. Non-relatives and
other relatives to the household head constitute 3.1 percent and 7.4 percent respectively. The
data also indicate that whiles more than a third (36.1%) of households are headed by males

25
and slightly over one-fifth (22.0%) are headed by females. More female parents or parents-in-
law (1.3%) live in the households than male parents or parents-in-law (0.2%). Contrarily,
male grandchildren in the households are more than female grandchildren.
Table 3.2: Household population by composition and sex
Household composition
Total Male Female
Number Percent Number Percent Number Percent
Total 140,405 100.0 66,996 100.0 73,409 100.0
Head 40,386 28.8 24,209 36.1 16,177 22.0
Spouse (wife/husband) 13,700 9.8 1,107 1.7 12,593 17.2
Child (son/daughter) 52,025 37.1 25,622 38.2 26,403 36.0
Parent/parent in-law 1,124 0.8 155 0.2 969 1.3
Son/daughter in-law 314 0.2 94 0.1 220 0.3
Grandchild 12,218 8.7 6,089 9.1 6,129 8.4
Brother/sister 4,086 2.9 2,023 3.0 2,063 2.8
Step child 1,319 0.9 634 1.0 685 0.9
Adopted/foster child 502 0.4 189 0.3 313 0.4
Other relative 10,325 7.4 4,675 7.0 5,650 7.7
Non-relative 4,406 3.1 2,199 3.3 2,207 3.0
Source: Ghana Statistical Service, 2010 Population and Housing Census
3.2.3 Household structure
Household structure presented in this section is defined as the classification of persons in the
households and the type of relationship among household members who were present on
census night. These social classifications determine whether one falls in a nuclear or
extended family. Table 3.2 shows that the extended family system is revered and widely
practiced in the Metropolis with more than half (52.3%) of all household members
constituting different compositions of this system, whiles 47.7 percent constitute nuclear
families. Twice as many male (10.9%) single person “one man” households are found in the
Metropolis than female (4.9%) single person households. The data further reveals that one-
quarter (24.8%) of the household population live in nuclear families of father, mother and
children, whiles about one in eight (12.9%) are in single parent nuclear families (parent and
children only). A small proportion of couples live without any children in their household
(2.2%) among the nuclear families.

26
Table 3.3: Household population by structure and sex
Household structure
Total Male Female
Number Percent Number Percent Number Percent
Total 140,405 100.0 66,996 100.0 73,409 100.0
Nuclear Family 66,941 47.7 33,930 50.7 33,011 45.0
Head only 10,906 7.8 7,323 10.9 3,583 4.9
Head and a spouse only 3,098 2.2 1,559 2.3 1,539 2.1
Nuclear (Head, spouse(s) and
children) 34,768 24.8 17,654 26.4 17,114 23.3
Single parent nuclear 18,169 12.9 7,394 11.0 10,775 14.7
Extended Family 73,464 52.3 33,066 49.3 40,398 55.0
Extended (Head, spouse(s), children
and Head's relatives) 20,094 14.3 9,710 14.5 10,384 14.2
Extended + non relatives 2,797 2.0 1,310 2.0 1,487 2.0
Head, spouse(s) and other
composition 6,609 4.7 3,140 4.7 3,469 4.7
Single parent extended 24,118 17.2 9,217 13.8 14,901 20.3
Single parent extended + non relative 2,508 1.8 982 1.5 1,526 2.1
Head and other composition but no
spouse 17,338 12.4 8,707 13.0 8,631 11.8 Source: Ghana Statistical Service, 2010 Population and Housing Census
Table 3.3 further shows that majority of the extended family households are single parent
residing with other relatives (17.2%), with more females (20.3%) in this family structure than
males (13.8%). An important revelation from the data is the fact that almost one third
(31.9%) of all household members in the Metropolis reside in a single parent household,
irrespective of whether it is nuclear or extended, with more females (37.1%) than males
26.3%).
3.3 Marital Status
Marriage may be defined as a social institution which establishes the legitimacy of children,
(Gough, 1959). Marriage defined this way, thus, serves as a tool for procreation, mutual
support and companionship. Marriage in Ghana includes both formal and informal unions.
Formal unions are those sanctioned by law under the ordinance, by tradition/customary law,
and by religion. Informal unions are cohabiting unions recognized in Ghana but not
sanctioned by law, tradition or religion (Aryee, 1975; Gaisie, 1976).
Figure 3.1 and Appendix A2 show that 55.5 percent of persons 12 years and older in Cape
Coast Metropolis are never married compared to the regional average of 42 percent. The
married population is 29.8 percent compared to the regional average of 42.9 percent. The
population in consensual union or living together as if married is 4.9 percent. The divorced
and the widowed constitute 3.9 percent and 4.2 percent of the population, respectively.
The appendix Table 5 reveals a general pattern that the number of married persons increases
with increasing age and picks at age 40-49 before it starts to decline. Conversely, the
proportion widowed, separated or divorced increase faster from that age group most especially
among the female population. Nearly eight percent (7.7%) of the population below 20 years of
age are married with slightly more male (8.2%) than females (7.3%). A significant proportion
of the population (19.0%) remains unmarried after age 50 with more males (21.7%) than
females (17.2%).
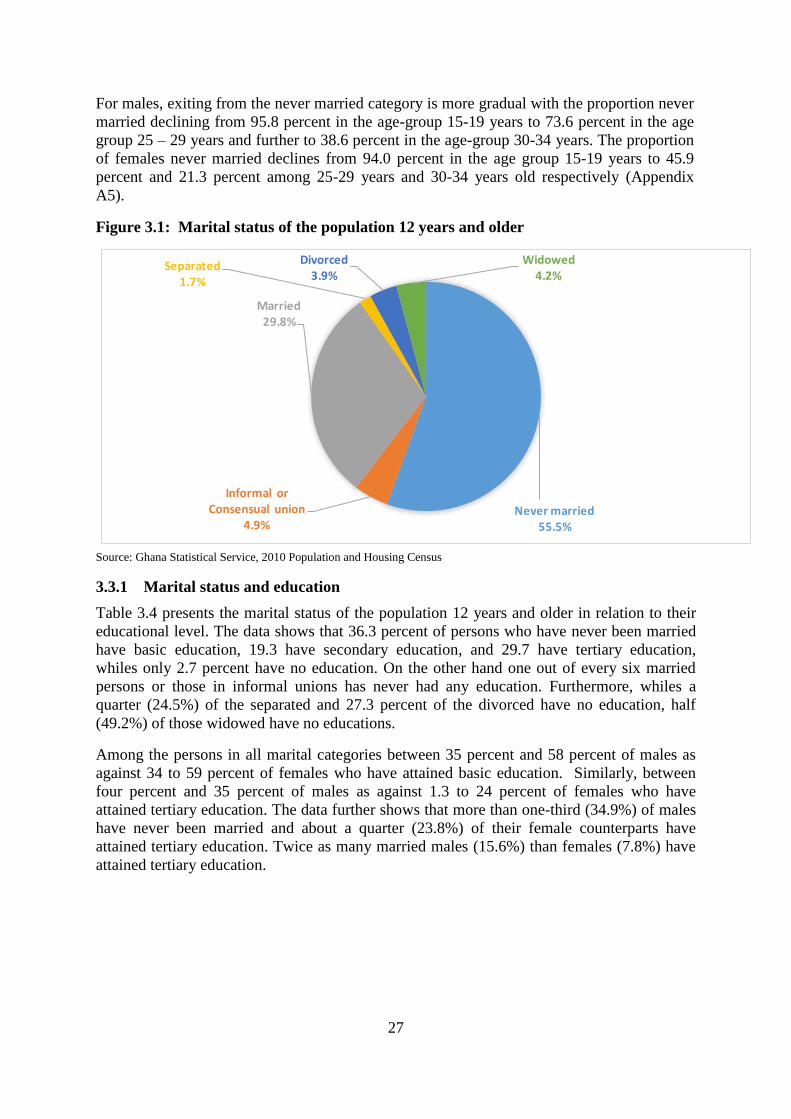
27
For males, exiting from the never married category is more gradual with the proportion never
married declining from 95.8 percent in the age-group 15-19 years to 73.6 percent in the age
group 25 – 29 years and further to 38.6 percent in the age-group 30-34 years. The proportion
of females never married declines from 94.0 percent in the age group 15-19 years to 45.9
percent and 21.3 percent among 25-29 years and 30-34 years old respectively (Appendix
A5).
Figure 3.1: Marital status of the population 12 years and older
Never married55.5%
Informal or Consensual union
4.9%
Married29.8%
Separated1.7%
Divorced3.9%
Widowed4.2%
Source: Ghana Statistical Service, 2010 Population and Housing Census
3.3.1 Marital status and education
Table 3.4 presents the marital status of the population 12 years and older in relation to their
educational level. The data shows that 36.3 percent of persons who have never been married
have basic education, 19.3 have secondary education, and 29.7 have tertiary education,
whiles only 2.7 percent have no education. On the other hand one out of every six married
persons or those in informal unions has never had any education. Furthermore, whiles a
quarter (24.5%) of the separated and 27.3 percent of the divorced have no education, half
(49.2%) of those widowed have no educations.
Among the persons in all marital categories between 35 percent and 58 percent of males as
against 34 to 59 percent of females who have attained basic education. Similarly, between
four percent and 35 percent of males as against 1.3 to 24 percent of females who have
attained tertiary education. The data further shows that more than one-third (34.9%) of males
have never been married and about a quarter (23.8%) of their female counterparts have
attained tertiary education. Twice as many married males (15.6%) than females (7.8%) have
attained tertiary education.
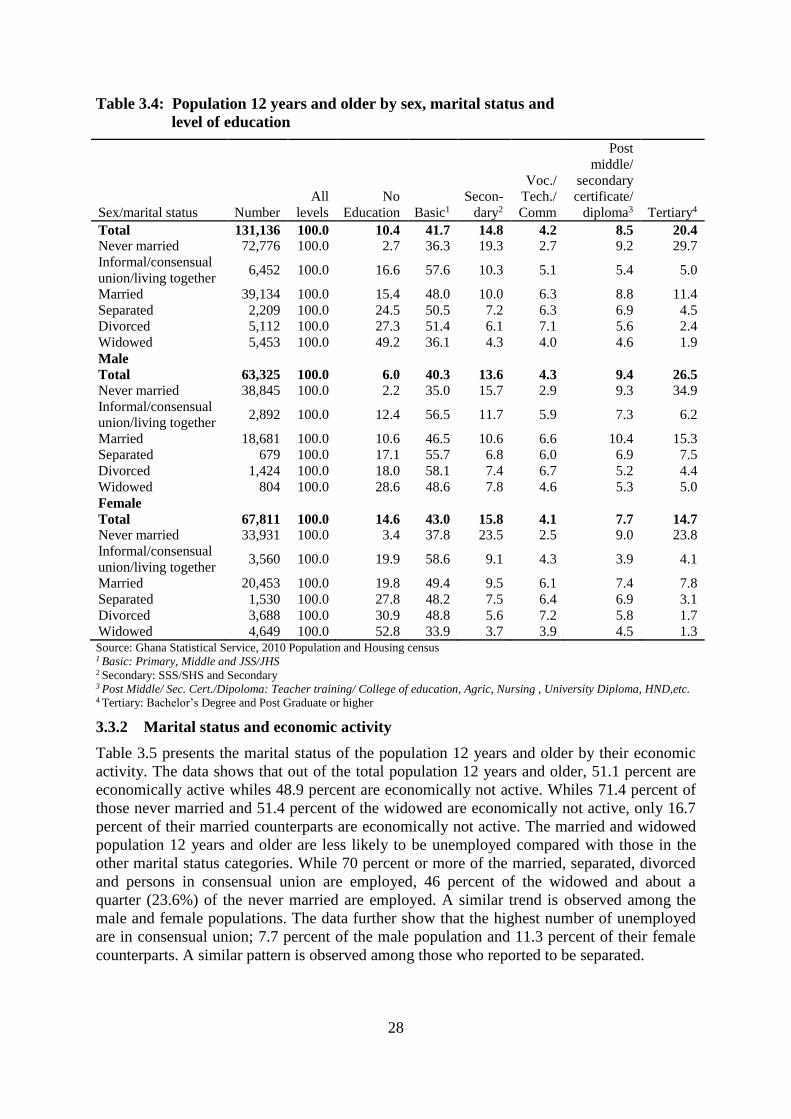
28
Table 3.4: Population 12 years and older by sex, marital status and
level of education
Sex/marital status Number
All
levels
No
Education Basic1
Secon-
dary2
Voc./
Tech./
Comm
Post
middle/
secondary
certificate/
diploma3 Tertiary4
Total 131,136 100.0 10.4 41.7 14.8 4.2 8.5 20.4 Never married 72,776 100.0 2.7 36.3 19.3 2.7 9.2 29.7
Informal/consensual
union/living together 6,452 100.0 16.6 57.6 10.3 5.1 5.4 5.0
Married 39,134 100.0 15.4 48.0 10.0 6.3 8.8 11.4
Separated 2,209 100.0 24.5 50.5 7.2 6.3 6.9 4.5
Divorced 5,112 100.0 27.3 51.4 6.1 7.1 5.6 2.4
Widowed 5,453 100.0 49.2 36.1 4.3 4.0 4.6 1.9
Male
Total 63,325 100.0 6.0 40.3 13.6 4.3 9.4 26.5
Never married 38,845 100.0 2.2 35.0 15.7 2.9 9.3 34.9
Informal/consensual
union/living together 2,892 100.0 12.4 56.5 11.7 5.9 7.3 6.2
Married 18,681 100.0 10.6 46.5 10.6 6.6 10.4 15.3
Separated 679 100.0 17.1 55.7 6.8 6.0 6.9 7.5
Divorced 1,424 100.0 18.0 58.1 7.4 6.7 5.2 4.4
Widowed 804 100.0 28.6 48.6 7.8 4.6 5.3 5.0
Female
Total 67,811 100.0 14.6 43.0 15.8 4.1 7.7 14.7 Never married 33,931 100.0 3.4 37.8 23.5 2.5 9.0 23.8
Informal/consensual
union/living together 3,560 100.0 19.9 58.6 9.1 4.3 3.9 4.1
Married 20,453 100.0 19.8 49.4 9.5 6.1 7.4 7.8
Separated 1,530 100.0 27.8 48.2 7.5 6.4 6.9 3.1
Divorced 3,688 100.0 30.9 48.8 5.6 7.2 5.8 1.7
Widowed 4,649 100.0 52.8 33.9 3.7 3.9 4.5 1.3 Source: Ghana Statistical Service, 2010 Population and Housing census 1 Basic: Primary, Middle and JSS/JHS 2 Secondary: SSS/SHS and Secondary 3 Post Middle/ Sec. Cert./Dipoloma: Teacher training/ College of education, Agric, Nursing , University Diploma, HND,etc. 4 Tertiary: Bachelor’s Degree and Post Graduate or higher
3.3.2 Marital status and economic activity
Table 3.5 presents the marital status of the population 12 years and older by their economic
activity. The data shows that out of the total population 12 years and older, 51.1 percent are
economically active whiles 48.9 percent are economically not active. Whiles 71.4 percent of
those never married and 51.4 percent of the widowed are economically not active, only 16.7
percent of their married counterparts are economically not active. The married and widowed
population 12 years and older are less likely to be unemployed compared with those in the
other marital status categories. While 70 percent or more of the married, separated, divorced
and persons in consensual union are employed, 46 percent of the widowed and about a
quarter (23.6%) of the never married are employed. A similar trend is observed among the
male and female populations. The data further show that the highest number of unemployed
are in consensual union; 7.7 percent of the male population and 11.3 percent of their female
counterparts. A similar pattern is observed among those who reported to be separated.
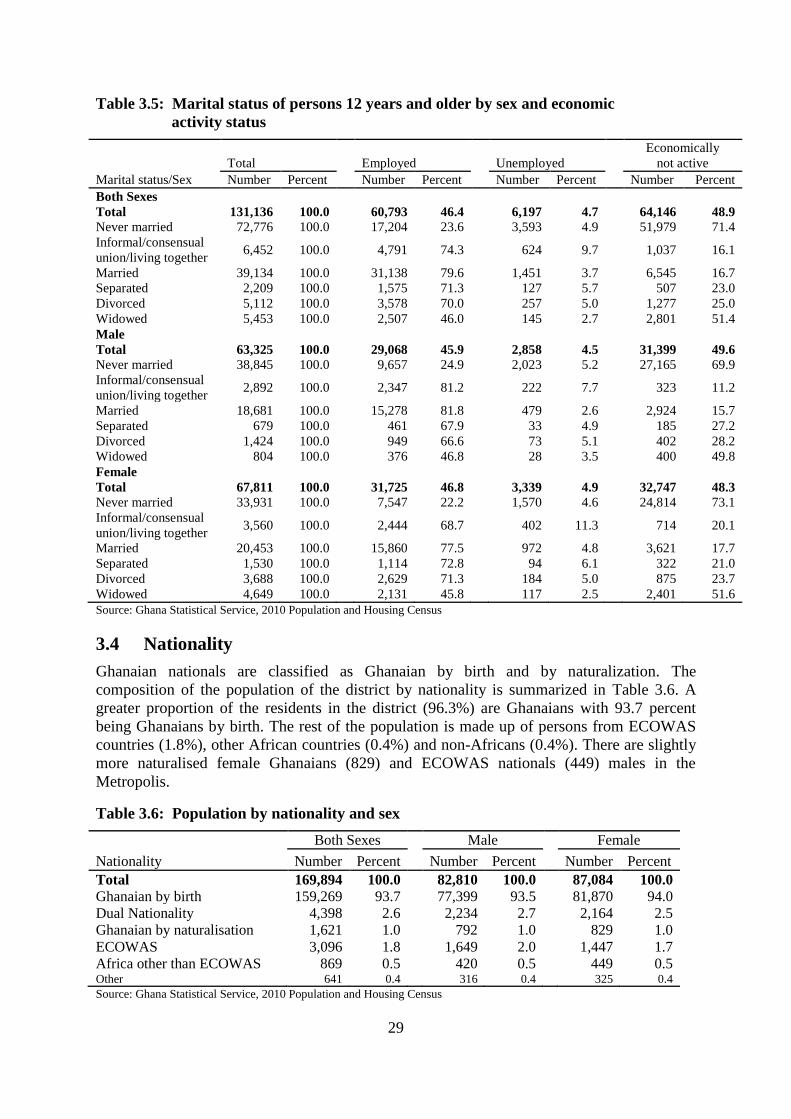
29
Table 3.5: Marital status of persons 12 years and older by sex and economic
activity status
Marital status/Sex
Total Employed Unemployed
Economically
not active
Number Percent Number Percent Number Percent Number Percent
Both Sexes
Total 131,136 100.0
60,793 46.4
6,197 4.7
64,146 48.9
Never married 72,776 100.0
17,204 23.6
3,593 4.9
51,979 71.4
Informal/consensual
union/living together 6,452 100.0
4,791 74.3
624 9.7
1,037 16.1
Married 39,134 100.0
31,138 79.6
1,451 3.7
6,545 16.7
Separated 2,209 100.0
1,575 71.3
127 5.7
507 23.0
Divorced 5,112 100.0
3,578 70.0
257 5.0
1,277 25.0
Widowed 5,453 100.0
2,507 46.0
145 2.7
2,801 51.4
Male
Total 63,325 100.0
29,068 45.9
2,858 4.5
31,399 49.6
Never married 38,845 100.0
9,657 24.9
2,023 5.2
27,165 69.9
Informal/consensual
union/living together 2,892 100.0
2,347 81.2
222 7.7
323 11.2
Married 18,681 100.0
15,278 81.8
479 2.6
2,924 15.7
Separated 679 100.0
461 67.9
33 4.9
185 27.2
Divorced 1,424 100.0
949 66.6
73 5.1
402 28.2
Widowed 804 100.0
376 46.8
28 3.5
400 49.8
Female
Total 67,811 100.0
31,725 46.8
3,339 4.9
32,747 48.3
Never married 33,931 100.0
7,547 22.2
1,570 4.6
24,814 73.1
Informal/consensual
union/living together 3,560 100.0
2,444 68.7
402 11.3
714 20.1
Married 20,453 100.0
15,860 77.5
972 4.8
3,621 17.7
Separated 1,530 100.0
1,114 72.8
94 6.1
322 21.0
Divorced 3,688 100.0
2,629 71.3
184 5.0
875 23.7
Widowed 4,649 100.0 2,131 45.8 117 2.5 2,401 51.6
Source: Ghana Statistical Service, 2010 Population and Housing Census
3.4 Nationality
Ghanaian nationals are classified as Ghanaian by birth and by naturalization. The
composition of the population of the district by nationality is summarized in Table 3.6. A
greater proportion of the residents in the district (96.3%) are Ghanaians with 93.7 percent
being Ghanaians by birth. The rest of the population is made up of persons from ECOWAS
countries (1.8%), other African countries (0.4%) and non-Africans (0.4%). There are slightly
more naturalised female Ghanaians (829) and ECOWAS nationals (449) males in the
Metropolis.
Table 3.6: Population by nationality and sex
Nationality
Both Sexes Male Female
Number Percent Number Percent Number Percent
Total 169,894 100.0 82,810 100.0 87,084 100.0
Ghanaian by birth 159,269 93.7 77,399 93.5 81,870 94.0
Dual Nationality 4,398 2.6 2,234 2.7 2,164 2.5
Ghanaian by naturalisation 1,621 1.0 792 1.0 829 1.0
ECOWAS 3,096 1.8 1,649 2.0 1,447 1.7
Africa other than ECOWAS 869 0.5 420 0.5 449 0.5 Other 641 0.4 316 0.4 325 0.4
Source: Ghana Statistical Service, 2010 Population and Housing Census
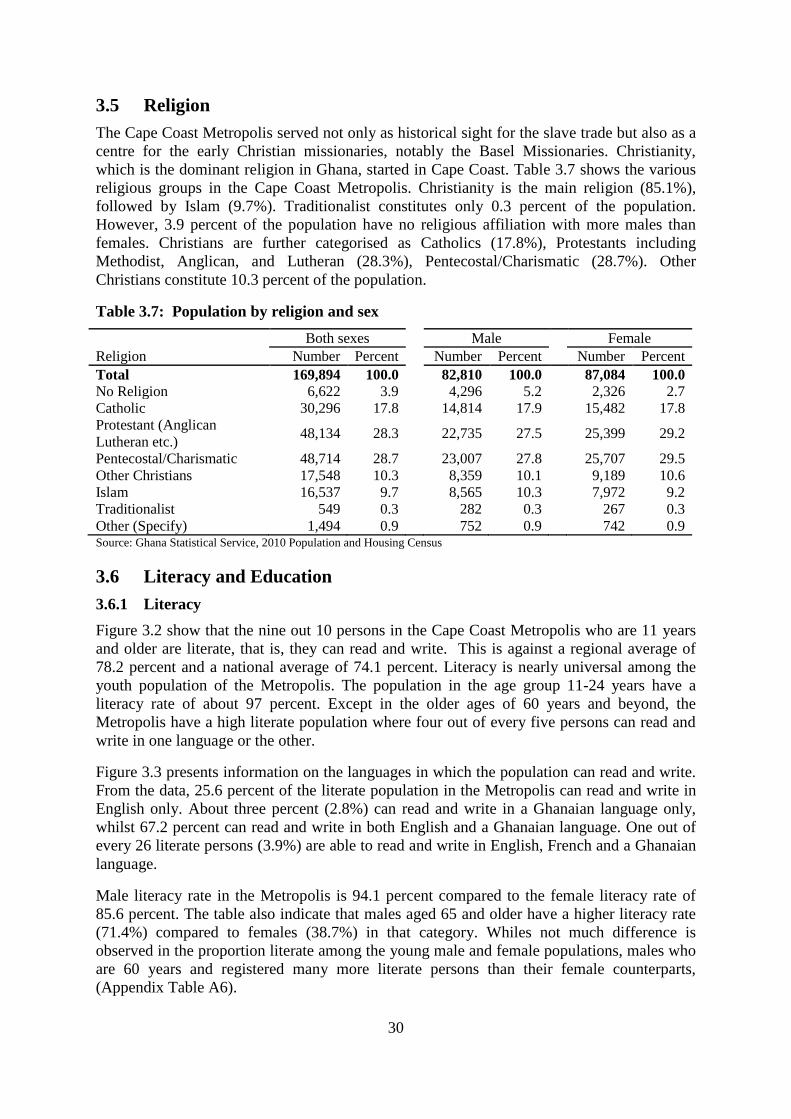
30
3.5 Religion
The Cape Coast Metropolis served not only as historical sight for the slave trade but also as a
centre for the early Christian missionaries, notably the Basel Missionaries. Christianity,
which is the dominant religion in Ghana, started in Cape Coast. Table 3.7 shows the various
religious groups in the Cape Coast Metropolis. Christianity is the main religion (85.1%),
followed by Islam (9.7%). Traditionalist constitutes only 0.3 percent of the population.
However, 3.9 percent of the population have no religious affiliation with more males than
females. Christians are further categorised as Catholics (17.8%), Protestants including
Methodist, Anglican, and Lutheran (28.3%), Pentecostal/Charismatic (28.7%). Other
Christians constitute 10.3 percent of the population.
Table 3.7: Population by religion and sex
Religion
Both sexes
Male Female
Number Percent
Number Percent Number Percent
Total 169,894 100.0
82,810 100.0
87,084 100.0
No Religion 6,622 3.9
4,296 5.2
2,326 2.7
Catholic 30,296 17.8
14,814 17.9
15,482 17.8
Protestant (Anglican
Lutheran etc.) 48,134 28.3
22,735 27.5
25,399 29.2
Pentecostal/Charismatic 48,714 28.7
23,007 27.8
25,707 29.5
Other Christians 17,548 10.3
8,359 10.1
9,189 10.6
Islam 16,537 9.7
8,565 10.3
7,972 9.2
Traditionalist 549 0.3
282 0.3
267 0.3
Other (Specify) 1,494 0.9 752 0.9 742 0.9 Source: Ghana Statistical Service, 2010 Population and Housing Census
3.6 Literacy and Education
3.6.1 Literacy
Figure 3.2 show that the nine out 10 persons in the Cape Coast Metropolis who are 11 years
and older are literate, that is, they can read and write. This is against a regional average of
78.2 percent and a national average of 74.1 percent. Literacy is nearly universal among the
youth population of the Metropolis. The population in the age group 11-24 years have a
literacy rate of about 97 percent. Except in the older ages of 60 years and beyond, the
Metropolis have a high literate population where four out of every five persons can read and
write in one language or the other.
Figure 3.3 presents information on the languages in which the population can read and write.
From the data, 25.6 percent of the literate population in the Metropolis can read and write in
English only. About three percent (2.8%) can read and write in a Ghanaian language only,
whilst 67.2 percent can read and write in both English and a Ghanaian language. One out of
every 26 literate persons (3.9%) are able to read and write in English, French and a Ghanaian
language.
Male literacy rate in the Metropolis is 94.1 percent compared to the female literacy rate of
85.6 percent. The table also indicate that males aged 65 and older have a higher literacy rate
(71.4%) compared to females (38.7%) in that category. Whiles not much difference is
observed in the proportion literate among the young male and female populations, males who
are 60 years and registered many more literate persons than their female counterparts,
(Appendix Table A6).

31
Figure 3.2: Literacy status by age of persons 11 years and older
0.0
10.0
20.0
30.0
40.0
50.0
60.0
70.0
80.0
90.0
100.0
Pe
rce
nt
Age
Literate
Not literate
Source: Ghana Statistical Service, 2010 Population and Housing Census
Figure 3.3: Language of literacy of persons 11 years and older
English only25.6%
Ghanaian language only
2.8%
English and Ghanaian language
67.2%
English and French0.5%
English, French and Ghanaian
language3.9%
Source: Ghana Statistical Service, 2010 Population and Housing Census
32
3.6.2 Education
Table 3.8 shows the level of education and school attendance of persons 3 years and older in
the Cape Coast Metropolis. Among the population currently in school, more than one-third
(34.4%) are in tertiary institutions, 27 percent in primary, 13.1 percent in JHS and 11.4
percent in SHS education. This confirms the earlier suggestion that most of the migrants in
the Metropolis are students. Whiles there are currently more males (40.4%) in tertiary
institutions in the Metropolis, a relatively smaller proportion of the females (28%) are in this
level of education. Contrarily, the proportion of females in primary, JHS and SHS is higher.
Table 3.8 further shows that for those who have been to school in the past, slightly more
females have had basic education than males. The highest level attained by most of those who
attended school in the past, is Middle/JSS/JHS (46.1%), whiles 16 percent attained
secondary/SSS/SHS level. The data also shows that 11.7percent of males who attended school in
the past had primary level of education compared to 16.5 percent of females. Contrarily, 17.3 percent
of males attained tertiary education compared to 10.5 percent of females.
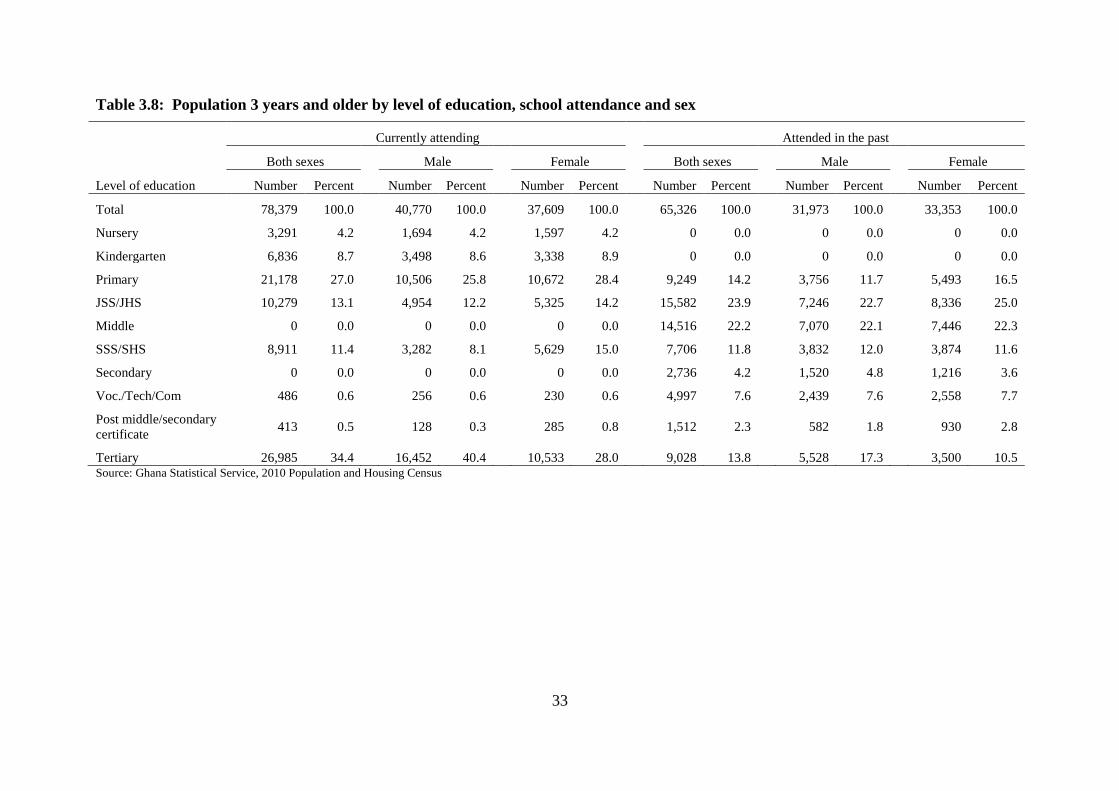
33
Table 3.8: Population 3 years and older by level of education, school attendance and sex
Level of education
Currently attending Attended in the past
Both sexes Male Female Both sexes Male Female
Number Percent Number Percent Number Percent Number Percent Number Percent Number Percent
Total 78,379 100.0 40,770 100.0 37,609 100.0 65,326 100.0 31,973 100.0 33,353 100.0
Nursery 3,291 4.2 1,694 4.2 1,597 4.2 0 0.0 0 0.0 0 0.0
Kindergarten 6,836 8.7 3,498 8.6 3,338 8.9 0 0.0 0 0.0 0 0.0
Primary 21,178 27.0 10,506 25.8 10,672 28.4 9,249 14.2 3,756 11.7 5,493 16.5
JSS/JHS 10,279 13.1 4,954 12.2 5,325 14.2 15,582 23.9 7,246 22.7 8,336 25.0
Middle 0 0.0 0 0.0 0 0.0 14,516 22.2 7,070 22.1 7,446 22.3
SSS/SHS 8,911 11.4 3,282 8.1 5,629 15.0 7,706 11.8 3,832 12.0 3,874 11.6
Secondary 0 0.0 0 0.0 0 0.0 2,736 4.2 1,520 4.8 1,216 3.6
Voc./Tech/Com 486 0.6 256 0.6 230 0.6 4,997 7.6 2,439 7.6 2,558 7.7
Post middle/secondary
certificate 413 0.5 128 0.3 285 0.8 1,512 2.3 582 1.8 930 2.8
Tertiary 26,985 34.4 16,452 40.4 10,533 28.0 9,028 13.8 5,528 17.3 3,500 10.5 Source: Ghana Statistical Service, 2010 Population and Housing Census
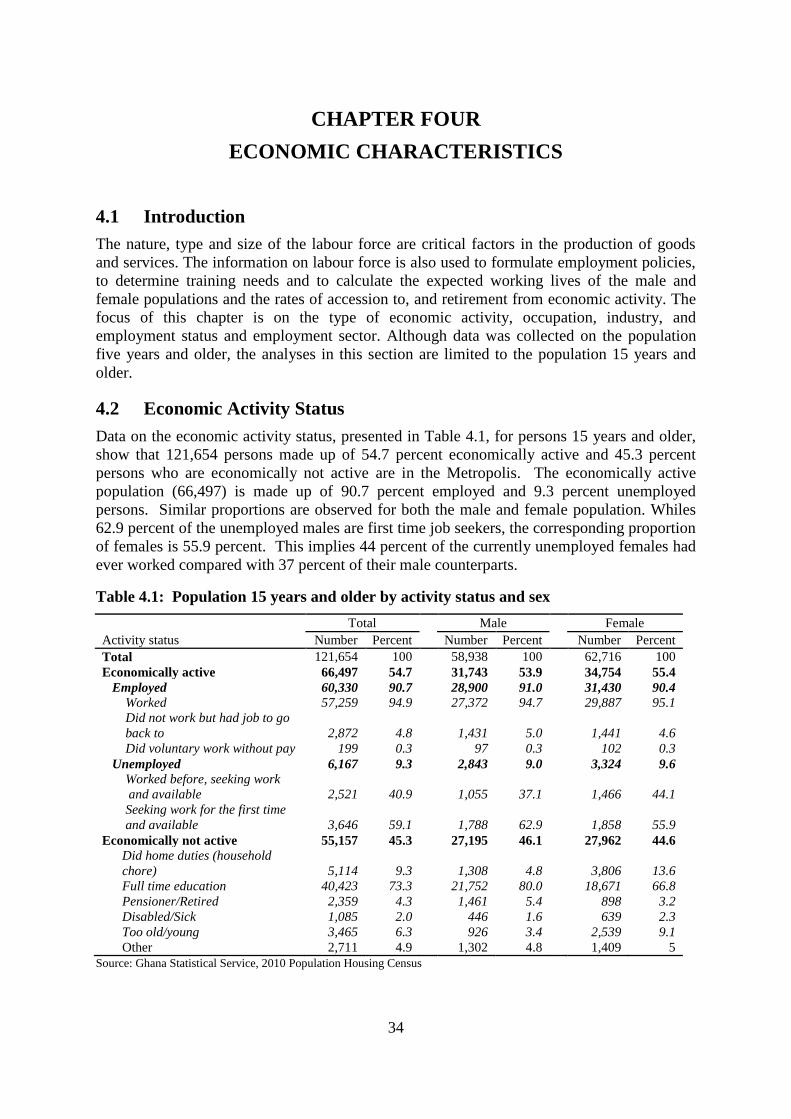
34
CHAPTER FOUR
ECONOMIC CHARACTERISTICS
4.1 Introduction
The nature, type and size of the labour force are critical factors in the production of goods
and services. The information on labour force is also used to formulate employment policies,
to determine training needs and to calculate the expected working lives of the male and
female populations and the rates of accession to, and retirement from economic activity. The
focus of this chapter is on the type of economic activity, occupation, industry, and
employment status and employment sector. Although data was collected on the population
five years and older, the analyses in this section are limited to the population 15 years and
older.
4.2 Economic Activity Status
Data on the economic activity status, presented in Table 4.1, for persons 15 years and older,
show that 121,654 persons made up of 54.7 percent economically active and 45.3 percent
persons who are economically not active are in the Metropolis. The economically active
population (66,497) is made up of 90.7 percent employed and 9.3 percent unemployed
persons. Similar proportions are observed for both the male and female population. Whiles
62.9 percent of the unemployed males are first time job seekers, the corresponding proportion
of females is 55.9 percent. This implies 44 percent of the currently unemployed females had
ever worked compared with 37 percent of their male counterparts.
Table 4.1: Population 15 years and older by activity status and sex
Activity status
Total Male Female
Number Percent Number Percent Number Percent
Total 121,654 100
58,938 100
62,716 100
Economically active 66,497 54.7
31,743 53.9
34,754 55.4
Employed 60,330 90.7
28,900 91.0
31,430 90.4
Worked 57,259 94.9
27,372 94.7
29,887 95.1
Did not work but had job to go
back to 2,872 4.8
1,431 5.0
1,441 4.6
Did voluntary work without pay 199 0.3
97 0.3
102 0.3
Unemployed 6,167 9.3
2,843 9.0
3,324 9.6
Worked before, seeking work
and available 2,521 40.9
1,055 37.1
1,466 44.1
Seeking work for the first time
and available 3,646 59.1
1,788 62.9
1,858 55.9
Economically not active 55,157 45.3
27,195 46.1
27,962 44.6
Did home duties (household
chore) 5,114 9.3
1,308 4.8
3,806 13.6
Full time education 40,423 73.3
21,752 80.0
18,671 66.8
Pensioner/Retired 2,359 4.3
1,461 5.4
898 3.2
Disabled/Sick 1,085 2.0
446 1.6
639 2.3
Too old/young 3,465 6.3
926 3.4
2,539 9.1
Other 2,711 4.9 1,302 4.8 1,409 5
Source: Ghana Statistical Service, 2010 Population Housing Census

35
Table 4.1 further shows that seven out of 10 of the economically not active population are in
full time education; whilst about one in 10 (9.3%) were engaged in home duties. Household
work which mostly includes household chores like cooking, fetching water, washing utensils
and clothes, cleaning house and compound featured as the reason for not being economically
active. The proportion of females engaged in household work (13.6%) was significantly
higher (about thrice) than that of males (4.8%). Contrarily, more males (80%) than females
(66.8%) indicated schooling was their reason for being economically not active.
The economically active population form the productive population of any nation. They form
the age group 15-64 years. It is this population that is expected to produce to feed the
population below 15 years of age and above 64 years, known as the dependent population.
Table 4.2 shows that out of the 60,330 persons 15 years and older who are employed, nearly
one-third (31.7%) are in the age group 25-34. In the subsequent ages, the proportion of the
employed decreases with increasing age. The same pattern is observed among the male and
female populations. It worth noting that one out of every six employed male or female is aged
between 15 and 24 years.
Table 4.2 further reveals that about four out of five (83.1%) unemployed persons are below
age 40, with slightly more males (84.0%) than females (82.4%). The unemployment situation
is more pronounced among the economically active population below 30 years. Sixty-seven
(67.3%) of the males and 65.3 percent of the females in this age group are unemployed. As
observed in the table, unemployment peaks in the age group 20-24 years, experiences a
drastic reduction by age 30-34 and continues to decrease with increasing age. Similar pattern
is observed among the male and female population. The economically not active population
are mostly found among those below 25 years, with slightly more males (73.5%) and females
(69.6%).

36
Table 4.2: Population 15 years and older by sex, age and activity status
Age group
All Status
Employed
Unemployed
Economically not
active
Number Percent Number Percent Number Percent Number Percent
Both sexes
Total 121,654 100.0 60,330 100.0 6,167 100.0 55,157 100.0
15 - 19 22,291 18.3 2,334 3.9 694 11.3 19,263 34.9
20 - 24 29,566 24.3 7,376 12.2 1,994 32.3 20,196 36.6
25 - 29 16,305 13.4 10,008 16.6 1,395 22.6 4,902 8.9
30 - 34 11,338 9.3 9,165 15.2 650 10.5 1,523 2.8
35 - 39 8,815 7.2 7,656 12.7 392 6.4 767 1.4
40 - 44 7,326 6.0 6,473 10.7 290 4.7 563 1.0
45 - 49 5,895 4.8 5,179 8.6 213 3.5 503 0.9
50 - 54 5,403 4.4 4,554 7.5 201 3.3 648 1.2
55 - 59 3,834 3.2 3,085 5.1 114 1.8 635 1.2
60 - 64 3,182 2.6 1,834 3.0 116 1.9 1,232 2.2
65+ 7,699 6.3 2,666 4.4 108 1.8 4,925 8.9
Male
Total 58,938 100.0 28,900 100.0 2,843 100.0 27,195 100.0
15 - 19 9,450 16.0 1,104 3.8 275 9.7 8,071 29.7
20 - 24 16,356 27.8 3,481 12.0 958 33.7 11,917 43.8
25 - 29 8,475 14.4 4,846 16.8 679 23.9 2,950 10.8
30 - 34 5,654 9.6 4,548 15.7 312 11.0 794 2.9
35 - 39 4,212 7.1 3,758 13.0 162 5.7 292 1.1
40 - 44 3,409 5.8 3,096 10.7 113 4.0 200 0.7
45 - 49 2,672 4.5 2,411 8.3 99 3.5 162 0.6
50 - 54 2,379 4.0 2,098 7.3 89 3.1 192 0.7
55 - 59 1,826 3.1 1,559 5.4 51 1.8 216 0.8
60 - 64 1,440 2.4 865 3.0 49 1.7 526 1.9
65+ 3,065 5.2 1,134 3.9 56 2.0 1,875 6.9
Female
Total 62,716 100.0 31,430 100.0 3,324 100.0 27,962 100.0
15 - 19 12,841 20.5 1,230 3.9 419 12.6 11,192 40.0
20 - 24 13,210 21.1 3,895 12.4 1,036 31.2 8,279 29.6
25 - 29 7,830 12.5 5,162 16.4 716 21.5 1,952 7.0
30 - 34 5,684 9.1 4,617 14.7 338 10.2 729 2.6
35 - 39 4,603 7.3 3,898 12.4 230 6.9 475 1.7
40 - 44 3,917 6.2 3,377 10.7 177 5.3 363 1.3
45 - 49 3,223 5.1 2,768 8.8 114 3.4 341 1.2
50 - 54 3,024 4.8 2,456 7.8 112 3.4 456 1.6
55 - 59 2,008 3.2 1,526 4.9 63 1.9 419 1.5
60 - 64 1,742 2.8 969 3.1 67 2.0 706 2.5
65+ 4,634 7.4 1,532 4.9 52 1.6 3,050 10.9
Source: Ghana Statistical Service, 2010 Population Housing Census
4.3 Occupation
The main occupations of the population in the Cape Coast Metropolis are presented in Table
4.3. The table indicates that 32.5 percent of the employed 15 years and older are service and
sales workers, 23.6 percent are craft and related trades workers, and 13.2 percent are
professionals. Other occupational categories include elementary occupation (8.2%), skilled
agricultural, forestry and fishery workers (6.8%), plant and machine operators and assemblers
(4.9%), managers (3.7%), clerical support workers (3.5%) and technicians and associates
professionals (3.5%). Table 4.3 further indicates that the main occupation of employed males
is craft and related trades (27%) whiles females are service and sales workers (47.5%).
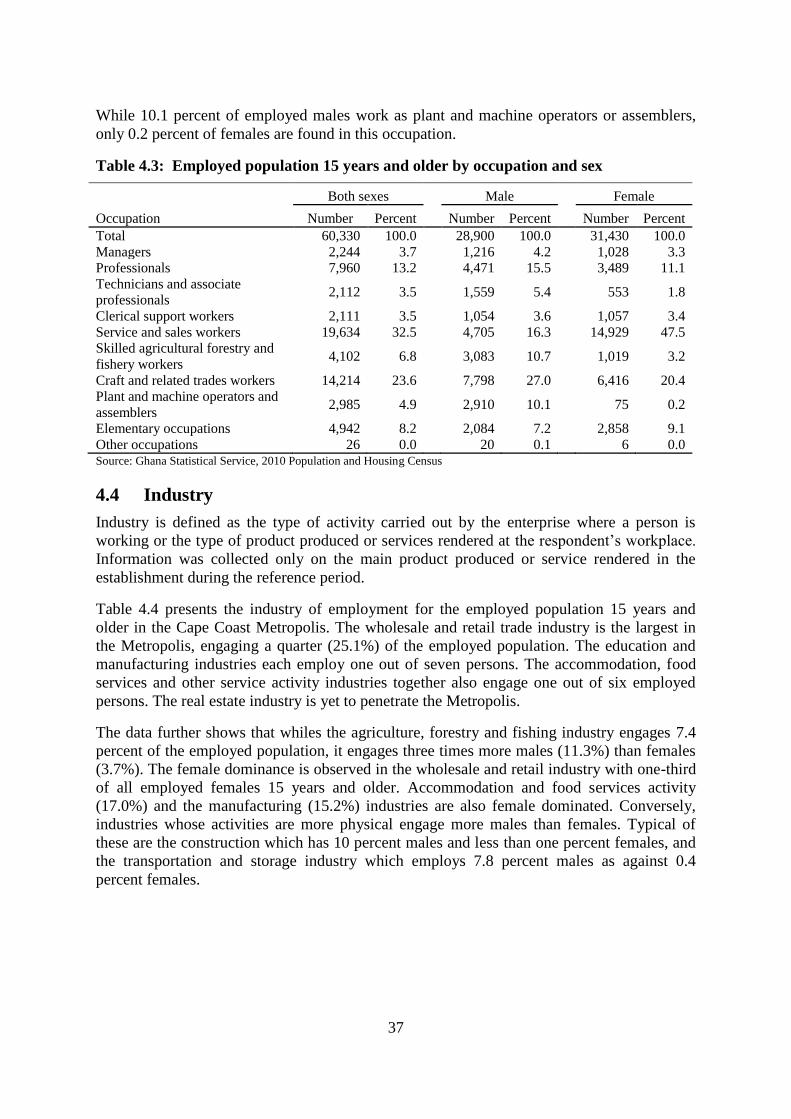
37
While 10.1 percent of employed males work as plant and machine operators or assemblers,
only 0.2 percent of females are found in this occupation.
Table 4.3: Employed population 15 years and older by occupation and sex
Occupation
Both sexes Male Female
Number Percent
Number Percent
Number Percent
Total 60,330 100.0
28,900 100.0
31,430 100.0
Managers 2,244 3.7
1,216 4.2
1,028 3.3
Professionals 7,960 13.2
4,471 15.5
3,489 11.1
Technicians and associate
professionals 2,112 3.5
1,559 5.4
553 1.8
Clerical support workers 2,111 3.5
1,054 3.6
1,057 3.4
Service and sales workers 19,634 32.5
4,705 16.3
14,929 47.5
Skilled agricultural forestry and
fishery workers 4,102 6.8
3,083 10.7
1,019 3.2
Craft and related trades workers 14,214 23.6
7,798 27.0
6,416 20.4
Plant and machine operators and
assemblers 2,985 4.9
2,910 10.1
75 0.2
Elementary occupations 4,942 8.2
2,084 7.2
2,858 9.1
Other occupations 26 0.0 20 0.1 6 0.0 Source: Ghana Statistical Service, 2010 Population and Housing Census
4.4 Industry
Industry is defined as the type of activity carried out by the enterprise where a person is
working or the type of product produced or services rendered at the respondent’s workplace.
Information was collected only on the main product produced or service rendered in the
establishment during the reference period.
Table 4.4 presents the industry of employment for the employed population 15 years and
older in the Cape Coast Metropolis. The wholesale and retail trade industry is the largest in
the Metropolis, engaging a quarter (25.1%) of the employed population. The education and
manufacturing industries each employ one out of seven persons. The accommodation, food
services and other service activity industries together also engage one out of six employed
persons. The real estate industry is yet to penetrate the Metropolis.
The data further shows that whiles the agriculture, forestry and fishing industry engages 7.4
percent of the employed population, it engages three times more males (11.3%) than females
(3.7%). The female dominance is observed in the wholesale and retail industry with one-third
of all employed females 15 years and older. Accommodation and food services activity
(17.0%) and the manufacturing (15.2%) industries are also female dominated. Conversely,
industries whose activities are more physical engage more males than females. Typical of
these are the construction which has 10 percent males and less than one percent females, and
the transportation and storage industry which employs 7.8 percent males as against 0.4
percent females.
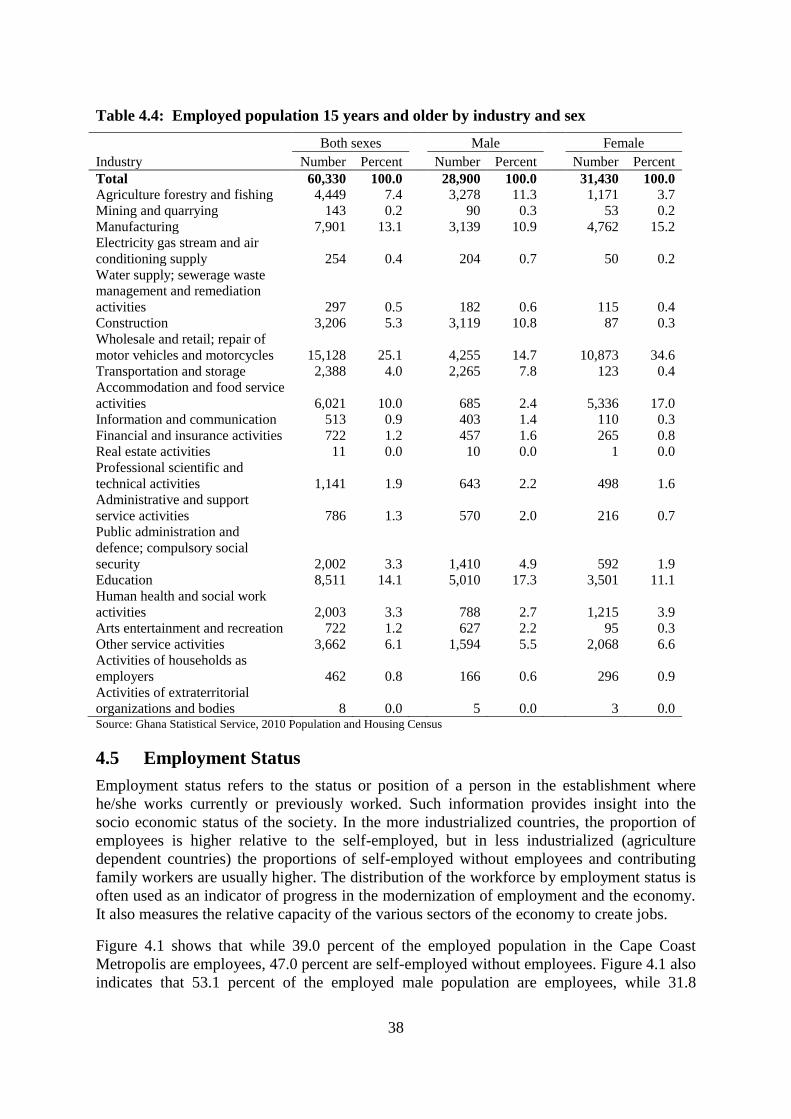
38
Table 4.4: Employed population 15 years and older by industry and sex
Industry
Both sexes Male Female
Number Percent Number Percent Number Percent
Total 60,330 100.0
28,900 100.0
31,430 100.0
Agriculture forestry and fishing 4,449 7.4
3,278 11.3
1,171 3.7
Mining and quarrying 143 0.2
90 0.3
53 0.2
Manufacturing 7,901 13.1
3,139 10.9
4,762 15.2
Electricity gas stream and air
conditioning supply 254 0.4
204 0.7
50 0.2
Water supply; sewerage waste
management and remediation
activities 297 0.5
182 0.6
115 0.4
Construction 3,206 5.3
3,119 10.8
87 0.3
Wholesale and retail; repair of
motor vehicles and motorcycles 15,128 25.1
4,255 14.7
10,873 34.6
Transportation and storage 2,388 4.0
2,265 7.8
123 0.4
Accommodation and food service
activities 6,021 10.0
685 2.4
5,336 17.0
Information and communication 513 0.9
403 1.4
110 0.3
Financial and insurance activities 722 1.2
457 1.6
265 0.8
Real estate activities 11 0.0
10 0.0
1 0.0
Professional scientific and
technical activities 1,141 1.9
643 2.2
498 1.6
Administrative and support
service activities 786 1.3
570 2.0
216 0.7
Public administration and
defence; compulsory social
security 2,002 3.3
1,410 4.9
592 1.9
Education 8,511 14.1
5,010 17.3
3,501 11.1
Human health and social work
activities 2,003 3.3
788 2.7
1,215 3.9
Arts entertainment and recreation 722 1.2
627 2.2
95 0.3
Other service activities 3,662 6.1
1,594 5.5
2,068 6.6
Activities of households as
employers 462 0.8
166 0.6
296 0.9
Activities of extraterritorial
organizations and bodies 8 0.0 5 0.0 3 0.0 Source: Ghana Statistical Service, 2010 Population and Housing Census
4.5 Employment Status
Employment status refers to the status or position of a person in the establishment where
he/she works currently or previously worked. Such information provides insight into the
socio economic status of the society. In the more industrialized countries, the proportion of
employees is higher relative to the self-employed, but in less industrialized (agriculture
dependent countries) the proportions of self-employed without employees and contributing
family workers are usually higher. The distribution of the workforce by employment status is
often used as an indicator of progress in the modernization of employment and the economy.
It also measures the relative capacity of the various sectors of the economy to create jobs.
Figure 4.1 shows that while 39.0 percent of the employed population in the Cape Coast
Metropolis are employees, 47.0 percent are self-employed without employees. Figure 4.1 also
indicates that 53.1 percent of the employed male population are employees, while 31.8

39
percent are self-employed without employees. For the employed female population, 60.9
percent are self-employed without employees whiles only 26.1 percent are employees.
Figure 4.1: Employment status of the employed population 15 years and older by sex
Source: Ghana Statistical Service, 2010 Population and Housing Census
4.6 Employment Sector
Table 4.5 presents data on the employment sector of the employed population 15 years and
older by sex. The data shows that more than two-thirds (68.4%) of the employed population
work in the private informal sector whilst only one-fifth (21.4%) are public sector workers.
The private formal sector in the Metropolis engages only about one employed persons out of
every 10 (9.5%), with twice more males (13.3%) than females (5.9%). Whiles more than
three-quarters (77.6%) of all employed females are found in the private informal sector,
slightly more than half (58.4%) of their male counterparts are found in that sector. All other
sectors of the economy of the Metropolis are male dominated.
Table 4.5: Employment sector of the employed population 15 years and older by sex
Employment Sector
Both sexes Male Female
Number Percent Number Percent Number Percent
Total 60,330 100.0 28,900 100.0 31,430 100.0
Public (Government) 12,926 21.4 7,916 27.4 5,010 15.9
Private Formal 5,725 9.5 3,858 13.3 1,867 5.9
Private Informal 41,262 68.4 16,867 58.4 24,395 77.6
Semi-Public/Parastatal 157 0.3 104 0.4 53 0.2
NGOs (Local and International) 225 0.4 129 0.4 96 0.3
Other International
Organisations 35 0.1 26 0.1 9 0.0
Source: Ghana Statistical Service, 2010 Population and Housing Census
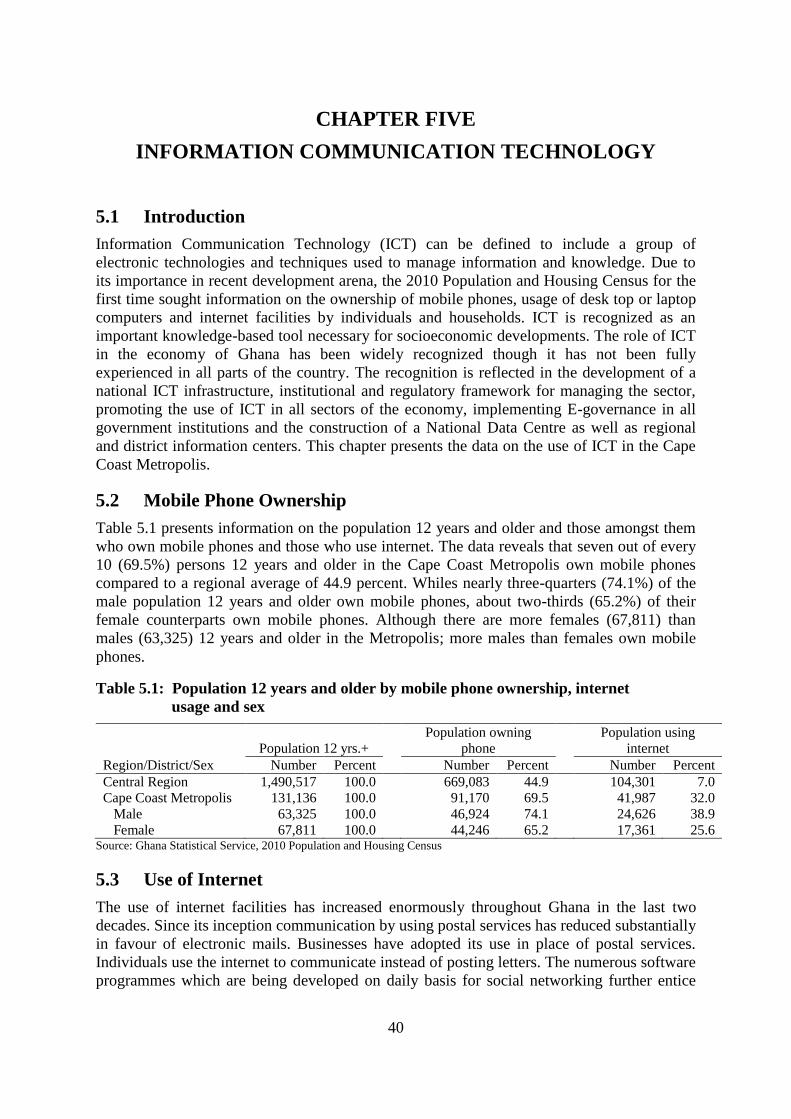
40
CHAPTER FIVE
INFORMATION COMMUNICATION TECHNOLOGY
5.1 Introduction
Information Communication Technology (ICT) can be defined to include a group of
electronic technologies and techniques used to manage information and knowledge. Due to
its importance in recent development arena, the 2010 Population and Housing Census for the
first time sought information on the ownership of mobile phones, usage of desk top or laptop
computers and internet facilities by individuals and households. ICT is recognized as an
important knowledge-based tool necessary for socioeconomic developments. The role of ICT
in the economy of Ghana has been widely recognized though it has not been fully
experienced in all parts of the country. The recognition is reflected in the development of a
national ICT infrastructure, institutional and regulatory framework for managing the sector,
promoting the use of ICT in all sectors of the economy, implementing E-governance in all
government institutions and the construction of a National Data Centre as well as regional
and district information centers. This chapter presents the data on the use of ICT in the Cape
Coast Metropolis.
5.2 Mobile Phone Ownership
Table 5.1 presents information on the population 12 years and older and those amongst them
who own mobile phones and those who use internet. The data reveals that seven out of every
10 (69.5%) persons 12 years and older in the Cape Coast Metropolis own mobile phones
compared to a regional average of 44.9 percent. Whiles nearly three-quarters (74.1%) of the
male population 12 years and older own mobile phones, about two-thirds (65.2%) of their
female counterparts own mobile phones. Although there are more females (67,811) than
males (63,325) 12 years and older in the Metropolis; more males than females own mobile
phones.
Table 5.1: Population 12 years and older by mobile phone ownership, internet
usage and sex
Region/District/Sex
Population 12 yrs.+
Population owning
phone
Population using
internet
Number Percent Number Percent Number Percent
Central Region 1,490,517 100.0
669,083 44.9
104,301 7.0
Cape Coast Metropolis 131,136 100.0
91,170 69.5
41,987 32.0
Male 63,325 100.0
46,924 74.1
24,626 38.9
Female 67,811 100.0 44,246 65.2 17,361 25.6 Source: Ghana Statistical Service, 2010 Population and Housing Census
5.3 Use of Internet
The use of internet facilities has increased enormously throughout Ghana in the last two
decades. Since its inception communication by using postal services has reduced substantially
in favour of electronic mails. Businesses have adopted its use in place of postal services.
Individuals use the internet to communicate instead of posting letters. The numerous software
programmes which are being developed on daily basis for social networking further entice
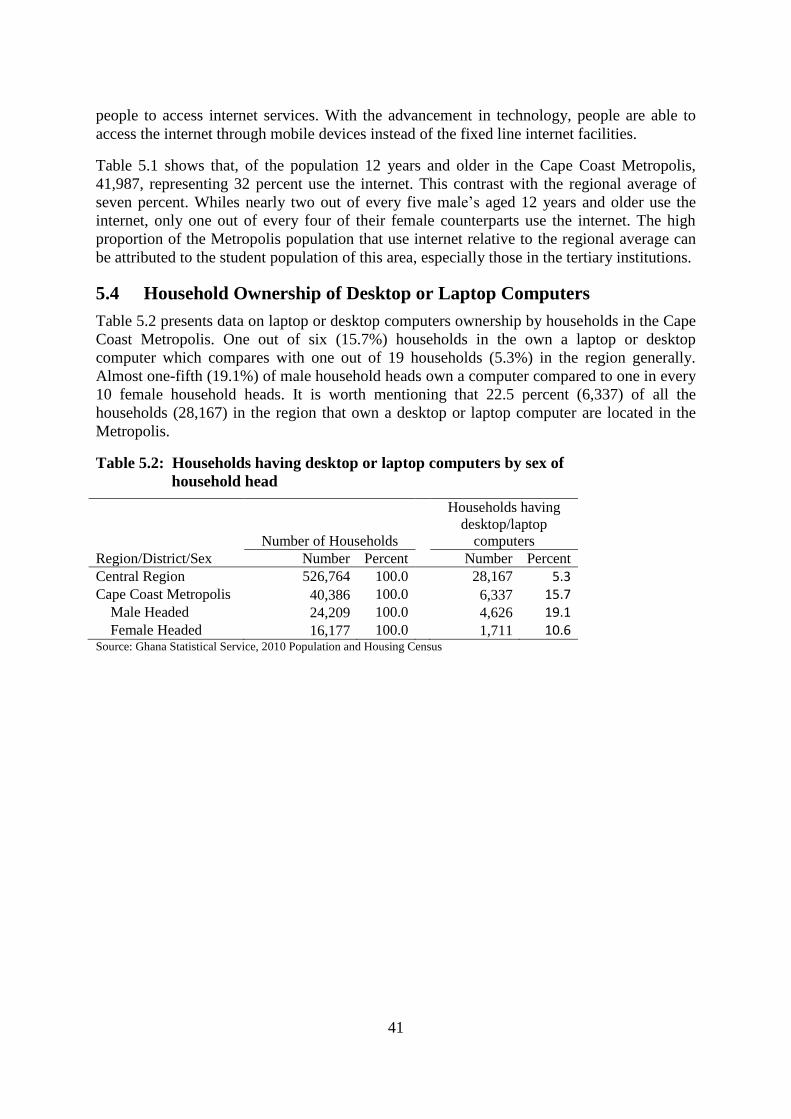
41
people to access internet services. With the advancement in technology, people are able to
access the internet through mobile devices instead of the fixed line internet facilities.
Table 5.1 shows that, of the population 12 years and older in the Cape Coast Metropolis,
41,987, representing 32 percent use the internet. This contrast with the regional average of
seven percent. Whiles nearly two out of every five male’s aged 12 years and older use the
internet, only one out of every four of their female counterparts use the internet. The high
proportion of the Metropolis population that use internet relative to the regional average can
be attributed to the student population of this area, especially those in the tertiary institutions.
5.4 Household Ownership of Desktop or Laptop Computers
Table 5.2 presents data on laptop or desktop computers ownership by households in the Cape
Coast Metropolis. One out of six (15.7%) households in the own a laptop or desktop
computer which compares with one out of 19 households (5.3%) in the region generally.
Almost one-fifth (19.1%) of male household heads own a computer compared to one in every
10 female household heads. It is worth mentioning that 22.5 percent (6,337) of all the
households (28,167) in the region that own a desktop or laptop computer are located in the
Metropolis.
Table 5.2: Households having desktop or laptop computers by sex of
household head
Region/District/Sex
Number of Households
Households having
desktop/laptop
computers
Number Percent Number Percent
Central Region 526,764 100.0 28,167 5.3 Cape Coast Metropolis 40,386 100.0 6,337 15.7 Male Headed 24,209 100.0 4,626 19.1 Female Headed 16,177 100.0 1,711 10.6 Source: Ghana Statistical Service, 2010 Population and Housing Census
42
CHAPTER SIX
DISABILITY
6.1 Introduction
Evidence the world over indicates that persons with disability are people who can contribute
to development. However, prejudice in cultures in certain parts of the world has
discriminated against people with disabilities. Over the past few decades there has been an
international consensus on the recognition of the rights of persons with disabilities with
emphasis on the promotion of their dignity, and inclusive development. Evidence is needed
to make informed decisions on policies and programmes. Knowing the characteristics and
understanding the numbers of people with disabilities and their circumstances can enhance
policies that address barriers that prevent persons with disabilities (PWDs) from participating
more effectively in national development. In the Local Governance System in Ghana, one of
the assessments for Cape Coast Metropolis or any other district to pass the Functional
Organisation Assessment Tools (FOAT) is to make provision for PWDs in the design and
construction of physical projects like toilets, schools, markets, office buildings, among others.
The 2010 PHC for the first time sought information disability. This chapter presents data on
the prevalence of disability, and the social-demographic characteristics of people with
disabilities in the Cape Coast Metropolis.
6.2 Population with Disability
Table 6.1 presents information on the people with disability and the type of disability by sex
in the Cape Coast Metropolis. The table shows that 2.5 percent of the population of the Cape
Coast have one form of disability or the other. Whiles 2.4 percent are males, 2.6 percent are
females. There are more persons with disabilities in the urban areas (2.7%) than in the rural
settlements (1.9%) of the Metropolis. Table 6.1 further provide information on the type of
disabilities. It must be noted however that due to the fact that some persons have multiple
disabilities, the types of disability may necessarily not add up to the reported number of
persons with disability.
Data in Table 6.1 suggest that the most common disability among PWDs in the Metropolis
are sight (46.2%) and physical (26.9%) disabilities. Almost half (49.2%) female PWDs are
suffering from sight disability compared with 42.5 percent of their male counterparts. For all
other types of disabilities however, more of male PWDs are affected than females in the same
category. A similar pattern is observed in both urban and rural areas of the Metropolis,
although the proportion of PWDs in the urban areas is higher. Though the prevalence of the
sight disability is almost the same in urban (41.1%) as in rural (41.6%) localities, the
prevalence is much higher among urban male PWDs (43.5%) than those in rural areas
(37.7%), and also much higher among urban female PWDs than their rural counterparts
(45.4%). The prevalence of physical disability is much higher in urban (27.4%) than in rural
(24.5%) areas. But physical disability in urban male PWDs (27.4%) is slightly lower than in
rural male PWDs (28.5%). It is also higher among urban females with disabilities (27.3%)
than rural females with disabilities (20.7%).

43
Table 6.1: Population by disability type and sex type of locality
Disability Type
Both sexes Male Female
Number Percent Number Percent Number Percent
All Localities
Total 169,894 100.0 82,810 100.0 87,084 100.0
Without disability 165,668 97.5 80,846 97.6 84,822 97.4
With disability 4,226 2.5 1,964 2.4 2,262 2.6
Sight 1,951 46.2 834 42.5 1,117 49.4
Hearing 513 12.1 242 12.3 271 12.0
Speech 590 14.0 346 17.6 244 10.8
Physical 1,137 26.9 544 27.7 593 26.2
Intellect 539 12.8 279 14.2 260 11.5
Emotion 519 12.3 247 12.6 272 12.0
Other 300 7.1 141 7.2 159 7.0
Urban
Total 130,348 100.0 62,846 100.0 67,502 100.0
Without disability 126,857 97.3 61,240 97.4 65,617 97.2
With disability 3,491 2.7 1,606 2.6 1,885 2.8
Sight 1,645 47.1 699 43.5 946 50.2
Hearing 414 11.9 204 12.7 210 11.1
Speech 454 13.0 252 15.7 202 10.7
Physical 957 27.4 442 27.5 515 27.3
Intellect 452 12.9 230 14.3 222 11.8
Emotion 432 12.4 207 12.9 225 11.9
Other 243 7.0 118 7.3 125 6.6
Rural
Total 39,546 100.0 19,964 100.0 19,582 100.0
Without disability 38,811 98.1 19,606 98.2 19,205 98.1
With disability 735 1.9 358 1.8 377 1.9
Sight 306 41.6 135 37.7 171 45.4
Hearing 99 13.5 38 10.6 61 16.2
Speech 136 18.5 94 26.3 42 11.1
Physical 180 24.5 102 28.5 78 20.7
Intellect 87 11.8 49 13.7 38 10.1
Emotion 87 11.8 40 11.2 47 12.5
Other 57 7.8 23 6.4 34 9.0 Source: Ghana Statistical Service, 2010 Population and Housing Census
6.3 Disability and Economic Activity Status
Table 6.2, which present information on the economic activity status of persons with
disability (PWDs), aged 15 years and older. The data reveals that 88.9 percent of all PWDs in
the Cape Coast Metropolis are aged 15 years and older. About two out of five (42.4%) of all
PWDs 15 years and older in the Metropolis are employed whiles slightly more than half
(53.1%) are economically not active. Among the economically active, 4.5 percent are
unemployed, with slightly more males than females. About three out every 10 PWDs who
have intellectual or physical disabilities are employed compared to 46.5 percent of their
counterparts suffer sight disability. PWDs with hearing (5.6%) and emotional (5.4%) are
more likely than others to be unemployed. Similar patterns are observed among the male and
female PWDs with slightly more females (54.3%) reporting to be economically not active
than males (51.7%).
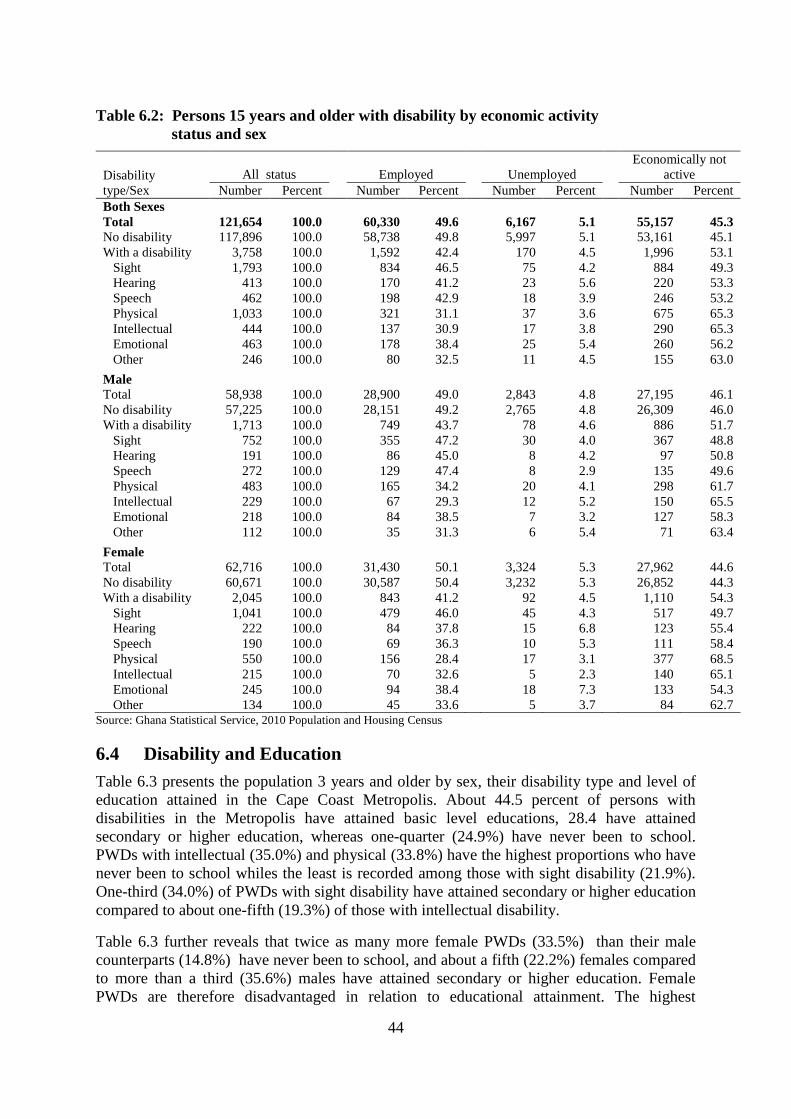
44
Table 6.2: Persons 15 years and older with disability by economic activity
status and sex
Disability
type/Sex
All status Employed Unemployed
Economically not
active
Number Percent Number Percent Number Percent Number Percent
Both Sexes
Total 121,654 100.0
60,330 49.6
6,167 5.1
55,157 45.3
No disability 117,896 100.0
58,738 49.8
5,997 5.1
53,161 45.1
With a disability 3,758 100.0
1,592 42.4
170 4.5
1,996 53.1
Sight 1,793 100.0
834 46.5
75 4.2
884 49.3
Hearing 413 100.0
170 41.2
23 5.6
220 53.3
Speech 462 100.0
198 42.9
18 3.9
246 53.2
Physical 1,033 100.0
321 31.1
37 3.6
675 65.3
Intellectual 444 100.0
137 30.9
17 3.8
290 65.3
Emotional 463 100.0
178 38.4
25 5.4
260 56.2
Other 246 100.0
80 32.5
11 4.5
155 63.0
Male
Total 58,938 100.0
28,900 49.0
2,843 4.8
27,195 46.1
No disability 57,225 100.0
28,151 49.2
2,765 4.8
26,309 46.0
With a disability 1,713 100.0
749 43.7
78 4.6
886 51.7
Sight 752 100.0
355 47.2
30 4.0
367 48.8
Hearing 191 100.0
86 45.0
8 4.2
97 50.8
Speech 272 100.0
129 47.4
8 2.9
135 49.6
Physical 483 100.0
165 34.2
20 4.1
298 61.7
Intellectual 229 100.0
67 29.3
12 5.2
150 65.5
Emotional 218 100.0
84 38.5
7 3.2
127 58.3
Other 112 100.0
35 31.3
6 5.4
71 63.4
Female
Total 62,716 100.0
31,430 50.1
3,324 5.3
27,962 44.6
No disability 60,671 100.0
30,587 50.4
3,232 5.3
26,852 44.3
With a disability 2,045 100.0
843 41.2
92 4.5
1,110 54.3
Sight 1,041 100.0
479 46.0
45 4.3
517 49.7
Hearing 222 100.0
84 37.8
15 6.8
123 55.4
Speech 190 100.0
69 36.3
10 5.3
111 58.4
Physical 550 100.0
156 28.4
17 3.1
377 68.5
Intellectual 215 100.0
70 32.6
5 2.3
140 65.1
Emotional 245 100.0
94 38.4
18 7.3
133 54.3
Other 134 100.0 45 33.6 5 3.7 84 62.7 Source: Ghana Statistical Service, 2010 Population and Housing Census
6.4 Disability and Education
Table 6.3 presents the population 3 years and older by sex, their disability type and level of
education attained in the Cape Coast Metropolis. About 44.5 percent of persons with
disabilities in the Metropolis have attained basic level educations, 28.4 have attained
secondary or higher education, whereas one-quarter (24.9%) have never been to school.
PWDs with intellectual (35.0%) and physical (33.8%) have the highest proportions who have
never been to school whiles the least is recorded among those with sight disability (21.9%).
One-third (34.0%) of PWDs with sight disability have attained secondary or higher education
compared to about one-fifth (19.3%) of those with intellectual disability.
Table 6.3 further reveals that twice as many more female PWDs (33.5%) than their male
counterparts (14.8%) have never been to school, and about a fifth (22.2%) females compared
to more than a third (35.6%) males have attained secondary or higher education. Female
PWDs are therefore disadvantaged in relation to educational attainment. The highest
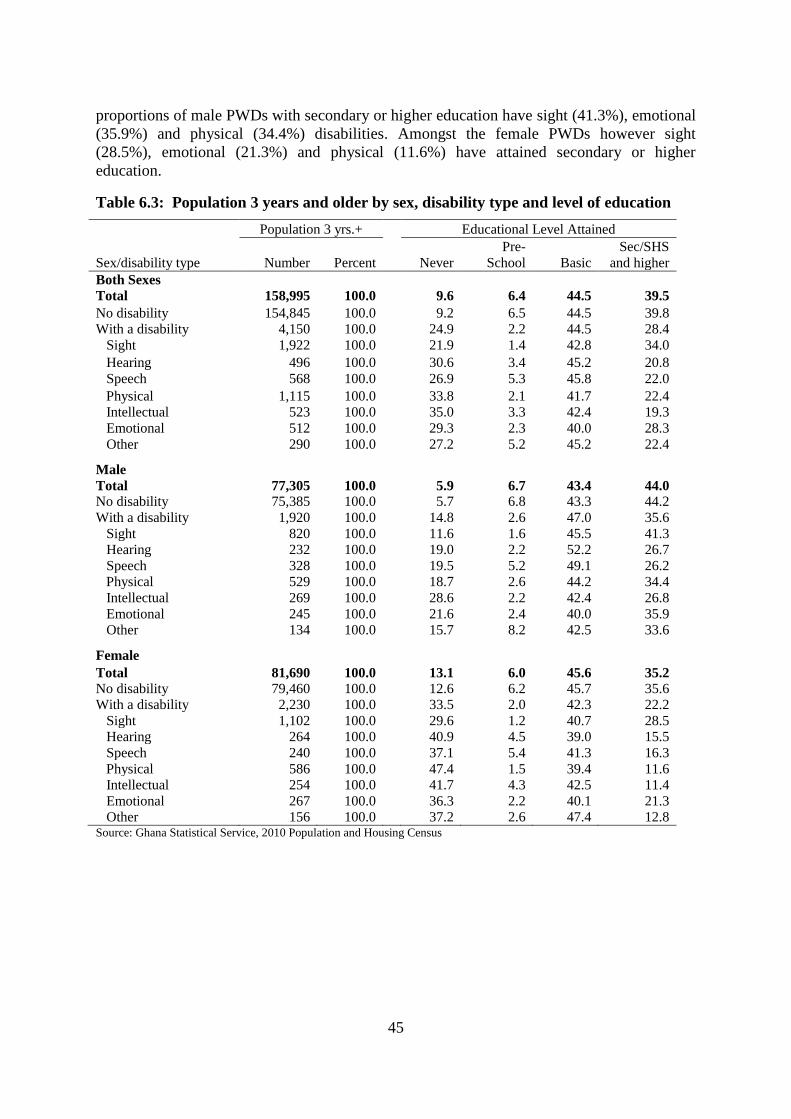
45
proportions of male PWDs with secondary or higher education have sight (41.3%), emotional
(35.9%) and physical (34.4%) disabilities. Amongst the female PWDs however sight
(28.5%), emotional (21.3%) and physical (11.6%) have attained secondary or higher
education.
Table 6.3: Population 3 years and older by sex, disability type and level of education
Sex/disability type
Population 3 yrs.+ Educational Level Attained
Number Percent Never
Pre-
School Basic
Sec/SHS
and higher
Both Sexes
Total 158,995 100.0 9.6 6.4 44.5 39.5
No disability 154,845 100.0 9.2 6.5 44.5 39.8
With a disability 4,150 100.0 24.9 2.2 44.5 28.4
Sight 1,922 100.0 21.9 1.4 42.8 34.0
Hearing 496 100.0 30.6 3.4 45.2 20.8
Speech 568 100.0 26.9 5.3 45.8 22.0
Physical 1,115 100.0 33.8 2.1 41.7 22.4
Intellectual 523 100.0 35.0 3.3 42.4 19.3
Emotional 512 100.0 29.3 2.3 40.0 28.3
Other 290 100.0 27.2 5.2 45.2 22.4
Male
Total 77,305 100.0 5.9 6.7 43.4 44.0 No disability 75,385 100.0 5.7 6.8 43.3 44.2
With a disability 1,920 100.0 14.8 2.6 47.0 35.6
Sight 820 100.0 11.6 1.6 45.5 41.3
Hearing 232 100.0 19.0 2.2 52.2 26.7
Speech 328 100.0 19.5 5.2 49.1 26.2
Physical 529 100.0 18.7 2.6 44.2 34.4
Intellectual 269 100.0 28.6 2.2 42.4 26.8
Emotional 245 100.0 21.6 2.4 40.0 35.9
Other 134 100.0 15.7 8.2 42.5 33.6
Female
Total 81,690 100.0 13.1 6.0 45.6 35.2
No disability 79,460 100.0 12.6 6.2 45.7 35.6
With a disability 2,230 100.0 33.5 2.0 42.3 22.2
Sight 1,102 100.0 29.6 1.2 40.7 28.5
Hearing 264 100.0 40.9 4.5 39.0 15.5
Speech 240 100.0 37.1 5.4 41.3 16.3
Physical 586 100.0 47.4 1.5 39.4 11.6
Intellectual 254 100.0 41.7 4.3 42.5 11.4
Emotional 267 100.0 36.3 2.2 40.1 21.3
Other 156 100.0 37.2 2.6 47.4 12.8 Source: Ghana Statistical Service, 2010 Population and Housing Census
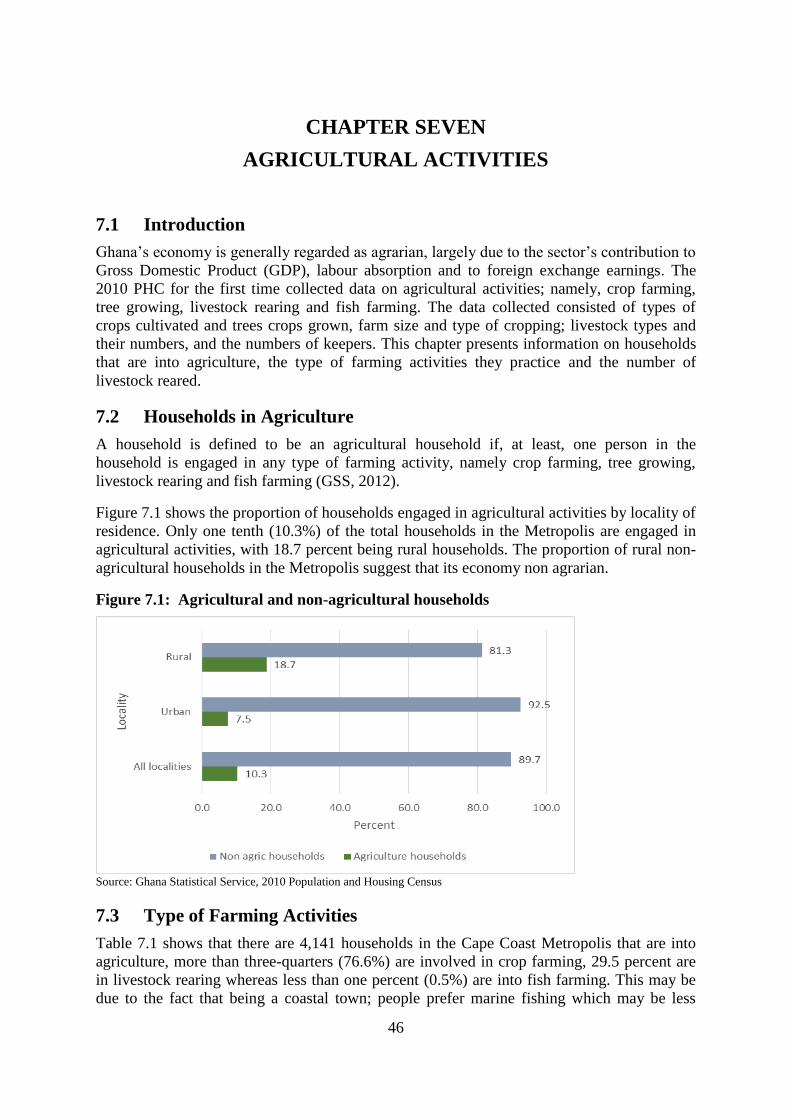
46
CHAPTER SEVEN
AGRICULTURAL ACTIVITIES
7.1 Introduction
Ghana’s economy is generally regarded as agrarian, largely due to the sector’s contribution to
Gross Domestic Product (GDP), labour absorption and to foreign exchange earnings. The
2010 PHC for the first time collected data on agricultural activities; namely, crop farming,
tree growing, livestock rearing and fish farming. The data collected consisted of types of
crops cultivated and trees crops grown, farm size and type of cropping; livestock types and
their numbers, and the numbers of keepers. This chapter presents information on households
that are into agriculture, the type of farming activities they practice and the number of
livestock reared.
7.2 Households in Agriculture
A household is defined to be an agricultural household if, at least, one person in the
household is engaged in any type of farming activity, namely crop farming, tree growing,
livestock rearing and fish farming (GSS, 2012).
Figure 7.1 shows the proportion of households engaged in agricultural activities by locality of
residence. Only one tenth (10.3%) of the total households in the Metropolis are engaged in
agricultural activities, with 18.7 percent being rural households. The proportion of rural non-
agricultural households in the Metropolis suggest that its economy non agrarian.
Figure 7.1: Agricultural and non-agricultural households
Source: Ghana Statistical Service, 2010 Population and Housing Census
7.3 Type of Farming Activities
Table 7.1 shows that there are 4,141 households in the Cape Coast Metropolis that are into
agriculture, more than three-quarters (76.6%) are involved in crop farming, 29.5 percent are
in livestock rearing whereas less than one percent (0.5%) are into fish farming. This may be
due to the fact that being a coastal town; people prefer marine fishing which may be less
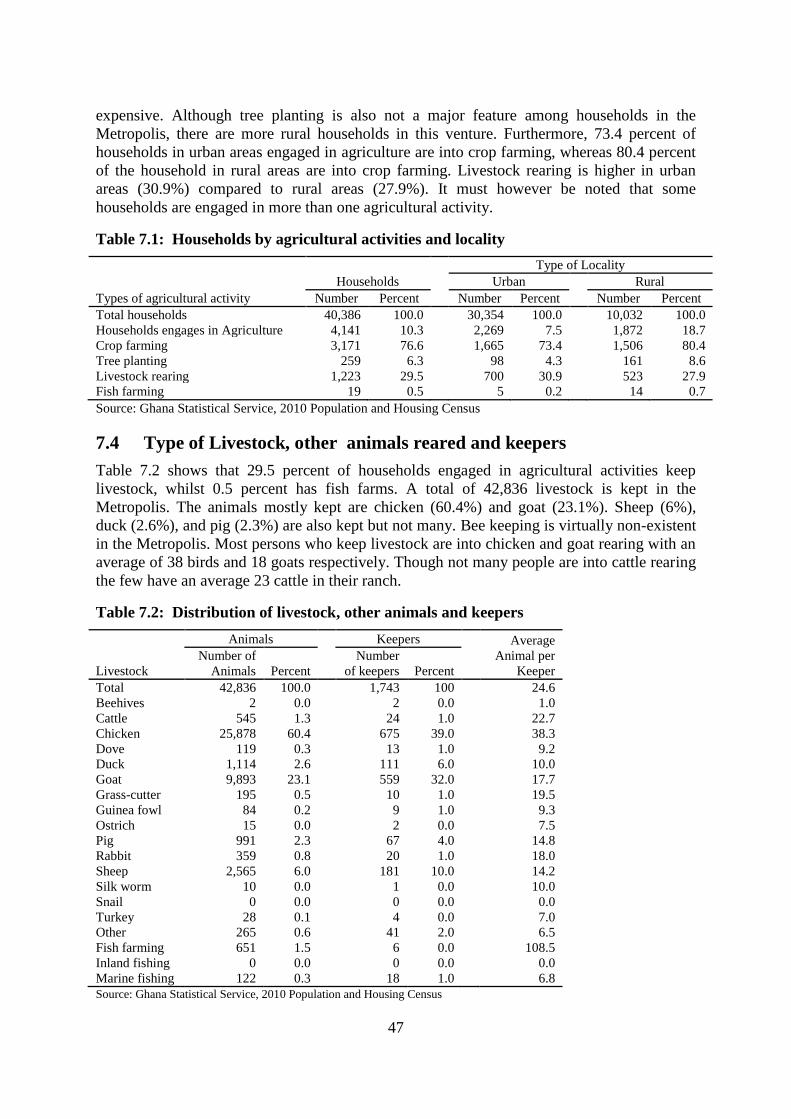
47
expensive. Although tree planting is also not a major feature among households in the
Metropolis, there are more rural households in this venture. Furthermore, 73.4 percent of
households in urban areas engaged in agriculture are into crop farming, whereas 80.4 percent
of the household in rural areas are into crop farming. Livestock rearing is higher in urban
areas (30.9%) compared to rural areas (27.9%). It must however be noted that some
households are engaged in more than one agricultural activity.
Table 7.1: Households by agricultural activities and locality
Types of agricultural activity
Households
Type of Locality
Urban
Rural
Number Percent Number Percent Number Percent
Total households 40,386 100.0
30,354 100.0
10,032 100.0
Households engages in Agriculture 4,141 10.3
2,269 7.5
1,872 18.7
Crop farming 3,171 76.6
1,665 73.4
1,506 80.4
Tree planting 259 6.3
98 4.3
161 8.6
Livestock rearing 1,223 29.5
700 30.9
523 27.9
Fish farming 19 0.5 5 0.2 14 0.7
Source: Ghana Statistical Service, 2010 Population and Housing Census
7.4 Type of Livestock, other animals reared and keepers
Table 7.2 shows that 29.5 percent of households engaged in agricultural activities keep
livestock, whilst 0.5 percent has fish farms. A total of 42,836 livestock is kept in the
Metropolis. The animals mostly kept are chicken (60.4%) and goat (23.1%). Sheep (6%),
duck (2.6%), and pig (2.3%) are also kept but not many. Bee keeping is virtually non-existent
in the Metropolis. Most persons who keep livestock are into chicken and goat rearing with an
average of 38 birds and 18 goats respectively. Though not many people are into cattle rearing
the few have an average 23 cattle in their ranch.
Table 7.2: Distribution of livestock, other animals and keepers
Livestock
Animals Keepers Average
Animal per
Keeper
Number of
Animals Percent Number
of keepers Percent
Total 42,836 100.0 1,743 100
24.6
Beehives 2 0.0
2 0.0
1.0
Cattle 545 1.3
24 1.0
22.7
Chicken 25,878 60.4
675 39.0
38.3
Dove 119 0.3
13 1.0
9.2
Duck 1,114 2.6
111 6.0
10.0
Goat 9,893 23.1
559 32.0
17.7
Grass-cutter 195 0.5
10 1.0
19.5
Guinea fowl 84 0.2
9 1.0
9.3
Ostrich 15 0.0
2 0.0
7.5
Pig 991 2.3
67 4.0
14.8
Rabbit 359 0.8
20 1.0
18.0
Sheep 2,565 6.0
181 10.0
14.2
Silk worm 10 0.0
1 0.0
10.0
Snail 0 0.0
0 0.0
0.0
Turkey 28 0.1
4 0.0
7.0
Other 265 0.6
41 2.0
6.5
Fish farming 651 1.5
6 0.0
108.5
Inland fishing 0 0.0
0 0.0
0.0
Marine fishing 122 0.3 18 1.0 6.8
Source: Ghana Statistical Service, 2010 Population and Housing Census
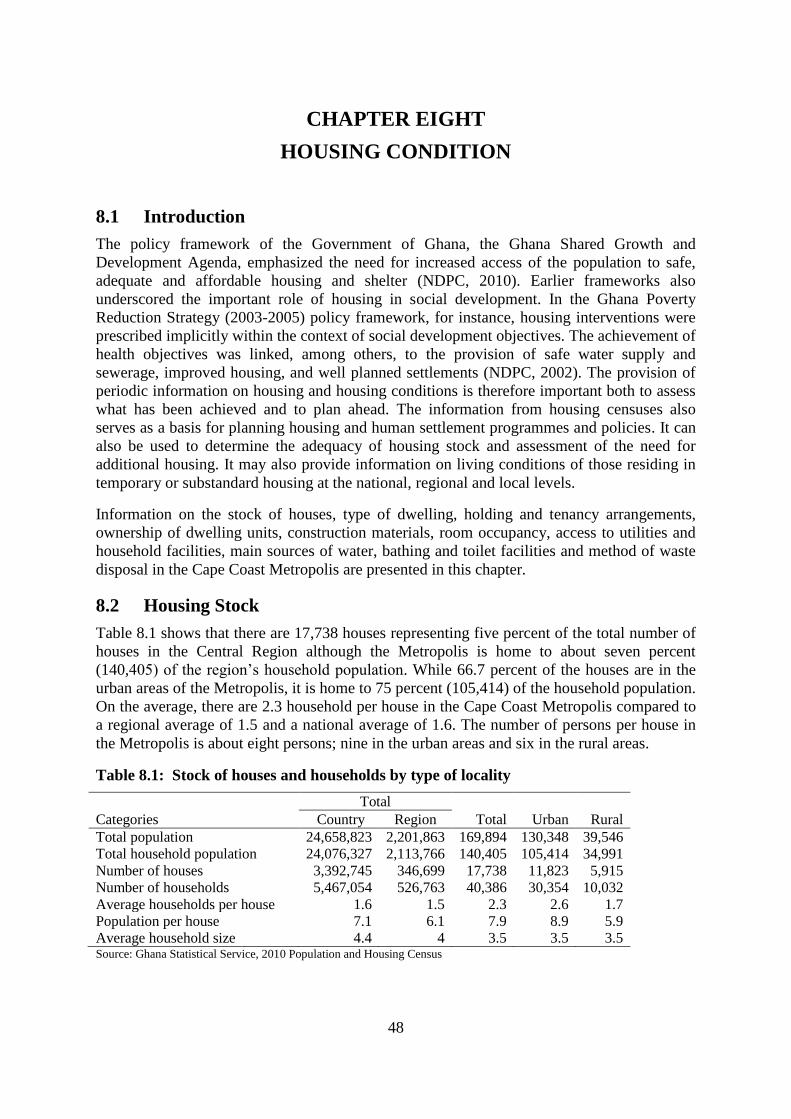
48
CHAPTER EIGHT
HOUSING CONDITION
8.1 Introduction
The policy framework of the Government of Ghana, the Ghana Shared Growth and
Development Agenda, emphasized the need for increased access of the population to safe,
adequate and affordable housing and shelter (NDPC, 2010). Earlier frameworks also
underscored the important role of housing in social development. In the Ghana Poverty
Reduction Strategy (2003-2005) policy framework, for instance, housing interventions were
prescribed implicitly within the context of social development objectives. The achievement of
health objectives was linked, among others, to the provision of safe water supply and
sewerage, improved housing, and well planned settlements (NDPC, 2002). The provision of
periodic information on housing and housing conditions is therefore important both to assess
what has been achieved and to plan ahead. The information from housing censuses also
serves as a basis for planning housing and human settlement programmes and policies. It can
also be used to determine the adequacy of housing stock and assessment of the need for
additional housing. It may also provide information on living conditions of those residing in
temporary or substandard housing at the national, regional and local levels.
Information on the stock of houses, type of dwelling, holding and tenancy arrangements,
ownership of dwelling units, construction materials, room occupancy, access to utilities and
household facilities, main sources of water, bathing and toilet facilities and method of waste
disposal in the Cape Coast Metropolis are presented in this chapter.
8.2 Housing Stock
Table 8.1 shows that there are 17,738 houses representing five percent of the total number of
houses in the Central Region although the Metropolis is home to about seven percent
(140,405) of the region’s household population. While 66.7 percent of the houses are in the
urban areas of the Metropolis, it is home to 75 percent (105,414) of the household population.
On the average, there are 2.3 household per house in the Cape Coast Metropolis compared to
a regional average of 1.5 and a national average of 1.6. The number of persons per house in
the Metropolis is about eight persons; nine in the urban areas and six in the rural areas.
Table 8.1: Stock of houses and households by type of locality
Categories
Total
Total Urban Rural Country Region
Total population 24,658,823 2,201,863 169,894 130,348 39,546
Total household population 24,076,327 2,113,766 140,405 105,414 34,991
Number of houses 3,392,745 346,699 17,738 11,823 5,915
Number of households 5,467,054 526,763 40,386 30,354 10,032
Average households per house 1.6 1.5 2.3 2.6 1.7
Population per house 7.1 6.1 7.9 8.9 5.9
Average household size 4.4 4 3.5 3.5 3.5 Source: Ghana Statistical Service, 2010 Population and Housing Census
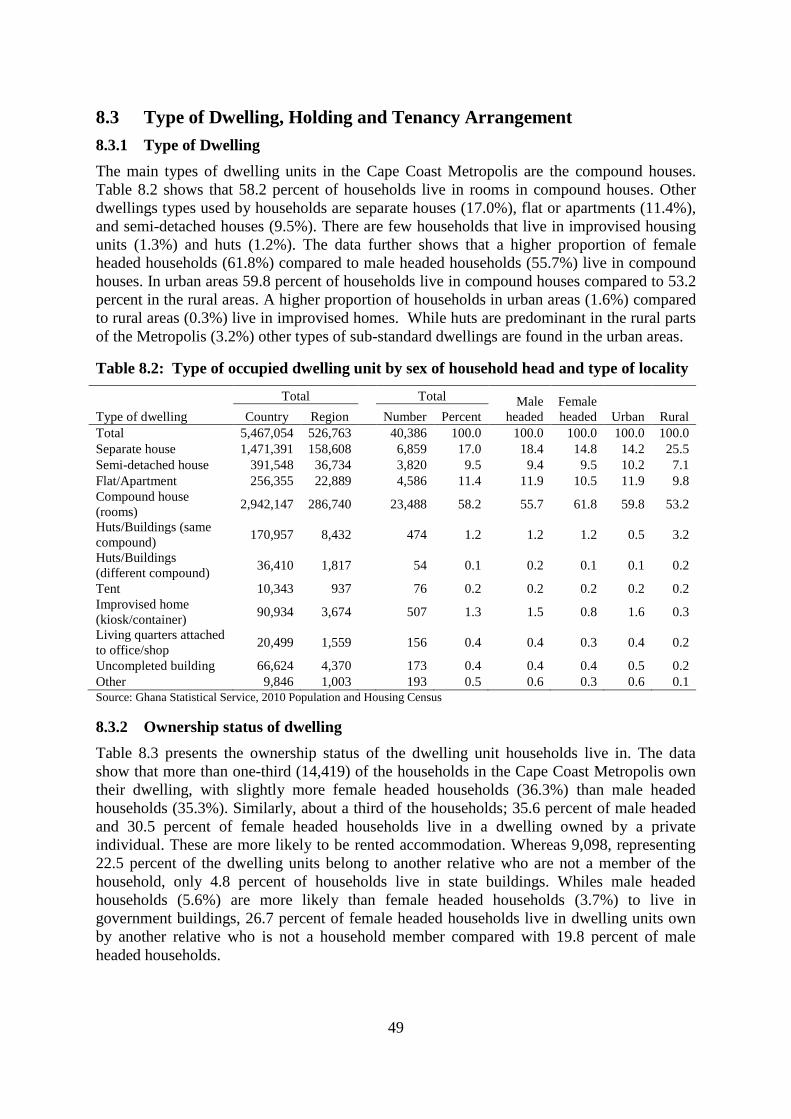
49
8.3 Type of Dwelling, Holding and Tenancy Arrangement
8.3.1 Type of Dwelling
The main types of dwelling units in the Cape Coast Metropolis are the compound houses.
Table 8.2 shows that 58.2 percent of households live in rooms in compound houses. Other
dwellings types used by households are separate houses (17.0%), flat or apartments (11.4%),
and semi-detached houses (9.5%). There are few households that live in improvised housing
units (1.3%) and huts (1.2%). The data further shows that a higher proportion of female
headed households (61.8%) compared to male headed households (55.7%) live in compound
houses. In urban areas 59.8 percent of households live in compound houses compared to 53.2
percent in the rural areas. A higher proportion of households in urban areas (1.6%) compared
to rural areas (0.3%) live in improvised homes. While huts are predominant in the rural parts
of the Metropolis (3.2%) other types of sub-standard dwellings are found in the urban areas.
Table 8.2: Type of occupied dwelling unit by sex of household head and type of locality
Type of dwelling
Total Total Male
headed
Female
headed Urban Rural Country Region Number Percent
Total 5,467,054 526,763
40,386 100.0 100.0 100.0 100.0 100.0
Separate house 1,471,391 158,608
6,859 17.0 18.4 14.8 14.2 25.5
Semi-detached house 391,548 36,734
3,820 9.5 9.4 9.5 10.2 7.1
Flat/Apartment 256,355 22,889
4,586 11.4 11.9 10.5 11.9 9.8
Compound house
(rooms) 2,942,147 286,740
23,488 58.2 55.7 61.8 59.8 53.2
Huts/Buildings (same
compound) 170,957 8,432
474 1.2 1.2 1.2 0.5 3.2
Huts/Buildings
(different compound) 36,410 1,817
54 0.1 0.2 0.1 0.1 0.2
Tent 10,343 937
76 0.2 0.2 0.2 0.2 0.2
Improvised home
(kiosk/container) 90,934 3,674
507 1.3 1.5 0.8 1.6 0.3
Living quarters attached
to office/shop 20,499 1,559
156 0.4 0.4 0.3 0.4 0.2
Uncompleted building 66,624 4,370
173 0.4 0.4 0.4 0.5 0.2
Other 9,846 1,003 193 0.5 0.6 0.3 0.6 0.1
Source: Ghana Statistical Service, 2010 Population and Housing Census
8.3.2 Ownership status of dwelling
Table 8.3 presents the ownership status of the dwelling unit households live in. The data
show that more than one-third (14,419) of the households in the Cape Coast Metropolis own
their dwelling, with slightly more female headed households (36.3%) than male headed
households (35.3%). Similarly, about a third of the households; 35.6 percent of male headed
and 30.5 percent of female headed households live in a dwelling owned by a private
individual. These are more likely to be rented accommodation. Whereas 9,098, representing
22.5 percent of the dwelling units belong to another relative who are not a member of the
household, only 4.8 percent of households live in state buildings. Whiles male headed
households (5.6%) are more likely than female headed households (3.7%) to live in
government buildings, 26.7 percent of female headed households live in dwelling units own
by another relative who is not a household member compared with 19.8 percent of male
headed households.
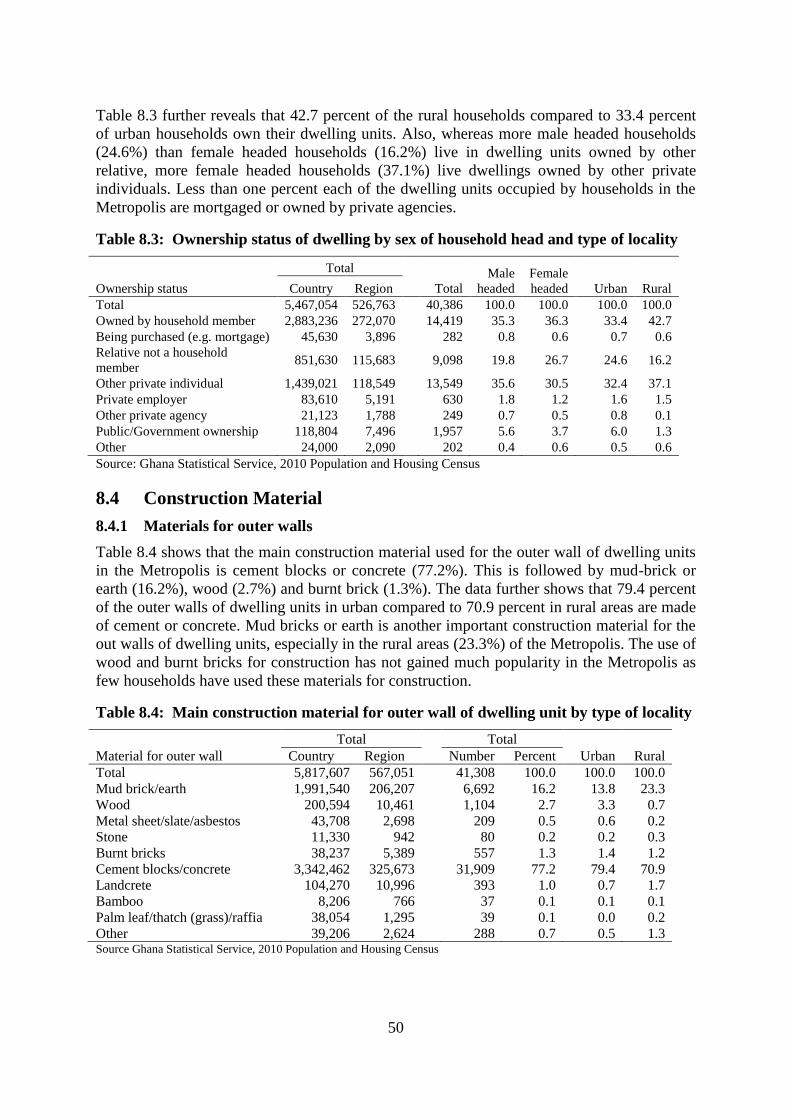
50
Table 8.3 further reveals that 42.7 percent of the rural households compared to 33.4 percent
of urban households own their dwelling units. Also, whereas more male headed households
(24.6%) than female headed households (16.2%) live in dwelling units owned by other
relative, more female headed households (37.1%) live dwellings owned by other private
individuals. Less than one percent each of the dwelling units occupied by households in the
Metropolis are mortgaged or owned by private agencies.
Table 8.3: Ownership status of dwelling by sex of household head and type of locality
Ownership status
Total Male
headed
Female
headed Urban Rural Country Region Total
Total 5,467,054 526,763 40,386 100.0 100.0 100.0 100.0
Owned by household member 2,883,236 272,070 14,419 35.3 36.3 33.4 42.7
Being purchased (e.g. mortgage) 45,630 3,896 282 0.8 0.6 0.7 0.6
Relative not a household
member 851,630 115,683
9,098 19.8 26.7 24.6 16.2
Other private individual 1,439,021 118,549 13,549 35.6 30.5 32.4 37.1
Private employer 83,610 5,191 630 1.8 1.2 1.6 1.5
Other private agency 21,123 1,788 249 0.7 0.5 0.8 0.1
Public/Government ownership 118,804 7,496 1,957 5.6 3.7 6.0 1.3
Other 24,000 2,090 202 0.4 0.6 0.5 0.6
Source: Ghana Statistical Service, 2010 Population and Housing Census
8.4 Construction Material
8.4.1 Materials for outer walls
Table 8.4 shows that the main construction material used for the outer wall of dwelling units
in the Metropolis is cement blocks or concrete (77.2%). This is followed by mud-brick or
earth (16.2%), wood (2.7%) and burnt brick (1.3%). The data further shows that 79.4 percent
of the outer walls of dwelling units in urban compared to 70.9 percent in rural areas are made
of cement or concrete. Mud bricks or earth is another important construction material for the
out walls of dwelling units, especially in the rural areas (23.3%) of the Metropolis. The use of
wood and burnt bricks for construction has not gained much popularity in the Metropolis as
few households have used these materials for construction.
Table 8.4: Main construction material for outer wall of dwelling unit by type of locality
Material for outer wall
Total Total
Urban Rural Country Region Number Percent
Total 5,817,607 567,051
41,308 100.0 100.0 100.0
Mud brick/earth 1,991,540 206,207
6,692 16.2 13.8 23.3
Wood 200,594 10,461
1,104 2.7 3.3 0.7
Metal sheet/slate/asbestos 43,708 2,698
209 0.5 0.6 0.2
Stone 11,330 942
80 0.2 0.2 0.3
Burnt bricks 38,237 5,389
557 1.3 1.4 1.2
Cement blocks/concrete 3,342,462 325,673
31,909 77.2 79.4 70.9
Landcrete 104,270 10,996
393 1.0 0.7 1.7
Bamboo 8,206 766
37 0.1 0.1 0.1
Palm leaf/thatch (grass)/raffia 38,054 1,295
39 0.1 0.0 0.2
Other 39,206 2,624 288 0.7 0.5 1.3 Source Ghana Statistical Service, 2010 Population and Housing Census

51
8.4.2 Materials for the floor of dwelling units
Table 8.5 shows that in the Cape Coast Metropolis 86.2 percent of the floor of dwelling units
is made of cement or concrete; 87.6 percent in urban areas and 82.1 percent in the rural areas.
The next important material for floors is earth/mud (5.7%) areas. Although ceramic or
porcelain or marble tiling has gained some popularity in the country in recent times, not much
of it has been used in the Metropolis. The materials least used for the floor of dwelling units
were stones (0.3%) and burnt bricks (0.3%).
Table 8.5: Main construction materials for the floor of dwelling unit by type of locality
Materials for the floor
Total Total
Urban Rural Country Region Number Percent
Total 5,467,054 526,763
40,386 100.0
100.0 100.0
Earth/mud 872,161 59,543
2,283 5.7
3.8 11.2
Cement/concrete 4,255,611 448,599
34,814 86.2
87.6 82.1
Stone 32,817 2,192
105 0.3
0.3 0.2
Burnt brick 6,537 718
133 0.3
0.1 1.0
Wood 52,856 1,924
377 0.9
1.2 0.0
Vinyl tiles 57,032 3,378
663 1.6
1.7 1.5
Ceramic/porcelain/granite/marble
tiles 88,500 5,534
783 1.9
2.0 1.9
Terrazzo/terrazzo tiles 85,973 3,669 1,103 2.7 3.0 1.8 Source Ghana Statistical Service, 2010 Population and Housing Census
8.4.3 Materials for Roofs
Table 8.6 shows that the main roofing materials for houses in the Cape Coast Metropolis are
slate or asbestos (61%), metal sheet (26.8%) and cement or concrete (8.6%) roofing. The
choice of roofing material did not show any significant variation by locality. In the urban area
of the Metropolis 60.2 percent of the buildings have slate or asbestos roofs, which is not
much different from the rural area of 63.4 percent. The wide use of these roofing materials is
due to the nearness of the settlements to the Atlantic Ocean. Slightly more than quarters
(26.1%) of houses in the urban areas are roofed using metal sheets compared to 28.7 percent
in the rural areas of the Metropolis.
Table 8.6: Main construction material for roofing of dwelling unit by type of locality
Main roofing material
Total Total
Urban Rural Country Region Number Percent
Total 5,817,607 567,051
41,308 100.0 100.0 100.0
Mud/mud bricks/earth 80,644 2,568
100 0.2 0.3 0.2
Wood 45,547 3,047
240 0.6 0.7 0.3
Metal sheet 4,152,259 369,829
11,056 26.8 26.1 28.7
Slate/asbestos 759,039 146,526
25,209 61.0 60.2 63.4
Cement/concrete 141,072 10,824
3,567 8.6 10.7 2.5
Roofing tile 31,456 1,892
217 0.5 0.5 0.7
Bamboo 71,049 9,912
151 0.4 0.4 0.3
Thatch/palm leaf or raffia 500,606 19,317
513 1.2 0.7 3.0
Other 35,935 3,136 255 0.6 0.5 0.9 Source Ghana Statistical Service, 2010 Population and Housing Census
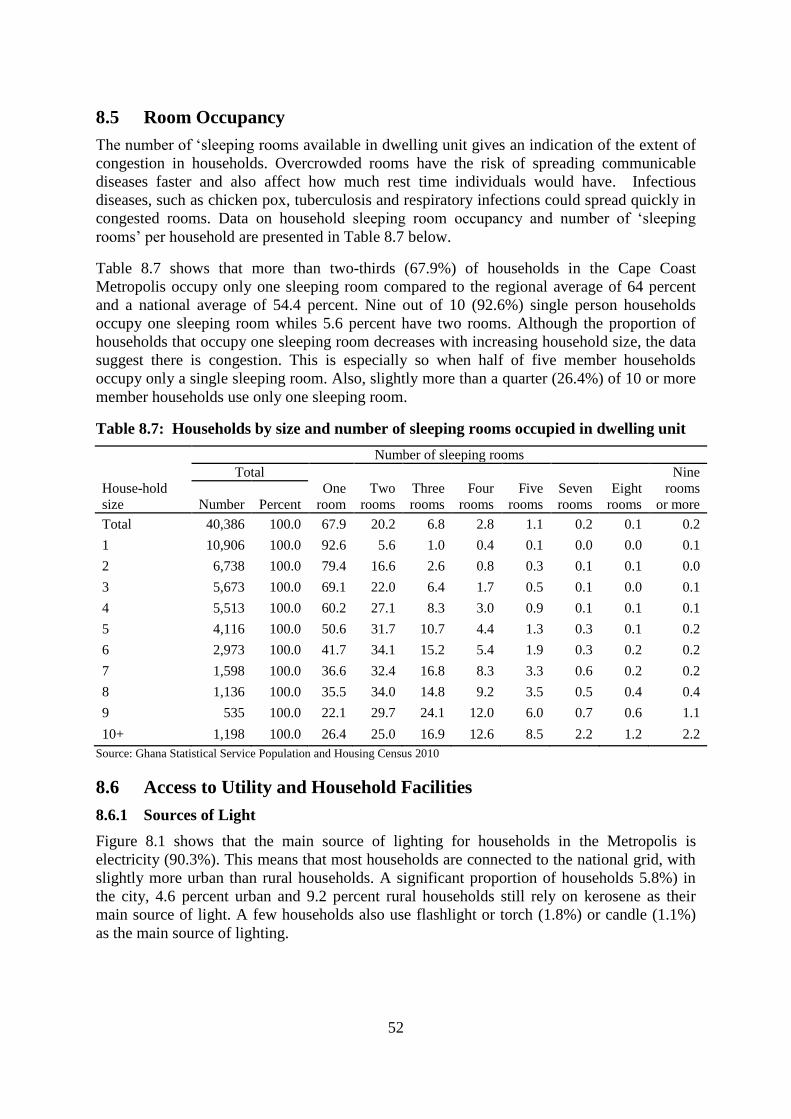
52
8.5 Room Occupancy
The number of ‘sleeping rooms available in dwelling unit gives an indication of the extent of
congestion in households. Overcrowded rooms have the risk of spreading communicable
diseases faster and also affect how much rest time individuals would have. Infectious
diseases, such as chicken pox, tuberculosis and respiratory infections could spread quickly in
congested rooms. Data on household sleeping room occupancy and number of ‘sleeping
rooms’ per household are presented in Table 8.7 below.
Table 8.7 shows that more than two-thirds (67.9%) of households in the Cape Coast
Metropolis occupy only one sleeping room compared to the regional average of 64 percent
and a national average of 54.4 percent. Nine out of 10 (92.6%) single person households
occupy one sleeping room whiles 5.6 percent have two rooms. Although the proportion of
households that occupy one sleeping room decreases with increasing household size, the data
suggest there is congestion. This is especially so when half of five member households
occupy only a single sleeping room. Also, slightly more than a quarter (26.4%) of 10 or more
member households use only one sleeping room.
Table 8.7: Households by size and number of sleeping rooms occupied in dwelling unit
House-hold
size
Number of sleeping rooms
Total
One
room
Two
rooms
Three
rooms
Four
rooms
Five
rooms
Seven
rooms
Eight
rooms
Nine
rooms
or more Number Percent
Total 40,386 100.0 67.9 20.2 6.8 2.8 1.1 0.2 0.1 0.2
1 10,906 100.0 92.6 5.6 1.0 0.4 0.1 0.0 0.0 0.1
2 6,738 100.0 79.4 16.6 2.6 0.8 0.3 0.1 0.1 0.0
3 5,673 100.0 69.1 22.0 6.4 1.7 0.5 0.1 0.0 0.1
4 5,513 100.0 60.2 27.1 8.3 3.0 0.9 0.1 0.1 0.1
5 4,116 100.0 50.6 31.7 10.7 4.4 1.3 0.3 0.1 0.2
6 2,973 100.0 41.7 34.1 15.2 5.4 1.9 0.3 0.2 0.2
7 1,598 100.0 36.6 32.4 16.8 8.3 3.3 0.6 0.2 0.2
8 1,136 100.0 35.5 34.0 14.8 9.2 3.5 0.5 0.4 0.4
9 535 100.0 22.1 29.7 24.1 12.0 6.0 0.7 0.6 1.1
10+ 1,198 100.0 26.4 25.0 16.9 12.6 8.5 2.2 1.2 2.2
Source: Ghana Statistical Service Population and Housing Census 2010
8.6 Access to Utility and Household Facilities
8.6.1 Sources of Light
Figure 8.1 shows that the main source of lighting for households in the Metropolis is
electricity (90.3%). This means that most households are connected to the national grid, with
slightly more urban than rural households. A significant proportion of households 5.8%) in
the city, 4.6 percent urban and 9.2 percent rural households still rely on kerosene as their
main source of light. A few households also use flashlight or torch (1.8%) or candle (1.1%)
as the main source of lighting.

53
Figure 8.1: Sources of light
Source: Ghana Statistical Service, 2010 Population and Housing Census
8.6.2 Sources of cooking fuel
The type of cooking fuel used in a society may sustain or destroy the environment if not
properly managed. Figure 8.2 presents the various sources of cooking fuel in the Cape Coast
Metropolis. It shows that the main source of fuel for cooking in the Metropolis is charcoal
(58.6%), with slightly more urban households than rural households. Liquefied petroleum
gas (30.6%) is also widely used by households with no difference between urban and rural
households. Except for the use of wood not many differences are observed in the proportion
of urban and rural households in the use of all the other fuel sources.
Figure 8.2: Sources of cooking fuel
Source: Ghana Statistical Service, 2010 Population and Housing Census

54
8.7 Main Sources of Water
The main source of drinking water and water for other domestic use by the population of the
Cape Coast Metropolis is pipe-borne water. Figure 8.3 and Table 8.8 show the various
sources of drinking water and water for other domestic purposes in the Metropolis. The chart
shows that one-third (33.0%) of the water used by households is pipe-borne inside their
dwelling units; 37.7 percent of urban households compared with 18.8 percent rural
households. More rural households (26.0%) in the Metropolis have their main source outside
the dwelling unit than urban households (14.8%). Furthermore, 32.0 percent of the urban
households and 35.6 percent rural households depend on public taps or stand pipes for their
main source of drinking water. The use of sachet water has in recent times gained popularity
in the country and Cape Coast is no exception. In the Cape Coast Metropolis, 16.7 percent of
rural households and 13.5 percent of urban households depend on sachet water as their main
drinking water. Over 80 percent of households depend on pipe-borne or public tabs for other
domestic purposes.
Figure 8.3: Main source of drinking water by locality of residence
Source: Ghana Statistical Service, 2010 Population and Housing Census
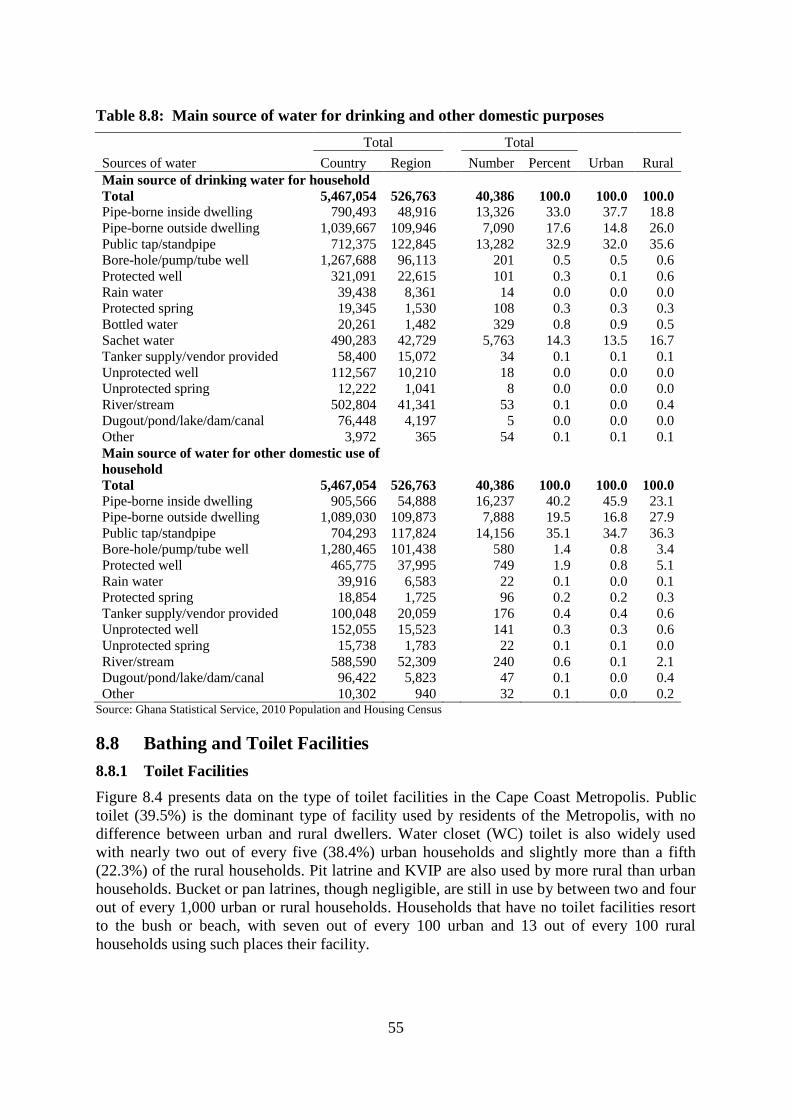
55
Table 8.8: Main source of water for drinking and other domestic purposes
Sources of water
Total Total
Urban Rural Country Region Number Percent
Main source of drinking water for household
Total 5,467,054 526,763
40,386 100.0 100.0 100.0
Pipe-borne inside dwelling 790,493 48,916
13,326 33.0 37.7 18.8
Pipe-borne outside dwelling 1,039,667 109,946
7,090 17.6 14.8 26.0
Public tap/standpipe 712,375 122,845
13,282 32.9 32.0 35.6
Bore-hole/pump/tube well 1,267,688 96,113
201 0.5 0.5 0.6
Protected well 321,091 22,615
101 0.3 0.1 0.6
Rain water 39,438 8,361
14 0.0 0.0 0.0
Protected spring 19,345 1,530
108 0.3 0.3 0.3
Bottled water 20,261 1,482
329 0.8 0.9 0.5
Sachet water 490,283 42,729
5,763 14.3 13.5 16.7
Tanker supply/vendor provided 58,400 15,072
34 0.1 0.1 0.1
Unprotected well 112,567 10,210
18 0.0 0.0 0.0
Unprotected spring 12,222 1,041
8 0.0 0.0 0.0
River/stream 502,804 41,341
53 0.1 0.0 0.4
Dugout/pond/lake/dam/canal 76,448 4,197
5 0.0 0.0 0.0
Other 3,972 365
54 0.1 0.1 0.1
Main source of water for other domestic use of
household
Total 5,467,054 526,763
40,386 100.0 100.0 100.0
Pipe-borne inside dwelling 905,566 54,888
16,237 40.2 45.9 23.1
Pipe-borne outside dwelling 1,089,030 109,873
7,888 19.5 16.8 27.9
Public tap/standpipe 704,293 117,824
14,156 35.1 34.7 36.3
Bore-hole/pump/tube well 1,280,465 101,438
580 1.4 0.8 3.4
Protected well 465,775 37,995
749 1.9 0.8 5.1
Rain water 39,916 6,583
22 0.1 0.0 0.1
Protected spring 18,854 1,725
96 0.2 0.2 0.3
Tanker supply/vendor provided 100,048 20,059
176 0.4 0.4 0.6
Unprotected well 152,055 15,523
141 0.3 0.3 0.6
Unprotected spring 15,738 1,783
22 0.1 0.1 0.0
River/stream 588,590 52,309
240 0.6 0.1 2.1
Dugout/pond/lake/dam/canal 96,422 5,823
47 0.1 0.0 0.4
Other 10,302 940 32 0.1 0.0 0.2 Source: Ghana Statistical Service, 2010 Population and Housing Census
8.8 Bathing and Toilet Facilities
8.8.1 Toilet Facilities
Figure 8.4 presents data on the type of toilet facilities in the Cape Coast Metropolis. Public
toilet (39.5%) is the dominant type of facility used by residents of the Metropolis, with no
difference between urban and rural dwellers. Water closet (WC) toilet is also widely used
with nearly two out of every five (38.4%) urban households and slightly more than a fifth
(22.3%) of the rural households. Pit latrine and KVIP are also used by more rural than urban
households. Bucket or pan latrines, though negligible, are still in use by between two and four
out of every 1,000 urban or rural households. Households that have no toilet facilities resort
to the bush or beach, with seven out of every 100 urban and 13 out of every 100 rural
households using such places their facility.

56
Figure 8.4: Type of toilet facility used by household by type of locality
7.1
38.4
3.5
9.5
0.4
40.2
0.9
13.0
22.3
9.714.9
0.2
39.4
0.60.0
5.0
10.0
15.0
20.0
25.0
30.0
35.0
40.0
45.0
Pe
rce
nt
Toilet facility type
Urban Rural
Source: Ghana Statistical Service, 2010 Population and Housing Census
8.8.2 Bathing Facilities
Figure 8.5 shows that nearly half (48.3%) of the households in the urban areas of the
Metropolis use shared separate bathrooms in the same house, compared with 29.6 percent in
rural areas. Also, it is revealed that slightly more than one-fifth (22.3%) of urban or rural
households have exclusive uses of their own bathrooms. A high proportion of households in
rural areas (26.8%) use shared open cubicle for bathing compared with urban areas (15.8%).
The proportion of households that use a facility in another house is slightly higher in rural
settlements of the Metropolis than the urban areas.
Figure 8.5: Bathing facilities used by household by type of locality
22.5
48.3
2.7
15.8
4.72.3 2.8
0.1
22.1
29.6
5.5
26.8
4.56.3 4.4
0.6
0.0
10.0
20.0
30.0
40.0
50.0
60.0
Pe
rce
nt
Urban Rurual
Bathing facility
Source: Ghana Statistical Service, 2010 Population and Housing Census

57
8.9 Methods of Waste Disposal
Waste disposal, especially solid waste, has remained a challenge to many localities in Ghana.
MMDAs in the last decade have resorted to the use private waste management companies to
manage solid waste in communities, especially urban communities.
8.9.1 Solid waste disposal
Table 8.9 shows that 56.7 percent of households in the Cape Coast Metropolis dump their
solid waste in public containers and 21.9 percent dump theirs in open spaces. Wide variations
are observed among rural and urban households. Whiles two-thirds of urban households
(67.1%) dump their solid waste in public containers; only a quarter of rural households
(25.0%) use this facility. Instead, most rural households (48.7%) depend on public open
dumping sites for solid waste disposal. Only one out of every 200 households (5.5%) have
their solid waste collected, usually by a waste management company.
8.9.2 Liquid waste disposal
Table 37 shows that liquid waste in the Cape Coast Metropolis (36%) is mostly thrown into
gutters, and 25.6 percent passes through a drainage system into gutters. Only 3.5 percent of
liquid waste is through the sewerage system. In rural areas liquid waste is mostly thrown onto
compounds (34%), or thrown onto streets or outside (31.1%). However, 18.8 percent throw
liquid waste into gutters. A higher proportion of households in rural areas (3.9%) dispose of
liquid waste through drainage into a pit (soak away) compared with urban areas (2.7%).
Table 8.9: Method of solid and liquid waste disposal by type of locality
Method of waste disposal
Total
District
Total
Urban Rural Country Region Number Percent
Total 5,467,054 526,763
40,386 100.0 100.0 100.0
Collected 785,889 20,490
2,202 5.5 6.1 3.3
Burned by household 584,820 70,553
3,705 9.2 7.6 13.8
Public dump (container) 1,299,654 98,454
22,887 56.7 67.1 25.0
Public dump (open space) 2,061,403 283,454
8,833 21.9 13.0 48.7
Dumped indiscriminately 498,868 28,334
882 2.2 1.3 4.8
Buried by household 182,615 17,727
718 1.8 1.4 3.1
Other 53,805 7,751
1,159 2.9 3.4 1.2
Liquid waste
Total 5,467,054 526,763
40,386 100.0 100.0 100.0
Through the sewerage system 183,169 6,670
1,418 3.5 4.1 1.8
Through drainage system into a gutter 594,404 35,183
10,320 25.6 30.8 9.8
Through drainage into a pit (soak away) 167,555 9,059
1,219 3.0 2.7 3.9
Thrown onto the street/outside 1,538,550 163,838
4,930 12.2 6.0 31.1
Thrown into gutter 1,020,096 89,199
14,525 36.0 41.7 18.8
Thrown onto compound 1,924,986 216,209
7,252 18.0 12.6 34.0
Other 38,294 6,605 722 1.8 2.2 0.6 Source: Ghana Statistical Service, 2010 Population and Housing Census

58
CHAPTER NINE
SUMMARY OF FINDINGS, CONCLUSIONS AND POLICY
IMPLICATIONS
9.1 Introduction
This chapter presents the summary of the main findings of the analysis of the demographic
and socio-economic characteristics of the population of the Cape Coast Metropolis as was
captured by the 2010 PHC and conclusions based on the results are presented and policy
implications outlined.
9.2 Summary
Demographic Characteristics
The report shows that the population of the Cape Coast Metropolis is 169,894, accounting for
about 7.7 percent of the total population of the Central Regional. The population is made up
of 82,810 males and 87,084 females yielding a sex ratio of 95 males for every 100 females.
The Metropolis is predominantly urban with three-quarters of its population living in urban
areas.
The age and sex structure of the population suggest that while there are slightly more males
than females for the population below 10 years, nearly 26 percent more females than males
are observed in the age group 15-19 year (73.6), which coincides with secondary school age
in the population. Subsequently, the proportion of males greatly exceed that of females in the
age group 20- 29 years; yielding sex ratios of 123.8 for those aged 20-24 and 108.2 among
those aged between 25 and 29 years. This may be reflective of the fact that there are more
males than females enrolled in our tertiary institutions, since persons in this age group are
more likely to be in such institutions. The age dependency ratio of 49.1 for the Metropolis
suggests that the economic burden on the working population is relatively smaller compared
with other districts of the region. These also suggest a relatively low fertility in the
Metropolis. Due to its unit position as a district endowed with several educational facilities,
two-fifth of the Metropolis population are migrants most of whom are students between the
ages of 15 and 29.
Social Characteristics
There are 40,386 households in the metropolis of which three-quarters (30,354) reside in
urban areas with the rest in rural settlements. One out every 13 households (7.7%) in the
Central Region are found in the Cape Coast Metropolis. With an average household size of
3.5 compared with four persons (4.0) per household in the region, there are more households
living in each house in Cape Coast (2.3) than in the region (1.5) on average. Out of 169,894
persons in the Metropolis, 82.6 percent (140,405) of them live in households whiles the rest
constitute non household population.
The extended family system is still widely practiced in the Metropolis with more than half
(52.3%) of all household members constituting different compositions of this system, whiles
47.7 percent constitute nuclear families. More than half (55.5%) of persons 12 years and

59
older in Cape Coast Metropolis are never married compared to the regional average of 42
percent. The married population is 29.8 percent is relative small compared to the regional
average of 42.9 percent. The data shows that a greater proportion of the residents in the
district (96.3%) are Ghanaians with 93.7 percent being Ghanaians by birth. The rest of the
population is made up of persons from ECOWAS countries (1.8%).
Nine out 10 persons in the Cape Coast Metropolis who are 11 years and older are literate, that
is, they can read and write. This is against a regional average of 78.2 percent and a national
average of 74.1 percent. Literacy is nearly universal among the youth population of the
Metropolis. The population in the age group 11-24 years have a literacy rate of about 97
percent. Male literacy rate in the Metropolis is 94.1 percent compared to the female literacy
rate of 85.6 percent. Among the population currently in school, more than one-third (34.4%)
are in tertiary institutions, 27 percent in primary, 13.1 percent in JHS and 11.4 percent in SHS
education. This confirms the earlier suggestion that most of the migrants in the Metropolis
are students. Whiles there are currently more males (40.4%) in tertiary institutions in the
Metropolis, a relatively smaller proportion of the females (28%) are in this level of education.
Contrarily, the proportion of females in primary, JHS and SHS is higher.
Economic Characteristics
The nature, type and size of the labour force are critical factors in the production of goods
and services. The information on labour force is also used to formulate employment policies,
to determine training needs. There are 121,654 persons 15 years and older made up of 54.7
percent economically active and 45.3 percent persons who are economically not active are in
the Metropolis. The economically active population (66,497) is made up of 90.7 percent
employed and 9.3 percent unemployed persons. The data further reveals that about four out of
five (83.1%) unemployed persons are below age 40, with slightly more males (84.0%) than
females (82.4%). The unemployment situation is more pronounced among the economically
active population below 30 years. Sixty-seven (67.3%) of the males and 65.3 percent of the
females in this age group are unemployed.
The main occupations of the population in the Cape Coast Metropolis shows that 32.5 percent
of the employed 15 years and older are service and sales workers, 23.6 percent are craft and
related trades workers, and 13.2 percent are professionals. Therefore, the wholesale and retail
trade industry is the largest in the Metropolis, engaging a quarter (25.1%) of the employed
population. The education and manufacturing industries each employ one out of seven
persons. The data shows that more than two-thirds (68.4%) of the employed population work
in the private informal sector whilst only one-fifth (21.4%) are public sector workers. The
private formal sector in the Metropolis engages only about one employed persons out of
every 10 (9.5%), with twice more males (13.3%) than females (5.9%). Whiles more than
three-quarters (77.6%) of all employed females are found in the private informal sector,
slightly more than half (58.4%) of their male counterparts are found in that sector
Information Communication Technology
The role of ICT in the economy of Ghana has been widely recognized though it has not been
fully experienced in all parts of the country. The recognition is reflected in the development
of a national ICT infrastructure, institutional and regulatory framework for managing. The
data reveals that seven out of every 10 (69.5%) persons 12 years and older in the Cape Coast
Metropolis own mobile phones compared to a regional average of 44.9 percent. Whiles
nearly three-quarters (74.1%) of the male population 12 years and older own mobile phones,
60
about two-thirds (65.2%) of their female counterparts own mobile phones. It is further
revealed that about one-third of the Metropolis population 12 years and older use internet.
The high proportion of the Metropolis population that use internet relative to the regional
average can be attributed to the student population of this area, especially those in the tertiary
institutions.
Disability
Over the past few decades there has been an international consensus on the recognition of the
rights of persons with disabilities with emphasis on the promotion of their dignity, and
inclusive development. Evidence is needed to make informed decisions on policies and
programmes. The data shows that 2.5 percent of the population of the Cape Coast have one
form of disability or the other. Whiles 2.4 percent are males, 2.6 percent are females. There
are more persons with disabilities in the urban areas (2.7%) than in the rural settlements
(1.9%) of the Metropolis. the most common disability among PWDs in the Metropolis are
sight (46.2%) and physical (26.9%) disabilities. Almost half (49.2%) female PWDs are
suffering from sight disability compared with 42.5 percent of their male counterparts.
The data further reveals that 88.9 percent of all PWDs in the Cape Coast Metropolis are aged
15 years and older. About two out of five (42.4%) of all PWDs 15 years and older in the
Metropolis are employed whiles slightly more than half (53.1%) are economically not active.
Among the economically active, 4.5 percent are unemployed, with slightly more males than
females. Also, About 44.5 percent of persons with disabilities in the Metropolis have attained
basic level educations, 28.4 have attained secondary or higher education, whereas one-quarter
(24.9%) have never been to school. Twice as many more female PWDs (33.5%) than their
male counterparts (14.8%) have never been to school.
Agricultural Activities
Ghana’s economy is generally regarded as agrarian, largely due to the sector’s contribution to
Gross Domestic Product (GDP), labour absorption and to foreign exchange earnings. Only
one tenth (10.3%) of the total households in the Metropolis are engaged in agricultural
activities, with 18.7 percent being rural households. The proportion of rural non-agricultural
households in the Metropolis suggest that its economy non agrarian. Out of a total of are
4,141 households in the Cape Coast Metropolis that are into agriculture, more than three-
quarters (76.6%) are involved in crop farming, 29.5 percent are in livestock rearing whereas
less than one percent (0.5%) are into fish farming.
Housing Characteristics
The provision of periodic information on housing and housing conditions is therefore
important both to assess what has been achieved and to plan ahead. There are 17,738 houses
representing five percent of the total number of houses in the Central Region although the
Metropolis is home to about seven percent (140,405) of the region’s household population.
While 66.7 percent of the houses are in the urban areas of the Metropolis, it is home to 75
percent (105,414) of the household population. On the average, there 2.3 household per house
in the Cape Coast Metropolis compared to a regional average of 1.5.
More than half (58.2%) of households in the Metropolis live in compound houses while 17
percent use separate houses. The data shows that more than one-third (35%) of the
households in the Cape Coast Metropolis own their dwelling, 22.5 percent of the dwelling
61
units belong to another relative who is not a member of the household, only 4.8 percent of
households live in state buildings.
More than two-thirds (67.9%) of households in the Cape Coast Metropolis occupy only one
sleeping room compared to the regional average of 64 percent and a national average of 54.4
percent. Nine out of 10 (92.6%) single person households occupy one sleeping room whiles
5.6 percent have two rooms. Although the proportion of households that occupy one sleeping
room decreases with increasing household size, the data suggest there is congestion. This is
especially so when half of five member households occupy only a single sleeping room. Also,
slightly more than a quarter (26.4%) of 10 or more member households use only one sleeping
room.
It is further established that the main source of lighting for households in the Metropolis is
electricity (90.3%). This means that most households are connected to the national grid, with
slightly more urban than rural households. One-third (33.0%) of the water used by
households is pipe-borne inside their dwelling units; 37.7 percent of urban households
compared with 18.8 percent rural households. Public toilet (39.5%) is the dominant type of
facility used by residents of the Metropolis, and households that have no toilet facilities resort
to the bush or beach, with seven out of every 100 urban and 13 out of every 100 rural
households using such places their facility. More than half (56.7%) of households in the Cape
Coast Metropolis dump their solid waste in public containers and 21.9 percent dump theirs in
open spaces.
9.3 Recommendations
The overall level of development and demographic structure in the country conceals very
marked differences between and within regions, districts, rural and urban areas. It was to
effectively address the imbalance in development that the decentralization programme was
initiated in 1984 with the District Assemblies established to “initiate and coordinate the
processes of planning, programming, budgeting and implementation of district plans,
programmes and projects” relevant to the needs of particular districts and communities. Most
of the social and economic indicators discussed suggest that the Metropolis is one of the most
developed in the Region.
The following recommendations are made based on the findings of the report:
Demographic characteristics
The age and structure of the population shows a relatively young population, which has the
potential for further growth. The results may have serious cost implications for the provision of
social services, particularly education and health. It is therefore recommended that the integration
of population variables which has the potential of stalling the rate of growth of the population
such as effective family planning methods be considered a priority in the district development
planning.
Social characteristics (household composition and structure)
It seems that the ideal housing situation is an average of about four rooms per household. If
room occupancy is examined from the angle of crowding, it is revealed that two rooms is the
minimum for a household of five persons. It is, however, evident from the data that most

62
households’ size of five or more has more inadequate sleeping rooms, particularly when
personal property and household belongings occupy a sizable portion of sleeping rooms.
To measure crowding, it is necessary to calculate the number of persons per room. In general,
one person per room may be regarded as desirable and three or more persons per room may
be defined as “crowded” housing. By this definition, therefore, the Metropolis is crowded.
Economic implications
Sustained efforts need to be intensified and focused towards modernization of agricultural
production, using appropriate technologies to increase productivity and output. The sizes of
industries need to be carefully assessed vis-à-vis the available market so that the appropriate
technology and the right proportions of factor inputs are employed. Attempts at producing the
requisite middle-level manpower, through the establishment of Polytechnics, must be
sustained and strengthened to enhance technological proficiency.
An optimum strategy for reducing migration in the region and increasing rural income would
be to:
increase the private component of rural income by creating jobs, by direct income
policy, by tax reductions or by price policy and or
b) increase the social component of rural income by investing in infrastructure,
especially rural and urban roads, in the district
63
REFERENCES
Ghana Federation of the Disabled, Disability Situation in Ghana, October 2013,
http://www.gfdgh.org/disabilitysituationinghana.html.
Ghana Statistical Service, 2010 Population and Housing Census, National Analytical Report,
May 2013
Ghana Statistical Service, 2010 Population and Housing Census, Central Regional Analytical
Report.
Ghana Statistical Service, Census 2010 Summary Results of Final Report
Kpedekpo, G.M.K, 1982, Essentials of Demographic Analysis for Africa, Heinemann
Educational Books INC
Kwatei, Nana Kwaku Kwankye, The Ghanaian (African) Extended Family (System) April
2009,www.ghanaweb.com.
Opoku, Robert Mensah, Ghana and ICT: Strides Challenges and Way forward,
www.ghanaweb.com.
Persons with Disability Act, 2006, Act 715
Population Reference Bureau, Population Handbook 2011
Siegel, J.S and Swanson, D.A, (2004), Methods and Materials of Demographer, Elsevier
Academic Press, USA
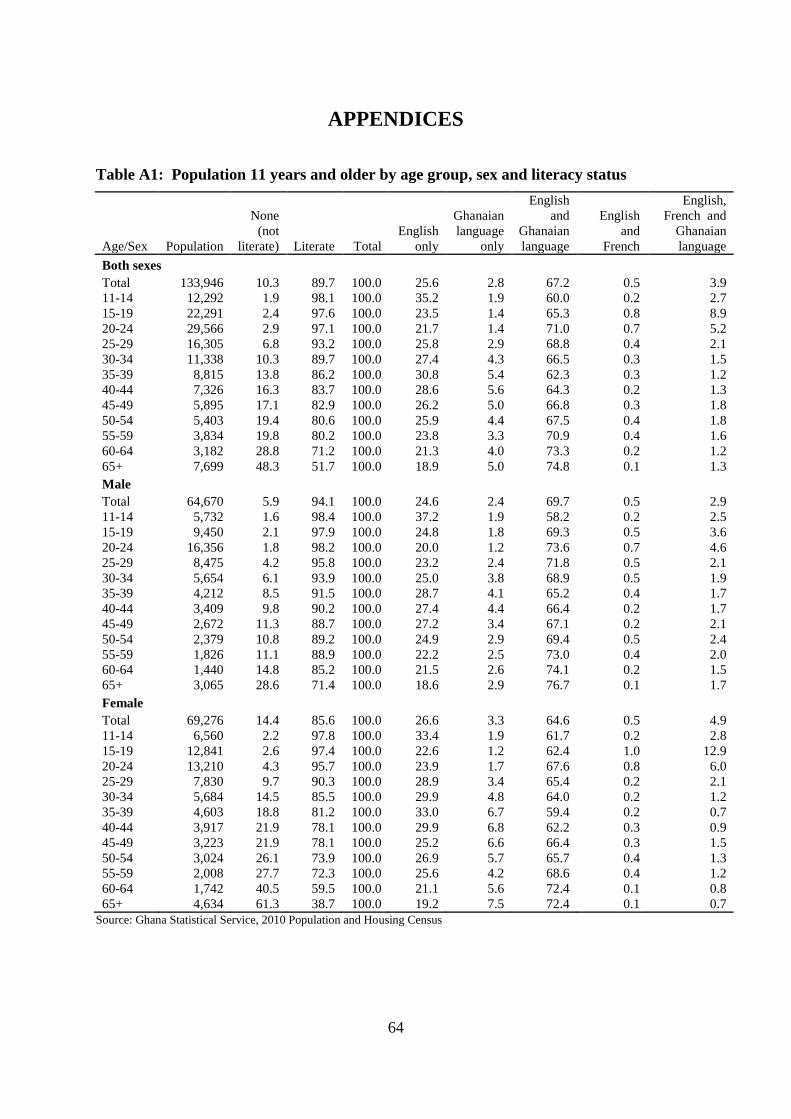
64
APPENDICES
Table A1: Population 11 years and older by age group, sex and literacy status
Age/Sex Population
None
(not
literate) Literate Total
English
only
Ghanaian
language
only
English
and
Ghanaian
language
English
and
French
English,
French and
Ghanaian
language
Both sexes
Total 133,946 10.3 89.7 100.0 25.6 2.8 67.2 0.5 3.9
11-14 12,292 1.9 98.1 100.0 35.2 1.9 60.0 0.2 2.7
15-19 22,291 2.4 97.6 100.0 23.5 1.4 65.3 0.8 8.9
20-24 29,566 2.9 97.1 100.0 21.7 1.4 71.0 0.7 5.2
25-29 16,305 6.8 93.2 100.0 25.8 2.9 68.8 0.4 2.1
30-34 11,338 10.3 89.7 100.0 27.4 4.3 66.5 0.3 1.5
35-39 8,815 13.8 86.2 100.0 30.8 5.4 62.3 0.3 1.2
40-44 7,326 16.3 83.7 100.0 28.6 5.6 64.3 0.2 1.3
45-49 5,895 17.1 82.9 100.0 26.2 5.0 66.8 0.3 1.8
50-54 5,403 19.4 80.6 100.0 25.9 4.4 67.5 0.4 1.8
55-59 3,834 19.8 80.2 100.0 23.8 3.3 70.9 0.4 1.6
60-64 3,182 28.8 71.2 100.0 21.3 4.0 73.3 0.2 1.2
65+ 7,699 48.3 51.7 100.0 18.9 5.0 74.8 0.1 1.3
Male
Total 64,670 5.9 94.1 100.0 24.6 2.4 69.7 0.5 2.9
11-14 5,732 1.6 98.4 100.0 37.2 1.9 58.2 0.2 2.5
15-19 9,450 2.1 97.9 100.0 24.8 1.8 69.3 0.5 3.6
20-24 16,356 1.8 98.2 100.0 20.0 1.2 73.6 0.7 4.6
25-29 8,475 4.2 95.8 100.0 23.2 2.4 71.8 0.5 2.1
30-34 5,654 6.1 93.9 100.0 25.0 3.8 68.9 0.5 1.9
35-39 4,212 8.5 91.5 100.0 28.7 4.1 65.2 0.4 1.7
40-44 3,409 9.8 90.2 100.0 27.4 4.4 66.4 0.2 1.7
45-49 2,672 11.3 88.7 100.0 27.2 3.4 67.1 0.2 2.1
50-54 2,379 10.8 89.2 100.0 24.9 2.9 69.4 0.5 2.4
55-59 1,826 11.1 88.9 100.0 22.2 2.5 73.0 0.4 2.0
60-64 1,440 14.8 85.2 100.0 21.5 2.6 74.1 0.2 1.5
65+ 3,065 28.6 71.4 100.0 18.6 2.9 76.7 0.1 1.7
Female
Total 69,276 14.4 85.6 100.0 26.6 3.3 64.6 0.5 4.9
11-14 6,560 2.2 97.8 100.0 33.4 1.9 61.7 0.2 2.8
15-19 12,841 2.6 97.4 100.0 22.6 1.2 62.4 1.0 12.9
20-24 13,210 4.3 95.7 100.0 23.9 1.7 67.6 0.8 6.0
25-29 7,830 9.7 90.3 100.0 28.9 3.4 65.4 0.2 2.1
30-34 5,684 14.5 85.5 100.0 29.9 4.8 64.0 0.2 1.2
35-39 4,603 18.8 81.2 100.0 33.0 6.7 59.4 0.2 0.7
40-44 3,917 21.9 78.1 100.0 29.9 6.8 62.2 0.3 0.9
45-49 3,223 21.9 78.1 100.0 25.2 6.6 66.4 0.3 1.5
50-54 3,024 26.1 73.9 100.0 26.9 5.7 65.7 0.4 1.3
55-59 2,008 27.7 72.3 100.0 25.6 4.2 68.6 0.4 1.2
60-64 1,742 40.5 59.5 100.0 21.1 5.6 72.4 0.1 0.8
65+ 4,634 61.3 38.7 100.0 19.2 7.5 72.4 0.1 0.7
Source: Ghana Statistical Service, 2010 Population and Housing Census
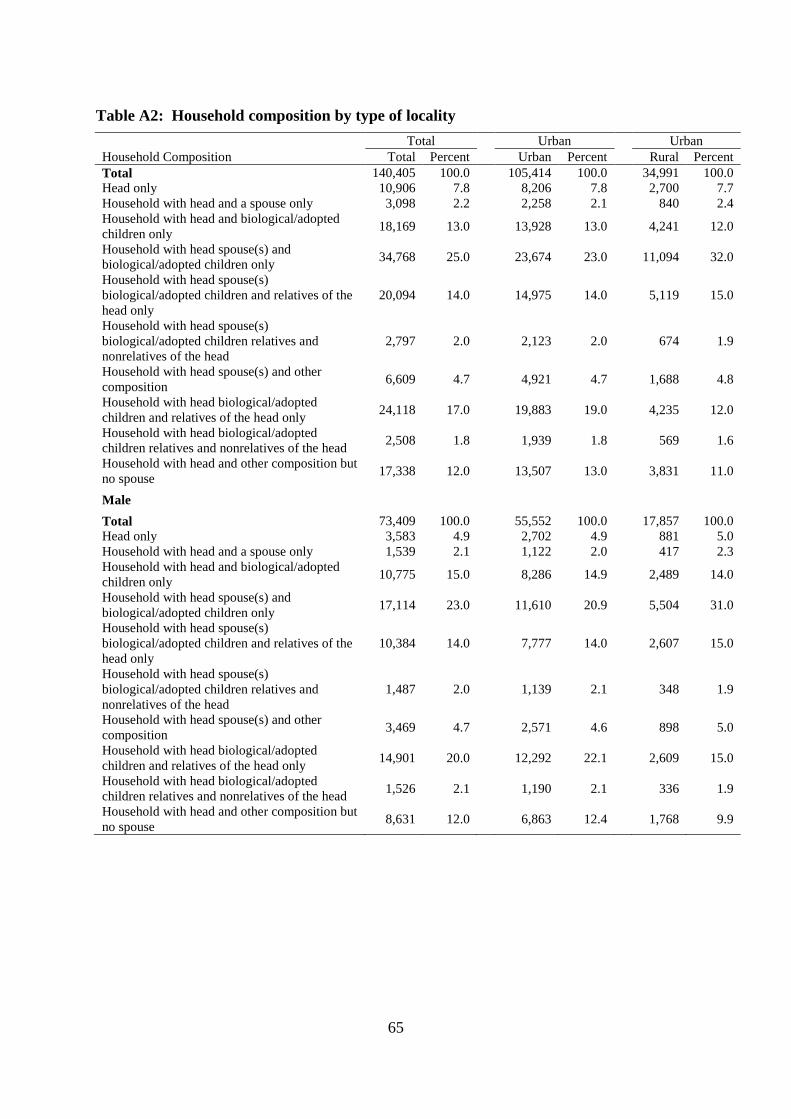
65
Table A2: Household composition by type of locality
Household Composition
Total Urban Urban
Total Percent Urban Percent Rural Percent
Total 140,405 100.0
105,414 100.0
34,991 100.0
Head only 10,906 7.8
8,206 7.8
2,700 7.7
Household with head and a spouse only 3,098 2.2
2,258 2.1
840 2.4
Household with head and biological/adopted
children only 18,169 13.0
13,928 13.0
4,241 12.0
Household with head spouse(s) and
biological/adopted children only 34,768 25.0
23,674 23.0
11,094 32.0
Household with head spouse(s)
biological/adopted children and relatives of the
head only
20,094 14.0
14,975 14.0
5,119 15.0
Household with head spouse(s)
biological/adopted children relatives and
nonrelatives of the head
2,797 2.0
2,123 2.0
674 1.9
Household with head spouse(s) and other
composition 6,609 4.7
4,921 4.7
1,688 4.8
Household with head biological/adopted
children and relatives of the head only 24,118 17.0
19,883 19.0
4,235 12.0
Household with head biological/adopted
children relatives and nonrelatives of the head 2,508 1.8
1,939 1.8
569 1.6
Household with head and other composition but
no spouse 17,338 12.0
13,507 13.0
3,831 11.0
Male
Total 73,409 100.0
55,552 100.0
17,857 100.0
Head only 3,583 4.9
2,702 4.9
881 5.0
Household with head and a spouse only 1,539 2.1
1,122 2.0
417 2.3
Household with head and biological/adopted
children only 10,775 15.0
8,286 14.9
2,489 14.0
Household with head spouse(s) and
biological/adopted children only 17,114 23.0
11,610 20.9
5,504 31.0
Household with head spouse(s)
biological/adopted children and relatives of the
head only
10,384 14.0
7,777 14.0
2,607 15.0
Household with head spouse(s)
biological/adopted children relatives and
nonrelatives of the head
1,487 2.0
1,139 2.1
348 1.9
Household with head spouse(s) and other
composition 3,469 4.7
2,571 4.6
898 5.0
Household with head biological/adopted
children and relatives of the head only 14,901 20.0
12,292 22.1
2,609 15.0
Household with head biological/adopted
children relatives and nonrelatives of the head 1,526 2.1
1,190 2.1
336 1.9
Household with head and other composition but
no spouse 8,631 12.0
6,863 12.4
1,768 9.9
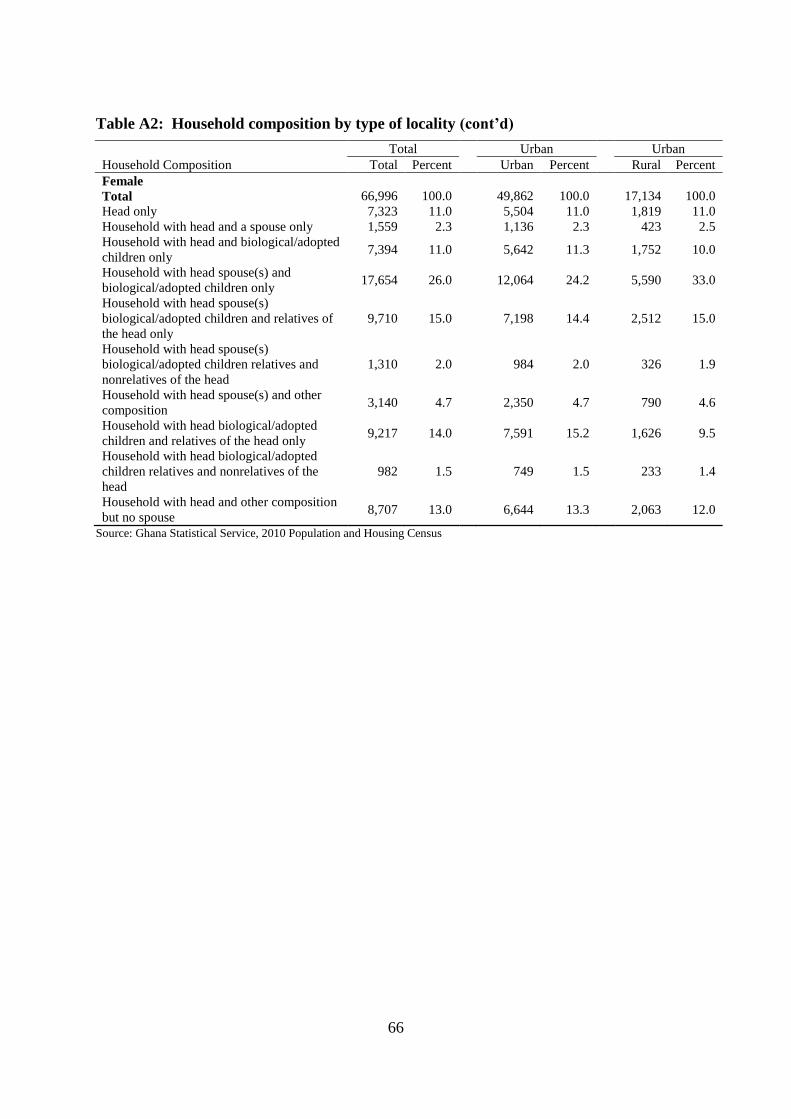
66
Table A2: Household composition by type of locality (cont’d)
Household Composition
Total Urban Urban
Total Percent Urban Percent Rural Percent
Female Total 66,996 100.0
49,862 100.0
17,134 100.0
Head only 7,323 11.0
5,504 11.0
1,819 11.0
Household with head and a spouse only 1,559 2.3
1,136 2.3
423 2.5
Household with head and biological/adopted
children only 7,394 11.0
5,642 11.3
1,752 10.0
Household with head spouse(s) and
biological/adopted children only 17,654 26.0
12,064 24.2
5,590 33.0
Household with head spouse(s)
biological/adopted children and relatives of
the head only
9,710 15.0
7,198 14.4
2,512 15.0
Household with head spouse(s)
biological/adopted children relatives and
nonrelatives of the head
1,310 2.0
984 2.0
326 1.9
Household with head spouse(s) and other
composition 3,140 4.7
2,350 4.7
790 4.6
Household with head biological/adopted
children and relatives of the head only 9,217 14.0
7,591 15.2
1,626 9.5
Household with head biological/adopted
children relatives and nonrelatives of the
head
982 1.5
749 1.5
233 1.4
Household with head and other composition
but no spouse 8,707 13.0 6,644 13.3 2,063 12.0
Source: Ghana Statistical Service, 2010 Population and Housing Census

67
Table A3: Persons 12 years and older by sex, age-group and marital status
Sex/Age-
group Number Total
Never
married
Informal/
Consensual
union/Living
together Married Separated Divorced Widowed
Both Sexes
Total 131,136 100.0 55.5 4.9 29.8 1.7 3.9 4.2 10 - 14 9,482 100.0 94.7 0.7 4.6 0.0 0.0 0.0
15 - 19 22,291 100.0 94.8 1.8 3.1 0.1 0.1 0.1
20 - 24 29,566 100.0 87.8 5.1 6.5 0.3 0.3 0.1
25 - 29 16,305 100.0 60.3 9.2 28.2 0.9 1.1 0.3
30 - 34 11,338 100.0 29.9 8.8 55.0 1.9 3.4 1.0
35 - 39 8,815 100.0 15.7 8.1 66.4 2.7 5.4 1.7
40 - 44 7,326 100.0 9.2 6.4 69.1 3.5 8.3 3.5
45 - 49 5,895 100.0 6.8 5.5 68.1 4.1 10.4 5.2
50 - 54 5,403 100.0 5.2 3.3 64.3 4.8 13.6 8.8
55 - 59 3,834 100.0 4.2 3.0 60.4 5.8 14.7 11.9
60 - 64 3,182 100.0 3.5 2.0 54.8 5.7 16.4 17.5
65+ 7,699 100.0 6.1 1.6 36.4 4.5 12.3 39.2
Male
Total 63,325 100.0 61.3 4.6 29.5 1.1 2.2 1.3 10 - 14 4,387 100.0 94.2 0.6 5.2 0.0 0.0 0.0
15 - 19 9,450 100.0 95.8 1.0 3.0 0.0 0.1 0.1
20 - 24 16,356 100.0 93.9 2.9 2.9 0.1 0.1 0.0
25 - 29 8,475 100.0 73.6 8.2 17.1 0.4 0.5 0.1
30 - 34 5,654 100.0 38.6 9.2 49.2 1.0 1.6 0.3
35 - 39 4,212 100.0 19.1 9.2 67.0 1.5 2.5 0.8
40 - 44 3,409 100.0 10.5 7.1 74.1 2.3 4.6 1.4
45 - 49 2,672 100.0 7.4 6.4 77.1 2.2 5.4 1.5
50 - 54 2,379 100.0 5.4 4.1 77.3 2.4 8.3 2.5
55 - 59 1,826 100.0 4.7 3.4 75.4 4.6 8.0 4.0
60 - 64 1,440 100.0 3.1 3.0 71.8 4.9 12.3 4.9
65+ 3,065 100.0 8.5 2.1 59.3 5.0 10.7 14.4
Female
Total 67,811 100.0 50.0 5.2 30.2 2.3 5.4 6.9
10 - 14 5,095 100.0 95.2 0.7 4.1 0.0 0.0 0.0
15 - 19 12,841 100.0 94.0 2.4 3.2 0.1 0.1 0.1
20 - 24 13,210 100.0 80.2 7.7 10.9 0.6 0.4 0.3
25 - 29 7,830 100.0 45.9 10.3 40.3 1.4 1.6 0.5
30 - 34 5,684 100.0 21.3 8.4 60.7 2.7 5.2 1.7
35 - 39 4,603 100.0 12.7 7.0 65.9 3.8 8.0 2.7
40 - 44 3,917 100.0 8.1 5.7 64.7 4.5 11.6 5.3
45 - 49 3,223 100.0 6.3 4.7 60.7 5.6 14.5 8.2
50 - 54 3,024 100.0 5.1 2.7 54.0 6.7 17.7 13.7
55 - 59 2,008 100.0 3.8 2.7 46.7 7.0 20.8 19.1
60 - 64 1,742 100.0 3.8 1.2 40.8 6.4 19.7 28.0
65+ 4,634 100.0 4.5 1.2 21.2 4.2 13.3 55.6 Source: Ghana Statistical Service, 2010 Population and Housing census
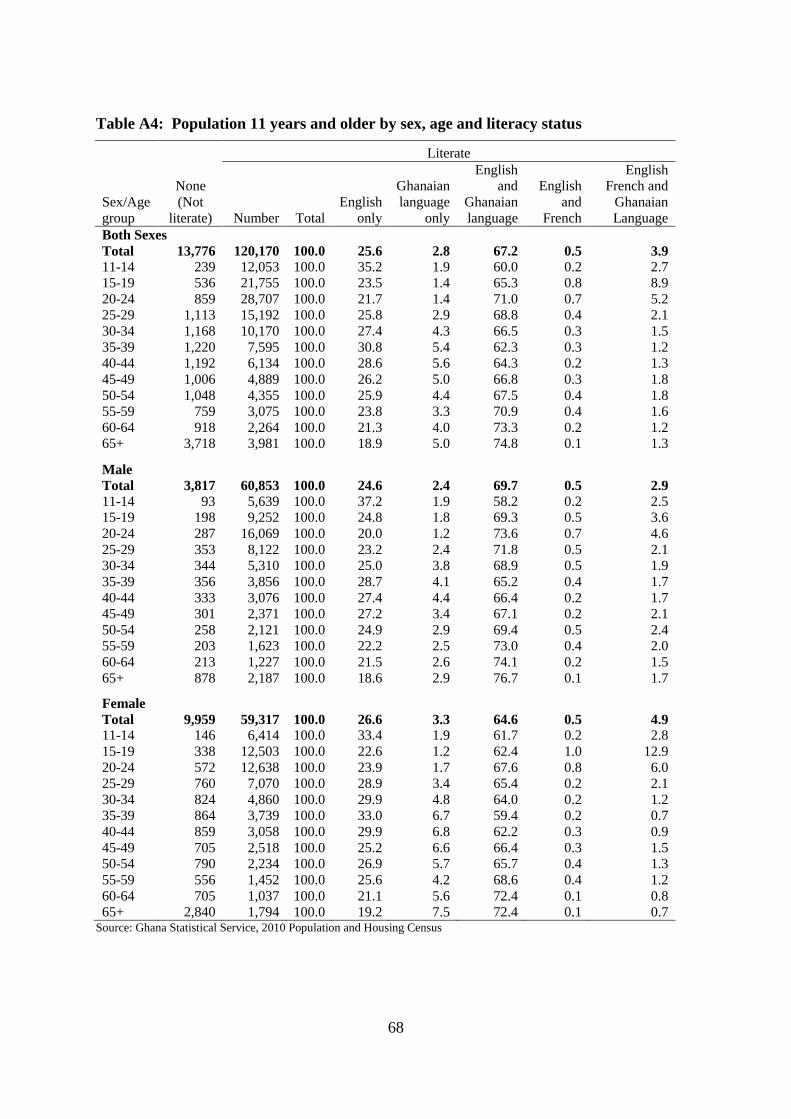
68
Table A4: Population 11 years and older by sex, age and literacy status
Sex/Age
group
None
(Not
literate)
Literate
Number Total
English
only
Ghanaian
language
only
English
and
Ghanaian
language
English
and
French
English
French and
Ghanaian
Language
Both Sexes
Total 13,776 120,170 100.0 25.6 2.8 67.2 0.5 3.9
11-14 239 12,053 100.0 35.2 1.9 60.0 0.2 2.7
15-19 536 21,755 100.0 23.5 1.4 65.3 0.8 8.9
20-24 859 28,707 100.0 21.7 1.4 71.0 0.7 5.2
25-29 1,113 15,192 100.0 25.8 2.9 68.8 0.4 2.1
30-34 1,168 10,170 100.0 27.4 4.3 66.5 0.3 1.5
35-39 1,220 7,595 100.0 30.8 5.4 62.3 0.3 1.2
40-44 1,192 6,134 100.0 28.6 5.6 64.3 0.2 1.3
45-49 1,006 4,889 100.0 26.2 5.0 66.8 0.3 1.8
50-54 1,048 4,355 100.0 25.9 4.4 67.5 0.4 1.8
55-59 759 3,075 100.0 23.8 3.3 70.9 0.4 1.6
60-64 918 2,264 100.0 21.3 4.0 73.3 0.2 1.2
65+ 3,718 3,981 100.0 18.9 5.0 74.8 0.1 1.3
Male Total 3,817 60,853 100.0 24.6 2.4 69.7 0.5 2.9
11-14 93 5,639 100.0 37.2 1.9 58.2 0.2 2.5
15-19 198 9,252 100.0 24.8 1.8 69.3 0.5 3.6
20-24 287 16,069 100.0 20.0 1.2 73.6 0.7 4.6
25-29 353 8,122 100.0 23.2 2.4 71.8 0.5 2.1
30-34 344 5,310 100.0 25.0 3.8 68.9 0.5 1.9
35-39 356 3,856 100.0 28.7 4.1 65.2 0.4 1.7
40-44 333 3,076 100.0 27.4 4.4 66.4 0.2 1.7
45-49 301 2,371 100.0 27.2 3.4 67.1 0.2 2.1
50-54 258 2,121 100.0 24.9 2.9 69.4 0.5 2.4
55-59 203 1,623 100.0 22.2 2.5 73.0 0.4 2.0
60-64 213 1,227 100.0 21.5 2.6 74.1 0.2 1.5
65+ 878 2,187 100.0 18.6 2.9 76.7 0.1 1.7
Female
Total 9,959 59,317 100.0 26.6 3.3 64.6 0.5 4.9 11-14 146 6,414 100.0 33.4 1.9 61.7 0.2 2.8
15-19 338 12,503 100.0 22.6 1.2 62.4 1.0 12.9
20-24 572 12,638 100.0 23.9 1.7 67.6 0.8 6.0
25-29 760 7,070 100.0 28.9 3.4 65.4 0.2 2.1
30-34 824 4,860 100.0 29.9 4.8 64.0 0.2 1.2
35-39 864 3,739 100.0 33.0 6.7 59.4 0.2 0.7
40-44 859 3,058 100.0 29.9 6.8 62.2 0.3 0.9
45-49 705 2,518 100.0 25.2 6.6 66.4 0.3 1.5
50-54 790 2,234 100.0 26.9 5.7 65.7 0.4 1.3
55-59 556 1,452 100.0 25.6 4.2 68.6 0.4 1.2
60-64 705 1,037 100.0 21.1 5.6 72.4 0.1 0.8
65+ 2,840 1,794 100.0 19.2 7.5 72.4 0.1 0.7 Source: Ghana Statistical Service, 2010 Population and Housing Census

69
Table A5: Population 3 years and older by sex, disability type and level of education
Sex/disability
type
Number Percent
Total Never
Pre-
Primary Basic
Sec/SHS
and higher Total Never
Pre-
Primary Basic
Sec/SHS
and higher
Both Sexes
Total 158,995 15,290 10,127 70,804 62,774
100.0 9.6 6.4 44.5 39.5
No disability 154,845 14,258 10,034 68,958 61,595
100.0 9.2 6.5 44.5 39.8
With a disability 4,150 1,032 93 1,846 1,179
100.0 24.9 2.2 44.5 28.4
Sight 1,922 421 26 822 653
100.0 21.9 1.4 42.8 34.0
Hearing 496 152 17 224 103
100.0 30.6 3.4 45.2 20.8
Speech 568 153 30 260 125
100.0 26.9 5.3 45.8 22.0
Physical 1,115 377 23 465 250
100.0 33.8 2.1 41.7 22.4
Intellectual 523 183 17 222 101
100.0 35.0 3.3 42.4 19.3
Emotional 512 150 12 205 145
100.0 29.3 2.3 40.0 28.3
Other 290 79 15 131 65
100.0 27.2 5.2 45.2 22.4
Male Total 77,305 4,562 5,192 33,532 34,019
100.0 5.9 6.7 43.4 44.0
No disability 75,385 4,278 5,143 32,629 33,335
100.0 5.7 6.8 43.3 44.2
With a disability 1,920 284 49 903 684
100.0 14.8 2.6 47.0 35.6
Sight 820 95 13 373 339
100.0 11.6 1.6 45.5 41.3
Hearing 232 44 5 121 62
100.0 19.0 2.2 52.2 26.7
Speech 328 64 17 161 86
100.0 19.5 5.2 49.1 26.2
Physical 529 99 14 234 182
100.0 18.7 2.6 44.2 34.4
Intellectual 269 77 6 114 72
100.0 28.6 2.2 42.4 26.8
Emotional 245 53 6 98 88
100.0 21.6 2.4 40.0 35.9
Other 134 21 11 57 45
100.0 15.7 8.2 42.5 33.6 Source: Ghana Statistical Service, 2010 Population and Housing Census

70
Table A5: Population 3 years and older by sex, disability type and level of education (cont’d)
Sex/disability
type
Number Percent
Total Never
Pre-
Primary Basic
Sec/SHS
and higher Total Never
Pre-
Primary Basic
Sec/SHS
and higher
Female
Total 81,690 10,728 4,935 37,272 28,755
100.0 13.1 6.0 45.6 35.2
No disability 79,460 9,980 4,891 36,329 28,260
100.0 12.6 6.2 45.7 35.6
With a
disability 2,230 748 44 943 495
100.0 33.5 2.0 42.3 22.2
Sight 1,102 326 13 449 314
100.0 29.6 1.2 40.7 28.5
Hearing 264 108 12 103 41
100.0 40.9 4.5 39.0 15.5
Speech 240 89 13 99 39
100.0 37.1 5.4 41.3 16.3
Physical 586 278 9 231 68
100.0 47.4 1.5 39.4 11.6
Intellectual 254 106 11 108 29
100.0 41.7 4.3 42.5 11.4
Emotional 267 97 6 107 57
100.0 36.3 2.2 40.1 21.3
Other 156 58 4 74 20 100.0 37.2 2.6 47.4 12.8 Source: Ghana Statistical Service, 2010 Population and Housing Census

71
Table A6: Employed population 15 years and older by employment status and sex
Employment sector
Both sexes Male Female
Number Percent Number Percent Number Percent
Total 60,330 100.0
28,900 100.0
31,430 100.0
Employee 23,556 39.0
15,340 53.1
8,216 26.1
Self-employed without
employee(s) 28,331 47.0
9,187 31.8
19,144 60.9
Self-employed with employee(s) 3,343 5.5
1,869 6.5
1,474 4.7
Casual worker 1,070 1.8
791 2.7
279 0.9
Contributing family worker 1,546 2.6
470 1.6
1,076 3.4
Apprentice 2,105 3.5
1,087 3.8
1,018 3.2
Domestic employee (househelp) 265 0.4
101 0.3
164 0.5
Other 114 0.2 55 0.2 59 0.2 Source: Ghana Statistical Service, 2010 Population and Housing Census
Table A7: Population by sex, number of household and houses in the 20
largest communities
S/No. Community Name Total Male Female
House
holds Houses
1 Cape Coast 108,374 52,526 55,848 26,956 10,230
2 Amamoma (Kwesipra) 7,689 4,352 3,337 436 260
3 Kakumdo
7,559 2,478 5,081 1,333 618
4 Ekon
5,506 2,810 2,696 1,450 758
5 Nkanfoa
4,683 2,259 2,424 1,361 728
6 Akotokyere 3,092 1,556 1,536 744 497
7 Anto Essuekyir 3,050 1,453 1,597 862 412
8 Kwapro
2,917 1,668 1,249 572 370
9 Kokoado
2,870 1,406 1,464 730 249
10 Apewosika 2,792 1,594 1,198 572 247
11 Ankaful Village 2,674 1,270 1,404 768 604
12 Senewin
1,662 892 770 261 178
13 Essuekyir
1,634 751 883 505 286
14 Amisano /Nanabakrom 1,501 758 743 367 179
15 Amoyaw
1,410 693 717 378 240
16 Duakor
1,351 649 702 337 236
17 Kwesipra/Amamoma 1,262 737 525 143 89
18 Amisano/Nanabakrom 1,177 632 545 301 134
19 Mpeasem
1,089 522 567 247 205
20 Ebobonko 961 510 451 251 154 Source: Ghana Statistical Service, 2010 Population and Housing Census

72
Table A8: Population by age group in the 20 largest communities
S/No. Community Name
All
ages 0-4 5-9 10-14 15-19 20-24 25-29 30-34 35-39 40-44 45-49 50-54 55-59 60-64 65-69 70-74 75+
1 Cape Coast 108,374 11,018 9,436 10,416 14,311 16,314 9,981 7,294 5,813 5,020 4,139 3,866 2,827 2,281 1,539 1,531 2,588
2 Amamoma
(Kwesipra) 7,689 297 230 225 523 4,572 1,001 310 146 95 81 60 34 30 21 28 36
3 Kakumdo 7,559 600 551 552 2,879 705 585 362 321 225 202 164 116 79 50 70 98
4 Ekon 5,506 767 736 724 639 541 396 317 286 269 180 186 84 80 63 95 143
5 Nkanfoa 4,683 677 535 539 461 416 425 393 303 219 155 152 111 90 62 56 89
6 Akotokyere 3,092 435 358 320 304 298 304 278 205 138 107 93 77 58 38 30 49
7 Anto Essuekyir 3,050 423 381 328 305 316 297 221 205 139 92 96 71 55 29 24 68
8 Kwapro 2,917 296 242 239 282 936 258 174 112 108 69 59 35 31 17 23 36
9 Kokoado 2,870 300 207 217 262 577 387 297 155 104 85 93 60 43 23 18 42
10 Apewosika 2,792 249 180 217 224 602 426 292 143 119 70 83 49 41 23 22 52
11 Ankaful Village 2,674 376 289 318 270 312 272 199 162 140 85 73 45 46 31 26 30
12 Senewin 1,662 138 75 107 106 675 251 68 52 44 26 22 14 24 11 22 27
13 Essuekyir 1,634 221 184 190 168 177 174 132 92 68 52 59 34 28 13 16 26
14 Amisano
/Nanabakrom 1,501 90 81 90 156 644 191 61 52 32 33 23 8 17 7 3 13
15 Amoyaw 1,410 176 144 157 124 178 144 102 98 59 56 47 29 32 23 16 25
16 Duakor 1,351 164 135 146 172 141 115 114 88 55 69 41 34 33 14 15 15
17 Kwesipra/Amamoma 1,262 93 53 51 82 595 162 79 52 28 24 7 10 10 2 5 9
18 Amisano/Nanabakrom 1,177 81 77 86 97 474 134 55 33 38 35 16 7 15 11 7 11
19 Mpeasem 1,089 168 131 115 130 112 91 84 73 38 34 34 19 18 15 12 15
20 Ebobonko 961 109 100 95 95 174 103 51 44 41 52 21 19 15 14 9 19
Source: Ghana Statistical Service, 2010 Population and Housing Census

73
LIST OF CONTRIBUTORS
Project Secretariat
Dr. Philomena Nyarko, Government Statistician
Mr. Baah Wadieh, Deputy Government Statistician
Mr. David Yenukwa Kombat, Acting Census Coordinator
Mr. Sylvester Gyamfi, DISDAP Project Coordinator
Mrs. Abena A. Osei-Akoto, Data Processing
Mr. Rochester Appiah Kubi Boateng, Data Processing
Mrs. Jacqueline Anum, Data Processing
Mrs. Samilia Mintah, Data Processing
Mr. Yaw Misefa, Data Processing
Mr. Ernest Enyan, Data Processing
Mr. Francis Bright Mensah, Regional Statisticain
Ms. Hanna Frempong Konadu, Formatting/Typesetting
Ms. Margaret Hervie, Formatting/Typesetting
Writers
Mrs. Comfort Sowah
Mr. Benjamin Livingbird
Consultant
Prof. Samuel Nii A. Cudjor
Editor/ Reviewers
Prof. Tom K.B. Kumekpor
Mr. George Agbenyo
Mr. Omar Seidu