cape flattery silica sands project assay results confirm
TRANSCRIPT

09 February 2021
Cape Flattery Silica Sands Project Assay Results confirm high purity silica sand
Highlights Assays from the December 2020 drilling program confirm significant intervals of high purity
silica sand at Metallica’s 100% owned Cape Flattery Silica Sands Project
Resource estimation has commenced
IHC Robbins commissioned to undertake metallurgical studies on a representative silica sand bulk sample, which will determine the processing requirements and assist in understanding the marketability of a premium sand product
Project is within the designated Port of Cape Flattery, which is excluded from the Great Barrier Reef Marine Park area.
Metallica Minerals Limited (Metallica, ASX: MLM) is pleased to announce assay results from the December 2020 maiden drilling program (see ASX release: Drilling successfully completed on Cape Flattery Silica Sands Project, 17 December 2020) within the Eastern Target Area have been received from the ALS laboratory. The results are based on 22 Vacuum drillholes across the breadth of the dune complex totalling 505 meters of drilling and 554 assays and have confirmed significant intervals of high purity silica sand. Figure 1: Drill hole Locations

Page 2 of 29 Doc ID 661944773/v1
Metallica Executive Chairman, Theo Psaros said “the confirmation of the continuity of high purity silica sands in the Cape Flattery sand dune system gives us further confidence for the potential to materially increase the resource in both size and confidence. The team at Ausrocks have now started their independent review of these results and we remain on track to announce an upgraded resource by the end of February 2021.” Mr Psaros added “our team visited the IHC Robbins facility to not only see first-hand the silica sand samples that were sent from Cape Flattery, but to be briefed on the metallurgical testing process that is now underway. We appreciate we have much work to do but our enthusiasm for the potential of our project, being located so close to the largest silica sand mine in the world producing a well-recognised product and with growing demand for this commodity, has Metallica well positioned in our development of this mine.”
Metallica Executive Chairman, Theo Psaros; CFO/Director, Scott Waddell; & Cape Flattery GM, Stewart Hagan inspecting samples at IHC Robbins

Page 3 of 29 Doc ID 661944773/v1
The summary of the Assay results and intervals, follows.
Hole ID MGA E MGA N RL TD From1 Int2 SiO2 Al203 Fe2o3 TiO2 Tot LOI
CFS2012 01 320122 8345106 61.7 25.5 0 21 98.60 0.12 0.17 0.15 99.28 0.11
CFS2012 02 320511 8345176 74.7 29 0 20 98.93 0.07 0.13 0.14 99.51 0.12
CFS2012 03 320981 8345257 88.1 22 0 18.5 99.28 0.06 0.06 0.06 99.69 0.09
CFS2012 04 321137 8345557 85.1 26 0 10 98.87 0.07 0.17 0.26 99.70 0.11
CFS2012 05 321101 8345310 90.2 26 1 16 98.79 0.08 0.16 0.18 99.40 0.10
CFS2012 06 321796 8344636 53.4 39 Below Cutoff
CFS2012 07 321555 8344731 51.3 14 0 12 99.17 0.08 0.07 0.12 99.66 0.17
CFS2012 08 321352 8344911 78.4 38 0 8 99.31 0.06 0.03 0.09 99.67 0.12
15 15 99.24 0.09 0.11 0.16 99.51 0.03
CFS2012 09 319727 8345067 74.9 19 1 14 99.17 0.10 0.12 0.15 99.76 0.16
CFS2012 10 320296 8344457 51.8 18 0 9 99.08 0.12 0.22 0.19 99.84 0.15
CFS2012 11 320527 8344063 31.1 19 0 18 99.05 0.08 0.15 0.17 99.67 0.09
CFS2012 12 320055 8344705 66.7 28 0 20 99.17 0.07 0.10 0.15 99.69 0.09
22 3 99.57 0.07 0.10 0.07 99.97 0.04
CFS2012 13 319814 8344864 69 25 1 14 99.35 0.05 0.05 0.11 99.75 0.11
17 7 99.30 0.15 0.06 0.08 99.83 0.13
CFS2012 14 319899 8344882 73.2 28 0 27 99.42 0.06 0.08 0.14 99.94 0.13
CFS2012 15 319889 8345014 67.5 8 0 6 99.23 0.08 0.09 0.17 99.88 0.23
CFS2012 16 320161 8344604 62 23 0 22 99.27 0.10 0.10 0.19 99.90 0.14
CFS2012 17 320396 8344249 39.4 35 1 8 98.86 0.13 0.26 0.26 99.73 0.14
13 22 99.30 0.14 0.10 0.09 99.83 0.14
CFS2012 18 320668 8343918 21.1 14 0 7 99.16 0.17 0.15 0.23 99.99 0.20
11 3 99.11 0.12 0.12 0.09 99.64 0.11
CFS2012 19 320678 8344816 70.9 19 Below Cutoff
CFS2012 20 320579 8344985 79.5 24 1 3 99.13 0.04 0.06 0.08 99.64 0.29
12 7 98.93 0.29 0.18 0.08 99.78 0.22
CFS2012 21 321226 8345185 89.3 23 0 23 99.25 0.08 0.13 0.16 99.83 0.12
CFS2012 22 320824 8344862 83.5 2.5 0 3 99.09 0.09 0.18 0.30 99.99 0.21
505
Table 1: Summary Assay Results and intervals
1. Topsoil contamination can result in top 1 meter being below 98.5% SiO2 cut-off
2. Interval determined using cut-off of 98.5% SiO2
About the Cape Flattery Silica (CFS) Project Metallica’s 100% owned Cape Flattery Silica sands (CFS) project is adjacent to the world class Cape Flattery Silica Sand mining and shipping operation owned by Mitsubishi. Drilling has now confirmed that the sand dunes within EPM 25734 contain high purity silica sands with an in-situ quality which is understood to be comparable to Mitsubishi’s Cape Flattery Silica Mine.

Page 4 of 29 Doc ID 661944773/v1
The white-coloured high purity silica sand dunes appear to be the youngest aeolian dune system in the Cape Flattery dune system and are locally superimposed on top of an older orange coloured sand dune system. The older orange sand horizons form a stratigraphic floor for the targeted high purity silica sands and little information exists on this horizon. The assays results confirm observations from the drilling program that these dune systems have continuity, allowing confidence for an additional resource below the level of the 2019 auger program to depths of 30 meters. The target high purity sand is hosted in elongate parabolic dunes orientated in a north westerly direction and their geometry and size make them ideal for reclamation by truck and loader style mining. The sand appears to have been well sorted by aeolian processes and the grain size distribution is well suited to glass manufacture. Of note is the elevated Fe2O3 and TiO2 results as compared to the southern end of the dune system which indicates the dunes contain elevated heavy mineral sand mineral ilmenite. Future drilling will target observable sand dune extension to the south and east of the current drilling grid when new tracks are cleared. An example of the assay results is found on the next page in Figure 2.
Yearlong Contracting Vacuum Drill rig

Page 5 of 29 Doc ID 661944773/v1
Figure 2: Hole CFS2012 14 Assay Results Graphic

Page 6 of 29 Doc ID 661944773/v1
Figure 4: CFS EPM

Page 7 of 29 Doc ID 661944773/v1
On 17 January 2020, Metallica advised the ASX that a sampling program completed in the last quarter 2019 at CFS in Far North Queensland had confirmed the presence of high purity silica sands. This exploration program consisted of eight (8) hand auger holes to a maximum depth of 5m within the CFS Eastern Exploration Target area of the tenement (refer to tenement map on page 5; see ASX Release “High Purity Silica Sands confirmed at Cape Flattery” 17 January 2020). On 30 November 2020, Metallica advised the ASX that it had achieved a Maiden JORC Inferred Resource of 12.85 million tonnes @ 99.28% SiO2 for its 100% owned Cape Flattery Silica Sand Project (CFS). This result had been based on hand auger work completed in the previous 2019 program (see table below). The independent assessment of this auger hole drilling was conducted by consultants Ausrocks Pty Ltd. The final marketable product being sought is a high silica (SiO2) grade sand, the SiO2 content by percentage would be used to quantify in-situ material as a Resource. Cut-off grades were adopted based on analysis of raw assay data and grade tonnage plots completed on the block model to optimise the average SiO2 grade and quantity of the resource at varied reporting levels. From the 8 auger holes that were used in the resource estimate the SiO2 percentage ranged from 95.01%-99.70%:
• Inferred Resource in accordance with the JORC Code 2012 – A cut-off grade 98.4% has been defined based on the surrounding data.
These results show there is potential to produce a premium grade silica product using standard processing techniques. The Cape Flattery Silica Eastern Inferred Resource Estimate is shown below:
Classification Silica Sand (Mt)
Silica Sand (Mm3)
Density (t/m3)
SiO2
%
AI2O3
%
Fe2O3
%
TiO2
%
Inferred Resource
12.85
8.03
1.6
99.28
0.201
0.161
0.226
The target areas within the Metallica EPM 25734 form the basis of an Exploration Target * of 20-100 Mt of high purity silica sands, with the in-situ quality ranging between 96.9% and 99.6% SiO2. * The potential quantity and grade of the Exploration Target is conceptual in nature and therefore is an approximation. There has been insufficient exploration to estimate a Mineral Resource based on the Exploration Target and it is uncertain if further exploration will result in the estimation of a Mineral Resource based on the Exploration Target. The Exploration Target has been prepared and reported in accordance with the 2012 edition of the JORC Code.
In December 2020 Metallica completed a 22-hole drilling program completed on Metallica’s 100% owned silica sand project. Approximately 505m of drilling was achieved using a vacuum drilling rig into the target sand dune system (see ASX Release “Drilling successfully completed on Cape Flattery Silica Sands Project” 17 December 2020).

Page 8 of 29 Doc ID 661944773/v1
This announcement has been approved in accordance with the Company’s published continuous disclosure policy and has been approved by the Board. For further information, please contact: Mr Theo Psaros Mr Scott Waddell Executive Chairman CFO & Director +61 (7) 3249 3000 +61 (7) 3249 3000 Competent Person Statement Cape Flattery Silica Sands Resource The information in this report that relates to Mineral Resources at the Cape Flattery Silica Sands Project is based on information and modelling carried out by Dale Brown, Senior Mining Engineer, Ausrocks Pty Ltd who is a competent person and a Member of the Australasian Institute of Mining & Metallurgy. Dale Brown is employed by Ausrocks Pty Ltd who have been engaged by Metallica Minerals Ltd to prepare this independent report, there is no conflict of interest between the parties. Dale Brown has sufficient experience which is relevant to the style of mineralisation and type of deposit under consideration and to the activity for which he is undertaking to qualify as a Competent Person as defined in the 2012 edition of the Australasian Code for Reporting of Exploration Results, Mineral Resources and Ore Reserves (The JORC Code). Dale Brown consents to the inclusion in the report on the matters based on their information in the form and context in which it appears. Cape Flattery Silica Sands Exploration Target The information in this report that relates to the Exploration Targets was undertaken by Mr Neil Mackenzie-Forbes, who is a Member of the Australian Institute of Geoscientist and is a Consulting Geologist employed by Sebrof Projects Pty Ltd. Mr Neil Mackenzie-Forbes has in excess of 20 years mining and exploration experience in Australia with major mining and junior exploration companies. Mr Mackenzie-Forbes has sufficient experience that is relevant to the style of mineralisation and type of deposits under consideration and to the activity being undertaken to qualify as a Competent Person as defined in the 2012 Edition of the “Australasian Code for Reporting of Exploration Results, Mineral Resources and Ore Reserves. Mr Neil Mackenzie-Forbes consents to the inclusion of this information in the form and context in which it appears in this release/report. Cape Flattery Silica Sands Exploration Results & Exploration Target The information in this report that relates to the Exploration Sampling, Exploration Results and Exploration Targets was undertaken by Mr Neil Mackenzie-Forbes, who is a Member of the Australian Institute of Geoscientist and is a Consulting Geologist employed by Sebrof Projects Pty Ltd. Mr Neil Mackenzie-Forbes has in excess of 25 years mining and exploration experience in Australia with major mining and junior exploration companies. Mr Mackenzie-Forbes has sufficient experience that is relevant to the style of mineralisation and type of deposits under consideration and to the activity being undertaken to qualify as a Competent Person as defined in the 2012 Edition of the “Australasian Code for Reporting of Exploration Results, Mineral Resources and Ore Reserves. Mr Neil Mackenzie-Forbes consents to the inclusion of this information in the form and context in which it appears in this release/report.

Page 9 of 29 Doc ID 661944773/v1
Forward-looking statements Forward-looking statements are based on assumptions regarding Metallica, business strategies, plans and objectives of the Company for future operations and development and the environment in which Metallica may operate. Forward-looking statements are based on current views, expectations and beliefs as at the date they are expressed and which are subject to various risks and uncertainties. Actual results, performance or achievements of Metallica could be materially different from those expressed in, or implied by, these forward-looking statements. The forward-looking statements contained in this presentation are not guarantees or assurances of future performance and involve known and unknown risks, uncertainties and other factors, many of which are beyond the control of Metallica, which may cause the actual results, performance or achievements of Metallica to differ materially from those expressed or implied by the forward-looking statements. For example, the factors that are likely to affect the results of Metallica include general economic conditions in Australia and globally; ability for Metallica to funds its activities; exchange rates; production levels or rates; demand for Metallica’s products, competition in the markets in which Metallica does and will operate; and the inherent regulatory risks in the businesses of Metallica. Given these uncertainties, readers are cautioned to not place undue reliance on such forward-looking statements.

JORC Code, 2012 Edition – Table 1 Report – Cape Flattery Silica Project Indicated and Updated Inferred Resource Estimate.
Section 1 Sampling Techniques and Data
(Criteria in this section apply to all succeeding sections.) Criteria JORC Code explanation Commentary
Sampling techniques
Nature and quality of sampling (eg cut channels, random chips, or specific specialised industry standard measurement tools appropriate to the minerals under investigation, such as down hole gamma sondes, or handheld XRF instruments, etc). These examples should not be taken as limiting the broad meaning of sampling.
Include reference to measures taken to ensure sample representivity and the appropriate calibration of any measurement tools or systems used.
Aspects of the determination of mineralisation that are Material to the Public Report.
In cases where ‘industry standard’ work has been done this would be relatively simple (eg ‘reverse circulation drilling was used to obtain 1 m samples from which 3 kg was pulverised to produce a 30 g charge for fire assay’). In other cases more explanation may be required, such as where there is coarse gold that has inherent sampling problems. Unusual commodities or mineralisation types (eg submarine nodules) may warrant disclosure of detailed information.
Drilling samples ranging from 0.5 to 1.0m down hole intervals of vacuum drill rig cuttings collected from a cyclone. 100% of sample was collected with a mass of 2-3kg.
A 0.5 to 1.0 kg “spear” of the sample is collected for geochemical analysis. The balance is retained for possible metallurgical analysis.
Sample was submitted to commercial laboratory for drying, splitting (if required), pulverization in tungsten carbide bowl, and XRF analysis.
Sampling techniques are mineral sands “industry standard” for dry beach sands with low levels of induration and slime.
As the targeted mineralization is silica sand, geological logging of the drill material is a primary method for identifying mineralisation.
Metallurgical samples are composited intervals of white and cream sands logged in drilling with collection of the entire volume of air-core drill cuttings from the cyclone/hand auger samples into large plastic samples bags.
Drilling techniques
Drill type (eg core, reverse circulation, open-hole hammer, rotary air blast, auger, Bangka, sonic, etc) and details (eg core diameter, triple or standard tube, depth of diamond tails, face-sampling bit or other
The drilling technique used was vacuum, which was undertaken by Yearlong Contractors using a tractor mounted drill rig. The drill bit diameter was 48mm equivalent to NQ sample size.

Page 11 of 29 Doc ID 661944773/v1
Criteria JORC Code explanation Commentary
type, whether core is oriented and if so, by what method, etc). Holes were terminated in a clayey sand layer or when the water table was intersected, and wet sand affected sampling.
Drill sample recovery
Method of recording and assessing core and chip sample recoveries and results assessed.
Measures taken to maximise sample recovery and ensure representative nature of the samples.
Whether a relationship exists between sample recovery and grade and whether sample bias may have occurred due to preferential loss/gain of fine/coarse material.
Visual assessment and logging of sample recovery and sample quality.
Vacuum drilling is low disturbance and low impact minimising drill hole wall impact and contamination.
Sample is collected in cyclone which has clear Perspex casing allowing visual inspection of sample.
Regular cleaning of cyclone and drill rods was utilised to prevent sample contamination.
No sample bias occurred between sample recovery and grade.
Logging Whether core and chip samples have been geologically and geotechnically logged to a level of detail to support appropriate Mineral Resource estimation, mining studies and metallurgical studies.
Whether logging is qualitative or quantitative in nature. Core (or costean, channel, etc) photography.
The total length and percentage of the relevant intersections logged.
Geological logging of the total hole by field geologist, with retention of sample in chip trays to allow subsequent re-interpretation of data if required.
The total hole is logged in 1m intervals; logging includes qualitative descriptions of colour, grain size, sorting, induration and estimates of HM, slimes and oversize utilising panning.
Logging has been captured through field drill log sheets and transferred through to an excel spreadsheet with daily update of field database and regular update of master database.
Sub-sampling techniques and sample preparation
If core, whether cut or sawn and whether quarter, half or all core taken.
If non-core, whether riffled, tube sampled, rotary split, etc and whether sampled wet or dry.
For all sample types, the nature, quality and appropriateness of the sample preparation technique.
Quality control procedures adopted for all sub-sampling stages to maximise representivity of samples.
Drilling samples are ‘speared’ on site (Approximately 20% subsample drilling), resulting in approximately 0.5 – 1kg of dry sample.
Where bulk sample is collected, sampling is done by “spear” to the 100% recovered sample.
Sample size is considered appropriate for the grain size of material, average grain size (87% material by weight between 0.125mm and 0.5mm).

Page 12 of 29 Doc ID 661944773/v1
Criteria JORC Code explanation Commentary
Measures taken to ensure that the sampling is representative of the in-situ material collected, including for instance results for field duplicate/second-half sampling.
Whether sample sizes are appropriate to the grain size of the material being sampled.
Quality of assay data and laboratory tests
The nature, quality and appropriateness of the assaying and laboratory procedures used and whether the technique is considered partial or total.
For geophysical tools, spectrometers, handheld XRF instruments, etc, the parameters used in determining the analysis including instrument make and model, reading times, calibrations factors applied and their derivation, etc.
Nature of quality control procedures adopted (eg standards, blanks, duplicates, external laboratory checks) and whether acceptable levels of accuracy (ie lack of bias) and precision have been established.
Drilling samples were submitted to ALS Townsville, where they were dried, weighed and split.
Analysis was undertaken by ALS Brisbane utilising a Tungsten Carbide pulverization, ME-XRF26 (whole rock by Fusion/XRF) and ME-GRA05 (H2O/LOI by TGA furnace).
Samples were assayed primarily for SiO2, Fe2O3, Al2O3 and TiO2 and a range of other elements.
Analysis undertaken determined by a sample code which correlates to drill logs to ensure no sample bias.
Metallurgical samples have submitted to IHC Robbins for characterization testwork (screening, de-sliming, sizing, HLS and XRF analysis) and wet-tabling (two stage).
Verification of sampling and assaying
The verification of significant intersections by either independent or alternative company Personnel.
The use of twinned holes.
Documentation of primary data, data entry procedures, data verification, data storage (physical and electronic) protocols.
Discuss any adjustment to assay data.
Significant intersections validated against geological logging and local geology/ geological model.
As this is the first phase of drilling, no holes have been twinned.
All data captured and stored in both hard copy and electronic format.
No assay data had to be adjusted.
Location of data points
Accuracy and quality of surveys used to locate drill holes (collar and down-hole surveys), trenches, mine workings and other locations used in Mineral Resource estimation.
Specification of the grid system used.
All holes initially located using handheld GPS with an accuracy of 5m for X, Y.
UTM coordinates, Zone 55L, GDA94 datum.
Topographic surface generated from processing STRM data.

Page 13 of 29 Doc ID 661944773/v1
Criteria JORC Code explanation Commentary
Quality and adequacy of topographic control.
Data spacing and distribution
Data spacing for reporting of Exploration Results.
Whether the data spacing and distribution is sufficient to establish the degree of geological and grade continuity appropriate for the Mineral Resource and Ore Reserve estimation procedure(s) and classifications applied.
Whether sample compositing has been applied.
Drilling was completed on existing tracks lines holes were spaced approximately 200 meters apart.
Drill spacing, and distribution is sufficient to allow valid interpretation of geological and grade continuity for an Inferred Mineral Resource and potentially an Indicated Mineral Resource where specified.
Orientation of data in relation to geological structure
Whether the orientation of sampling achieves unbiased sampling of possible structures and the extent to which this is known, considering the deposit type.
If the relationship between the drilling orientation and the orientation of key mineralised structures is considered to have introduced a sampling bias, this should be assessed and reported if material.
The dune field has ridges dominantly trending 320º - 330°.
The drill access tracks typically run along or sub-parallel to dune ridges which suggest unbiased sampling, some cross-dune tracks linking the ridges were also drilled.
Silica deposition occurs as windblown with angle of rest approximately 35º. Drilling orientation is appropriate for the nature of deposition.
Sample security
The measures taken to ensure sample security. Sample collection and transport from the field was undertaken by company Personnel following company procedures.
Samples were aggregated into larger polyweave bags and sealed with plastic zip ties, Bags were labelled and put into palette-crates and sealed prior to being shipped to ALS Townsville.
Samples were delivered direct to ALS in Townsville.
Audits or reviews
The results of any audits or reviews of sampling techniques and data.
A review was conducted internally by Metallica Minerals Ltd and third-party consultants Ausrocks Pty Ltd. And they were found to be consistent.

Page 14 of 29 Doc ID 661944773/v1
Section 2 Reporting of Exploration Results (Criteria listed in the preceding section also apply to this section.) Criteria JORC Code explanation Commentary
Mineral tenement and land tenure status
Type, reference name/number, location and ownership including agreements or material issues with third parties such as joint ventures, partnerships, overriding royalties, native title interests, historical sites, wilderness or national park and environmental settings.
The security of the tenure held at the time of reporting along with any known impediments to obtaining a licence to operate in the area.
The Cape Flattery Silica Sands Project occurs within EPM 25734 in Queensland and is held by Metallica Minerals Ltd through subsidiary company Cape Flattery Silica Pty Ltd.
The tenement is in good standing.
A compensation and conduct agreement is in place with the landholder (Hopevale Congress) and native title party.
Exploration done by other parties
Acknowledgment and appraisal of exploration by other parties. Previous exploration has been carried out in the area during the 1970’s and 80s by Cape Flattery Silica Mines (CFSM). CFSM reported seven (7) holes drilled for 84 meters. These holes intersected sand dunes between 10 and 20 meters in thickness.
The historical exploration data is of limited use since but never assayed for SiO2 and there is poor survey control to determine exact locations of historical holes.
Geology Deposit type, geological setting and style of mineralisation. The geology comprises variably re-worked aeolian sand dune deposits associated with Quaternary age sand-dune complex.
Mineralisation occurs within aeolian dune sands.
Drill hole Information
A summary of all information material to the understanding of the exploration results including a tabulation of the following information for all Material drill holes:
o easting and northing of the drill hole collar
o elevation or RL (Reduced Level – elevation above sea level in metres) of the drill hole collar
o dip and azimuth of the hole
o down hole length and interception depth
o hole length.
A tabulation of the material drill holes is attached to this JORC Table 1, as required by the Table 1.

Page 15 of 29 Doc ID 661944773/v1
Criteria JORC Code explanation Commentary
If the exclusion of this information is justified on the basis that the information is not Material and this exclusion does not detract from the understanding of the report, the Competent Person should clearly explain why this is the case.
Data aggregation methods
In reporting Exploration Results, weighting averaging techniques, maximum and/or minimum grade truncations (eg cutting of high grades) and cut-off grades are usually Material and should be stated.
Where aggregate intercepts incorporate short lengths of high grade results and longer lengths of low grade results, the procedure used for such aggregation should be stated and some typical examples of such aggregations should be shown in detail.
The assumptions used for any reporting of metal equivalent values should be clearly stated.
Downhole compositing of samples using weighed averages of Silica content and interval length to determine floor and ceiling of material that exceeded 98.5% SiO2 content.
No minimum or maximum grade truncations have been used.
The grade is highly consistent, and the aggregate intercepts use a simple arithmetic average.
Relationship between mineralisation widths and intercept lengths
These relationships are particularly important in the reporting of Exploration Results.
If the geometry of the mineralisation with respect to the drill hole angle is known, its nature should be reported.
If it is not known and only the down hole lengths are reported, there should be a clear statement to this effect (eg ‘down hole length, true width not known’).
As the mineralisation is associated with aeolian dune sands the majority sub-horizontal, some variability will be apparent on dune edges and faces.
Diagrams Appropriate maps and sections (with scales) and tabulations of intercepts should be included for any significant discovery being reported These should include, but not be limited to a plan view of drill hole collar locations and appropriate sectional views.
A map of the drill collar locations is incorporated with the main body of the report.
Balanced reporting
Where comprehensive reporting of all Exploration Results is not practicable, representative reporting of both low and high grades and/or widths should be practiced to avoid misleading reporting of Exploration Results.
All relevant exploration assay results have been reported.
Other substantive
Other exploration data, if meaningful and material, should be reported including (but not limited to): geological observations;
Geological observations are consistent with aeolian dune mineralisation.

Page 16 of 29 Doc ID 661944773/v1
Criteria JORC Code explanation Commentary
exploration data
geophysical survey results; geochemical survey results; bulk samples – size and method of treatment; metallurgical test results; bulk density, groundwater, geotechnical and rock characteristics; potential deleterious or contaminating substances.
Groundwater was intersected during drilling at the base of holes, as expected given the dune complex is an aquifer and drilling was undertaken to considerable depth.
The mineralisation is unconsolidated sand.
IHC Robins are tasked to complete a bulk laboratory sample to determine viability of product through a one stage of Mineral Technologies MG12 spiral,
There are no known deleterious substances.
554 %SiO2 assays were completed on downhole composites over various drilling programs.
Further work The nature and scale of planned further work (eg tests for lateral extensions or depth extensions or large-scale step-out drilling).
Diagrams clearly highlighting the areas of possible extensions, including the main geological interpretations and future drilling areas, provided this information is not commercially sensitive.
The next stage of exploration drilling will require the establishment of drill tracks to allow drilling at closer spacing across the observable dune field to confirm sand quality and continuity.

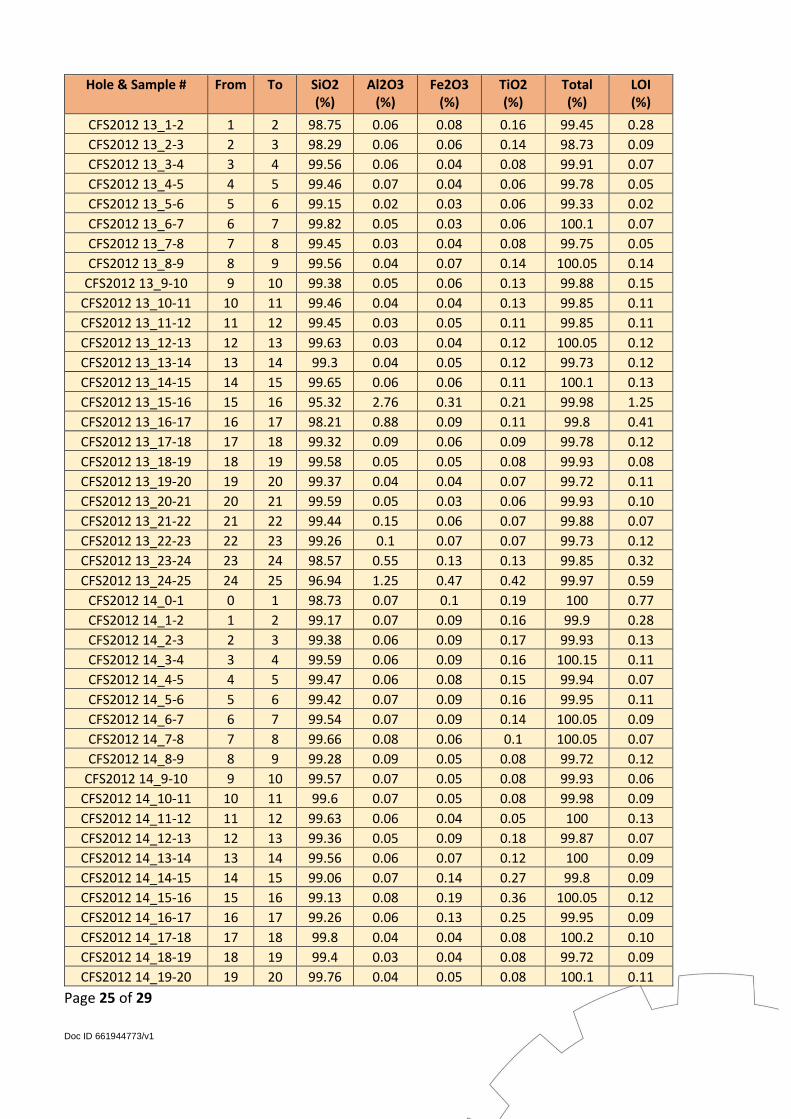
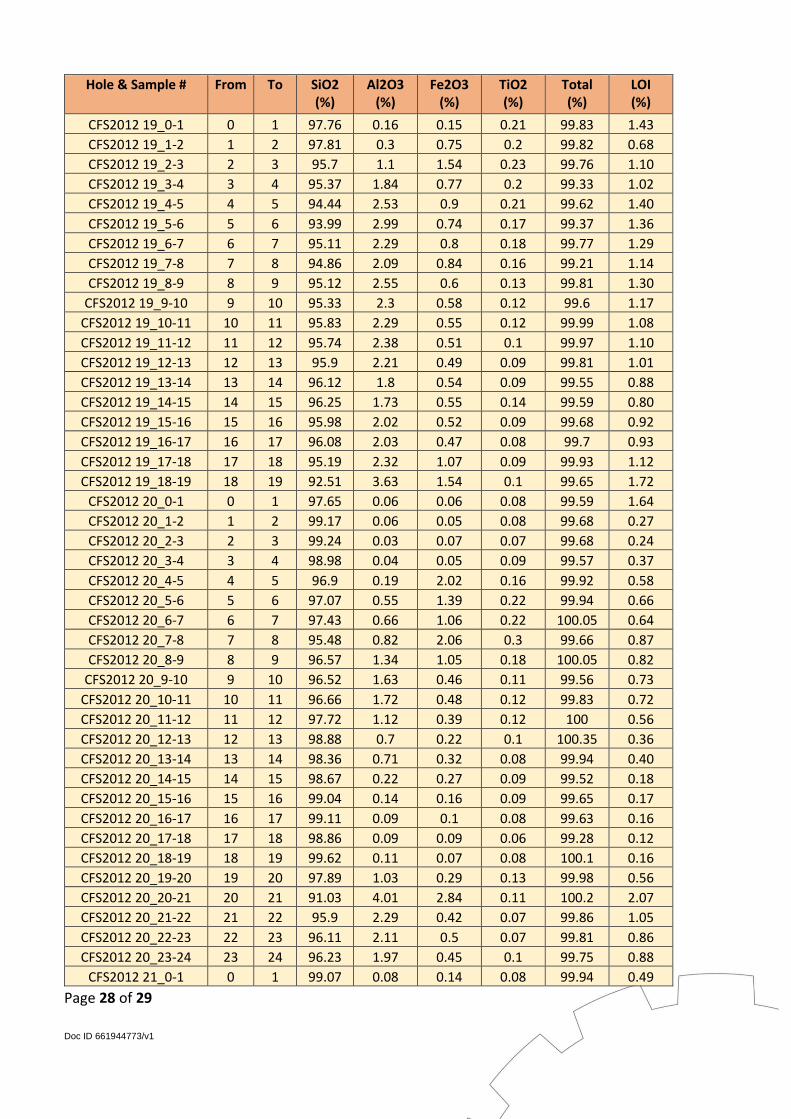
Table 1: XRF assay results for each sample
Hole & Sample # From To SiO2 (%)
Al2O3 (%)
Fe2O3 (%)
TiO2 (%)
Total (%)
LOI (%)
CFS2012 01_0-1 0 1 98.2 0.15 0.19 0.33 99.19 0.17
CFS2012 01_1-2 1 2 98.51 0.12 0.32 0.36 99.59 0.10
CFS2012 01_2-3 2 3 98.34 0.19 0.25 0.34 99.38 0.10
CFS2012 01_3-4 3 4 98.32 0.1 0.28 0.31 99.27 0.12
CFS2012 01_4-5 4 5 98.34 0.12 0.17 0.21 99.11 0.16
CFS2012 01_5-6 5 6 98.47 0.14 0.3 0.28 99.49 0.15
CFS2012 01_6-7 6 7 98.29 0.14 0.14 0.18 99 0.13
CFS2012 01_7-8 7 8 98.64 0.13 0.3 0.19 99.51 0.07
CFS2012 01_8-9 8 9 98.7 0.12 0.12 0.14 99.31 0.11
CFS2012 01_9-10 9 10 98.43 0.12 0.22 0.18 99.15 0.07
CFS2012 01_10-11 10 11 98.6 0.15 0.11 0.12 99.19 0.10
CFS2012 01_11-12 11 12 98.79 0.13 0.17 0.09 99.39 0.09
CFS2012 01_12-13 12 13 98.56 0.14 0.08 0.06 99.05 0.12
CFS2012 01_13-14 13 14 98.89 0.13 0.17 0.05 99.4 0.06
CFS2012 01_14-15 14 15 98.56 0.16 0.07 0.04 99.01 0.10
CFS2012 01_15-16 15 16 98.65 0.11 0.15 0.06 99.19 0.11
CFS2012 01_16-17 16 17 98.52 0.11 0.08 0.06 98.96 0.09
CFS2012 01_17-18 17 18 98.48 0.09 0.15 0.06 99.11 0.22
CFS2012 01_18-19 18 19 99.15 0.1 0.04 0.05 99.56 0.13
CFS2012 01_19-20 19 20 99.27 0.05 0.16 0.06 99.74 0.06
CFS2012 01_20-21 20 21 98.98 0.09 0.04 0.07 99.38 0.10
CFS2012 01_21-22 21 22 92.71 3.62 0.33 0.17 99.47 2.44
CFS2012 01_22-23 22 23 94.64 2.73 0.16 0.17 99.51 1.67
CFS2012 01_23-24 23 24 89.47 4.35 1.06 0.47 99.33 3.77
CFS2012 01_24-25 24 25 96.36 1.01 0.34 0.36 99.4 1.21
CFS2012 01_25-25.5 25 25.5 96.82 0.79 0.32 0.29 99.45 1.09
CFS2012 02_0-1 0 1 98.28 0.12 0.13 0.22 99.43 0.57
CFS2012 02_1-2 1 2 98.49 0.06 0.29 0.28 99.4 0.11
CFS2012 02_2-3 2 3 98.6 0.05 0.1 0.17 99.11 0.10
CFS2012 02_3-4 3 4 99.13 0.08 0.19 0.2 99.8 0.07
CFS2012 02_4-5 4 5 99.14 0.1 0.09 0.15 99.71 0.13
CFS2012 02_5-6 5 6 98.87 0.05 0.14 0.11 99.5 0.20
CFS2012 02_6-7 6 7 99.35 0.06 0.07 0.13 99.82 0.09
CFS2012 02_7-8 7 8 99.11 0.05 0.14 0.14 99.64 0.07
CFS2012 02_8-9 8 9 98.85 0.04 0.07 0.12 99.29 0.10
CFS2012 02_9-10 9 10 98.74 0.07 0.16 0.1 99.25 0.06
CFS2012 02_10-11 10 11 98.99 0.05 0.06 0.1 99.36 0.07
CFS2012 02_11-12 11 12 99.05 0.08 0.13 0.1 99.56 0.08
CFS2012 02_12-13 12 13 98.94 0.04 0.04 0.06 99.21 0.05
CFS2012 02_13-14 13 14 98.86 0.04 0.12 0.07 99.26 0.07
CFS2012 02_14-15 14 15 99.26 0.05 0.06 0.09 99.61 0.06
CFS2012 02_15-16 15 16 99.34 0.13 0.14 0.15 99.96 0.07
CFS2012 02_16-17 16 17 99.21 0.12 0.06 0.09 99.68 0.11
CFS2012 02_17-18 17 18 98.78 0.09 0.24 0.12 99.44 0.07
CFS2012 02_18-19 18 19 98.82 0.1 0.15 0.2 99.55 0.14

Page 18 of 29 Doc ID 661944773/v1
Hole & Sample # From To SiO2 (%)
Al2O3 (%)
Fe2O3 (%)
TiO2 (%)
Total (%)
LOI (%)
CFS2012 02_19-20 19 20 98.88 0.11 0.2 0.12 99.54 0.08
CFS2012 02_20-21 20 21 96.15 0.9 1.1 0.28 99.33 0.74
CFS2012 02_21-22 21 22 90.85 4.27 1.84 0.15 99.42 2.14
CFS2012 02_22-23 22 23 88.53 5.48 2.51 0.13 99.47 2.63
CFS2012 02_23-24 23 24 94.68 2.99 0.65 0.21 99.99 1.29
CFS2012 02_24-25 24 25 94.94 2.79 0.55 0.16 99.76 1.17
CFS2012 02_25-26 25 26 95.54 2.3 0.51 0.09 99.57 0.96
CFS2012 02_26-27 26 27 95.88 2.09 0.43 0.08 99.51 0.89
CFS2012 02_27-28 27 28 96.63 1.82 0.44 0.07 99.9 0.79
CFS2012 02_28-29 28 29 96.58 1.64 0.35 0.06 99.42 0.65
CFS2012 03_0-0.5 0 0.5 98.47 0.15 0.13 0.04 99.62 0.73
CFS2012 03_0.5-1 0.5 1 99.14 0.07 0.02 0.04 99.52 0.17
CFS2012 03_1-1.5 1 1.5 99.33 0.07 0.07 0.03 99.65 0.07
CFS2012 03_1.5-2 1.5 2 99.33 0.04 0.02 0.04 99.58 0.06
CFS2012 03_2-2.5 2 2.5 99.06 0.03 0.09 0.04 99.32 0.01
CFS2012 03_2.5-3 2.5 3 99.27 0.04 0.02 0.04 99.5 0.04
CFS2012 03_3-3.5 3 3.5 99.25 0.05 0.09 0.04 99.61 0.07
CFS2012 03_3.5-4 3.5 4 99.12 0.03 0.01 0.04 99.34 0.07
CFS2012 03_4-4.5 4 4.5 98.95 0.04 0.02 0.05 99.32 0.06
CFS2012 03_4.5-5 4.5 5 99.82 0.04 0.08 0.05 100.2 0.11
CFS2012 03_5-5.5 5 5.5 99.11 0.04 0.08 0.05 99.54 0.05
CFS2012 03_5.5-6 5.5 6 98.98 0.04 0.02 0.05 99.31 0.02
CFS2012 03_6-6.5 6 6.5 99.1 0.05 0.08 0.06 99.52 0.01
CFS2012 03_6.5-7 6.5 7 99.41 0.07 0.02 0.06 99.81 0.05
CFS2012 03_7-7.5 7 7.5 99.41 0.06 0.08 0.06 99.85 0.02
CFS2012 03_7.5-8 7.5 8 99.13 0.04 0.02 0.06 99.52 0.06
CFS2012 03_8-8.5 8 8.5 99.74 0.03 0.09 0.06 100.05 0.05
CFS2012 03_8.5-9 8.5 9 99.72 0.18 0.02 0.06 100.25 0.08
CFS2012 03_9-9.5 9 9.5 99.65 0.16 0.08 0.08 100.1 0.05
CFS2012 03_9.5-10 9.5 10 99.25 0.06 0.03 0.09 99.66 0.02
CFS2012 03_10-10.5 10 10.5 99.52 0.04 0.11 0.1 99.91 0.05
CFS2012 03_10.5-11 10.5 11 99.42 0.03 0.03 0.08 99.7 0.07
CFS2012 03_11-11.5 11 11.5 99.19 0.03 0.1 0.08 99.68 0.06
CFS2012 03_11.5-12 11.5 12 99.44 0.07 0.03 0.08 99.9 0.08
CFS2012 03_12-12.5 12 12.5 99.26 0.05 0.09 0.07 99.6 0.02
CFS2012 03_12.5-13 12.5 13 99.18 0.04 0.03 0.07 99.52 0.12
CFS2012 03_13-13.5 13 13.5 99.28 0.03 0.1 0.07 99.79 0.09
CFS2012 03_13.5-14 13.5 14 99.28 0.03 0.03 0.06 99.68 0.09
CFS2012 03_14-14.5 14 14.5 99.17 0.05 0.1 0.06 99.69 0.10
CFS2012 03_14.5-15 14.5 15 99.34 0.07 0.03 0.06 99.79 0.11
CFS2012 03_15-15.5 15 15.5 99.34 0.03 0.11 0.05 99.83 0.08
CFS2012 03_15.5-16 15.5 16 99.36 0.07 0.03 0.05 99.78 0.08
CFS2012 03_16-16.5 16 16.5 99.32 0.07 0.1 0.05 99.71 0.08
CFS2012 03_16.5-17 16.5 17 99.47 0.04 0.03 0.05 100 0.28

Page 19 of 29 Doc ID 661944773/v1
Hole & Sample # From To SiO2 (%)
Al2O3 (%)
Fe2O3 (%)
TiO2 (%)
Total (%)
LOI (%)
CFS2012 03_17-17.5 17 17.5 99.21 0.04 0.11 0.04 99.64 0.07
CFS2012 03_17.5-18 17.5 18 99.05 0.03 0.03 0.04 99.41 0.07
CFS2012 03_18-18.5 18 18.5 99.33 0.04 0.1 0.04 99.79 0.07
CFS2012 03_18.5-19 18.5 19 93.97 2.83 0.37 0.2 99.26 1.73
CFS2012 03_19-19.5 19 19.5 95.37 1.54 0.88 0.15 99.65 1.46
CFS2012 03_19.5-20 19.5 20 95.01 2.26 0.84 0.11 99.65 1.17
CFS2012 03_20-20.5 20 20.5 95.26 2.49 0.51 0.1 99.64 1.05
CFS2012 03_20.5-21 20.5 21 94.54 2.82 0.63 0.11 99.48 1.28
CFS2012 03_21-21.5 21 21.5 94.7 2.76 0.79 0.14 99.98 1.30
CFS2012 03_21.5-22 21.5 22 92.52 3.05 2.25 0.11 99.56 1.47
CFS2012 04_0-1 0 0.5 98.58 0.17 0.23 0.23 99.82 0.35
CFS2012 04_0.5-1 0.5 1 99.01 0.12 0.13 0.21 99.85 0.14
CFS2012 04_1-1.5 1 1.5 98.5 0.07 0.2 0.2 99.48 0.39
CFS2012 04_1.5-2 1.5 2 98.65 0.06 0.37 0.2 99.8 0.28
CFS2012 04_2-2.5 2 2.5 99.07 0.04 0.19 0.22 99.73 0.07
CFS2012 04_2.5-3 2.5 3 99.07 0.07 0.1 0.22 99.78 0.09
CFS2012 04_3-3.5 3 3.5 98.68 0.08 0.21 0.29 99.5 0.07
CFS2012 04_3.5-4 3.5 4 99.05 0.04 0.11 0.22 99.59 0.07
CFS2012 04_4-4.5 4 4.5 99.03 0.04 0.16 0.2 99.69 0.03
CFS2012 04_4.5-5 4.5 5 99.03 0.04 0.1 0.23 99.65 0.04
CFS2012 04_5-5.5 5 5.5 99.01 0.05 0.13 0.17 99.66 0.06
CFS2012 04_5.5-6 5.5 6 98.95 0.07 0.07 0.16 99.54 0.07
CFS2012 04_6-6.5 6 6.5 99.12 0.05 0.17 0.22 99.85 0.04
CFS2012 04_6.5-7 6.5 7 99.03 0.04 0.08 0.16 99.59 0.07
CFS2012 04_7-7.5 7 7.5 98.94 0.05 0.18 0.3 99.75 0.05
CFS2012 04_7.5-8 7.5 8 98.66 0.06 0.21 0.5 99.81 0.09
CFS2012 04_8-8.5 8 8.5 98.64 0.15 0.26 0.46 99.87 0.07
CFS2012 04_8.5-9 8.5 9 98.84 0.09 0.17 0.42 99.84 0.07
CFS2012 04_9-9.5 9 9.5 98.8 0.06 0.27 0.49 100 0.08
CFS2012 04_9.5-10 9.5 10 98.67 0.05 0.07 0.17 99.23 0.07
CFS2012 04_10-10.5 10 10.5 96.68 0.3 1.78 0.19 99.76 0.54
CFS2012 04_10.5-11 10.5 11 99.3 0.06 0.11 0.15 99.95 0.12
CFS2012 04_11-11.5 11 11.5 0 0 0 0 0 0.00
CFS2012 04_11.5-12 11.5 12 98.58 0.17 0.51 0.16 99.85 0.23
CFS2012 04_12-12.5 12 12.5 92.61 2.61 2.23 0.29 99.53 1.51
CFS2012 04_12.5-13 12.5 13 96.22 1.42 0.66 0.55 99.8 0.64
CFS2012 04_13-13.5 13 13.5 92.97 3.17 1.37 0.5 99.77 1.45
CFS2012 04_13.5-14 13.5 14 92.03 3.1 2.33 0.46 99.8 1.57
CFS2012 04_14-14.5 14 14.5 93.82 2.94 0.89 0.48 99.71 1.25
CFS2012 04_14.5-15 14.5 15 95.13 2.31 0.78 0.3 99.85 1.05
CFS2012 04_15-15.5 15 15.5 93.1 3.03 1.07 0.85 99.72 1.23
CFS2012 04_15.5-16 15.5 16 93.9 3.01 0.83 0.7 99.86 1.16
CFS2012 04_16-16.5 16 16.5 95.46 2.23 0.53 0.27 99.55 0.92
CFS2012 04_16.5-17 16.5 17 95.94 2.08 0.39 0.18 99.59 0.88

Page 20 of 29 Doc ID 661944773/v1
Hole & Sample # From To SiO2 (%)
Al2O3 (%)
Fe2O3 (%)
TiO2 (%)
Total (%)
LOI (%)
CFS2012 04_17-17.5 17 17.5 96.31 1.81 0.39 0.1 99.48 0.79
CFS2012 04_17.5-18 17.5 18 96.55 1.16 0.67 0.29 99.32 0.53
CFS2012 04_18-18.5 18 18.5 97.47 0.67 0.8 0.28 99.79 0.43
CFS2012 04_18.5-19 18.5 19 95.67 1.92 0.58 0.17 99.26 0.81
CFS2012 04_19-19.5 19 19.5 95.52 1.94 0.74 0.18 99.33 0.82
CFS2012 04_19.5-20 19.5 20 95.73 2.03 0.67 0.18 99.63 0.91
CFS2012 04_20-20.5 20 20.5 97.47 0.81 0.51 0.19 99.48 0.36
CFS2012 04_20.5-21 20.5 21 95.45 1.57 0.97 0.23 99.1 0.75
CFS2012 04_21-21.5 21 21.5 92.64 3.04 1.47 0.54 99.39 1.43
CFS2012 04_21.5-22 21.5 22 94.51 2.3 1.12 0.24 99.39 1.07
CFS2012 04_22-22.5 22 22.5 95.68 1.87 0.81 0.15 99.51 0.86
CFS2012 04_22.5-23 22.5 23 97.39 0.92 0.51 0.18 99.6 0.49
CFS2012 04_23-23.5 23 23.5 94.25 1.9 1.33 0.49 99.09 0.89
CFS2012 04_23.5-24 23.5 24 96.22 1.25 0.77 0.25 99.13 0.50
CFS2012 04_24-24.5 24 24.5 95.43 1.84 0.98 0.24 99.48 0.83
CFS2012 04_24.5-25 24.5 25 97.45 0.9 0.48 0.17 99.52 0.43
CFS2012 04_25-25.5 25 25.5 97.85 0.61 0.49 0.14 99.47 0.28
CFS2012 04_25.5-26 25.5 26 96.12 1.69 0.76 0.12 99.55 0.75
CFS2012 05_0-1 0 1 97.85 0.08 0.15 0.11 99.27 0.98
CFS2012 05_1-2 1 2 98.89 0.08 0.05 0.11 99.29 0.10
CFS2012 05_2-3 2 3 98.97 0.07 0.14 0.11 99.47 0.09
CFS2012 05_3-4 3 4 98.75 0.1 0.06 0.14 99.17 0.07
CFS2012 05_4-5 4 5 98.99 0.18 0.16 0.19 99.68 0.05
CFS2012 05_5-6 5 6 98.92 0.07 0.08 0.16 99.4 0.12
CFS2012 05_6-7 6 7 98.87 0.05 0.15 0.19 99.47 0.12
CFS2012 05_7-8 7 8 98.5 0.05 0.09 0.16 99.05 0.19
CFS2012 05_8-9 8 9 98.89 0.05 0.15 0.19 99.4 0.04
CFS2012 05_9-10 9 10 98.9 0.04 0.08 0.18 99.36 0.09
CFS2012 05_10-11 10 11 98.83 0.05 0.19 0.22 99.53 0.09
CFS2012 05_11-12 11 12 99.01 0.05 0.11 0.24 99.65 0.13
CFS2012 05_12-13 12 13 98.63 0.05 0.16 0.22 99.25 0.09
CFS2012 05_13-14 13 14 98.55 0.05 0.11 0.23 99.17 0.11
CFS2012 05_14-15 14 15 98.96 0.06 0.2 0.22 99.6 0.02
CFS2012 05_15-16 15 16 98.31 0.2 0.66 0.17 99.68 0.23
CFS2012 05_16-17 16 17 98.62 0.09 0.12 0.22 99.26 0.09
CFS2012 05_17-18 17 18 96.23 1.59 0.36 0.21 99.23 0.75
CFS2012 05_18-19 18 19 96.68 1.35 0.5 0.22 99.44 0.58
CFS2012 05_19-20 19 20 97.7 0.91 0.32 0.21 99.65 0.41
CFS2012 05_20-21 20 21 97.33 0.8 0.56 0.21 99.47 0.45
CFS2012 05_21-22 21 22 97.09 0.95 0.39 0.22 99.23 0.47
CFS2012 05_22-23 22 23 95.06 2.32 0.71 0.25 99.53 1.04
CFS2012 05_23-24 23 24 94.94 2.09 0.95 0.28 99.39 0.98
CFS2012 05_24-25 24 25 94.65 2.02 1.26 0.22 99.27 1.00
CFS2012 05_25-26 25 26 90.26 1.9 5.08 0.19 99.2 1.57

Page 21 of 29 Doc ID 661944773/v1
Hole & Sample # From To SiO2 (%)
Al2O3 (%)
Fe2O3 (%)
TiO2 (%)
Total (%)
LOI (%)
CFS2012 06_0-1 0 1 97.74 0.15 0.4 0.47 99.18 0.29
CFS2012 06_1-2 1 2 98.21 0.12 0.59 0.45 99.66 0.18
CFS2012 06_2-3 2 3 97.45 0.27 0.96 0.5 99.56 0.24
CFS2012 06_3-4 3 4 97.62 0.41 0.78 0.37 99.6 0.29
CFS2012 06_4-5 4 5 97.65 0.34 0.73 0.45 99.57 0.27
CFS2012 06_5-6 5 6 97.42 0.45 0.73 0.47 99.49 0.27
CFS2012 06_6-7 6 7 97.87 0.5 0.59 0.33 99.67 0.25
CFS2012 06_7-8 7 8 98.05 0.59 0.47 0.24 99.71 0.27
CFS2012 06_8-9 8 9 97.98 0.57 0.47 0.26 99.67 0.29
CFS2012 06_9-10 9 10 98.1 0.46 0.43 0.25 99.55 0.22
CFS2012 06_10-11 10 11 98.2 0.45 0.41 0.21 99.63 0.26
CFS2012 06_11-12 11 12 97.89 0.45 0.45 0.25 99.42 0.28
CFS2012 06_12-13 12 13 97.64 0.47 0.49 0.31 99.26 0.25
CFS2012 06_13-14 13 14 98.29 0.45 0.41 0.25 99.74 0.24
CFS2012 06_14-15 14 15 98.08 0.49 0.43 0.26 99.57 0.22
CFS2012 06_15-16 15 16 98.19 0.41 0.46 0.26 99.63 0.21
CFS2012 06_16-17 16 17 98.18 0.36 0.38 0.21 99.4 0.18
CFS2012 06_17-18 17 18 98.42 0.35 0.28 0.11 99.44 0.21
CFS2012 06_18-19 18 19 98.23 0.37 0.42 0.21 99.57 0.22
CFS2012 06_19-20 19 20 96.93 1.27 0.61 0.18 99.7 0.61
CFS2012 06_20-21 20 21 93.52 2.97 1.52 0.25 99.81 1.40
CFS2012 06_21-22 21 22 95.01 2.66 0.69 0.15 99.75 1.13
CFS2012 06_22-23 22 23 96.58 1.32 0.57 0.23 99.39 0.58
CFS2012 06_23-24 23 24 94.89 2.08 1.41 0.16 99.67 0.97
CFS2012 06_24-25 24 25 95.78 2.07 0.68 0.17 99.77 0.94
CFS2012 06_25-26 25 26 95.98 2.02 0.6 0.15 99.68 0.82
CFS2012 06_26-27 26 27 96.89 1.4 0.53 0.17 99.76 0.67
CFS2012 06_27-28 27 28 96.81 1.51 0.53 0.17 99.82 0.67
CFS2012 06_28-29 28 29 96.74 1.47 0.54 0.2 99.77 0.69
CFS2012 06_29-30 29 30 96.34 1.8 0.44 0.09 99.54 0.74
CFS2012 06_30-31 30 31 96.45 1.74 0.44 0.11 99.61 0.75
CFS2012 06_31-32 31 32 96.8 1.75 0.41 0.08 99.84 0.70
CFS2012 06_32-33 32 33 96.51 1.64 0.43 0.12 99.48 0.67
CFS2012 06_33-34 33 34 96.78 1.52 0.45 0.12 99.65 0.67
CFS2012 06_34-35 34 35 96.47 1.76 0.39 0.07 99.51 0.71
CFS2012 06_35-36 35 36 96.28 1.88 0.43 0.08 99.6 0.81
CFS2012 06_36-37 36 37 96.4 1.87 0.41 0.07 99.65 0.78
CFS2012 06_37-38 37 38 96.61 1.81 0.41 0.08 99.73 0.72
CFS2012 06_38-39 38 39 92.38 3.81 1.92 0.1 100 1.64
CFS2012 07_0-1 0 1 98.37 0.12 0.06 0.08 99.49 0.80
CFS2012 07_1-2 1 2 99.23 0.13 0.05 0.08 99.91 0.36
CFS2012 07_2-3 2 3 99.54 0.05 0.04 0.09 99.82 0.06
CFS2012 07_3-4 3 4 99.03 0.04 0.05 0.1 99.4 0.12
CFS2012 07_4-5 4 5 99.3 0.05 0.06 0.12 99.68 0.10

Page 22 of 29 Doc ID 661944773/v1
Hole & Sample # From To SiO2 (%)
Al2O3 (%)
Fe2O3 (%)
TiO2 (%)
Total (%)
LOI (%)
CFS2012 07_5-6 5 6 99.16 0.1 0.08 0.15 99.65 0.09
CFS2012 07_6-7 6 7 99.36 0.05 0.09 0.16 99.81 0.10
CFS2012 07_7-8 7 8 99.28 0.05 0.08 0.14 99.7 0.10
CFS2012 07_8-9 8 9 99.05 0.06 0.09 0.15 99.48 0.07
CFS2012 07_9-10 9 10 99.14 0.04 0.07 0.11 99.5 0.08
CFS2012 07_10-11 10 11 99.37 0.06 0.1 0.14 99.82 0.09
CFS2012 07_11-12 11 12 99.15 0.18 0.1 0.15 99.7 0.06
CFS2012 07_12-13 12 13 98.22 0.57 0.21 0.25 99.74 0.41
CFS2012 07_13-14 13 14 97.98 0.55 0.37 0.24 99.58 0.36
CFS2012 08_0-1 0 1 99.14 0.07 0.04 0.1 99.73 0.31
CFS2012 08_1-2 1 2 99.32 0.06 0.04 0.12 99.71 0.12
CFS2012 08_2-3 2 3 99.24 0.04 0.03 0.08 99.5 0.07
CFS2012 08_3-4 3 4 0 0 0 0 0 0.00
CFS2012 08_4-5 4 5 99.54 0.13 0.03 0.08 99.9 0.07
CFS2012 08_5-6 5 6 99.37 0.03 0.02 0.08 99.65 0.11
CFS2012 08_6-7 6 7 99.35 0.04 0.03 0.06 99.61 0.07
CFS2012 08_7-8 7 8 99.23 0.04 0.04 0.11 99.56 0.08
CFS2012 08_8-9 8 9 97.25 0.63 0.46 0.43 99.44 0.55
CFS2012 08_9-10 9 10 95.45 2.06 0.75 0.28 99.78 1.14
CFS2012 08_10-11 10 11 96.7 2 0.14 0.11 99.86 0.81
CFS2012 08_11-12 11 12 96.65 1.91 0.12 0.11 99.67 0.80
CFS2012 08_12-13 12 13 97.02 1.48 0.2 0.17 99.59 0.62
CFS2012 08_13-14 13 14 97.61 1.18 0.27 0.17 99.87 0.57
CFS2012 08_14-15 14 15 93.91 2.78 1.51 0.16 99.82 1.35
CFS2012 08_15-16 15 16 99.22 0.15 0.11 0.15 99.82 0.11
CFS2012 08_16-17 16 17 99.38 0.16 0.11 0.16 99.95 0.06
CFS2012 08_17-18 17 18 99.1 0.08 0.1 0.16 99.57 0.05
CFS2012 08_18-19 18 19 99.03 0.06 0.1 0.17 99.46 0.01
CFS2012 08_19-20 19 20 99.19 0.07 0.1 0.18 99.67 0.05
CFS2012 08_20-21 20 21 99.2 0.05 0.11 0.19 99.67 0.04
CFS2012 08_21-22 21 22 99.58 0.05 0.04 0.07 96.71 -0.34
CFS2012 08_22-23 22 23 99.62 0.08 0.05 0.09 99.94 0.06
CFS2012 08_23-24 23 24 99.28 0.05 0.04 0.05 99.53 0.06
CFS2012 08_24-25 24 25 99.52 0.04 0.05 0.07 99.77 0.05
CFS2012 08_25-26 25 26 98.96 0.07 0.15 0.16 99.45 0.05
CFS2012 08_26-27 26 27 99.01 0.06 0.14 0.19 99.55 0.07
CFS2012 08_27-28 27 28 99.11 0.1 0.17 0.22 99.72 0.04
CFS2012 08_28-29 28 29 99.09 0.18 0.21 0.32 99.96 0.07
CFS2012 08_29-30 29 30 99.33 0.14 0.1 0.15 99.85 0.06
CFS2012 08_30-31 30 31 95.33 0.64 3.24 0.23 100.2 0.67
CFS2012 08_31-32 31 32 98.49 0.28 0.3 0.15 99.52 0.24
CFS2012 08_32-33 32 33 98.94 0.2 0.2 0.12 99.72 0.20
CFS2012 08_33-34 33 34 99.11 0.13 0.18 0.1 99.79 0.22
CFS2012 08_34-35 34 35 99.28 0.12 0.12 0.09 99.79 0.11

Page 23 of 29 Doc ID 661944773/v1
Hole & Sample # From To SiO2 (%)
Al2O3 (%)
Fe2O3 (%)
TiO2 (%)
Total (%)
LOI (%)
CFS2012 08_35-36 35 36 94.63 1.94 1.91 0.33 100.05 1.11
CFS2012 08_36-37 36 37 86.74 3.87 5.91 0.12 99.16 2.30
CFS2012 08_37-38 37 38 88.95 3.84 4.46 0.23 99.76 2.12
CFS2012 09_0-1 0 1 97.38 0.41 0.58 0.16 99.81 1.18
CFS2012 09_1-2 1 2 98.5 0.37 0.46 0.22 99.94 0.32
CFS2012 09_2-3 2 3 98.64 0.07 0.09 0.13 99.56 0.56
CFS2012 09_3-4 3 4 99.68 0.06 0.06 0.08 100.05 0.14
CFS2012 09_4-5 4 5 99.06 0.12 0.14 0.23 99.74 0.10
CFS2012 09_5-6 5 6 98.57 0.13 0.14 0.23 99.24 0.10
CFS2012 09_6-7 6 7 99.36 0.12 0.11 0.15 99.91 0.10
CFS2012 09_7-8 7 8 99.34 0.06 0.07 0.12 99.74 0.10
CFS2012 09_8-9 8 9 99.24 0.07 0.1 0.15 99.72 0.09
CFS2012 09_9-10 9 10 99.31 0.06 0.08 0.14 99.8 0.15
CFS2012 09_10-11 10 11 99.37 0.09 0.09 0.13 99.83 0.10
CFS2012 09_11-12 11 12 99.05 0.08 0.11 0.21 99.68 0.16
CFS2012 09_12-13 12 13 99.19 0.06 0.1 0.12 99.65 0.10
CFS2012 09_13-14 13 14 99.45 0.04 0.07 0.1 99.8 0.08
CFS2012 09_14-15 14 15 99.63 0.05 0.06 0.1 100 0.11
CFS2012 09_15-16 15 16 94.26 1.95 1.29 0.4 99.51 1.48
CFS2012 09_16-17 16 17 97.61 0.93 0.59 0.19 100 0.61
CFS2012 09_17-18 17 18 99.52 0.07 0.08 0.12 99.95 0.11
CFS2012 09_18-19 18 19 98.24 0.74 0.13 0.31 100 0.46
CFS2012 10_0-1 0 1 98.94 0.08 0.18 0.32 99.77 0.15
CFS2012 10_1-2 1 2 99.14 0.07 0.15 0.27 99.83 0.11
CFS2012 10_2-3 2 3 99.28 0.13 0.12 0.22 99.91 0.09
CFS2012 10_3-4 3 4 99.31 0.12 0.24 0.21 100.1 0.14
CFS2012 10_4-5 4 5 98.99 0.12 0.32 0.23 99.9 0.16
CFS2012 10_5-6 5 6 99.04 0.17 0.33 0.14 99.96 0.21
CFS2012 10_6-7 6 7 99.01 0.09 0.21 0.12 99.61 0.13
CFS2012 10_7-8 7 8 99.27 0.07 0.12 0.09 99.74 0.14
CFS2012 10_8-9 8 9 98.72 0.24 0.35 0.15 99.73 0.21
CFS2012 10_9-10 9 10 98.32 0.39 0.41 0.12 99.59 0.28
CFS2012 10_10-11 10 11 98.19 0.46 0.42 0.11 99.56 0.31
CFS2012 10_11-12 11 12 98.86 0.41 0.28 0.08 99.98 0.28
CFS2012 10_12-13 12 13 98.37 0.41 0.32 0.09 99.54 0.29
CFS2012 10_13-14 13 14 98.77 0.38 0.22 0.06 99.77 0.25
CFS2012 10_14-15 14 15 98.75 0.36 0.2 0.06 99.71 0.24
CFS2012 10_15-16 15 16 98.3 0.41 0.36 0.19 99.68 0.28
CFS2012 10_16-17 16 17 94.04 3.12 0.65 0.31 99.78 1.50
CFS2012 10_17-18 17 18 91.56 4.33 1.04 0.38 99.56 2.06
CFS2012 11_0-1 0 1 98.7 0.2 0.12 0.16 99.55 0.25
CFS2012 11_1-2 1 2 99.35 0.15 0.1 0.16 99.98 0.11
CFS2012 11_2-3 2 3 99.2 0.08 0.1 0.15 99.77 0.11
CFS2012 11_3-4 3 4 99.15 0.08 0.1 0.15 99.7 0.09

Page 24 of 29 Doc ID 661944773/v1
Hole & Sample # From To SiO2 (%)
Al2O3 (%)
Fe2O3 (%)
TiO2 (%)
Total (%)
LOI (%)
CFS2012 11_4-5 4 5 99.18 0.06 0.06 0.09 99.57 0.12
CFS2012 11_5-6 5 6 99.02 0.07 0.1 0.16 99.52 0.08
CFS2012 11_6-7 6 7 97.94 0.1 0.57 0.73 99.64 0.07
CFS2012 11_7-8 7 8 98.52 0.18 0.26 0.38 99.62 0.10
CFS2012 11_8-9 8 9 99.06 0.11 0.26 0.22 99.87 0.07
CFS2012 11_9-10 9 10 99.16 0.06 0.08 0.14 99.6 0.06
CFS2012 11_10-11 10 11 99.2 0.04 0.18 0.11 99.74 0.07
CFS2012 11_11-12 11 12 99.3 0.04 0.06 0.1 99.69 0.09
CFS2012 11_12-13 12 13 99.41 0.08 0.18 0.11 99.97 0.05
CFS2012 11_13-14 13 14 99.14 0.03 0.04 0.07 99.5 0.13
CFS2012 11_14-15 14 15 99.34 0.05 0.15 0.1 99.83 0.06
CFS2012 11_15-16 15 16 99.21 0.04 0.05 0.08 99.54 0.06
CFS2012 11_16-17 16 17 99.03 0.08 0.17 0.09 99.58 0.07
CFS2012 11_17-18 17 18 98.97 0.05 0.07 0.06 99.31 0.06
CFS2012 11_18-19 18 19 96.48 1.43 0.85 0.23 100 0.79
CFS2012 12_0-1 0 1 98.41 0.12 0.12 0.22 99.36 0.36
CFS2012 12_1-2 1 2 99.11 0.08 0.17 0.12 99.71 0.07
CFS2012 12_2-3 2 3 98.85 0.07 0.1 0.19 99.41 0.09
CFS2012 12_3-4 3 4 99.2 0.07 0.21 0.16 99.86 0.08
CFS2012 12_4-5 4 5 98.76 0.09 0.18 0.33 99.61 0.12
CFS2012 12_5-6 5 6 99.19 0.07 0.18 0.13 99.78 0.06
CFS2012 12_6-7 6 7 99.05 0.06 0.07 0.11 99.52 0.13
CFS2012 12_7-8 7 8 99.5 0.06 0.19 0.1 100.05 0.07
CFS2012 12_8-9 8 9 99.32 0.06 0.06 0.09 99.71 0.07
CFS2012 12_9-10 9 10 99.17 0.06 0.12 0.23 99.79 0.08
CFS2012 12_10-11 10 11 99.01 0.07 0.16 0.31 99.76 0.06
CFS2012 12_11-12 11 12 99.52 0.08 0.06 0.11 100 0.12
CFS2012 12_12-13 12 13 98.99 0.08 0.07 0.13 99.46 0.09
CFS2012 12_13-14 13 14 99.3 0.05 0.05 0.09 99.68 0.08
CFS2012 12_14-15 14 15 99.31 0.03 0.05 0.1 99.7 0.11
CFS2012 12_15-16 15 16 99.25 0.04 0.05 0.11 99.58 0.08
CFS2012 12_16-17 16 17 99.31 0.04 0.05 0.11 99.63 0.04
CFS2012 12_17-18 17 18 99.51 0.09 0.05 0.11 99.89 0.03
CFS2012 12_18-19 18 19 99.43 0.09 0.05 0.12 99.81 0.02
CFS2012 12_19-20 19 20 99.15 0.04 0.06 0.11 99.51 0.04
CFS2012 12_20-21 20 21 94.53 2.93 0.3 0.58 99.78 1.21
CFS2012 12_21-22 21 22 97.26 1.51 0.13 0.1 99.74 0.60
CFS2012 12_22-23 22 23 99.71 0.09 0.08 0.07 100.1 0.04
CFS2012 12_23-24 23 24 99.43 0.06 0.13 0.06 99.83 0.05
CFS2012 12_24-25 24 25 99.58 0.07 0.1 0.08 99.97 0.04
CFS2012 12_25-26 25 26 95.98 1.49 1.56 0.1 100.15 0.87
CFS2012 12_26-27 26 27 97.4 1.22 0.27 0.06 99.76 0.69
CFS2012 12_27-28 27 28 95.09 2.96 0.14 0.07 99.68 1.25
CFS2012 13_0-1 0 1 97.8 0.06 0.07 0.13 99.27 1.10
Page 25 of 29 Doc ID 661944773/v1
Hole & Sample # From To SiO2 (%)
Al2O3 (%)
Fe2O3 (%)
TiO2 (%)
Total (%)
LOI (%)
CFS2012 13_1-2 1 2 98.75 0.06 0.08 0.16 99.45 0.28
CFS2012 13_2-3 2 3 98.29 0.06 0.06 0.14 98.73 0.09
CFS2012 13_3-4 3 4 99.56 0.06 0.04 0.08 99.91 0.07
CFS2012 13_4-5 4 5 99.46 0.07 0.04 0.06 99.78 0.05
CFS2012 13_5-6 5 6 99.15 0.02 0.03 0.06 99.33 0.02
CFS2012 13_6-7 6 7 99.82 0.05 0.03 0.06 100.1 0.07
CFS2012 13_7-8 7 8 99.45 0.03 0.04 0.08 99.75 0.05
CFS2012 13_8-9 8 9 99.56 0.04 0.07 0.14 100.05 0.14
CFS2012 13_9-10 9 10 99.38 0.05 0.06 0.13 99.88 0.15
CFS2012 13_10-11 10 11 99.46 0.04 0.04 0.13 99.85 0.11
CFS2012 13_11-12 11 12 99.45 0.03 0.05 0.11 99.85 0.11
CFS2012 13_12-13 12 13 99.63 0.03 0.04 0.12 100.05 0.12
CFS2012 13_13-14 13 14 99.3 0.04 0.05 0.12 99.73 0.12
CFS2012 13_14-15 14 15 99.65 0.06 0.06 0.11 100.1 0.13
CFS2012 13_15-16 15 16 95.32 2.76 0.31 0.21 99.98 1.25
CFS2012 13_16-17 16 17 98.21 0.88 0.09 0.11 99.8 0.41
CFS2012 13_17-18 17 18 99.32 0.09 0.06 0.09 99.78 0.12
CFS2012 13_18-19 18 19 99.58 0.05 0.05 0.08 99.93 0.08
CFS2012 13_19-20 19 20 99.37 0.04 0.04 0.07 99.72 0.11
CFS2012 13_20-21 20 21 99.59 0.05 0.03 0.06 99.93 0.10
CFS2012 13_21-22 21 22 99.44 0.15 0.06 0.07 99.88 0.07
CFS2012 13_22-23 22 23 99.26 0.1 0.07 0.07 99.73 0.12
CFS2012 13_23-24 23 24 98.57 0.55 0.13 0.13 99.85 0.32
CFS2012 13_24-25 24 25 96.94 1.25 0.47 0.42 99.97 0.59
CFS2012 14_0-1 0 1 98.73 0.07 0.1 0.19 100 0.77
CFS2012 14_1-2 1 2 99.17 0.07 0.09 0.16 99.9 0.28
CFS2012 14_2-3 2 3 99.38 0.06 0.09 0.17 99.93 0.13
CFS2012 14_3-4 3 4 99.59 0.06 0.09 0.16 100.15 0.11
CFS2012 14_4-5 4 5 99.47 0.06 0.08 0.15 99.94 0.07
CFS2012 14_5-6 5 6 99.42 0.07 0.09 0.16 99.95 0.11
CFS2012 14_6-7 6 7 99.54 0.07 0.09 0.14 100.05 0.09
CFS2012 14_7-8 7 8 99.66 0.08 0.06 0.1 100.05 0.07
CFS2012 14_8-9 8 9 99.28 0.09 0.05 0.08 99.72 0.12
CFS2012 14_9-10 9 10 99.57 0.07 0.05 0.08 99.93 0.06
CFS2012 14_10-11 10 11 99.6 0.07 0.05 0.08 99.98 0.09
CFS2012 14_11-12 11 12 99.63 0.06 0.04 0.05 100 0.13
CFS2012 14_12-13 12 13 99.36 0.05 0.09 0.18 99.87 0.07
CFS2012 14_13-14 13 14 99.56 0.06 0.07 0.12 100 0.09
CFS2012 14_14-15 14 15 99.06 0.07 0.14 0.27 99.8 0.09
CFS2012 14_15-16 15 16 99.13 0.08 0.19 0.36 100.05 0.12
CFS2012 14_16-17 16 17 99.26 0.06 0.13 0.25 99.95 0.09
CFS2012 14_17-18 17 18 99.8 0.04 0.04 0.08 100.2 0.10
CFS2012 14_18-19 18 19 99.4 0.03 0.04 0.08 99.72 0.09
CFS2012 14_19-20 19 20 99.76 0.04 0.05 0.08 100.1 0.11

Page 26 of 29 Doc ID 661944773/v1
Hole & Sample # From To SiO2 (%)
Al2O3 (%)
Fe2O3 (%)
TiO2 (%)
Total (%)
LOI (%)
CFS2012 14_20-21 20 21 99.37 0.03 0.05 0.1 99.74 0.10
CFS2012 14_21-22 21 22 99.8 0.07 0.06 0.12 100.3 0.12
CFS2012 14_22-23 22 23 99.35 0.05 0.04 0.11 99.7 0.08
CFS2012 14_23-24 23 24 99.59 0.06 0.06 0.16 100.05 0.11
CFS2012 14_24-25 24 25 99.3 0.04 0.05 0.12 99.67 0.11
CFS2012 14_25-26 25 26 99.33 0.1 0.08 0.21 99.97 0.16
CFS2012 14_26-27 26 27 99.24 0.06 0.07 0.14 99.68 0.10
CFS2012 14_27-28 27 28 94.76 3.2 0.18 0.34 100.1 1.22
CFS2012 15_0-1 0 1 98.83 0.15 0.15 0.3 99.69 0.14
CFS2012 15_1-2 1 2 99.37 0.07 0.09 0.18 100.55 0.74
CFS2012 15_2-3 2 3 99.23 0.04 0.06 0.13 99.67 0.14
CFS2012 15_3-4 3 4 99.47 0.03 0.05 0.11 99.79 0.07
CFS2012 15_4-5 4 5 99.46 0.08 0.07 0.12 99.91 0.11
CFS2012 15_5-6 5 6 98.99 0.13 0.09 0.19 99.65 0.17
CFS2012 15_6-7 6 7 88.16 5.37 2.88 0.52 100.3 3.08
CFS2012 15_7-8 7 8 88.73 5.09 3.38 0.3 100.1 2.38
CFS2012 16_0-1 0 1 98.74 0.23 0.24 0.32 99.85 0.20
CFS2012 16_1-2 1 2 98.59 0.32 0.31 0.32 99.93 0.22
CFS2012 16_2-3 2 3 99.46 0.08 0.17 0.32 100.25 0.09
CFS2012 16_3-4 3 4 99.2 0.09 0.09 0.15 99.74 0.10
CFS2012 16_4-5 4 5 99.44 0.07 0.09 0.15 99.9 0.05
CFS2012 16_5-6 5 6 98.93 0.04 0.08 0.16 99.84 0.50
CFS2012 16_6-7 6 7 99.08 0.06 0.14 0.29 99.87 0.14
CFS2012 16_7-8 7 8 99.09 0.06 0.16 0.33 99.94 0.13
CFS2012 16_8-9 8 9 99.29 0.18 0.18 0.35 100.3 0.12
CFS2012 16_9-10 9 10 99.39 0.15 0.09 0.17 100 0.09
CFS2012 16_10-11 10 11 99.41 0.07 0.15 0.27 100.1 0.11
CFS2012 16_11-12 11 12 99.38 0.07 0.1 0.17 99.94 0.14
CFS2012 16_12-13 12 13 99.64 0.06 0.1 0.18 100.15 0.10
CFS2012 16_13-14 13 14 99.53 0.05 0.06 0.09 99.9 0.11
CFS2012 16_14-15 14 15 98.5 0.27 0.05 0.09 99.15 0.12
CFS2012 16_15-16 15 16 99.34 0.05 0.05 0.11 99.71 0.10
CFS2012 16_16-17 16 17 99.47 0.12 0.05 0.13 99.91 0.10
CFS2012 16_17-18 17 18 99.47 0.04 0.05 0.11 99.81 0.10
CFS2012 16_18-19 18 19 99.61 0.05 0.03 0.09 99.92 0.09
CFS2012 16_19-20 19 20 99.25 0.06 0.04 0.13 99.66 0.14
CFS2012 16_20-21 20 21 99.82 0.03 0.03 0.1 100.1 0.11
CFS2012 16_21-22 21 22 99.36 0.06 0.04 0.1 99.72 0.12
CFS2012 16_22-23 22 23 97.27 1.28 0.18 0.45 99.96 0.64
CFS2012 17_0-1 0 1 98.13 0.13 0.54 0.82 99.99 0.15
CFS2012 17_1-2 1 2 98.34 0.12 0.35 0.52 99.62 0.16
CFS2012 17_2-3 2 3 99 0.1 0.19 0.28 99.77 0.12
CFS2012 17_3-4 3 4 98.93 0.09 0.21 0.31 99.76 0.12
CFS2012 17_4-5 4 5 98.55 0.14 0.38 0.27 99.55 0.12

Page 27 of 29 Doc ID 661944773/v1
Hole & Sample # From To SiO2 (%)
Al2O3 (%)
Fe2O3 (%)
TiO2 (%)
Total (%)
LOI (%)
CFS2012 17_5-6 5 6 98.56 0.2 0.41 0.23 99.64 0.17
CFS2012 17_6-7 6 7 99.24 0.08 0.15 0.16 99.78 0.09
CFS2012 17_7-8 7 8 99.46 0.08 0.13 0.15 99.97 0.08
CFS2012 17_8-9 8 9 98.77 0.23 0.25 0.16 99.72 0.25
CFS2012 17_9-10 9 10 98.17 0.52 0.44 0.22 99.79 0.35
CFS2012 17_10-11 10 11 98.03 0.55 0.5 0.33 99.88 0.33
CFS2012 17_11-12 11 12 97.75 0.56 0.58 0.43 99.8 0.34
CFS2012 17_12-13 12 13 98.37 0.39 0.33 0.23 99.7 0.27
CFS2012 17_13-14 13 14 98.58 0.53 0.31 0.12 99.96 0.33
CFS2012 17_14-15 14 15 99.1 0.12 0.09 0.08 99.57 0.11
CFS2012 17_15-16 15 16 99.35 0.11 0.09 0.08 99.8 0.09
CFS2012 17_16-17 16 17 99.07 0.14 0.12 0.09 99.57 0.09
CFS2012 17_17-18 17 18 99.39 0.15 0.17 0.21 100.1 0.12
CFS2012 17_18-19 18 19 99.1 0.39 0.12 0.12 100 0.22
CFS2012 17_19-20 19 20 98.8 0.42 0.18 0.13 99.87 0.26
CFS2012 17_20-21 20 21 98.92 0.25 0.19 0.17 99.8 0.17
CFS2012 17_21-22 21 22 99.46 0.1 0.1 0.13 99.97 0.09
CFS2012 17_22-23 22 23 98.72 0.07 0.08 0.09 99.11 0.11
CFS2012 17_23-24 23 24 99.41 0.09 0.08 0.09 99.8 0.09
CFS2012 17_24-25 24 25 99.53 0.06 0.05 0.06 99.84 0.10
CFS2012 17_25-26 25 26 99.56 0.05 0.05 0.05 99.86 0.12
CFS2012 17_26-27 26 27 99.12 0.04 0.05 0.05 99.4 0.10
CFS2012 17_27-28 27 28 99.75 0.07 0.06 0.07 100.1 0.10
CFS2012 17_28-29 28 29 99.4 0.08 0.07 0.07 99.84 0.16
CFS2012 17_29-30 29 30 99.79 0.07 0.06 0.07 100.15 0.11
CFS2012 17_30-31 30 31 99.53 0.06 0.06 0.05 99.9 0.15
CFS2012 17_31-32 31 32 99.33 0.06 0.08 0.07 99.76 0.14
CFS2012 17_32-33 32 33 99.4 0.06 0.08 0.08 99.82 0.12
CFS2012 17_33-34 33 34 99.72 0.07 0.08 0.07 100.15 0.12
CFS2012 17_34-35 34 35 99.5 0.08 0.08 0.06 99.93 0.13
CFS2012 18_0-1 0 1 99.26 0.13 0.13 0.22 100.15 0.33
CFS2012 18_1-2 1 2 98.75 0.12 0.19 0.32 99.61 0.13
CFS2012 18_2-3 2 3 98.96 0.13 0.23 0.39 99.96 0.14
CFS2012 18_3-4 3 4 99.55 0.07 0.12 0.22 100.15 0.14
CFS2012 18_4-5 4 5 98.8 0.48 0.19 0.22 100.05 0.31
CFS2012 18_5-6 5 6 99.3 0.14 0.08 0.13 99.88 0.19
CFS2012 18_6-7 6 7 99.49 0.15 0.08 0.13 100.1 0.19
CFS2012 18_7-8 7 8 96.92 1.11 0.44 0.38 99.67 0.66
CFS2012 18_8-9 8 9 97.55 1.44 0.13 0.13 100 0.67
CFS2012 18_9-10 9 10 96.79 1.79 0.12 0.13 99.73 0.77
CFS2012 18_10-11 10 11 96.61 1.58 0.46 0.17 99.71 0.77
CFS2012 18_11-12 11 12 98.98 0.14 0.16 0.1 99.58 0.12
CFS2012 18_12-13 12 13 99.31 0.1 0.1 0.1 99.81 0.11
CFS2012 18_13-14 13 14 99.05 0.11 0.11 0.08 99.54 0.10
Page 28 of 29 Doc ID 661944773/v1
Hole & Sample # From To SiO2 (%)
Al2O3 (%)
Fe2O3 (%)
TiO2 (%)
Total (%)
LOI (%)
CFS2012 19_0-1 0 1 97.76 0.16 0.15 0.21 99.83 1.43
CFS2012 19_1-2 1 2 97.81 0.3 0.75 0.2 99.82 0.68
CFS2012 19_2-3 2 3 95.7 1.1 1.54 0.23 99.76 1.10
CFS2012 19_3-4 3 4 95.37 1.84 0.77 0.2 99.33 1.02
CFS2012 19_4-5 4 5 94.44 2.53 0.9 0.21 99.62 1.40
CFS2012 19_5-6 5 6 93.99 2.99 0.74 0.17 99.37 1.36
CFS2012 19_6-7 6 7 95.11 2.29 0.8 0.18 99.77 1.29
CFS2012 19_7-8 7 8 94.86 2.09 0.84 0.16 99.21 1.14
CFS2012 19_8-9 8 9 95.12 2.55 0.6 0.13 99.81 1.30
CFS2012 19_9-10 9 10 95.33 2.3 0.58 0.12 99.6 1.17
CFS2012 19_10-11 10 11 95.83 2.29 0.55 0.12 99.99 1.08
CFS2012 19_11-12 11 12 95.74 2.38 0.51 0.1 99.97 1.10
CFS2012 19_12-13 12 13 95.9 2.21 0.49 0.09 99.81 1.01
CFS2012 19_13-14 13 14 96.12 1.8 0.54 0.09 99.55 0.88
CFS2012 19_14-15 14 15 96.25 1.73 0.55 0.14 99.59 0.80
CFS2012 19_15-16 15 16 95.98 2.02 0.52 0.09 99.68 0.92
CFS2012 19_16-17 16 17 96.08 2.03 0.47 0.08 99.7 0.93
CFS2012 19_17-18 17 18 95.19 2.32 1.07 0.09 99.93 1.12
CFS2012 19_18-19 18 19 92.51 3.63 1.54 0.1 99.65 1.72
CFS2012 20_0-1 0 1 97.65 0.06 0.06 0.08 99.59 1.64
CFS2012 20_1-2 1 2 99.17 0.06 0.05 0.08 99.68 0.27
CFS2012 20_2-3 2 3 99.24 0.03 0.07 0.07 99.68 0.24
CFS2012 20_3-4 3 4 98.98 0.04 0.05 0.09 99.57 0.37
CFS2012 20_4-5 4 5 96.9 0.19 2.02 0.16 99.92 0.58
CFS2012 20_5-6 5 6 97.07 0.55 1.39 0.22 99.94 0.66
CFS2012 20_6-7 6 7 97.43 0.66 1.06 0.22 100.05 0.64
CFS2012 20_7-8 7 8 95.48 0.82 2.06 0.3 99.66 0.87
CFS2012 20_8-9 8 9 96.57 1.34 1.05 0.18 100.05 0.82
CFS2012 20_9-10 9 10 96.52 1.63 0.46 0.11 99.56 0.73
CFS2012 20_10-11 10 11 96.66 1.72 0.48 0.12 99.83 0.72
CFS2012 20_11-12 11 12 97.72 1.12 0.39 0.12 100 0.56
CFS2012 20_12-13 12 13 98.88 0.7 0.22 0.1 100.35 0.36
CFS2012 20_13-14 13 14 98.36 0.71 0.32 0.08 99.94 0.40
CFS2012 20_14-15 14 15 98.67 0.22 0.27 0.09 99.52 0.18
CFS2012 20_15-16 15 16 99.04 0.14 0.16 0.09 99.65 0.17
CFS2012 20_16-17 16 17 99.11 0.09 0.1 0.08 99.63 0.16
CFS2012 20_17-18 17 18 98.86 0.09 0.09 0.06 99.28 0.12
CFS2012 20_18-19 18 19 99.62 0.11 0.07 0.08 100.1 0.16
CFS2012 20_19-20 19 20 97.89 1.03 0.29 0.13 99.98 0.56
CFS2012 20_20-21 20 21 91.03 4.01 2.84 0.11 100.2 2.07
CFS2012 20_21-22 21 22 95.9 2.29 0.42 0.07 99.86 1.05
CFS2012 20_22-23 22 23 96.11 2.11 0.5 0.07 99.81 0.86
CFS2012 20_23-24 23 24 96.23 1.97 0.45 0.1 99.75 0.88
CFS2012 21_0-1 0 1 99.07 0.08 0.14 0.08 99.94 0.49

Page 29 of 29 Doc ID 661944773/v1
Hole & Sample # From To SiO2 (%)
Al2O3 (%)
Fe2O3 (%)
TiO2 (%)
Total (%)
LOI (%)
CFS2012 21_1-2 1 2 99.26 0.06 0.04 0.08 99.74 0.22
CFS2012 21_2-3 2 3 99.26 0.04 0.14 0.09 99.74 0.11
CFS2012 21_3-4 3 4 99.48 0.07 0.06 0.12 99.88 0.07
CFS2012 21_4-5 4 5 99.31 0.06 0.14 0.13 99.82 0.07
CFS2012 21_5-6 5 6 99.32 0.06 0.07 0.15 99.79 0.13
CFS2012 21_6-7 6 7 99.43 0.07 0.16 0.14 99.96 0.06
CFS2012 21_7-8 7 8 99.33 0.03 0.04 0.09 99.61 0.09
CFS2012 21_8-9 8 9 99.28 0.04 0.17 0.14 99.81 0.07
CFS2012 21_9-10 9 10 99.22 0.03 0.05 0.14 99.64 0.10
CFS2012 21_10-11 10 11 99.15 0.13 0.2 0.2 99.91 0.09
CFS2012 21_11-12 11 12 99.31 0.04 0.08 0.19 99.78 0.08
CFS2012 21_12-13 12 13 99.33 0.05 0.21 0.2 99.99 0.06
CFS2012 21_13-14 13 14 99.38 0.06 0.08 0.2 99.92 0.09
CFS2012 21_14-15 14 15 99.26 0.05 0.21 0.13 99.88 0.09
CFS2012 21_15-16 15 16 99.46 0.06 0.07 0.15 99.91 0.10
CFS2012 21_16-17 16 17 99.49 0.09 0.15 0.11 100 0.07
CFS2012 21_17-18 17 18 99.47 0.09 0.09 0.21 100.05 0.09
CFS2012 21_18-19 18 19 99.31 0.06 0.21 0.2 99.93 0.04
CFS2012 21_19-20 19 20 99.29 0.06 0.1 0.21 99.87 0.13
CFS2012 21_20-21 20 21 99.17 0.05 0.16 0.17 99.72 0.09
CFS2012 21_21-22 21 22 98.59 0.12 0.17 0.24 99.38 0.19
CFS2012 21_22-23 22 23 98.65 0.33 0.29 0.25 99.86 0.19
CFS2012 22_0-1 0 1 98.76 0.12 0.17 0.33 99.97 0.50
CFS2012 22_1-2 1 2 99.19 0.08 0.25 0.32 100.05 0.06
CFS2012 22_2-2.5 2 3 99.33 0.07 0.13 0.25 99.94 0.08