sincerest form of flattery? product innovation and ...jthurk/papers/dieselinnovation.pdf ·...
TRANSCRIPT

Sincerest Form of Flattery?
Product Innovation and Imitation
in the European Automobile Industry?
Jeff Thurk†
May 2018
Abstract
I study the impact of imitation on the returns to technological innovation when prod-
ucts are differentiated. Using data that capture Volkswagen’s introduction of the
tdi diesel engine and the technology’s imitation by rival European firms, I estimate
a discrete choice, oligopoly model of horizontally differentiated products. Imitation
benefited consumers by increasing product variety and reducing prices but also limited
Volkswagen to 14% of potential profits from the tdi. Volkswagen’s ability to differenti-
ate its diesel models made the tdi a worthwhile investment nonetheless. This indicates
firms can mitigate imitation risk by bundling easy-to-copy technological advancements
with difficult-to-copy product characteristics including brand.
Keywords: Innovation, Imitation, General Technology, Differentiated Goods, Brands.
JEL Codes: O31, O33, O34, L62.
?
I thank the editor, Alessandro Gavazza, and two anonymous referees for helpful suggestions which improvedthe manuscript. I also thank Kenneth Hendricks, Tom Holmes, Eugenio Miravete, and Marıa J. Moral aswell as audiences at various seminar and conference presentations. This research was supported in part bythe Notre Dame Center for Research Computing and the Institute for Scholarship in the Liberal Arts. Iam solely responsible for any errors.
† University of Notre Dame, Department of Economics, 3047 Nanovic Hall, Notre Dame, IN 46556-7000.Phone: 574-631-3083. E–mail: [email protected]; http://www.nd.edu/ jthurk/

I. INTRODUCTION
Economic growth depends on the willingness of firms to invest in developing new technologies
[Schumpeter, 1942; Lucas, 1988; Romer, 1990], while the ability of rivals to easily imitate
new technology [Mansfield, Schwartz, and Wagner, 1981] limits the incentive to innovate
potentially leading to sub-optimal investment [Aghion, Harris, Howitt, and Vickers, 2001].
When goods are differentiated, however, a firm may be able to minimize the effects of
imitation by leveraging other characteristics of its product [Petrin, 2002].
I study this trade-off in the context of the European automobile industry where the
introduction of the turbocharged direct injection (tdi) diesel engine by volkswagen in
1989 took diesel passenger automobiles from a niche product category to the dominant
European engine choice in less than a decade – a dramatic transformation which has largely
failed to attract the interest of innovation economists.1,2 These new turbodiesel engines were
significantly quieter, cleaner (i.e., no black smoke), and more reliable than their predecessors
while maintaining superior fuel efficiency and torque relative to comparable gasoline models.3
While volkswagen did patent technology associated with the tdi, the quick introduction
of turbodiesels by rival European firms such as psa and renault indicates the technology’s
generality was difficult to defend.4 Using automobile registration data from Spain – a
country which exhibited diesel adoption rates representative of Europe as a whole – I ask
two questions: What was the impact of imitation on equilibrium prices and profits? Did
imitation of the tdi make this new technology an ex post poor investment?
I answer these questions by estimating an equilibrium discrete choice oligopoly model
to study an industry which is far from competitive and where products are horizontally
differentiated. The structural demand-side model provides for flexible substitution patterns
across automobile characteristics and segments while accounting for product characteristics
known to consumers and firms but not to the researcher. The addition of a Bertrand-Nash
1 See Automobile Registration and Market Share of Diesel Vehicles in “ACEA European Union EconomicReport,” December 2009. This quick adoption process compares favorably to many other new technologiessuch as steam and diesel locomotives [Greenwood, 1997]; the basic oxygen furnaces for steel mills [Oster,1982]; and the coal-fired, steam-electric high-pressure power generation [Rose and Joskow, 1990].
2 Perhaps a plausible explanation for this state of affairs is that well over two decades after the tdibreakthrough the European automobile market remains an oddity in the global automobile industry asdiesel passenger vehicles failed to succeed anywhere else except, recently, in India. See Chug, Cropper,and Narain [2011].
3 I use the term “tdi” to refer specifically to volkswagen group diesel models which use the tdi technologyand the term “turbodiesel” to refer more generally to any diesel vehicle which features a turbocharger pluscylinder-direct fuel injection.
4 It is the generality of this technology which allowed it to be imitated and reused easily by other manufac-turers. See Bresnahan [2010].
– 1 –

pricing equilibrium not only increases the identification of product elasticities (Reynaert and
Verboven, 2013) but also allows for the analysis of alternative counterfactual equilibria.
In this framework consumers consider a variety of product characteristics when making
their purchase decisions leading to greater competition among firms with similar product
sets (in characteristic space). Consequently, the model allows for greater competition in the
diesel segment after the introduction of turbodiesels by rival European firms while the rich
substitution patterns extend competition to the gasoline segment as well. The estimated
model, therefore, disciplines the answers to the above questions by modulating the degree
to which product differentiation mitigates imitation risk.
I find that rival firms’ introduction of diesel models equipped with turbodiesel engines
based on the same technology as the tdi limited volkswagen to capture only 14% of the
potential innovative rents associated with the tdi during the sample though the impact of
imitation varied significantly across firms. For instance, the introduction of turbodiesels
by psa and renault generated substantial losses for volkswagen as these firms both
introduced a large number of turbodiesels and had product portfolios which competed heavily
with volkswagen automobiles. In contrast, the introduction of turbodiesels by fiat and
ford had a much smaller effect on volkswagen profits. This indicates that volkswagen
was able to differentiate its diesel fleet from these competitors but not from psa or renault.
It would be tempting to conclude that imitation made the tdi a poor investment. Using
a simple model of innovation and imitation, I show just the opposite as consumer demand
for the tdi increased overall market size while volkswagen’s ability to differentiate its
diesel models enabled the firm to generate substantial profits from its turbodiesels. Over
the course of the decade volkswagen’s diesel vehicles generated e3.6 billion in profit for
the firm and their importance to VW’s bottom-line grew over the sample: accounting for
10.5% of profits in 1992 when the tdi was new and 61.1% of profits by the year 2000 when
customer adoption had reached its steady-state. When I account for cannibalization of
gasoline models as well as the replacement of pre-existing diesel engines based on the legacy
technology, volkswagen’s benefit from the tdi ranges from e2.1 billion to e2.6 billion in
the Spanish market alone.
The story of the tdi, therefore, is one in which the innovator generated a lot of profit
from this new technology despite widespread imitation while consumers benefited from in-
creased variety and low retail prices. Thus, the market equilibrium simultaneously delivered
both dynamic (i.e., a new product) and static (i.e., low prices) efficiencies leading to an
unambiguous increase in welfare as both firms and consumers benefited from the technology.
Moreover, it did so for a technology in which patents – the most common public policy
– 2 –

tool to encourage innovation – proved to be ineffective. This is significant since patent
protection itself creates a distortion by promoting dynamic over static efficiencies. Business
trade groups and government policy-makers often cite intellectual property protection as an
important issue towards fostering innovation but surprisingly there exist few if any reliable
estimates as to the magnitude of the effect of imitation on firm profits. To my knowledge
this is the first paper to use a structural equilibrium model to do so.
A further contribution of this paper is to find empirical evidence that economic innovation
requires much more than just technological advancement – an idea which dates back to
Schumpeter [1934]. For Schumpeter, new goods, brands, or firms were the embodiment of
many things and “economic development”, as he put it, occurred precisely because of new
combinations of resources where technological progress was only a component. We see this
effect in the case of the tdi as volkswagen integrated the easy-to-copy tdi technology into
its difficult-to-copy volkswagen brand which enabled the firm to appropriate profits from
the technology. Just as Schumpeter also argued that the role of dynamic efficiencies (i.e.,
new goods and firms) are more important than static inefficiencies (i.e., market power), my
results indicate that in mature industries economists should think of product differentiation
specifically, or brands more generally, as an important and perhaps necessary component of
technological progress.
The remaining paper is organized as follows. I review this paper’s contribution to relevant
literature in Section II and discuss Volkswagen’s introduction of the tdi innovation, its
imitation by European auto makers, and summarize the main features of the Spanish market
for diesel automobiles in Section III. In Section IV, I describe the equilibrium model of
discrete choice demand for horizontally differentiated products as well as the corresponding
supply-side pricing model. Section V describes the estimation approach, discusses identifi-
cation, and reports the estimation results. In Section VI, I use a series of counterfactual
experiments to measure the effect of imitation on equilibrium prices and profits. Finally,
Section VII summarizes the results and contribution as well as discusses avenues for future
research. Details of the estimation, additional results, data sources, and institutional details
of the Spanish automobile market are documented in the Appendix.
– 3 –

II. RELATED LITERATURE
In this paper, I study the impact of imitation on dynamic and static efficiency. As such, it
contributes to a large literature on competition, innovation, and imitation which dates back
to Schumpeter [1942] who argued that temporary market power was needed to encourage
innovation.5 He theorized the long run benefits of new ideas (e.g., new products, better
processes) generate dynamic efficiencies which swamp any temporary static inefficiencies
due to market power.6
Mansfield et al. [1981] use firm-level survey data to show the cost of imitating a new
technology is 65% the research & development cost originally required to develop it. Thus,
successful technologies are often easily imitated and imitation of a new technology by rival
firms, consequently, extracts surplus from the innovating firm. In a rational expectations
equilibrium, the innovator internalizes this risk leading to low levels of equilibrium research
and development – a point addressed by Aghion et al. [2001]. Patent systems therefore
provide a state-sanctioned monopoly to guarantee temporary rents to the innovator (i.e., a
static inefficiency) in hopes of increasing equilibrium levels of research.
Whether imitation does actually impede innovation is fundamentally a quantitative issue.
My finding that imitation and innovation can coexist even when the former is significant adds
to a growing concern that modern patent systems do more harm than good.7 Waldfogel [2012]
documents that increased imitation in digital music was more than offset by reductions in the
cost of bringing new music to market so the equilibrium effect of imitation was to generate a
net increase in the quality of music available to consumers. Boldrin and Levine [2008] argue
the first-mover advantage inherent in the innovative process is sufficient to drive research.
In my data, however, there appears to be little if any first mover advantage as imitation is
nearly contemporaneous with the introduction of the tdi. Instead, I identify a new channel
for innovation under imitation risk as I show the introduction of a new product can grow
the size of the pie while product differentiation enables firms to each secure their piece.
Miravete, Moral, and Thurk [2018] show that European fuel taxes and vehicle emissions
policy lowered the retail prices of diesel vehicles and increased their fuel economy, leading
price-sensitive consumers to shift consumption away from inexpensive, fuel-efficient gasoline-
powered Asian imports and towards brands which offered diesel vehicles, largely domestic
automakers. The policies therefore incentivized the adoption of the diesel among consumers
5 In his 1934 “The Theory of Economic Development” Schumpeter espoused the belief that all firms werecapable of innovation and discovery. Later in “Capitalism, Socialism, and Democracy,” he modified histheory to focus on large firms endowed with market power as the engines of growth.
6 See Gilbert [2006] and Cohen [2010] for a comprehensive literature review.7 See Hall [2009] for a review
– 4 –

and amounted to a significant trade policy. In this paper I take these policies as given and
evaluate competition among European automakers as rivals such as renault and peugeot
introduce their own turbodiesel vehicles to compete with the volkswagen tdi.
Bronnenberg, Dube, Gentzkow, and Shapiro [2015] study the purchase of branded and
non-branded products in homogenous good categories. They find the existence of information
asymmetries among seemingly identical goods which generate price dispersion. For example,
branded and generic drugs are required by law to be biologically-equivalent and therefore
homogenous yet the authors find that uninformed consumers (e.g., consumers not employed
in health care) are more likely to purchase a branded product such as Bayer aspirin. In
equilibrium, firms which offer a branded product leverage these asymmetries to charge higher
prices. In my setting products continue to be heterogenous after imitation since the final good
a consumer purchases amounts to a bundle of characteristics and the imitated technology is
only one component. Hence, I demonstrate that an effective method to mitigate the effects
of imitation is for a firm to leverage other characteristics of its product set which may include
the consumers’ valuation of its brand.
Petrin [2002] uses the random coefficients model of Berry, Levinsohn, and Pakes [1995]
– a workhorse model in the empirical literature – to show chrysler’s introduction of
the minivan generated significant profits for the firm despite imitation by gm and ford.
Moreover, he finds only minor effects from imitation since gm and ford built their minivans
on downsized versions of full-sized van platforms. The consequence was that their rear-wheel
drive vehicle was difficult to maneuver whereas the front-wheel drive chrysler minivan
handled similar to a passenger car. chrysler was therefore able to protect its minivans via
product differentiation – a similar conclusion to the one presented here. My contribution,
therefore, is to show that product differentiation can be an effective tool even when effects
of imitation are large.
It is perhaps more appropriate to think of the automobile industry as a dynamic game
where manufacturers choose investment, imitation, and product characteristics in an initial
stage and then choose price conditional on their product portfolios. While appealing,
incorporating both dynamic and static effects in a tractable empirical framework is difficult
since doing so requires the researcher to address issues of endogenous firm beliefs and multiple
equilibria, both of which are exacerbated when goods are differentiated. Petrin and Seo [2016]
consider a two-stage game where firms simultaneously choose vehicle characteristics (e.g.,
fuel efficiency) and then choose equilibrium prices. Though firms may have different beliefs
regarding competitors’ attribute choices, they understand their attribute choices influence
equilibrium prices of automobile manufacturers through own and cross-price effects.
– 5 –

Other authors evaluate the dynamics of innovation using models with little product
differentiation. A recent paper by Rust, Gillingham, Iskhakov, Munk-Nielsen, and Schjerning
[2016] studies dynamics within the Danish automobile industry but the authors simplify
static competition significantly to make the model tractable.8 Goettler and Gordon [2011]
use a quality-ladder model to show that competition by AMD led to lower innovation rates
by the industry leader Intel while Igami [2015] studies the dynamic effects of innovation in
the hard drive industry – an industry with sufficient product homogeneity that he models
firm competition as Cournot. Interestingly, he also finds that patent protection decreases
firm innovation and overall welfare.
Answers to the research questions posed here, however, depend critically on the impact
of imitation on both dynamic and static efficiency, or equivalently on the prices facing
consumers both with and without imitation. I therefore focus my efforts on a feasible
extension of the Berry et al. [1995] framework to generate realistic substitution patterns
among differentiated goods taking volkswagen’s decision to introduce the tdi as well as
its imitation by other firms as given. I then evaluate the impact of imitation by comparing
the estimated equilibrium to counterfactual equilibria where I vary competition in the diesel
segment – a similar approach as Berry and Jia [2010] who address the equilibrium effects of
low cost carriers in the airline industry. This places greater emphasis on effectively measuring
the impact of imitation on retail prices and static profits. The issue of dynamic efficiency
then centers on addressing whether the tdi was a worthwhile investment for volkswagen
given the imitation risk posed by its rivals. This in turn requires the researcher to make
plausible assumptions as to how the industry would have evolved absent the introduction of
the tdi technology. My results, therefore, amount to an ex post analysis of the incentive to
innovate under imitation risk in differentiated goods markets.
III. THE EUROPEAN MARKET FOR DIESEL AUTOMOBILES
In the late 19th century, Rudolf Diesel designed an internal combustion engine in which heavy
fuel is injected into a cylinder and self-ignites due to levels of compression much greater than
a gasoline engine. However, it was only in 1927, many years after Diesel’s death, that the
German company Bosch built the injection pump that made the development of the engine
for trucks and automobiles possible. The first diesel vehicles sold commercially followed soon
after: the 1933 Citroen Rosalie and the 1936 Mercedes-Benz 260D. Large passenger and
commercial diesel vehicles became common in Europe in the late 1950s, while preferential
8 Specifically, cars differ only in their type (i.e., diesel or gas engine) and age.
– 6 –
fuel taxation beginning in 1973 enabled diesel passenger cars to maintain a small but stable
market share.9
In 1989, Volkswagen introduced the turbocharged direct injection (tdi) diesel engine in
its Audi 100 model.10 The tdi engine was an improvement on the existing technology
as it was the first to combine a turbocharger with a fuel injector.11 The turbocharger
increases the amount of air going into the cylinders and an intercooler lowers the temperature
of the air in the turbo, thereby increasing the amount of fuel that can be injected and
burned. The addition of fuel injection enables the engine to spray fuel directly into the
combustion chamber of each cylinder which increases fuel atomization. The combination of
the two was an diesel-powered engine which was significantly quieter, cleaner (i.e., no black
smoke), and more reliable than its predecessors while maintaining superior fuel efficiency
and torque relative to comparable gasoline models.12 For the average driver, greater torque
makes the driving experience more enjoyable by increasing the responsiveness of the car.
For rival automakers, introducing their own version of the tdi (i.e., introducing their own
“turbodiesel”) only required developing an engine which combined these two established and
general technologies.
III(i). Evolution of Automobile Characteristics
The data include yearly car registrations by manufacturer, model, and fuel engine type in
Spain between 1992 and 2000. Retail prices and vehicle characteristics are from La guıa del
comprador de coches (ed. Moredi, Madrid) where I aggregate trim types within a model by
selecting the price and characteristics of the mid-range trim version of each model, i.e., the
most popular and commonly sold. I further segment the cars into small, compact, sedan,
minivan, and luxury where the last includes sports cars.13
After removing observations with extremely small market shares (mostly luxury vehicles)
the sample is an unbalanced panel comprising 99.2% of all car registrations in Spain during
9 See Miravete et al. [2018] for a more thorough discussion of initial market conditions behind the diesel’ssuccess.
10The 1987 Fiat Croma was actually the first diesel passenger car to be equipped with turbo direct-injection.Whereas the Audi 100 controlled the direct injection electronically, the Fiat Croma was mechanical. Thedifference proved crucial for commercial success as electronic controls improved both emissions and power.
11Alfred Buchi invented the turbocharger in 1905 and noted in his patent that such a technology wouldprove particularly useful to diesel engines as it increases compression in the cylinder. A turbocharger was,however, not incorporated into a passenger diesel vehicle until 1979 when peugeot introduced the model604.
12See the 2004 report “Why Diesel?” from the European Association of Automobile Manufacturers (ACEA).13See “Euro Car Segment” definition described in Section IV of “Case No. COMP/M.1406 - Hyundai/Kia.”Regulation (EEC) No. 4064/89: Merger Procedure Article 6(1)(b) Decision. Brussels, 17 March 1999.CELEX Database Document No. 399M1406.
– 7 –
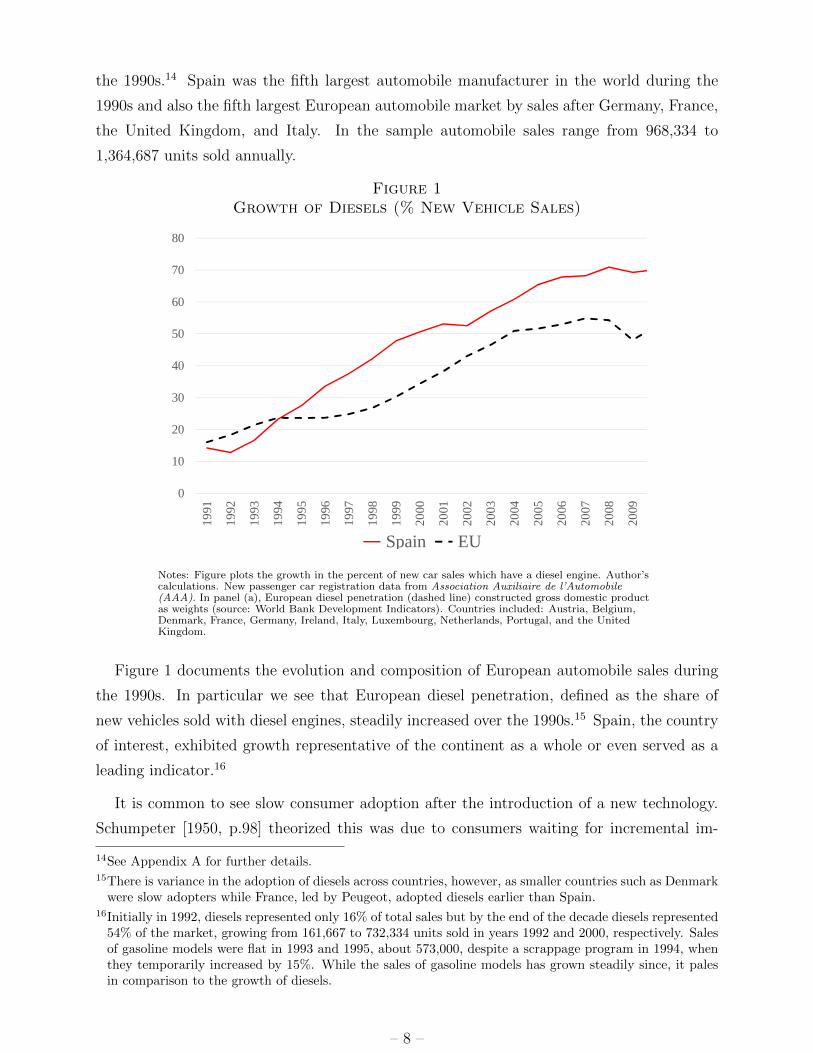
the 1990s.14 Spain was the fifth largest automobile manufacturer in the world during the
1990s and also the fifth largest European automobile market by sales after Germany, France,
the United Kingdom, and Italy. In the sample automobile sales range from 968,334 to
1,364,687 units sold annually.
Figure 1Growth of Diesels (% New Vehicle Sales)
0
10
20
30
40
50
60
70
80
1991
1992
1993
1994
1995
1996
1997
1998
1999
2000
2001
2002
2003
2004
2005
2006
2007
2008
2009
2010
Spain EU
Notes: Figure plots the growth in the percent of new car sales which have a diesel engine. Author’scalculations. New passenger car registration data from Association Auxiliaire de l’Automobile(AAA). In panel (a), European diesel penetration (dashed line) constructed gross domestic productas weights (source: World Bank Development Indicators). Countries included: Austria, Belgium,Denmark, France, Germany, Ireland, Italy, Luxembourg, Netherlands, Portugal, and the UnitedKingdom.
Figure 1 documents the evolution and composition of European automobile sales during
the 1990s. In particular we see that European diesel penetration, defined as the share of
new vehicles sold with diesel engines, steadily increased over the 1990s.15 Spain, the country
of interest, exhibited growth representative of the continent as a whole or even served as a
leading indicator.16
It is common to see slow consumer adoption after the introduction of a new technology.
Schumpeter [1950, p.98] theorized this was due to consumers waiting for incremental im-
14See Appendix A for further details.15There is variance in the adoption of diesels across countries, however, as smaller countries such as Denmark
were slow adopters while France, led by Peugeot, adopted diesels earlier than Spain.16Initially in 1992, diesels represented only 16% of total sales but by the end of the decade diesels represented
54% of the market, growing from 161,667 to 732,334 units sold in years 1992 and 2000, respectively. Salesof gasoline models were flat in 1993 and 1995, about 573,000, despite a scrappage program in 1994, whenthey temporarily increased by 15%. While the sales of gasoline models has grown steadily since, it palesin comparison to the growth of diesels.
– 8 –

provements in the technology. This idea was later formalized by Balcer and Lippman [1984]
and was used by Manuelli and Seshadri [2014] to explain the half a century time span needed
for the diffusion of tractors – an important technological advancement for the agriculture
industry. In contrast, the incredible pace of adoption of diesel automobiles suggests that
the tdi proved to be a significant technological advance and consumers gained little from
waiting for additional incremental improvements.
Table IEvolution of Diesel Supply
1992 1994 1996 1998 2000
All Gasoline Engines 97 109 124 135 134
All Diesel Engines 44 58 78 88 95
- Volkswagen 9 9 14 16 21- Fiat 6 10 12 13 13- PSA 8 9 13 13 10- Ford 4 6 8 6 7- GM 5 4 4 6 6- Mercedes 3 4 4 5 6- Renault 4 6 6 5 5- Nissan 1 2 2 4 4- Rover 2 4 5 4 4- BMW 2 2 3 3 3- Mazda 0 0 1 3 3- Mitsubishi 0 0 2 2 3- Toyota 0 1 2 3 3- Honda 0 0 1 2 2- Hyundai 0 0 0 2 2- Chrysler 0 1 1 1 1- Kia 0 0 0 0 1- Suzuki 0 0 0 0 1- Daewoo 0 0 0 0 0
Total Offered 141 167 202 223 229
Notes: Automaker ownership groups sorted in descending order by numberof diesel models offered in 2000. The volkswagen group includes brandsaudi, seat, skoda, and volkswagen.
The substantial growth in diesel sales was aided by an increase in supply.17 Table I shows
that by 1992 a consumer wishing to purchase a diesel had 44 models to choose from, or
equivalently 31% of all new cars models were equipped with diesel engines. At this point
market share of diesels in Spain amounted to 16.7% of total new car sales, up only slightly
from 14.2% when volkswagen introduced the tdi in 1989. Of the 44 diesel models available
to consumers only 9 were produced by the volkswagen group with the remainder being
largely offered by rival European firms.
17In “Theory of Economic Development” Schumpeter theorized it was supply and not demand whichgenerated growth.
– 9 –

As the decade progressed, rival European auto makers, particularly fiat and psa, in-
creased the number of diesels in their portfolios.18 Asian automakers were slower to adopt
the new technology and only began to enter the space at the end of the decade.19 This
suggests a low cost of imitation – a trait which characterizes all “general technologies” (e.g.,
Bresnahan 2010) – due to the fact the technology can be easily modified, reverse-engineered,
or even licensed as in the case of many of the Asian car makers who chose not to develop the
technology themselves but rather purchased the diesel engines from European firms (e.g.,
toyota).20,21
Automobiles may differ in several different dimensions. Since the diesel and gasoline ver-
sion of a particular car model share the same chassis, a consumer contemplating the purchase
of an Audi A4 gas or diesel car bases her decision on differences in engine performance and
not on car size. Diesel vehicles are about 10% heavier than similar gasoline versions; have
15% to 20% less horsepower; and are between one and two thousand euros more expensive.
They are also more fuel efficient as they consume 20% − 40% less fuel than a comparable
gasoline model enabling a diesel to attain better fuel economy as they travel about 63%
farther on a euro worth of fuel.
Of course, engine type is not the only characteristic consumers consider when they
purchase a new car. From Table II we observe that most purchases are in the compact,
small, and sedan segments though there is growth in the minivan segment across the
decade largely driven by an increase in vehicle choices in the segment. small vehicles
tend to be less expensive and more fuel efficient (i.e., low c90) while luxury cars and
minivans are just the opposite. sedans and luxury cars also tend to be more powerful (i.e.,
18Outside of the volkswagen group, the data do not allow me to rigorously identify whether a specific dieselmodel is equipped with a turodiesel technology though there is evidence that automakers incorporated theturbodiesel technology in their new diesel models and replaced the old Perkins technology in their existingdiesel models. For example, in 1993 peugeot introduced the technology in its 205 and 405 STDT (specialtrim diesel turbo) vehicles. Since turbodiesels offer many advantages to the old Perkins technology, anassumption which underlies much of the analysis is that firms incorporated the new technology in theirdiesel fleet, particularly in new vehicles.
19Asian imports include daewoo, honda, hyundai, kia, mazda, mitsubishi, nissan, suzuki, andtoyota.
20A natural question is why these Asian firms not offer their own turbodiesels. One possibility is that thepopularity of diesels was largely a European phenomenon so European auto makers chose to invest in thetechnology since a significant portion of their profits came from European consumers whereas Europe wasa small market for Asian auto makers. The percent of revenue from the European market for bmw, psa,renault, and volkswagen was 65%, 93%, 84%, and 74%, respectively, while for honda, mazda, andtoyota the shares are substantially smaller – 11%, 10%, and 8%, respectively (source: company 10-KSEC filings).
21Is this experience unique? Using firm-level survey data, Mansfield et al. [1981] document that 60% ofpatented technologies are imitated within four years of introduction indicating that patent protectionalone is insufficient to protect a firm’s intellectual property. Put differently, their finding suggests thatmany technologies are indeed “general technologies.”
– 10 –

Table IIVehicle Characteristics Available to Consumers
segment models share price c90 kpe size hpw
1992
By Fuel Type
Diesel 44 16.70 12.27 4.45 46.37 73.87 3.14Gasoline 97 83.30 11.23 5.41 29.52 71.80 4.14
By Segment
Compact 31 35.79 10.96 5.33 32.07 74.34 3.98Luxury 39 5.77 24.01 6.49 25.75 87.07 4.84Minivan 4 0.32 17.28 6.93 24.21 81.66 3.79Sedan 39 22.31 14.26 5.69 30.27 80.10 4.26Small 28 35.82 7.98 4.68 35.00 62.51 3.65
Total 141 100.00 11.40 5.25 32.33 72.15 3.97
2000
By Fuel Type
Diesel 95 53.66 16.24 4.59 37.90 76.63 3.15Gasoline 134 46.34 14.68 5.76 23.95 73.78 3.93
By Segment
Compact 56 34.43 14.86 5.00 32.53 76.54 3.59Luxury 40 3.72 34.53 6.72 23.31 89.72 5.17Minivan 32 3.13 20.80 6.39 25.91 83.47 3.16Sedan 52 25.97 19.45 5.26 31.60 81.92 3.63Small 49 32.75 10.42 4.86 31.61 66.36 3.18
Total 229 100.00 15.52 5.13 31.43 75.31 3.51
Notes: share is the market share as defined by automobiles sold. price is denominated in the equivalent ofthousands of 1994 euros and includes value added taxes and import tariffs. c90 is a measure of “Fuel Efficiency”and is the fuel consumption (in liters) required to cover 100 kilometers at a constant speed of 90 kilometers perhour. A car becomes more fuel efficient as c90 decreases. kpe is a measure of “Fuel Economy” and is the distance,measured in kilometers, traveled per euro of fuel. size is length×width measured in square feet. hpw is theperformance ratio of horsepower per hundred pounds of weight. Figure C.2 presents the distributions of thesecharacteristics across engine type.
horsepower/weight, or hpw) than vehicles in other segments. Such qualitative differences
across segments tend to persist across the decade though magnitudes change. There are also
common trends in the market as vehicles in 2000 were 36.1% more expensive, 4.4% larger
(size), 11.6% less powerful (hpw), 2.3% more fuel-efficient (c90), and attained 2.8% better
fuel economy (kpe) than at the beginning of the decade.
– 11 –

IV. AN EQUILIBRIUM OLIGOPOLY MODEL OF THE AUTOMOBILE INDUSTRY
In this section I present a structural equilibrium model of demand and supply where utility-
maximizing heterogenous consumers choose among a variety of car models each year and
vehicle prices are set among multi-product firms in a pure strategy Bertrand-Nash equi-
librium. Since consumers consider a variety of product characteristics when making their
purchase decisions, there exists greater competition among firms with similar product sets
(in characteristic space). The introduction of turbodiesels by rival European firms, there-
fore, leads to greater competition which erodes volkswagen’s market power and profits.
volkswagen’s ability to differentiate its vehicles from the competition mitigates this effect,
however.
IV(i). Demand
Consumer demand is represented by a random coefficients nested logit (RCNL) discrete
choice framework of Grigolon and Verboven [2014]. Demand can be summarized as follows:
consumer i derives an indirect utility from buying vehicle j at time t that depends on price
and characteristics of the car:
uijt = xjtβ∗i − α∗i pjt + ξjt + εijt ,
where i = 1, . . . , It; j = 1, . . . , Jt; t = 1992, ..., 2000 .(1)
where I define a product j as a model-engine type pair. This Lancasterian approach makes
the payoff of a consumer depend on the set of characteristics of the vehicle purchased, which
includes a vector of K observable vehicle characteristics xjt such as engine type, car size, or
fuel efficiency as well as others that remain unobservable for the econometrician, ξjt (e.g.,
reliability, leather interior) plus the effect of unobserved tastes of consumer i for vehicle j,
εijt.
An important component of (1) is that consumers have heterogenous responses to changes
in vehicle prices and characteristics:
α∗i = ΠDit (2a)
β∗i = β + Σηit (2b)
Consumer i in period t is characterized by a d vector of observed demographic attributes,
Dit, as well as a vector of random tastes, ηit distributed i.i.d. with cumulative distribution
function F commonly assumed to be standard normal. Π is a (n+1)×d matrix of coefficients
that measures the effect of a consumer’s demographics (e.g., income) on her valuation of
an automobile’s characteristics, including price. Similarly, Σ measures the covariance in
– 12 –

unobserved preferences across characteristics. A useful decomposition is to separate the
deterministic portion of the consumer’s indirect utility into a common part shared across
consumers, δjt, and an idiosyncratic component, µijt, given by:
δjt = xjtβ + ξjt , (3a)
µijt = pjtΠDit +(xjt
)×(
Σηit
). (3b)
I assume the idiosyncratic product j period t consumer valuations (εijt) follow the dis-
tributional assumptions of the nested logit literature, thereby increasing the valuations of
products within the same “group” or “nest.” Suppose there are g = 0, 1, ..., G groups for
which each car can be assigned to only one (i.e., segment) and define group zero as the
outside good. I can then write the idiosyncratic valuation as
εijt = ζigt + (1− ρ)εijt (4)
where ρ ∈ [0, 1], ε is assumed i.i.d. multivariate type I extreme value distributed, and ζigt
has the unique distribution for the group g to which product j belongs such that εijt is
extreme value – an assumption which is useful in constructing the purchase probabilities for
each agent. I call ρ the “nesting parameter” as its value modulates the importance of the
nests in explaining consumer purchases. As ρ goes to one consumers view products within
a group as perfect substitutes while ρ converging to zero drives within-group correlation to
zero. Plugging (4) into (1) yields:
uijt = xjtβ∗i − α∗i pjt + ξjt +
G∑g=1
1jgtζigt + (1− ρ)εijt (5)
where 1jgt is an indicator variable equal to one when g is the group corresponding to product
j. From Equation (5) we can see the model’s flexibility. When Σ = 0 and ρ > 0 the model
collapses to nested logit. Alternatively, when ρ = 0 but Σ > 0 the model collapses to the
random coefficients model of Berry et al. [1995]. When both Σ = 0 and ρ = 0 the model
returns the simple multinomial logit.
I define the potential market as the number of households in Spain. In each period t,
the head of each household (i.e., consumer i) chooses the product j = 0, 1, ..., Jt which
provides him/ her the most utility. Inclusion of the outside good (j = 0) in the consumer’s
consideration set allows him/ her to choose to not purchase a new car in period t. The model
is silent as to whether a consumer who chooses the outside option purchases a used car or
holds off his/ her new car purchase for a later period.
– 13 –

Define the set of individual-specific characteristics leading to the optimal choice of car j
as:
Aijt (x·t, p·t, ξ·t; θ) = (Dit, ηit, εijt) |uijt ≥ uikt ∀k = 0, 1, . . . , Jt , (6)
with θ summarizing all model parameters. The extreme value distribution of the random
shocks then allows us to integrate over the distribution of εijt to obtain the probability of
observing Ajit analytically where the probability (π) that consumer i purchases automobile
model j in period t is:
πijt =exp(
δjt+µijt1−ρ )
exp(Iigt1−ρ)
× exp(Iigt)
exp(Iit), (7)
where Iigt = (1− ρ)ln
[Jg∑m=1
exp
(δmt + µimt
1− ρ
)]
Iit = ln
(1 +
G∑g=1
exp(Iigt)
).
Integrating over the distributions of observable and unobservable consumer attributes Dit
and ηit denoted by PD(Dt) and Pη(ηt), respectively, leads to the model prediction of the
aggregate market share for product j at time t:
sjt(xt, pt, ξt; θ) =
∫ηt
∫Dt
πijtdPDt(Dt)dPηt(ηt) , (8)
with s0t denoting the market share of the outside option. Solving (8) can be expensive in
practice when the dimension of η or D is large (see Skrainka and Judd, 2011). The advantage
of the RCNL discrete choice model is to provide analytical integrals over the nested group
(e.g., car segment) as in the nested logit model while enabling the researcher to include
random coefficients to avoid the Independence of Irrelevant Alternatives (IIA) property of
cars with varying observable characteristics within each group.
IV(ii). Pricing
In this section I append supply-side costs and pricing to the RCNL discrete choice demand
model. This serves two objectives. First, Reynaert and Verboven [2013] show the addi-
tion of the supply-side pricing decision increases precision for the demand-side parameters,
particularly the price coefficient. Second, including a supply-side pricing decision enables
computation of counterfactual equilibrium prices – a component which will be crucial for
measuring both the static and dynamic implications of imitation.
– 14 –

Equilibrium prices are found as the solution to a non-cooperative pure strategy Bertrand-
Nash game among the competing auto makers. Specifically, static profit-maximization by
each firm f implies that equilibrium prices (pw) can be written as a nonlinear function of
the product characteristics (X), market shares s(x, p, ξ; θ), retail prices (p), and markups:
pwjt = mcjt + ∆−1t (p, x, ξ; θ)sjt(p, x, ξ; θ)︸ ︷︷ ︸
bjt(p, x, ξ; θ)
, (9)
where pjt = pwjt× (1+ τjt) and τjt is the import duty applicable to model j in period t, if any.
The vector of equilibrium markups bjt(·) depends on market shares sjt(·) and the matrix
∆t(·) with elements:
∆rjt (x, p, ξ; θ) =
∂srt(x, p, ξt; θ)
∂pjt× ∂pjt∂pwjt
, if products r, j ∈ Jft ,
0 otherwise .
(10)
where Jft is the set of products offered by firm f in period t. Equilibrium prices are then a
function of consumer demand, import tariffs, and the portfolio of products offered by each
firm.
In estimating marginal costs I make a common assumption that firms have Cobb-Douglas
cost functions of the following (log-linear) form:
log c = Zγ + ω . (11)
where Z are logged observable characteristics and ω are cost components known to firms but
unobserved by the researcher.
– 15 –

V. ESTIMATION
I define structural parameters of the model as θ = [β,Σ,Π, γ, ρ], the demand-side structural
error as νD(θ) = ξ, and the supply-side structural error as νS(θ) = ω. Under the common
assumption that the product set (and the corresponding set of characteristics) is exoge-
nous, demand and supply parameter estimates (β,Σ,Π, γ, ρ) are recovered via a generalized
method of moments (gmm) estimator (Hansen, 1982) using observable product characteris-
tics as basis functions to construct identifying instruments (H). The gmm estimator exploits
the fact that at the true value of parameters (θ?), the instruments H are orthogonal to the
structural errors νD(θ?), νS(θ?) so that the gmm estimates solve:
θ = argminθ
g(θ)′HWH ′g(θ)
, (12)
where g(θ) is a stacked vector of the demand and supply-side structural errors and W is the
weighting matrix, representing a consistent estimate of E[H′gg′H].22
I construct the structural errors as follows. I solve for the mean utilities δ(θ) via a
contraction mapping which connects the predicted purchase probabilities in the model to
observed shares in the data for a given value of θ (see Grigolon and Verboven, 2014). The
demand-side structural error then follows from (3a). Observed prices, ownership structure,
and tariff rates plus equation (9) generate marginal costs as a function of the parameter
guess. The supply-side structural error then follows from (11).
Knittel and Metaxoglou [2013] and Dube, Fox, and Su [2012] point out that finding a
global solution to (12) is difficult since the objective function is highly non-linear so any
line, gradient, or simplex search will likely only result in a local solution. To increase the
likelihood of achieving a global minimum, I set the fixed-point tolerance in the mean utility
contraction to 1e-14 and employ a state-of-the-art minimization algorithm (Knitro Interior)
starting from several different initial conditions – a strategy shown by Dube et al. [2012] to
generate the global solution in Monte Carlo simulations.23
V(i). Specification
Bringing the model to the data requires the researcher to make explicit assumptions about
what characteristics consumers value when they purchase a new vehicle as well as the
set of potential supply-side shocks faced by firms. Consumer demand (both mean and
22 In constructing the optimal weighting matrix, I first assume homoskedastic errors and use W = [H′H]−1
to derive initial parameter estimates. Given these estimates, I solve the model and use the resultingstructural errors (νD, νS) to update the weight matrix.
23Relaxing the fixed-point tolerance to 1e-12 yielded similar results whereas limiting the number of initialconditions often resulted in the estimation algorithm finding inferior (i.e., higher J-statistic) local solutions.
– 16 –

idiosyncratic) includes measures of automobile performance: horsepower divided by weight
(hpw), exterior dimensions (size), the cost of driving (kpe), and engine type (diesel) where
the inclusion of diesel as a random coefficient allows for different substitution patterns
within the diesel segment. I also include a constant random coefficient (constant) to
capture changes in substitution patterns due to the increasing product set and a linear diesel
trend (diesel × trend) in mean utility which I found helpful in explaining the increasing
popularity of diesel vehicles among consumers. I define the product nests as car segments
(i.e., small, compact, sedan, luxury, and minivan) thereby allowing for valuations of products
within a segment to be correlated. I limit the demographic interactions (Π) to be just the
interaction between price and income where I follow Berry, Levinsohn, and Pakes [1999] and
model the price coefficient as αit = αyit
where yit is the year t income of consumer i. I simulate
individual income using yearly census data to account for changes in the income distribution
over time. Finally, the inclusion of a linear time trend (trend) accounts for any variation
in the remaining relative valuation of the outside option over time.
The supply-side largely mirrors the demand-side with a couple modifications. First, I
include logged values of the continuous observed characteristics (e.g., hpw). Second, I
replace kpe, which includes the effect of fluctuations in fuel price, with a measure solely
based on fuel-efficiency, c90. Consequently, audi’s choice of fuel-efficiency for a gasoline
model A4 impacts its cost directly as measured by c90, but demand for A4’s will also be
influenced by changes in the price of gasoline due to economic factors outside of audi’s
control. Hence, I include kpe in demand but (log) c90 supply. Similarly, I allow for
increasing steel prices to impact the cost of producing larger, heavier cars by multiplying car
weight and size by an index for the price of steel. This leads to shifts of hpw and size in
supply but not demand. I also include brand (e.g., audi, bmw, volkswagen) and segment
(e.g., compact) dummies to account for differences in marginal cost across these dimensions.
Finally, I assume reductions in the import tariff rate and changes in firm ownership due to
mergers and acquisitions are both exogenous. The former impacts the difference between
retail price p and wholesale price pw for foreign firms, while the latter impacts the ∆ matrix
and ultimately estimated marginal costs through Equation (9).24
V(ii). Parameter Identification
The parameter estimates are pinned down in the gmm estimation via the instruments H.
The intuition into how data variation (via H) identifies different components of θ is as follows.
Mean utility parameters β and cost parameters γ are recovered using the linear projection
24See Appendix A for details on acquisitions and mergers in the European automobile industry during the1990s.
– 17 –

outlined in Nevo [2000] using equations (3a) and (11). Consequently, the mean utility vector
β is identified by correlations between market shares and observable product characteristics.
The identification of γ follows from variations in observable product characteristics and
implied marginal costs where the latter depends on variation in price and market shares (via
the price coefficient, α) plus the shocks to fuel price and steel prices. Hence, the components
of X and Z are sufficient instruments for these parameters.
The price coefficient (α) is identified by changes in quantity sold, retail prices, and
consumer income. Much of this variation is across time where I discussed variation in
quantity sold and retail prices in Section III. In Figure 2, I present variation in consumer
income over the decade. Dots in the figure correspond to the average consumer (head of
household) income in each year and the bars correspond to the interquartile range, i.e., the
distance between the 75th and 25th quartiles also known as the middle 50%. From the
figure we see that (real) consumer income decreases slightly during the beginning of the
decade immediately following Spain’s accession into the European Union in 1992. After
1994, incomes begin to rise slowly at first and then significantly at the end of the decade.
The distribution of income around the average is fairly stable with the exception of 1998
and 2000 when the prevalence of high income earners increases.
Figure 2Identification of the Price Coefficient
8,000
10,000
12,000
14,000
16,000
18,000
20,000
22,000
Con
sum
er In
com
e (in
199
4 E
uros
)
1992 1993 1994 1995 1996 1997 1998 1999 2000
Average Interquartile Range
Income Variation Over Time
Notes: Encuesta Continua de Presupuestos Familiares.
I identify the remaining parameters (Σ, ρ) using variation in the product set and the
distributions of distances in product characteristic space. I construct instruments for the
constant and diesel random coefficients using the total number of products and diesel
vehicles accounting for differences in firm portfolios. Thus, the random coefficient for diesel
vehicles is identified by the correlation between changes in the number of diesel vehicles in the
– 18 –

product set and changes in purchase shares of diesel vehicles. A similar relationship holds for
the constant random coefficient and gasoline-powered cars. I construct an instrument for
the nesting parameter ρ as the number of other vehicles in a car’s segment after accounting
for variation in firm product portfolios.
I construct instruments for the hpw and kpe random coefficients by approximating
the “optimal instruments” of Chamberlain [1987] using “differentiation IVs” introduced by
Gandhi and Houde [2015].25 The idea is to use the distributions of product characteristics to
identify Σ by constructing cdf’s for each continuous characteristic based on the distances in
the corresponding product space. For example, I can construct a cdf for a 1995 Audi A4 in
kpe space by looking at the distance between between that model’s fuel efficiency and the fuel
efficiency of other models in that year. The addition or subtraction of fuel-efficient models
over time then impacts this distribution. When consumers value fuel efficiency, orthogonality
between νd(θ) and this cdf is achieved by increasing the kpe random coefficient – a similar
intuition to the instruments used in Berry et al. [1995].
I operationalize this approach by replacing the large-dimensional cdfs with sample statis-
tics. Specifically, the period t instrument for product j and characteristic k is
Hk,λjt (θ) = xkj,t ×
( Jt∑r 6=j
1(dkrj,t < cλ)× xkr,t)
(13)
where cλ designates a cut-off in the cdf in which to construct the instrument and dkrj,t is the
absolute distance in product characteristic space k defined as |xkr,t − xkj,t|. By interacting
the characteristic of product j, the instrument is able to account for differences in the
correlation between product distance and market share across different positions in the
product characteristic space. In practice, I chose cλ for each characteristic such that the
bins are evenly-distributed and set λ = 3, or equivalently four identifying instruments for
each of these continuous product characteristics.
V(iii). Estimation Results
Estimation results are presented in Table III. Overall, the estimates are reasonable, statisti-
cally significant, and congruent with the descriptive evidence of the industry from Section III.
Significant parameter estimates for both the nesting parameter ρ and the random coefficients
(σ ∈ Σ) allow me to reject all three of the nested models common in the empirical literature:
logit, nested logit, and random coefficients, or equivalently the RCNL of demand fits the
data better than these alternative models.
25See Reynaert and Verboven [2013] and Gandhi and Houde [2015] for a further discussion on instrumentsand identification in random coefficient logit demand systems.
– 19 –

Table IIIDemand and Supply Estimates
Demog. Interactions (Π)Mean Utility (β) Random Coefficients (Σ) Cost (γ)
Coefficient Rob. SE Coefficient Rob. SE Coefficient Rob. SE
Price/Income −1.8236 (0.2065)HP/Weight 1.4683 (1.9604) 2.4665 (0.4329) 0.7853 (0.0716)Size 5.3089 (0.8916) 2.4399 (0.1720)Fuel Economy (Fuel Efficiency) 0.8180 (1.0179) 3.3593 (0.4271) 0.2321 (0.0728)Diesel −13.4983 (1.9979) 3.8745 (0.4687) 0.3427 (0.0377)Diesel-x-Trend 0.6263 (0.0592) −0.0021 (0.0042)Constant −12.9327 (1.1927) 0.0547 (0.2805) 0.0219 (0.1532)Trend 0.0170 (0.0167) 0.0020 (0.0035)Non-Euro −0.9532 (0.1554)Seat 0.5671 (0.2385)Nest (ρ) 0.2759 (0.0858)
Statistics:
- Avg. SW Elasticity 3.6- Avg. SW Margin 33.2- Number of observations 1,740- J-Statistic 124.5
Notes: Estimates based on Monte Carlo simulation using 1,300 simulated consumers each year. Heteroskedasticity robuststandard errors in parentheses. “Fuel Economy” is kpe for consumer demand (β,Σ) while “Fuel Efficiency” is c90 in the cost
function (γ). Fixed effects for brand and segment not reported. “Margin” is the Lerner index defined as 100× p−cp
where price
excludes import tariffs, if applicable. Statistics for average “Elasticity” and “Margin” are weighted by quantity sold (“SW”).Equilibrium prices account for year-specific ownership structure as reported in Appendix A.
The results indicate that diesels are more expensive to manufacture than gasoline models.
The marginal costs of production are also higher for larger, more powerful, and less fuel-
efficient cars.26 The insignificant trend variables indicate there are no important efficiency
gains occurring during the decade in the production of either gasoline or diesel engines.
The estimation also accounts for differences in marginal costs by brand (e.g., Audi),
which I report in Figure 3 relative to the Spanish market leader, renault. Results are
very reasonable as German upscale brands audi, bmw, and mercedes, are among the most
expensive to produce while chrysler and Asian imports such as daewoo, hyundai, kia,
and mitsubishi are relatively less expensive to produce. European manufacturers with lower
unit costs of production than renault, include the Czech brand skoda and the Spanish
brand seat, both of which were acquired by volkswagen to sell streamlined versions of
their vehicles targeting lower income customers. Another interesting case of relatively low
cost of production is ford which produces most of its smaller European models in a large
plant located in Valencia, Spain.
26“Fuel Economy” in Table III corresponds to kpe in consumer demand (β,Σ) and “Fuel Efficiency”corresponds to c90 in the cost function (γ). The positive coefficient for c90 therefore indicates marginalcost is increasing in the amount of fuel required to cover 100 kilometers at a constant speed of 90 kilometersper hour (i.e., cost is increasing as “fuel efficiency” decreases).
– 20 –

Figure 3Production Cost Differences Across Brands
(Reference: Renault)
-0.65
-0.60
-0.55
-0.50
-0.45
-0.40
-0.35
-0.30
-0.25
-0.20
-0.15
-0.10
-0.05
0.00
0.05
0.10
0.15
0.20
0.25
0.30
0.35
0.40
0.45
0.50A
lfa R
omeo
Aud
i
BM
W
Chr
ysle
r
Citr
oen
Dae
woo
Fiat
Ford
Hon
da
Hyu
ndai
Kia
Lanc
ia
Maz
da
Mer
cede
s
Mits
ubis
hi
Nis
san
Ope
l
Peug
eut
Rov
er
Saab
Seat
Skod
a
Suzu
ki
Toyo
ta
Vol
ksw
agen
Vol
vo
The estimated demand curves are all downward slopping and elastic; amounting to an
average sales-weighted estimated (absolute) price elasticity of 3.6 and an average 33.2%
estimated margin (Lerner index), both of which are consistent with other estimates of the
European automobile industry around this time (e.g., Goldberg and Verboven, 2001; Moral
and Jaumandreu, 2007; Grigolon and Verboven, 2014). There is however substantial het-
erogeneity across products as the standard deviation for the price elasticities and price-cost
margins are 1.28 and 8.80, respectively, reflecting the large degree of horizontal-differentiation
in the industry as price competition occurs in local areas of product characteristic space.
Elasticities and margins, both of gasoline and diesel vehicles, remain quite stable over the
decade (Figure 4) despite the evolution of vehicle characteristics and consumer preferences
combined with increasing product variety.
Estimates of Table III indicate that, all else equal, drivers favor gasoline over diesel engines
at the beginning of the sample (βDiesel < 0) but consumer attitudes towards diesels improve
– 21 –

Figure 4Evolution of Estimated Market Power
1
2
3
4
5
6
7
8
9
10
11P
rice
Ela
stic
ity
1992 1993 1994 1995 1996 1997 1998 1999 2000excludes outside values
(a) Elasticity - Diesel Vehicles
1
2
3
4
5
6
7
8
9
10
11
Pric
e E
last
icity
1992 1993 1994 1995 1996 1997 1998 1999 2000excludes outside values
(b) Elasticity - Gasoline Vehicles
05
10152025303540455055606570
Mar
gin
(PC
M)
1992 1993 1994 1995 1996 1997 1998 1999 2000excludes outside values
(c) Margins - Diesel Vehicles
05
10152025303540455055606570
Mar
gin
(PC
M)
1992 1993 1994 1995 1996 1997 1998 1999 2000excludes outside values
(d) Margins - Gasoline Vehicles
Notes: “Elasticity” in panels (a) and (b) is the absolute value of the estimated demand elasticity. “Margin” inpanels (c) and (d) is the Lerner index, or Price-Cost margin, defined as 100× (pwjt − cjt)/pwjt.
across the decade (βDiesel × Trend > 0) due either to consumers learning about these new
turbodiesels or improvements in the technology. The small and insignificant estimate for
the linear time trend (trend) indicates that variation in overall market size is sufficiently
captured by the time-series variation in household income (Figure 2). Consumers also prefer
larger cars (positive coefficient for size) after controlling for segment and other observable
product characteristics such as price. The average consumer is indifferent about performance
and fuel economy (insignificant coefficients for hpw and kpe in mean utility) though the
significant random coefficients for both characteristics indicate a great deal of heterogeneity.
I also find a large and statistically significant value for the diesel random coefficient indicating
that the substitution patterns between diesel cars are significantly different than between a
diesel and gasoline-powered car even after controlling for differences in fuel economy. This
suggests that other product characteristics such as torque differentiate diesel cars from their
gasoline-powered competition.
– 22 –

The negative and significant estimate for non-eu combined with the positive and signif-
icant estimate for the domestic brand, seat, indicates a “home bias” for domestic brands –
an empirical regularity in the international trade literature.27 Since the focus here is on a
specific industry rather than a set of bilateral trade flows across many sectors, I can provide
a more detailed interpretation than is commonly provided in that literature. At this time,
Asian imports were first sold in the European market and were considered lower quality,
more fuel-efficient alternatives to European gasoline-powered vehicles but they lacked both
brand recognition as well as a widespread network of dealerships for maintenance. Thus, the
negative sign of non-eu is not surprising. Meanwhile, the domestic brand seat was owned
by the volkswagen group thus it could be that the positive estimated coefficient is picking
up demand characteristics brought to the company via volkswagen but not observed to
the econometrician.
The estimated model also generates reasonable substitution patterns (Figure 5). Panels
(a) - (c) document how the random coefficients Σ for continuous characteristics such as hpw
impact the cross-price elasticities. I do this by first solving for the distance between each
pair of products in a particular characteristic (e.g., hpw). I then divide the product-pairs
into deciles where the first decile correspond to pairs which are most alike. The last step
is to compute the average cross-price elasticity for each bin. For all of the characteristics
considered in the estimation, substitution between similar products is much more likely than
for products far apart in characteristic space. The histogram for size (panel b) is interesting
because the estimation does not include a random coefficient for this characteristic yet we
see greater substitution among products with similar dimensions. This is due to correlations
of product size with other observable characteristics, including segment.28 Since diesel is
a discrete variable, I show the average cross-price elasticity within and across fuel types
(panel d). Again, consumers are much more likely to substitute within fuel type.
Panels (e) and (f) document the impact of the nesting parameter ρ on cross-price elas-
ticities across segments. In panel (e) we see that the cross-price elasticity within compact
cars is roughly double than the cross-price elasticity between a compact car and the other
segments. In panel (f) we see the same is true for sedans though the magnitude is greater
and, of course, similar results hold for the remaining car segments as well.
27See Cosar, Grieco, Li, and Tintelnot [2018] for estimates of cross-country home bias in the automobileindustry.
28Including a random coefficient for size generated a small and statistically-insignificant value.
– 23 –

Figure 5Substitution Patterns
0
.005
.01
.015
Avg.
Cro
ss-P
rice
Elas
ticity
0 10 20 30 40 50 60 70 80 90
Distance in Product Space (0 = Near, 90 = Far)
(a) hpw
0
.005
.01
.015
Avg.
Cro
ss-P
rice
Elas
ticity
0 10 20 30 40 50 60 70 80 90
Distance in Product Space (0 = Near, 90 = Far)
(b) size
0
.005
.01
.015
Avg.
Cro
ss-P
rice
Elas
ticity
0 10 20 30 40 50 60 70 80 90
Distance in Product Space (0 = Near, 90 = Far)
(c) kpe
0
.01
.02
.03
.04
Avg.
Cro
ss-P
rice
Elas
ticity
1992 1996 2000
Dies-Dies Gas-Gas Diesel-Gas
(d) Fuel Type
0
.01
.02
.03
Avg.
Cro
ss-P
rice
Elas
ticity
1992 1996 2000
Compact Sedan SmallLuxury Minivan
(e) Segment (ref: Compact)
0
.01
.02
.03
Avg.
Cro
ss-P
rice
Elas
ticity
1992 1996 2000
Compact Sedan SmallLuxury Minivan
(f) Segment (ref: Sedan)
Notes: Panels (a)-(c) present average cross-price elasticity on product characteristic space where two products are “close” whenthe observed product characteristic is similar (i.e., distance between is small). Panel (d) compares the average cross-priceelasticities across engine fuel types. Panels (e) and (f) compare average product elasticities within and across segments usingdifferent reference segments.
– 24 –
VI. MEASURING THE IMPACT OF IMITATION
With robust estimates of demand and supply in-hand, the objective in this section is
to measure the implications of imitation on static and dynamic efficiency. First, I show
that imitation led to significant price competition among European automakers though
the effect on volkswagen profits varied significantly across firms. Second, I show that
while imitation enabled rivals to steal a substantial amount of potential business from the
tdi, volkswagen’s ability to horizontally-differentiate its diesel models enabled the firm to
generate a lot of profit from its innovation. Hence, the tdi remained a worthwhile investment
for the firm. This suggests that imitation, though significant, still provided for a dynamically
efficient outcome.
VI(i). Imitation, Prices, and Profits
I begin with an evaluation of the static implications of imitation on volkswagen equilibrium
pricing and profits by comparing the estimated equilibrium with two plausible counterfactual
equilibria where I vary importance of the tdi technology. I construct these equilibria by
taking advantage of two facts: (a) diesel penetration at the beginning of the sample was close
to the penetration rate prior to the tdi’s introduction (≈ 14%), and (b) demand estimates
indicate a positive trend for diesel models (βDiesel−x−Trend > 0). Point (a) indicates that
consumer demand for diesels in 1992 looked similar to demand for diesels equipped with
the old Perkins technology while point (b) suggests that consumers learned about the new
turbodiesel technology as the decade progressed.29 Setting βDiesel−x−Trend = 0 eliminates
this mechanism and forces consumers to make decisions based on their perceptions of the
old diesel technology.
In my first counterfactual equilibrium I set βDiesel−x−Trend = 0 and recompute the pricing
equilibrium for each year. By reducing the popularity of diesels to the level observed at the
beginning of the sample, I simulate a world in which diesels operate with the old Perkins
technology. I call this experiment “No TDI.” In the second counterfactual I simulate the
equilibrium where volkswagen successfully defends its patent rights. I do so by setting
βDiesel−x−Trend = 0 for all diesel vehicles not manufactured by volkswagen. In this
equilibrium consumers observe that the tdi technology enables volkswagen diesel models
to be more reliable, cleaner, and quieter than the competition (e.g., renault) as diesels
29Alternatively, it could be that the technology underlying the turbodiesel increased steadily across thedecade. I can identify only one significant improvement during this period. In 1997 the Alfa Romeo 1562.4 JTD and Mercedes-Benz C-Class W202 both incorporated “common rail fuel injection” which enableddetailed electronic control over both fuel injection time and volume. The higher pressure of the common railtechnology also increased fuel atomization, making ignition more efficient. Since there is a steady-increasein consumer demand for diesels (Figure 1) over the decade, it seems reasonable that consumer learningrelated to turbodiesels played at least a significant part in the growth of diesels.
– 25 –

sold by these rival firms can only be equipped with the old Perkins technology. I call this
experiment “No Rival TDI.”30
These equilibria therefore amount to end-points of a spectrum where on the one hand
the tdi technology is never invented while on the other volkswagen is able to limit the
technology’s imitation by rival firms. The task then is to assess whether the observed
equilibrium is closer to one in which volkswagen is able to differentiate its innovation
from the competition and is therefore largely unaffected by imitation (as in Petrin, 2002) or
whether imitation materially reduced the innovative rents of the tdi. In Table IV I compare
the estimated equilibrium to these counterfactual equilibria at the beginning and end of the
decade.31
Table IVValue of TDI Technology to Volkswagen
1993 2000
No TDI Data No Rival TDI No TDI Data No Rival TDI
Prices (eThousand) 12.68 12.73 12.89 16.21 16.30 25.79- Diesel 14.20 14.16 14.49 18.25 16.87 30.04- Gas 12.47 12.48 12.48 15.41 15.44 15.47
Market Share (%) 18.16 17.83 19.91 21.24 22.31 43.35- Diesel 12.06 12.12 21.94 29.58 25.11 92.84- Gas 19.46 19.45 19.45 19.12 19.05 18.89
Margin (%) 34.49 34.30 34.30 34.78 33.35 53.15- Diesel 28.50 28.77 30.38 32.98 31.94 60.33- Gas 35.28 35.28 35.30 35.48 35.50 35.70
Profit (eMillion) 504.20 522.05 566.71 889.96 1,510.03 5,862.87- Diesel 57.59 77.03 120.46 275.72 922.99 5,258.29- Gas 446.61 445.02 446.25 614.23 587.04 604.58
Notes: “Price” is in thousands of 1994 euros. “Market Share” is the percent share of cars sold in the respective category.“Margin” is the Lerner margin defined as (p − c)/p where c is the estimated marginal cost and price (p) includes anyapplicable import tariffs. “Profit” is measured in millions of 1994 euros. See Figure 4 for the evolution of estimatedprice-cost margins across the decade. Statistics are weighted by quantity sold where relevant and correspond to thevolkswagen group and therefore include the brands audi, seat, skoda, and volkswagen. “No TDI” and “No RivalTDI” counterfactual equilibria are described in the text.
I find the estimated equilibrium is much more similar to the “No TDI” equilibrium than
the “No Rival TDI” equilibrium. Imitation by rival firms applied downward pressure to
volkswagen prices and margins. Had volkswagen been able to maintain monopoly power
over the tdi, retail prices for automobiles would have been 1.3% higher at the beginning
of the sample and 58.2% higher at the end – a sizable difference. Most of this increase is
30In Appendix C I quantify the value of the tdi using counterfactual equilibria where diesel vehicles disappearfrom the marketplace due to either regulation or competition from the tdi. Results are qualitatively similarto those presented in the main text.
31My analysis begins in 1993 because the estimated and counterfactual equilibria are equal in 1992 byconstruction.
– 26 –

due to price increases in the diesel segment where the average retail price for a diesel car
increases 2.3% and 78.1% in 1993 and 2000, respectively. The equilibrium at the end of
the decade would have therefore looked much different for volkswagen shareholders as
monopoly power over the tdi technology would have enabled the firm to simultaneously
increase its margins (i.e., from 33.4% to 53.2%) and its overall market share (i.e., from
22.3% to 43.4%) while dominating the diesel segment by accounting for 92.8% of all new
diesel vehicle sales.
I estimate that volkswagen profits in 1993 would have been 8.5% larger (e44.7 million)
than the estimated equilibrium had the company been able to maintain dominance of the
diesel segment by leveraging the positive attributes associated with the tdi technology. By
the end of the decade, I estimate the firm would have earned profits roughly four-times the
amount it earned in the data, or e4.4 billion – a sizable difference. The introduction of
turbodiesels by rival firms therefore reduced volkswagen profits significantly.
To illustrate the effects of imitation on volkswagen profits, I define the share of potential
tdi profits which volkswagen was able to capture as:
“Rent Capture” ≡ πBenchmarkt − πNo TDI
t
πNo Rival TDIt − πNo TDI
t
. (14)
where (πNo TDIt , πNo Rival TDI
t , πBenchmarkt ) are the period t volkswagen profits when all firms
which offer diesel vehicles use the old diesel technology, rival firms which offer diesels are
restricted to use the old diesel technology but volkswagen diesels use the tdi technology,
and the estimated equilibrium, respectively. From Table IV we observe that πNo TDIt <
πBenchmarkt < πNo Rival TDI
t so as this fraction converges to one (zero), the conclusion is that
volkswagen was able to capture all (none) of the potential profits from the tdi. This
metric therefore provides a simple measuring stick to evaluate the impact of imitation on
firm profits.
I plot “rent capture” across the decade in Figure 6. When the tdi technology was new in
1993, volkswagen was able to capture 28.6% of the potential profits from the tdi. Entry
of turbodiesel models by fiat, psa, ford, renault, and rover in 1994 (Table I), however,
increased competition among diesel vehicles and eroded VW’s rent capture significantly (from
28.6% to 16.9%). By the end of the decade, volkswagen was only able to capture 12.5%
of potential profits. Thus, competition brought on by the market entry of rival turbodiesels
dominated growth in consumer demand for diesels (via βDiesel−x−Trend > 0) and consumer
income (Figure 2). When I recompute rent capture using total equilibrium profits across
decade, I estimate that volkswagen was able to capture only 13.8% of the potential profits
– 27 –

Figure 6Volkswagen Rent Capture Across the Sample
810121416182022242628303234
1993 1994 1995 1996 1997 1998 1999 2000
Estimate 95/5 Confidence Interval
Capture of Innovative Rents Over Time
Notes: Figure presents “rent capture” over the sample using definition (14). Rent captureis not defined in 1992 (i.e., πNo Rival TDI
t=1992 = πNo TDIt=1992 ) and has been therefore excluded.
Confidence intervals (dashed lines) based on bootstrap simulation (N=1,000) followingthe procedure outlined in Appendix D.
from its technological innovation. I conclude that imitation by rival firms limited tdi profits
significantly and this effect increased steadily over the decade.
When goods are differentiated and firms are heterogenous the impact of imitation likely
varies significantly across firms. I evaluate this hypothesis by looking at the impact of firm-
level imitation on volkswagen profits where for each rival firm I remove the firm’s diesel
fleet in a given year and recompute the pricing equilibrium. I present the equilibrium effect
of firm-level imitation on volkswagen prices (panel a) and profits (panel b) in Figure 7.
From panel (a) we observe that removing a random rival firm’s diesel portfolio decreases
options for consumers and would have enabled volkswagen to increase retail prices 0.77%
on average though the impact varies widely across firms. Imitation by psa and renault had
much larger effects on volkswagen price (1.63% and 1.05%, respectively) than imitation
by fiat and ford (0.71% and 0.90%, respectively) while the introduction of turbodiesels by
Asian automakers had negligible effects. In terms of profits (panel b), we again see that firms
which invested heavily in turbodiesels (largely European automakers) tended to have a larger
negative impact on volkswagen’s profits though again there is significant variation across
firms. I estimate that removing a psa diesel vehicle from the marketplace in 1992 would
have increased volkswagen profits e1.6 million, or roughly twice the average impact of
removing a renault turbodiesel model (e880 thousand).32 As the popularity of turbodiesels
32See Figure C.3 in Appendix C.
– 28 –

Figure 7Imitation, Business Sealing, and Static Efficiency
0
1
2
Per
cent
Cha
nge
in V
W P
rice
0 5 10 15 20
Percent of Diesels No Longer Offered
Fitted Values RenaultPSA Others
(a) VW Prices
0
5
10
15
20
25
30
Per
cent
Cha
nge
in V
W P
rofit
s
0 5 10 15 20
Percent of Diesels No Longer Offered
Fitted Values RenaultPSA Others
(b) VW Profits
Notes: Panels (a) and (b) present the change in VW average retail price and profit, respectively, as a function of the dieselofferings of rival firms. For each observation I begin from the observed product portfolios, remove a rival firm’s line of dieselautomobiles, and recompute the pricing equilibrium. The x-axis is the percent reduction in diesel models available to consumers.
grew across the decade, so did the impact of imitation: removing a psa turbodiesel in 2000
would have, on average, increased volkswagen profits by e5.6 million while removing a
renault turbodiesel would have increased volkswagen profits e2.6 million on average.
Interestingly, firms like fiat and ford which both had large turbodiesel portfolios (Table I)
but I find that their products had relatively small impacts on volkswagen profits. Thus,
volkswagen was able to differentiate its turbodiesel fleet from these competitors but not
from psa or renault. Similarly, those Asian manufacturers which did invest in diesels had
negligible impacts on volkswagen’s bottom line.
VI(ii). Imitation and Dynamic Efficiency
Thus far I have demonstrated that imitation had a significant negative effect on volkswagen
profits but this does not necessarily mean that imitation made the tdi an ex post poor
investment. In this section I build a simple model of innovation to fix ideas about the trade-off
facing an innovating firm as well as to test whether the tdi was still a good investment for
volkswagen despite this significant level of imitation.
Define π(x, s) as profits of a firm which sells a product of quality x and faces competitors
who sell products of quality s = s1, ..., sF−1 where F is the total number of firms. I assume
π is increasing in x (i.e., the product quality produced by the innovating firm) and decreasing
in the product quality of the competition.33 The innovating firm can choose to invest in a
33For example, under Dixit-Stiglitz preferences the product qualities of the competition collapses into a singlemeasure of competition, the price index, so when the competition increases the quality of their products,the price index falls leading to less profits for the innovating firm.
– 29 –

new technology x′ > x but doing so requires a one-time development cost of κ > 0. Similarly,
a rival firm f can invest to imitate the innovating firm’s technological innovation so that
s′f > sf . The pay-offs for the innovating firm which decides whether to innovate (V I) or not
(V N) are
V I(x, s) = π(x′, s) + δ
∫V (x′, s′)dH(s′|x′, s) (15)
V N(x, s) = π(x, s) + δV (x, s) , (16)
where V (x, s) is the innovating firm’s continuation value discounted by δ > 0 and H is the
imitation risk which the innovating firm perceives. In (15) there are two important forces.
First, there is a first-mover advantage for the innovating firm, via π(x′, s), which increases the
returns to the innovation. On the other hand, imitation risk (via H), the second force, drives
down the firm’s future profits. If the firm chooses to not undertake the project (Equation 16),
I assume product qualities do not change, so period profits are fixed. The innovating firm
chooses to undertake the project if and only if
V I(x, s)− κ ≥ V N(x, s) (17)
so the innovating firm also accounts for the cannibalization of profits under its current
technology. Equation (17) demonstrates that firms undertake projects which generate suf-
ficient net profit to cover the cost of research and development. Thus, a product may face
significant risk of imitation leading to reductions in V I and a low “rent capture” statistic
but is nonetheless a worthwhile investment.
The project is valued by society (under marginal cost pricing) when
CSI(s)− κ ≥ CSN(s) (18)
where CS(s) corresponds to aggregate consumer surplus under industry state (s).34 I call
an equilibrium dynamically efficient when a project valued by society (Equation 18) is
undertaken (Equation 17). Consider the case when a project is valued by society. Dynamic
efficiency is attained whenever an innovator believes it can extract sufficient surplus from its
innovation to make the project worthwhile. Conversely, a project may not be undertaken
but nonetheless be valued by society (i.e., a dynamically inefficient equilibrium) when the
firm cannot extract sufficient rents from its innovation due to the firm’s perceived imitation
risk by its rivals (i.e., H).
34In principle, changes in consumer surplus from an innovation could account for externalities (e.g., vehicleemissions) and taxation required to fund preferential taxes or R&D subsidies given to firms.
– 30 –

I use the estimated model to generate ex post estimates for V I and V N in order to test
whether the tdi amounted to a good investment, at least ex post. I begin with the estimate
of the ex post value of the tdi technology to volkswagen, V I. In Figure 8, I document the
growing importance of diesels to volkswagen and the European rivals who imitated the
technology. From panel (a) there is significant growth in diesel profits for all firms across
the decade. I estimate volkswagen profits from diesel vehicles amounted to e923 million
in 2000, or roughly 13x the profit generated by diesels in 1992. Over the decade, I estimate
the volkswagen group generated e3.6 billion in profit from its diesel portfolio alone.
While some of this is due to growth in the Spanish market overall, in panel (b) I document
that diesels also become the dominant profit source for both volkswagen and its rival
European firms by the end of the decade. This indicates that not only did both diesel and
overall profits increase as the market grew but also that the growth of the diesel segment
proved an important driver for that growth.
Figure 8Importance of Diesels
72.9
611.5
276.3
1,066.9923.0
2,299.6
200400600800
1,0001,2001,4001,6001,8002,0002,2002,4002,600
Die
sel P
rofit
s
1992 1996 2000
Diesel Profits Over TimeVW Other European Firms
(a) Diesel Profit (eM)
10.5
20.3
36.841.6
61.156.4
0
10
20
30
40
50
60
70
Die
sel S
hare
of T
otal
Pro
fits
(%)
1992 1996 2000
Share of Total Profits From DieselsVW Other European Firms
(b) Diesel Share of Profits
Pinning down a value for V N, the profits volkswagen would have achieved had it not
introduced the tdi, is difficult since this requires the researcher to take a stand on what the
product set would have looked like in this alternative reality. As the model is static and there
are several possibilities to consider, I consider two reasonable counterfactual equilibria. In
the first counterfactual equilibrium I eliminate all diesel vehicles and recompute the pricing
equilibrium each year. I call this equilibrium “No Diesels” and argue that it is a good
approximation for V N in the event that without the tdi technology diesel vehicles would
have disappeared from the marketplace perhaps due to their inability to profitably compete
with the quieter, reliable, and fuel-efficient gasoline-powered imports produced by Asian
automakers. In the second counterfactual equilibrium, I use the “No TDI” counterfactual
equilibrium from earlier which is a good approximation for V N in the event firms would
– 31 –

have chosen to increase the number of diesel vehicles independent of the tdi technology,
presumably to take advantage of preferential fuel taxes and vehicle emissions policies.35
Table VValue of TDI Technology
V N
Year V I No Diesels No TDI
1992 694.23 654.45 694.23[579.33, 783.55] [548.63, 733.97] [579.33, 783.55]
1993 522.05 490.37 504.20[435.87, 588.57] [429.69, 535.97] [420.89, 569.76]
1994 617.51 532.02 570.52[511.00, 698.86] [463.37, 580.16] [471.39, 647.08]
1995 653.25 537.10 566.62[543.22, 737.33] [481.02, 579.33] [468.78, 641.38]
1996 751.51 620.42 597.85[624.40, 847.41] [594.42, 637.19] [494.65, 676.7]
1997 919.99 582.20 655.92[768.65, 1037.2] [530.21, 621.2] [543.76, 744.65]
1998 1,164.65 710.20 810.59[974.27, 1312.88] [671.69, 742.11] [676.24, 914.09]
1999 1,376.52 758.43 868.51[1154.57, 1555.53] [700.93, 805.9] [725.42, 981.07]
2000 1,510.03 696.88 889.96[1262.07, 1705.14] [619.00, 762.03] [734.14, 1007.15]
Total 8,209.74 5,582.06 6,158.40[6856.85, 9254.10] [5054.66, 5981.78] [5112.93, 6952.07]
Notes: V I , V N correspond to the total estimated profits (diesel plus gasoline models) tothe volkswagen group measured in millions of 1994 euros in the estimated equilibriumand counterfactual environment without the tdi, respectively. 95/5 confidence intervals[in brackets below corresponding estimate] are based on bootstrap simulation (N=1,000)following the procedure outlined in Appendix D.
I compare volkswagen profits in the estimated equilibrium (V I) to volkswagen profits
had the tdi never existed (V N) in Table V. Ex post the tdi was a very successful innovation
for volkswagen despite the large scale imitation by its rivals. When I eliminate diesels alto-
gether, total volkswagen profits fall by e2.6 billion over the decade (i.e., V I−V No Diesels).
Constraining consumer demand for the engines but maintaining growth in the number of
diesels with the old Perkins technology implies that volkswagen profits would have fallen
e2.1 billion during the period (i.e., V I − V No TDI). In both scenarios, I observe the profits
attributable to the tdi grew over the decade despite the corresponding growth in rival
turbodiesels.
I therefore estimate the value of the tdi (i.e., V I − V N) to be e2.1 to e2.6 billion in the
Spanish market alone. Moreover, the tight 95/5 confidence intervals (in brackets) in Table V
35See Miravete et al. [2018] for estimates of the value of pro-diesel fuel taxation and vehicle emissions policiesto European firms.
– 32 –

indicate the estimated value is robust to estimation errors in demand and supply. Extending
the analysis to the rest of Europe would only increase the tdi’s estimated value as would
increasing the time horizon. Thus, I conclude the tdi was a successful technology, at least
ex post, provided the fixed cost of development (κ) was not enormous.36
Figure 9Imitation and Market Size
0.970.85
0.970.91
0.650.71
1.36
0.730.83
0.0
0.2
0.4
0.6
0.8
1.0
1.2
1.4
Qua
ntity
Sol
d (in
Mill
ions
)
1992 1996 2000
Quantity Sold Over TimeBenchmark No Diesel No TDI
Notes: Statistics represent total new vehicle sales in the Spanishauto industry (in millions). “Benchmark” corresponds to thedata. The “No Diesel” and “No TDI” counterfactual equilibriacorrespond to the equilibria from Table V.
How was volkswagen able to recover its investment in the tdi despite significant
imitation? In Figure 9, I present the total number of vehicles sold in Spain across the
three equilibria considered in Table V. The figure clearly shows that total market size
shrinks under both counterfactual equilibria. The tdi’s introduction therefore increased the
size of the Spanish new car market as turbodiesels increased consumers’ willingness to buy
new vehicles even after controlling for changes in incomes.37 Thus, the market was able to
support both innovation and significant levels of imitation because the tdi increased the size
of the pie while product differentiation enabled firms to each secure a sufficient piece. More
generally, the results suggest that differentiated goods markets may still be dynamically
efficient (i.e., promote investment in new goods) even with significant imitation risk as these
markets provide the innovator an opportunity to secure future profits by differentiating its
products horizontally.
36I am unaware of fixed cost estimates for volkswagen to develop the tdi. As a point of reference,however, the estimated fixed cost to build CERN’s Large Hadron Collider, the largest and most complexmachine ever built, is e4.6 billion (source: Agence Science-Presse. “LHC: Un (tres) petit Big Bang”. LienMultimedia. December 7, 2009).
37One could also evaluate the tdi’s welfare implications for consumers as in Petrin [2002] for the minivan.Ackerberg and Rysman [2005], however, point out that such calculations over-estimate the value of newgoods in models with unobserved product differentiation.
– 33 –

Finally, it is important to note that (15) does not constrain the relationship between firm’s
perceptions (H) and the data generating process; therefore perceptions need not be “correct”
[Pakes, Porter, Ho, and Ishii, 2015]. Consequently, my analyses (and conclusions) allow for
volkswagen’s investment in the tdi to be a poor decision ex post, or equivalently just
observing innovation is not sufficient to conclude it was a worthwhile investment ex ante.
This means that my results can be interpreted in two ways. First, if volkswagen did
indeed correctly perceive the imitation of the tdi by its rivals, my results would indicate
that innovation occurred in this industry even though rampant imitation was expected. On
the other hand, if the scale of imitation caught volkswagen management by surprise, the
popularity of the innovation was sufficient to benefit all firms. In my case, these stories are
indistinguishable but understanding the implications of each is an important research area
– particularly for the role of business uncertainty and innovation (e.g., Bloom, 2009).
VII. CONCLUDING REMARKS
The objective in this paper was to evaluate the impacts of imitation to dynamic and static
efficiency in a differentiated goods market. I do so via the study of a new diesel engine
technology in the European auto industry – the tdi. The estimated model of consumer de-
mand for differentiated products allows for flexible substitution patterns while the oligopoly
pricing model increases identification of price elasticities. As the estimated model generates
reasonable estimates and substitution patterns, I use it to evaluate the equilibrium effects
of imitation on firm pricing, profits, and consumer demand via a series of counterfactual
experiments.
I find that widespread imitation of the tdi by European auto makers due to the tech-
nology’s generality led to significant price competition. The amount of business stolen by
these firms was substantial and limited volkswagen to capture only 14% of the potential
profits from the tdi. I also find that the firm’s ability to differentiate its diesel models
horizontally enabled it to generate a significant amount of profit, likely making the R&D
investment required to introduce the tdi worthwhile. Thus, imitation benefited consumers
by simultaneously increasing the number of products in the consideration set and decreasing
retail prices while product differentiation enabled the innovator to carve out a sufficient
market niche to maintain significant profits for its innovation. I conclude that, at least for
the tdi, the market delivered an equilibrium which was both dynamically and statically
efficient without government intervention (i.e., without the aid of patents). Moreover, my
results indicate that in mature industries such as automobiles economists should think of
product differentiation specifically, or a brand more generally, as an important component
of technological progress.
– 34 –

My results suggest two interesting avenues for future research. First, it would be interest-
ing to see whether my results – an ex post analysis of a particular innovation – extend more
generally to other differentiated goods markets. Second, the mere fact that volkswagen
undertook the investment in the tdi indicates the firm believed the tdi was a worthwhile
investment ex ante. As my results indicate the innovation’s value was worthwhile ex post
despite widespread imitation, it would be interesting to investigate the set of firm beliefs
about the evolution of the market consistent with investing in the tdi. Doing so, however,
would require modeling the automobile industry as a dynamic game among competing
multi-product firms – a difficult task.
– 35 –

ReferencesAckerberg, D. A. and M. Rysman (2005, Winter). Unobserved Product Differentiation in
Discrete-Choice Models: Estimating Price Elasticities and Welfare Effects. RANDJournal of Economics 36 (4), 771–788.
Aghion, P., C. Harris, P. Howitt, and J. Vickers (2001). Competition, Imitation and Growthwith Step-by-Step Innovation. Review of Economic Studies 68 (3), 467–492.
Balcer, Y. and S. A. Lippman (1984). Technological expectations and adoption of improvedtechnology. Journal of Economic Theory 34, 292–318.
Berry, S. and P. Jia (2010). Tracing the woes: An empirical analysis of the airline industry.American Economic Journal: Microeconomics 2, 1–43.
Berry, S., J. Levinsohn, and A. Pakes (1995). Automobile prices in market equilibrium.Econometrica 63, 841–890.
Berry, S., J. Levinsohn, and A. Pakes (1999). Voluntary export restraints on automobiles:Evaluating strategic trade policy. American Economic Review 89, 400–430.
Bloom, N. (2009). The impact of uncertainty shocks. Econometrica 77 (3), 623–685.
Boldrin, M. and D. K. Levine (2008). Against Intellectual Monopoly. Cambridge UniversityPress.
Bresnahan, T. F. (2010). General purpose technology. In B. H. Hall and N. Rosemberg (Eds.),Handbook of the Economics of Innovation, Volume II. New York, NY: North-Holland.
Bronnenberg, B. J., J.-P. Dube, M. Gentzkow, and J. M. Shapiro (2015). Do pharmacistsbuy bayer? informed shoppers and the brand premium *. The Quarterly Journal ofEconomics 130 (4), 1669–1726.
Chamberlain, G. (1987). Asymptotic efficiency in estimation with conditional momentrestrictions. Journal of Econometrics 34, 305–334.
Chug, R., M. L. Cropper, and U. Narain (2011). The cost of fuel economy in the indianpassenger vehicle market. Energy Policy 39, 7174–7183.
Cohen, W. M. (2010). Fifty years of empirical studies of innovative activity and performance.In B. H. Hall and N. Rosenberg (Eds.), Handbook of The Economics of Innovation,Vol. 1, Volume 1 of Handbook of the Economics of Innovation, pp. 129 – 213. North-Holland.
Cosar, A. K., P. L. Grieco, S. Li, and F. Tintelnot (2018). What drives home marketadvantage? Journal of International Economics 110, 135 – 150.
Dube, J.-P., J. T. Fox, and C.-L. Su (2012). Improving the numerical performance ofstatic and dynamic aggregate discrete choice random coefficients demand estimation.Econometrica 80, 2231–2267.
Gandhi, A. and J.-F. Houde (2015). Measuring substitution patterns in differentiatedproducts industries. manuscript.
– 36 –

Gilbert, R. (2006). Looking for mr. schumpeter: Where are we in the competition-innovationdebate? In A. B. Jaffe, J. Lerner, and S. Stern (Eds.), Innovation Policy and theEconomy, Volume 6. MIT Press.
Goettler, R. L. and B. R. Gordon (2011). Does amd spur intel to innovate more? Journalof Political Economy 119 (6), 1141–1200.
Goldberg, P. K. and F. Verboven (2001). The evolution of price dispersion in the europeancar market. Review of Economic Studies 68, 811–848.
Greenwood, J. (1997). The Third Industrial Revolution: Technology, Productivity, andIncome Inequality. Washtington, DC: AEI Press.
Grigolon, L. and F. Verboven (2014, December). Nested Logit or Random Coefficients Logit?A Comparison of Alternative Discrete Choice Models of Product Differentiation. TheReview of Economics and Statistics 96 (5), 916–935.
Hall, B. H. (2009). The use and value of patent rights. Working paper.
Hansen, L. P. (1982). Large sample properties of generalized method of moments estimators.Econometrica 50, 1029–1054.
Hoon Hyun, J. (2008). A comparative analysis of transplants and industrial locationof japanese and korean automotive industries in europe. International Journal ofBusiness 13, 215–235.
Igami, M. (2015). Estimating the innovator’s dilemma: Structural analysis of creativedestruction in the hard disk drive industry, 1981–1998. Journal of Political Economy .
Kato, M. (1997). Japanese automakers struggle in europe. Working paper, NLI ResearchInstitute.
Knittel, C. R. and K. Metaxoglou (2013). Estimation of random coefficient demand models:Two empiricists’ perspective. Review of Economics and Statistics 95, forthcoming.
Lucas, R. J. (1988, July). On the mechanics of economic development. Journal of MonetaryEconomics 22 (1), 3–42.
Mansfield, E., M. Schwartz, and S. Wagner (1981, Dec). Imitation costs and patents: Anempirical study. The Economic Journal 91 (364), 907–918.
Manuelli, R. and A. Seshadri (2014). Frictionless technology diffusion: The case of tractors.American Economic Review 104 (4), 1368–1391.
Miravete, E. J., M. J. Moral, and J. Thurk (2018). Fuel taxation, emissions policy, andcompetitive advantage in the diffusion of european diesel automobiles. EconomicsLetters . RAND Journal of Economics.
Moral, M. J. and J. Jaumandreu (2007). Automobile demand, model cycle and age effects.Spanish Economic Review 9, 193–218.
Nevo, A. (2000). Mergers with differentiated products: The case of the ready-to-eat cerealindustry. RAND Journal of Economics 31, 395–421.
– 37 –

Oster, S. (1982). The diffusion of innovation among steel firms: The basic oxygen furnace.Bell Journal of Economics 13, 45–56.
Pakes, A., J. Porter, K. Ho, and J. Ishii (2015). Moment inequalities and their application.Econometrica 83 (1), 315–334.
Petrin, A. (2002). Quantifying the benefits of new products: The case of the minivan.Journal of Political Economy 110, 705–729.
Petrin, A. and B. Seo (2016). Identification and estimation of discrete choice models whenobserved and unobserved product characteristics are correlated. manuscript.
Reynaert, M. and F. Verboven (2013). Improving the performance of random coeffcientsdemand models: the role of optimal instruments. Journal of Econometrics 178,forthcoming.
Romer, P. M. (1990, October). Endogenous Technological Change. Journal of PoliticalEconomy 98 (5), S71–102.
Rose, N. L. and P. L. Joskow (1990). The diffusion of new technologies: Evidence from theelectric utility industry. RAND Journal of Economics 21, 354–373.
Rust, J., K. Gillingham, F. Iskhakov, A. Munk-Nielsen, and B. Schjerning (2016). Nonsta-tionary equilibrium in the auto market: Structural estimation using danish registerdata. Working paper.
Schumpeter, J. A. (1934). The Theory of Economic Development. Cambridge, MA: HarvardUniversity Press.
Schumpeter, J. A. (1942). Capitalism, Socialism, and Democracy. New York, NY: Harper& Row.
Schumpeter, J. A. (1950). Capitalism, Socialism, and Democracy (3 ed.). New York, NY:Harper & Row.
Seidenfuss, K.-U. and Y. Kathawala (2010). Voluntary export restraint (ver) without marketrestraints? the case study of the monitoring agreement (1991-1999) between thejapanese car manufacturers and the european union. European Business Review 17,217–231.
Skrainka, B. S. and K. L. Judd (2011). High performance quadrature rules: How numericalintegration affects a popular model of product differentiation. Working paper.
Waldfogel, J. (2012). Copyright protection, technological change, and the quality of newproducts: Evidence from recorded music since napster. The Journal of Law &Economics 55 (4), 715–740.
– 38 –
Appendix
(A). Spanish Data Sources
To control for household income distribution a thousand individuals are sampled each year
from the Encuesta Continua de Presupuestos Familiares (Base 1987 for years 1992-1997 and
Base 1997 for years 1998-2000) conducted by INE, the Spanish Statistical Agency.38 The
outside option varies significantly during the 1990s due to the important recession between
1992 and 1994 and the very fast growth of the economy and population (immigration) in the
second half of the decade. I also use these consumer surveys to set the size of the outside
option for each year in our sample which I compute as the total number of households minus
the total number of new car registrations. Starting with 1992, the outside market share s0t
is: 0.92, 0.94, 0.93, 0.93, 0.93, 0.92, 0.91, 0.89, and 0.89, respectively.
I also obtained fuel prices from INE. I use Spanish steel prices, spi, from the 2001 edition
of Iron and Steel Statistics – Data 1991-2000 published by the European Commission (Table
8.1).
For the analysis of demand I build a data set using prices and vehicle characteristics as
reported by La guıa del comprador de coches, ed. Moredi, Madrid. I select the price and
characteristics of the mid-range version of each model, i.e., the most popular and commonly
sold. Demand estimation also makes use of segment dummies. Other than the luxury
segment, which also includes sporty cars, our car segments follow the “Euro Car Segment”
definition described in Section IV of “Case No. COMP/M.1406 - Hyundai/Kia.” Regulation
(EEC) No. 4064/89: Merger Procedure Article 6(1)(b) Decision. Brussels, 17 March 1999.
CELEX Database Document No. 399M1406. Table II presents automobile characteristics by
market segment.
Until Spain ended its accession to the European Union transition period in 1992, it was
allowed to charge import duties on European products. Similarly, import duties for non-
European products converged to European levels. European imports paid tax duty of 4.4%
in 1992, and nothing thereafter. Non-European manufacturers had to pay 14.4% and 10.3%,
respectively. Thus, for the estimation of the equilibrium random coefficient discrete choice
model of Table III I distinguish between prices paid by consumers (p) and those chosen by
manufacturers (pw) .
The other relevant factor that changes during the 1990s is the ownership structure of
automobile firms. During this decade fiat acquired alfa romeo and lancia; ford
acquired volvo; and gm acquired saab. bmw acquired rover in 1994 but sold it in
May 2000 (with the exception of the “Mini” brand) so these are treated as separate firms.
Table C.1 describes the ownership structure at the beginning and end of the decade.
38See http://www.ine.es/jaxi/menu.do?L=1&type=pcaxis&path=/t25/p458&file=inebase for a de-scription of these databases.
– i –

(B). Japanese Automobile Sales in Europe.
In the analysis I treat all Japanese production as imported even though some models were
produced in the E.U. even before the beginning of our sample. Thus, for instance, Nissan
established in the U.K. in 1984 and Toyota and Honda in 1989. There are three observations:
(i) Most Japanese vehicles sold in the European automobile market during the 1990s were
imported from Japan, (ii) Out of those produced in Europe, many were light trucks not
included in the sample, and (iii) those produced in Europe could not avoid paying import
tariffs because local value added was considered too low to qualify as domestic production
by European rules until year 2000.
During the 1990s Japanese automakers tried to avoid E.U. import tariffs through the
establishment of factories in the U.K. and later in partnership with other manufacturers in
a strategy known as “Transplant Japanese Production.” To avoid import tariffs, Japanese
firms had to demonstrate that their models contained a sufficient amount of “local content.”
In France, Italy, Portugal, and Spain this amounted to 80% of value added had to be from
European sources – a stringent standard set at the request of European automakers.39 In
the U.K. and Germany a threshold of 60% was accepted as appropriate. Seidenfuss and
Kathawala [2010] document that these demanding requirements were active until 1999.
Table B.1 presents car models manufactured by Toyota, Nissan, Honda, and Mitsubishi,
the most important Japanese firms in Europe at the time, e.g., Kato [1997]. The U.K. was the
country where more Japanese passenger models were produced. As the UK Government was
less demanding in the application of the “local content” requirement, most of the production
was also sold there. Before year 2000, when these models were sold in Spain, they had to
face the European import tax duty rate – generally 10.3% during the sample. In any case,
the share of Japanese produced vehicles in Europe is very small – see [Miravete et al., 2018,
Appendix A].
Table B.1Japanese Models Produced in the E.U.
Toyota* Nissan Nissan Honda Mitsubishi**(UK) (UK) (Spain) (UK) (Netherlands)
Carina (1992-1996) Primera (1992-2000) Patrol (1992-2000) Accord (1992-2000) Carisma (1992-2000)Avensis (1997-2000) Micra (1992-2000) Terrano (1992-2000) Civic (1994-2000) Space Star (1998-2000)Corolla (1997-2000) Almera (1998-2000) Serena (1997-2000)
Almera (1999-2000)Other Light Vehicles
Notes: (*) Production in France started in 2001; (**) Mitshubishi also produced in Spain but onlymanufactured trucks and engines. In Netherlands Mitsubishi produced in a joint venture with Volvo.Source: Japan Automobile Manufactures Association.
39This local content commitment by Japanese firms in the E.U. is far higher than corresponding amount inthe USA, e.g., Hoon Hyun [2008].
– ii –

(C). Additional Results
Figure C.1 presents quantity sold of diesel and gasoline vehicles by different brands.
Figure C.1Sales by Firm and Type of Engine
0 25000 50000 75000 100000 125000 150000
SKODACHRYSLER
SAABSUZUKI
HYUNDAIMITSUBISMAZDATOYOTAHONDAVOLVO
ALFA ROMROVERLANCIANISSANBMWAUDI
MERCEDESVOLKSWAGEN
FIATOPELSEATFORD
RENAULTPEUGEOTCITROEN
Diesel Gasoline
(a) Year 1992
0 25000 50000 75000 100000 125000 150000
DAEWOOSUZUKI
MITSUBISHONDA
KIAMAZDALANCIA
CHRYSLERSAAB
VOLVOTOYOTAHYUNDAIALFA ROM
ROVERSKODA
MERCEDESBMWFIAT
NISSANAUDI
VOLKSWAGENFORDOPEL
PEUGEOTRENAULT
SEATCITROEN
Diesel Gasoline
(b) Year 2000
– iii –

Until Spain ended its accession to the European Union transition period in 1992, it was
allowed to charge import duties on European products. Similarly, import duties for non-
European products converged to European levels. European imports paid tax duty of 4.4%
in 1992, and nothing thereafter. Non-European manufacturers had to pay 14.4% and 10.3%,
respectively. Thus, for the estimation of the equilibrium random coefficient discrete choice
model of Table III I distinguish between prices paid by consumers (p) and those chosen by
manufacturers (pw) .
The other relevant factor that changes during the 1990s is the ownership structure of
automobile firms. During this decade fiat acquired alfa romeo and lancia; ford
acquired volvo; and gm acquired saab. bmw acquired rover in 1994 but sold it in
May 2000 (with the exception of the “Mini” brand) so these are treated as separate firms.
Table C.1 describes the ownership structure at the beginning and end of the decade.
Table C.1Automobile Groups: 1992 vs. 2000
Year 1992 Year 2000
Firm Gasoline Diesel Owner Gasoline Diesel Owner
alfa romeo 5,038 64 alfa romeo 2,941 3,983 fiataudi 16,689 1,982 volkswagen 15,273 24,184 volkswagenbmw 17,855 1,906 bmw 13,683 15,838 bmwchrysler 1,243 – 5,941 2,389citroen 68,890 36,851 psa 46,420 111,694 psadaewoo – – 25,201 –fiat 35,677 5,733 fiat 30,557 17,967 fiatford 121,140 17,468 ford 55,268 57,013 fordhonda 4,805 – 8,782 1,072hyundai 2,704 – 30,150 3,590kia – – 9,778 1,387lancia 11,117 905 lancia 2,206 2,126 fiatmazda 3,064 – 2,205 1,480mercedes 9,352 4,129 mercedes 13,953 10,684 mercedesmitsubishi 3,041 – 3,660 1,013nissan 16,010 905 17,855 21,971opel 110,286 11,099 gm 66,488 75,418 gmpeugeot 61,323 35,494 psa 55,371 92,496 psarenault 147,907 27,448 renault 76,925 99,360 renaultrover 15,255 425 rover 10,173 8,491 roversaab 1,551 – saab 1,867 2,424 gmseat 85,773 11,787 volkswagen 58,072 109,447 volkswagenskoda 724 – volkswagen 5,003 10,385 volkswagensuzuki 2,058 – 3,250 486toyota 4,425 – 16,827 3,584volkswagen 50,561 5,471 volkswagen 47,125 50,296 volkswagenvolvo 10,179 – volvo 7,379 3,566 ford
Notes: Sales of vehicle by manufacturer and fuel type. “Owner” indicates the name of the automobilegroup with direct control on production and pricing. Those without a group are all non-Europeanmanufacturers and defined as non-eu in the analysis.
– iv –

Figure C.2Change in the Distribution of Automobile Attributes
(a) Gasoline: Mileage (c90) (b) Diesel: Mileage(c90)
(c) Gasoline: Cost of Driving (kpe) (d) Diesel: Cost of Driving (kpe)
(e) Gasoline: size (f) Diesel: size
(g) Gasoline: Performance (hpw) (h) Diesel: Performance (hpw)
– v –

An Alternative Value of the TDI
In this section I repeat the analysis of Section VI but replace the “No TDI” and “No Rival
TDI” counterfactual equilibria where diesel vehicles disappear from the marketplace due
to either regulation or competition from the tdi. In the first experiment I consider the
equilibrium where diesels are either not allowed by regulators or were simply never developed
by any automobile manufacturer.40 I call this experiment “No Diesel” and use it to evaluate
the value of diesels in general. Interestingly, in this experiment the European auto market
comes closest to replicating market shares in the North American market where diesel vehicles
maintained a negligible market share during this period. I consider this equilibrium a more
extreme version of the “No TDI” equilibrium presented in the main text.
In the second experiment, I consider the equilibrium in which volkswagen successfully
defends its intellectual property and remains the sole producer of this next generation
technology. For simplicity I assume other automakers choose to remove their legacy diesel
passenger cars entirely from the product choice set since the advancements of the tdi in
terms of performance made these vehicles uncompetitive.41 volkswagen (including its
affiliate brands) is therefore the sole provider of diesel vehicles. These results are presented
in the column labeled “Monopoly.” I consider this equilibrium a more extreme version of
the “No Rival TDI” equilibrium presented in the main text.
Table C.2Value of TDI Technology to Volkswagen
1992 2000
No Diesel Data Monopoly No Diesel Data Monopoly
Prices (eThousand) 11.56 11.71 12.99 14.80 16.30 27.81- Diesel - 12.86 17.68 - 16.87 33.78- Gas 11.56 11.56 11.62 14.80 15.44 15.49
Market Share (%) 18.99 17.79 22.87 19.14 22.31 41.98- Diesel - 11.90 100.00 - 25.11 100.00- Gas 18.99 18.97 18.67 19.14 19.05 19.11
Margin (%) 40.46 39.57 42.62 37.03 33.35 55.06- Diesel - 32.78 48.94 - 31.94 63.81- Gas 40.46 40.42 40.78 37.03 35.50 37.01
Profit (eMillion) 654.45 694.23 1,002.11 696.88 1,510.03 6,370.43- Diesel - 72.88 364.12 - 922.99 5,696.73- Gas 654.45 621.36 637.98 696.88 587.04 673.70
Notes: “Price” is in thousands of 1994 euros. “Market Share” is the percent share of cars sold in the respective
category. “Margin” is the Lerner margin defined as(
p−cp
)where c is the estimated marginal cost and price (p)
includes any applicable import tariffs. “Profit” is measured in millions of 1994 euros. See Figure 4 for the evolutionof estimated price-cost margins across the decade. Statistics correspond to the volkswagen group and thereforeinclude the brands audi, seat, skoda, and volkswagen.
40For example, due to strict standards regarding nitrogen oxide emissions. See Miravete et al. [2018].41While this assumption may be strong, I remind the reader that diesel passenger cars were a niche product
in the European marketplace before the introduction of the tdi.
– vi –

From Table C.2 we see that the qualitative results line-up with those presented in Sec-
tion VI, though the magnitudes are of course larger. Similar to the main text, define period
t rent capture as
“Rent Capture” ≡ πBenchmarkt − πNo Diesel
t
πMonopolyt − πNo Diesel
t
. (C.1)
where (πNo Dieselt , πMonopoly
t , πBenchmarkt ) are the period t volkswagen profits when diesels
disappear from the market; volkswagen is the only firm which sells diesels, and the
estimated equilibrium, respectively. Rent capture under this definition is 13.4% across the
decade and follows a similar pattern as Figure 6.
Solving for Counterfactual Automobile Prices
In this section I provide computational details to find the profit-maximizing prices under
each policy experiment. For the sake of brevity, I suppress the period subscripts. Each firm
f produces some subset Jf of the j = 1, . . . , J automobile brands and chooses a vector of
pre-tariff prices pwj to solve:
maxpwj
∑j∈Jf
pwj − cj×Msj , (C.2)
The firm’s first-order condition for price conditional on product characteristics is given by:
sj +∑r∈Jf
(pwr − cr)×∂sr∂pwj
= 0 . (C.3)
Optimality requires that Equation (C.3) hold for all products sold in period t. I express the
set of firm f first-order conditions in matrix notation as:
s+ ∆× (pw − c) = 0 , (C.4)
where an element of the matrix Ω is defined as:
Ωjr =
∂sj∂pwr
, if j, r ⊂ Jf ,
0 otherwise .
(C.5)
For a given vector of marginal costs c, I use (C.4) to find the fixed point to the system
of equations – a common practice in the literature dealing with this class of models. To my
knowledge there exists no proof of convergence or uniqueness for this contraction operator
and fixed point. My experience (as is common) is that convergence is monotonic and proceeds
quickly. Further, starting from different starting values yields an identical result.
– vii –

Firm-Level Imitation
In Figure C.3 I present the increase in volkswagen profits from removing a diesel vehicle
from the psa and renault portfolios.
Figure C.3Business Stealing by EU Firms
0.88
1.60
2.62
5.63
0
1
2
3
4
5
6
Mill
ions
of E
uros
per
Die
sel M
odel
1992 2000
Foregone Profits per Competitor ModelRenault PSA
Notes: Statistics correspond to the value of foregone volkswagenprofits (in 1994 euros) per diesel model introduced by the renaultand psa. The reported statistic is the increase in volkswagen profitsdivided by the total number of diesel vehicles removed.
In Figure C.4 I evaluate firm-level imitation using the counterfactual environment in
which volkswagen is the sole provider of diesel vehicles as benchmark. There exists a
strong linear relationship (dashed blue line) and a large degree of heterogeneity across firms,
led by psa and renault. Firm-level imitation of the tdi leads to a 1.84% average decline
in volkswagen price with renault (4.33%) and psa (5.60%) again playing the role of
outlier. In comparison to Figure 7, the impact on volkswagen profits and retail prices are
much larger. This indicates a decreasing marginal impacts of imitation where the largest
impact on equilibrium prices and profits occurs with the initial imitators.
– viii –

Figure C.4Imitation, Business Sealing, and Static Efficiency
50
60
70
80
90
100
110
Per
cent
Cha
nge
in V
W P
rofit
s
0 50 100 150
Percent Increase in Diesels Offered
Fitted Values RenaultPSA Others
(a) VW Profits
-10-9-8-7-6-5-4-3-2-10123
Per
cent
Cha
nge
in V
W P
rice
0 50 100 150
Percent Increase in Diesels Offered
Fitted Values RenaultPSA Others
(b) VW Prices
Notes: Panels (a) and (b) present the change in VW profits and average retail prices, respectively, as a function of thediesel offerings of rival firms. For each observation I begin from the counterfactual world in which VW has a monopolyand add the corresponding rival firm’s observed diesel models. The x-axis is the percent increase in the total number ofdiesel vehicles available to consumers.
(D). Confidence Intervals
I constructed the 95% confidence intervals in Section VI via bootstrap simulation using
the point estimates and standard errors for the demand and cost parameters (Table III) to
construct a random sample (N=1,000) of demand and cost estimates. To ease computation,
I restricted the bootstrap to be over the nonlinear parameters α,Σ, ρ. For each boot-
strap sample n = 1, . . . , 1000; I begin with a set of parameters drawn from the empirical
distributions defined by Table III. Define θn = αn,Σn, ρn as the bootstrap parameters for
sample n where I restrict the vector of random coefficients (Σn) to be greater than zero. I
then recover the remaining parameters βn, γn following the solution method outlined in
Section V.42 Consequently, each bootstrap simulation n generates predicted market shares
which match the data by construction.
For each sample n and year t I then repeat each counterfactual experiment (e.g., “No
TDI”) using the parameter vector αn,Σn, ρn, βn, γn. The final product is a large set of
equilibria which vary by experiment and beginning parameter vector: αn,Σn, ρn, βn, γn.The confidence intervals presented are based on computing the relevant statistic for each
counterfactual equilibrium considered where I construct the 95% confidence interval for each
year as the range between the 2.5% and 97.5% quartiles, i.e., the middle 95%.
42First solve for the mean utilities δ(θn) such that bootstrap sample n generates predicted shares equal tothose observed in the data. I then recover mean utility demand β(θn) and cost γ(θn) parameters via linearprojection.
– ix –