cape town water resilienceacceleratecapetown.co.za/wp/wp-content/uploads/2017/06/...cape town water...
TRANSCRIPT
CAPE TOWN WATER RESILIENCE
Peter Flower - Water and Sanitation Department
23 June 2017

Presentation Outline
1. Infrastructure and water use
2. Management of current drought situation
3. Contingency planning
4. Accelerated water supply schemes
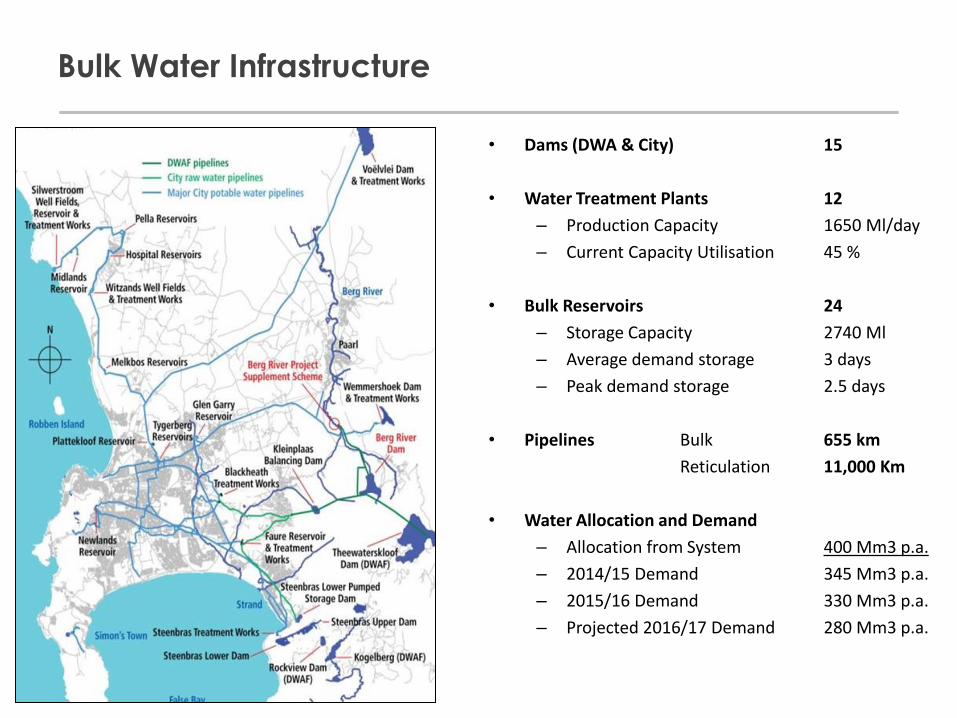
Bulk Water Infrastructure
• Dams (DWA & City) 15
• Water Treatment Plants 12
– Production Capacity 1650 Ml/day
– Current Capacity Utilisation 45 %
• Bulk Reservoirs 24
– Storage Capacity 2740 Ml
– Average demand storage 3 days
– Peak demand storage 2.5 days
• Pipelines Bulk 655 km
Reticulation 11,000 Km
• Water Allocation and Demand
– Allocation from System 400 Mm3 p.a.
– 2014/15 Demand 345 Mm3 p.a.
– 2015/16 Demand 330 Mm3 p.a.
– Projected 2016/17 Demand 280 Mm3 p.a.
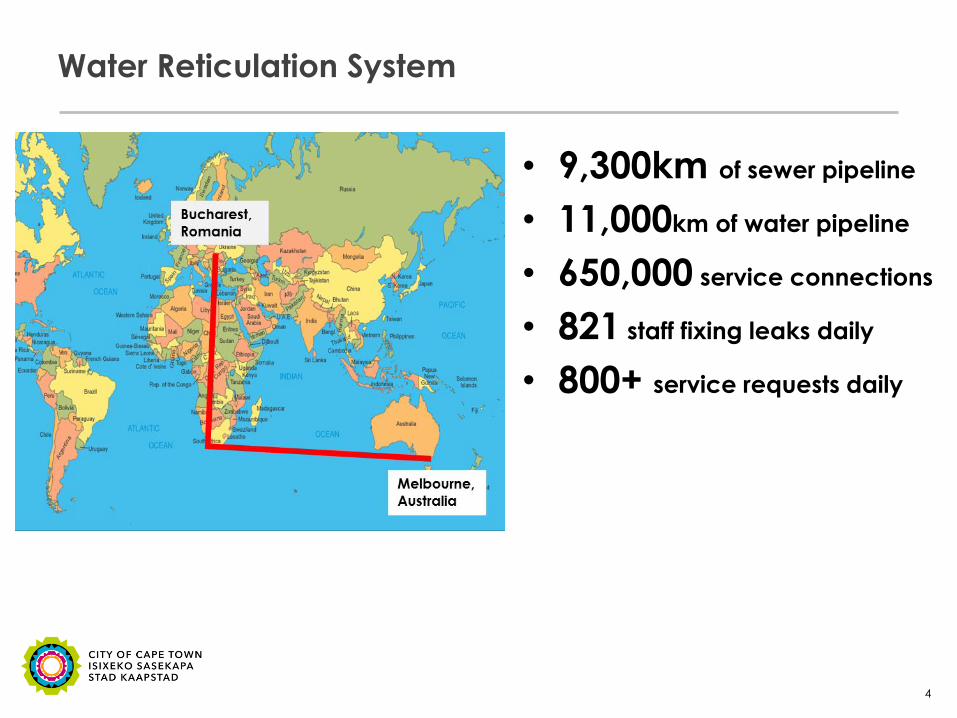
Water Reticulation System
4
• 9,300km of sewer pipeline
• 11,000km of water pipeline
• 650,000 service connections
• 821 staff fixing leaks daily
• 800+ service requests daily

Comparative Water Use from WCWSS (2014/2015)
Cape Town:
345 Mm3/a
(64%)
Other
municipalities:
37 Mm3
(7%)
Agriculture:
158 Mm3
(29%)

Water Use in Cape Town (2015 / 16)
Houses , 55.6%
Flats & complexes,
9.2%
Domestic other, 1.8%
Informal Settlements, 4.7%
Retail & Offices, 11.0%
Industry, 3.9%
CCT Departments & Council-owned premises,
5.2%
Government, 2.5%
Other, 6.2%
70 % Residential
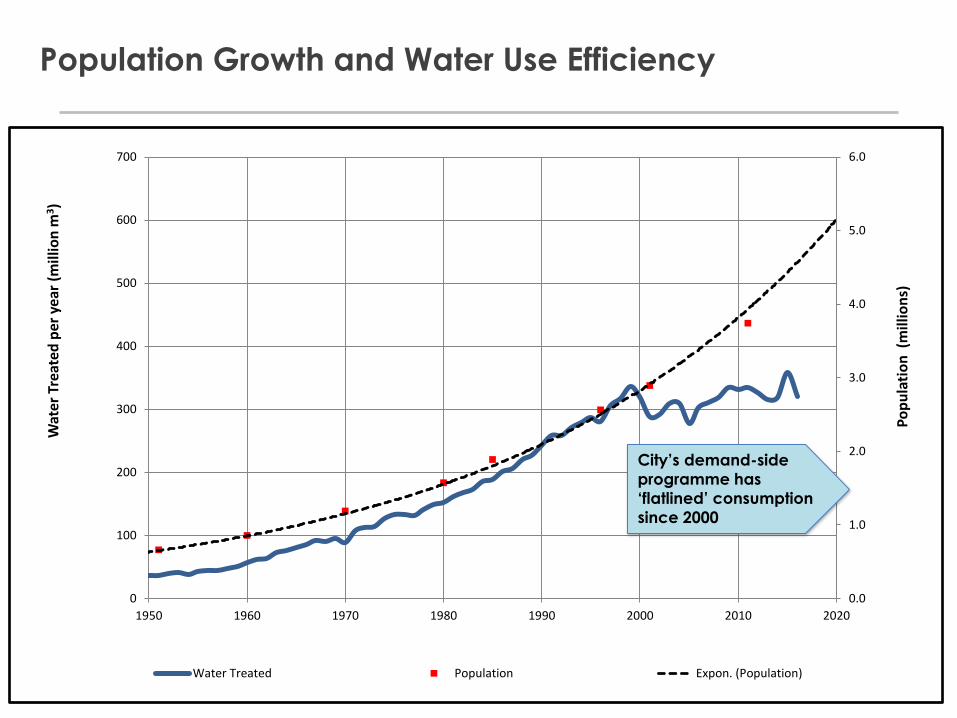
Population Growth and Water Use Efficiency
0.0
1.0
2.0
3.0
4.0
5.0
6.0
0
100
200
300
400
500
600
700
1950 1960 1970 1980 1990 2000 2010 2020
Po
pu
lati
on
(m
illio
ns)
Wat
er T
reat
ed p
er y
ear
(mill
ion
m3)
Water Treated Population Expon. (Population)
City’s demand-side
programme has
‘flatlined’ consumption
since 2000

Water Allocations and Actual Demand
Allocation from Berg
River Dam (84 Mm3)
Fully Financed by CCT
Combined allocations from Voelvlei,
Wemmershoek, Theewaterskloof and Steenbras
Dams plus Palmiet Transfer (320 Mm3)
Proposed COCT Augmentation Schemes
Accelerated Programme
(Additional 15 Mm3)
280- 260 Mm3
20 % Saving
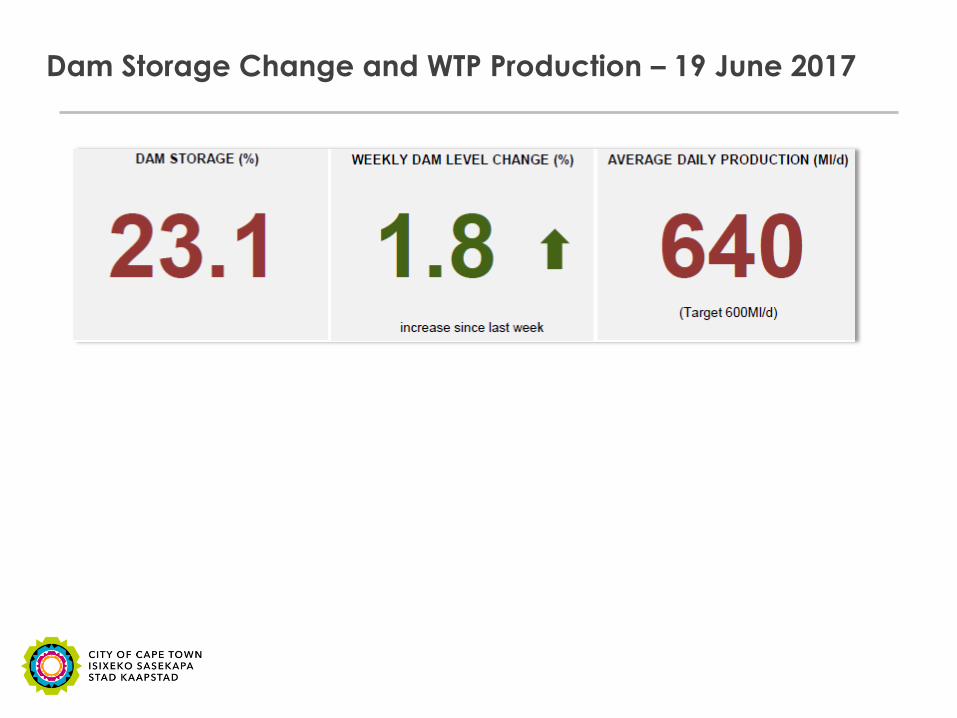
Dam Storage Change and WTP Production – 19 June 2017
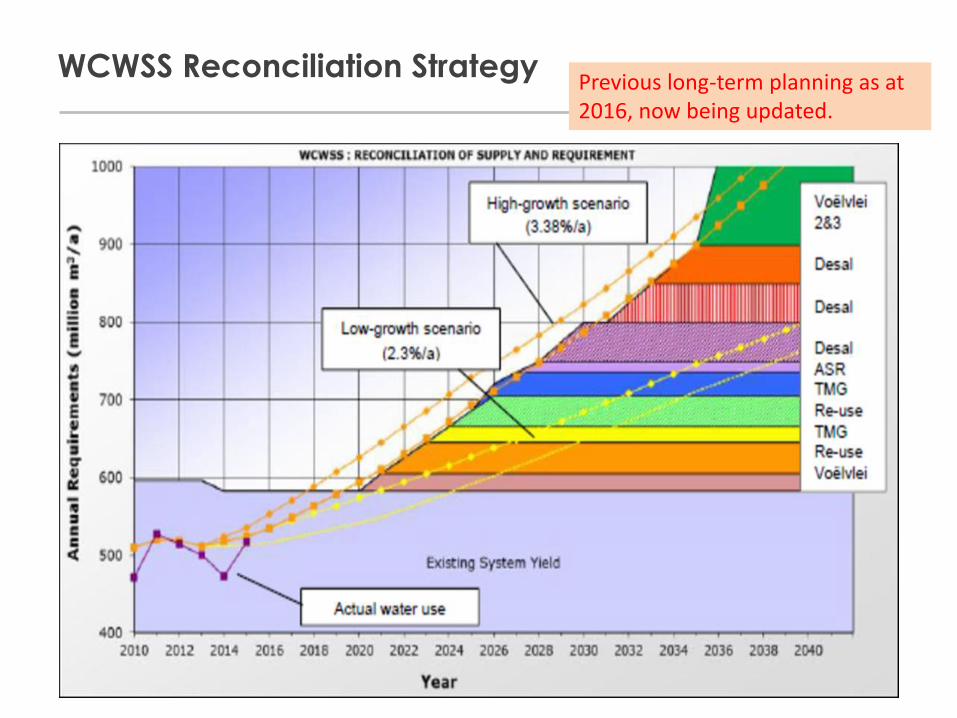
WCWSS Reconciliation Strategy Previous long-term planning as at 2016, now being updated.

30%
15-20%
62%
75%
WCWSS Storage Record
45-50%

City of CT dams - 20 year volume of water stored
Updated since recent rains in June

Proposed Full Domestic and Business Water Tariffs (2017/18)
Tariff Step (KL)
Level 1 (10%)
Level 2 (20%)
Level 3 (30%)
Level 4 (40%)
Step 1 (0 - 6)
4.56 4.56 4.56 4.56
Step 2 (6 - 10.5)
17.75 17.75 17.75 17.75
Step 3 (10.5 – 20)
20.77 22.85 24.93 25.97
Step 4 (20 – 35)
30.76 37.22 41.53 43.69
Step 5 (35 – 50)
38.00 51.30 70.29 113.99
Step 6 > 50
50.12 111.38 238.59 302.24
Commercial & industrial tariffs
18.77 21.82 25.35 27.97

Water Use and Restriction Targets
Target Actual Use (June 16 – May 17)
280 Mm3 287 Mm3 (19%)
600
500
21%
Unrestricted Summer
Proposed

“New Normal” Water Resilience Programme
o The days of plentiful water supply have past. Good rainfall years should be considered anomalous as opposed to drought years
o We must all adapt to water scarcity. This does not mean lower living standards or a diminished economy. The old “water scarcity” must become “enough water”
o The current situation presents an opportunity to build a new relationship with water. We must rethink our over-reliance on surface water and seek to build a Water Sensitive City
o Now is the time to build resilience. It is our collective responsibility
o We need to formulate a new relationship with risk as climate change adds significant uncertainty.
o Ultimately we need to make difficult choices for our future prosperity and seek a coalition of the best minds.
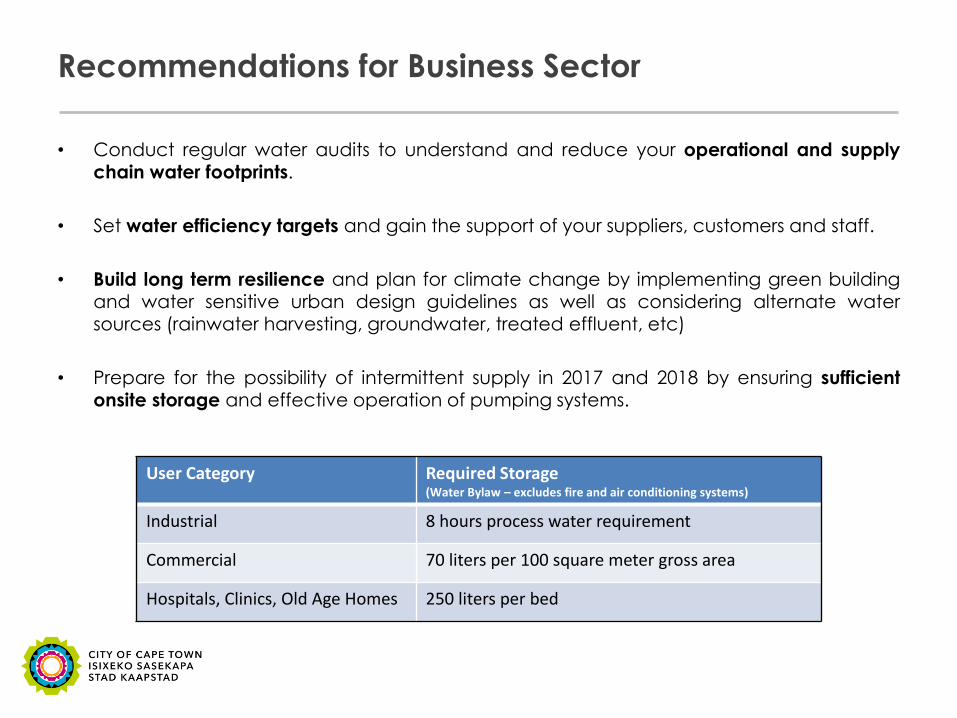
Recommendations for Business Sector
• Conduct regular water audits to understand and reduce your operational and supply chain water footprints.
• Set water efficiency targets and gain the support of your suppliers, customers and staff.
• Build long term resilience and plan for climate change by implementing green building and water sensitive urban design guidelines as well as considering alternate water sources (rainwater harvesting, groundwater, treated effluent, etc)
• Prepare for the possibility of intermittent supply in 2017 and 2018 by ensuring sufficient onsite storage and effective operation of pumping systems.
User Category Required Storage (Water Bylaw – excludes fire and air conditioning systems)
Industrial 8 hours process water requirement
Commercial 70 liters per 100 square meter gross area
Hospitals, Clinics, Old Age Homes 250 liters per bed

Planned New Supply
Scheme Yield
(Ml/day) Description Status Estimated Cost
TMG Aquifer 10 Development of well fields into deep aquifer at Steenbras, Wemmershoek and Theewaterskloof Dams
• Drilling tenders being evaluated • Contract commencement scheduled
for end June 2017. Completion March 2018
R 85 million
Seawater Desalination Package Plant
10 - 20 Primarily for sea water quality data acquisition as well as to improve supply security in Atlantis
• Design underway • Construction tenders to advertised in
July 2017. Completion May 2018
R 250 million
Wastewater Re-use (drinking water)
10 - 20 Treatment of effluent from Zandvliet and Bellville WWTW for direct or indirect injection into bulk water supply system.
• Design underway • Construction tenders to be advertised
in January 2018. Completion June 2018
R 250 million
Cape Flats Aquifer & Atlantis Aquifer
5 Incremental drilling to abstract water from Cape Flats Aquifer plus refurbishment at Atlantis aquifer.
• Consultants to be appointed in June 2017. Completion June 2018
R 50 million
WC/WDM Strategy 100 Intensification of demand management measures: • Water restrictions • Pressure management • Water saving incentive schemes • Regulation of plumbing fittings and
water using appliances • Informative water billing • Communication
• Level 4 restrictions effective June 2017 • Network pressures are being across the
metropolitan area
R 10 million
Voelvlei
Augmentation
(Phase 1)
60 DWS Scheme – Pumped transfer of water from Berg River to Voelvlei Dam
• Comment period for EIA closed. R 300 million
Note this is ‘work in progress’. Total new supply is being significantly added to beyond the below. See City media releases for regular updates on this.
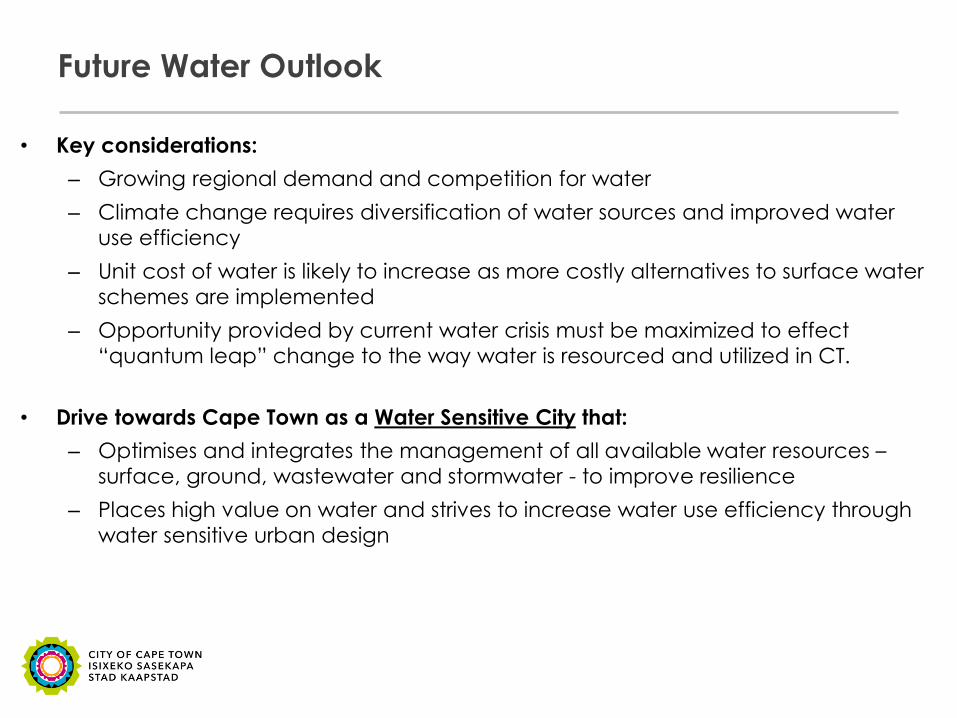
Future Water Outlook
• Key considerations:
– Growing regional demand and competition for water
– Climate change requires diversification of water sources and improved water
use efficiency
– Unit cost of water is likely to increase as more costly alternatives to surface water
schemes are implemented
– Opportunity provided by current water crisis must be maximized to effect
“quantum leap” change to the way water is resourced and utilized in CT.
• Drive towards Cape Town as a Water Sensitive City that:
– Optimises and integrates the management of all available water resources –
surface, ground, wastewater and stormwater - to improve resilience
– Places high value on water and strives to increase water use efficiency through
water sensitive urban design

The Future Cape Town – a Water Sensitive City

Thank You