capita plc half year results 2021
TRANSCRIPT

Capita plc
Half Year Results 2021
Summary• H1 financial results in line with expectations: revenue maintained, profit and margins increased, net debt
reduced• Inflecting to growth: Total Contract Value won of £2.6bn in H1; In Year Revenue won up 13% half-on-half• Strengthening balance sheet: £536m disposal proceeds generated year to date, liquidity of £693.7m at 30 June
2021• New operational structure implemented • Expect to deliver revenue growth this year and sustainable free cash flow2 in 2022
H1 2021 Financial outcome • Adjusted revenue1 in line with last year at £1,584.7m (H1 2020: £1,582.1m) despite the ongoing impact of
Covid-19• Adjusted profit before tax1 increased by £56.4m to £45.3m (H1 2020: loss £11.1m) reflecting stabilised revenue
and ongoing efficiency delivery from the cost transformation programme• Net debt (IFRS 16) reduced by £182.7m to £894.4m (31 December 2020: £1,077.1m) reflecting adjusted free
cash flow1 growth, with disposal proceeds partially offset by catch-up pension deficit contributions. Pre-IFRS 16 net debt reduced to £427.8m (31 December 2020 £569.0m)
On track for revenue growth in 2021
• Won Total Contract Value of £2,576m, an increase of 70% on prior year (H1 2020: £1,513m)• In Year Revenue won in H1 of £769m, up 13% on prior year (H1 2020: £680m), supporting our positive outlook
for growth in the full year and the medium term
Strengthening the balance sheet
• 75% of targeted £700m in proceeds to address short-term maturities already achieved◦ Completed the disposal of ESS in February for initial £299m, with a further £45m received in July and
AXELOS completed in July for £182.2m◦ Targeting further £175m of proceeds from subsequent disposals by end of H1 2022
• RCF extended, triennial pension valuation completed
Outlook
• Expect full year revenue growth in 2021, driven by new contracts and recovery in Covid-affected businesses• Operational performance and cost savings driving operating leverage • Continue to strengthen balance sheet through ongoing disposal programme• Building a more focused, sustainable business for the long term, delivering sustainable free cash flow2 in 2022
Jon Lewis, Chief Executive Officer, said:"I am pleased with the progress we have made with our strategy and the priorities we set out in March. We have maintained revenue; increased profit; strengthened the balance sheet; and implemented our new, simpler, more client-focused divisional structure.
“We have continued to deliver a good operational performance, won significant new business and have a strong pipeline of opportunities to come in the second half. We have also reduced our net debt, completing £536m of disposals already this year – with more to come.
“We are delivering on our plans and remain on track to deliver organic revenue growth this year for the first time in six years and generate sustainable free cash flow2 in 2022.
“This performance has only been made possible by the outstanding commitment of our talented colleagues, whom I am so honoured and proud to work alongside. I would like to thank all of them for their hard work and professionalism.”
Six months ended 30 June 2021
Financial highlights - continuing operations
Reported 2021 Reported 2020 Adjusted1 2021 Adjusted1 2020 Adjusted1
YOY change
Revenue £1,619.4m £1,682.7m £1,584.7m £1,582.1m —%
Profit/(loss) before tax £261.1m (£28.5m) £45.3m (£11.1m) 508%
Cash (used) / generated by operations (£22.5m) £355.7m £176.2m £189.8m (7)%
Free cash flow (£71.6m) £277.7m £130.7m £116.4m 12%
Net debt (£894.4m) (£1,096.6m) (£894.4m) (£1,096.6m) 18%
1 Capita reports results on an adjusted basis to aid understanding of business performance.2 Sustainable free cash flow = reported free cash flow excluding the impact of disposals
Capita plc
1

Investor presentationA presentation for institutional investors and analysts hosted by Jon Lewis, CEO and Tim Weller, CFO, will be held at 08:30am UK time, Friday 6 August 2021. This will be a live audio webcast on our website www.capita.com/investors and will subsequently be available on demand. The presentation slides will be published on our website at 07:00am and a full transcript will be available the next working day.
Webcast link:https://webcast.openbriefing.com/capita-hy21/
Participant Conference Call dial-in details:United Kingdom 0800 640 6441
United Kingdom (Local) 020 3936 2999
All other locations +44 20 3936 2999
Access code 804478
For further information:
Stuart Morgan, Investor Relations Director T +44 (0) 7989 665 484
Capita press office T +44 (0) 20 7654 2399
LEI no. CMIGEWPLHL4M7ZV0IZ88.
Capita plc
2

Chief Executive Officer's review
Summary
We are delivering on the plan we set out in March: to deliver revenue growth this year and sustainable free cash flow2 in 2022, to implement our new operational structure and to strengthen the balance sheet to support Capita's strategy.
We are on track for our target of £700m of disposal proceeds by the end of H1 2022. We have completed disposals so far this year yielding proceeds of £536m; we received £299m of ESS proceeds in the first half with another £45m received in July, £10m from our Irish Life and Pensions business, and we have now received £182.2m from the disposal of AXELOS. We have recently commenced further disposal processes in addition to the two processes launched earlier in the year. Remaining businesses in the Portfolio will be disposed of in due course. We also completed the triennial pension scheme valuation and extended our RCF in June.
Our markets are recovering but at different rates – the UK government market is strong; the private sector continues to be affected by the impact of ongoing lockdowns delaying Covid-19 recovery in certain businesses like Travel & Events.
We continue to expect to return to revenue growth this year. We have won significant amounts of new business, at appropriate margins, with a good pipeline of opportunities in the second half. This is despite the ongoing impact of Covid-19.
Capita continues to become a simpler and stronger business: we are sustaining good levels of operational delivery across the Group, including on large new transformational contracts; and we expect to have resolved our two remaining major problem contracts by the end of this year.
We have seen good progress in profit and margins as they recover from last year, driven by stable revenues enabling the operating leverage benefit of our ongoing efficiency initiatives to drop to the bottom line.
As we have previously indicated, 2021 is expected to see cash outflows of around £340m from catch up pension deficit contributions, restructuring investment and the reversal of 2020’s deferred VAT benefit. Moving into 2022, we expect a reduction of around £300m in the annual cash cost of these items, which underpins the expected transition to sustainable free cash flow.
We implemented our new, more client-focused structure on 2 August. Capita now has two core divisions with attractive market shares, strong pipelines and a track record of winning new work. In addition, it is a simpler organisation to run, which will deliver at least £50m of cost savings in 2022.
We remain on track to deliver our full year 2021 expectations and for the generation of sustainable free cash flow2 from 2022 onwards.
Financial outcome
We maintained adjusted revenue1 year on year at £1,585m (H1 2020: £1,582m), as some known contract losses, mainly from Customer Management, and the impact of two full quarters impacted by Covid-19 were offset by positive transactional revenue in Technology Solutions and People Solutions as well as the benefit of new contract wins; including Royal Navy and Royal Marines training, Job Entry Targeted Support (JETS) in Scotland and annualisation of the start of the Defence Fire and Rescue Project (DFRP) last year. On a quarterly basis, the first quarter was down against the first quarter of 2020, which was largely unaffected by Covid-19, but new business wins underpinned growth of 4.5% in the second quarter.
Adjusted profit before tax1 for the half year increased by £56.4m to £45.3m (H1 2020: loss £11.1m). This principally reflected transformation cost savings of £78.5m, new revenue (£10.9m) and the unwind of £22.7m of prior year holiday accrual impact, more than offsetting revenue losses and the reinstatement of the employee bonus scheme.
Adjusted free cash flow1 improved to £130.7m (H1 2020: £116.4m), mainly reflecting growth in adjusted EBITDA to £145.6m and a £27.9m reduction in capital expenditure, interest and tax costs partially offset by a £51.2m reduction in working capital inflows compared with the first half of 2020, which, as previously disclosed, benefited from around £77m of Covid-19-related advanced receipts.
Net debt at 30 June 2021 was £182.7m lower at £894.4m (31 December 2020 £1,077.1m) as the increase in free cash flow and ESS and Irish Life and Pensions disposal proceeds more than offset some of our below-the-line cash payments including £139.9m of pension deficit contributions. Pre-IFRS 16 headline net debt1 was £427.8m (31 December 2020: £569.0m).
Liquidity was £693.7m at 30 June 2021.
Delivering revenue growth in 2021
Our ability to deliver sustainable revenue growth remains a fundamental part of our long-term success and we are on track to deliver organic revenue growth in 2021 for the first time in six years, despite an absence of recovery from many of our Covid-19 affected businesses in the year so far.
Our markets are recovering at different speeds. We are seeing a number of good opportunities in UK Government-facing work in the verticals where we are focused, in particular in Health & Welfare and in Defence. There is also a trend across Government to invest in digitalisation and we are well placed to serve that requirement. Private sector markets have not been as strong, as the extended lockdown period in the UK has led to delays in procurement processes. Certain markets continue to be heavily affected by Covid-19, such as travel and events and in-person training.
The organisation of our sales capability continues to improve, reflecting our investment in systems, people and processes over the past four years. Our understanding and use of the, increasingly high quality, data in our Customer Relationship Management (CRM) system is giving us much better insight enabling us to target our sales resources on the best opportunities. We are also seeing significant improvement in sales forecasting accuracy, notwithstanding the volatile market backdrop, which gives us further confidence for the future.
Capita plc
3

We continue to be disciplined in the contracts we compete for as part of our drive to improve margins and mitigate risk. Average net margins on bids subject to our contract review processes during the transformation remain in double digits.
We have had a successful first half winning new business, reflecting our competitive customer propositions and services. Total Contract Value (‘TCV’) won was £2,576m, an increase of 70% on the prior year (H1 2020: £1,513m). This was significantly boosted by our Royal Navy and Royal Marines training contract win in January, worth £925m. Excluding that win our TCV increased by 9% year on year.
Major contracts won during the period include the Royal Navy Training contract, a renewal for a long-standing major European telecommunications client (TCV £528m), a renewal for Tesco Mobile (TCV £58m) and a renewal with a financial services client for learning services (TCV £124m). We expect to be able to achieve a step-up in margins on the renewed contracts through robust operational delivery, more efficient digital services and adding complementary higher-margin value-add services.
The In-Year-Revenue (IYR) won in this half was £769m, an increase of 13% (H1 2020: £680m). This has offset the benefit we received last year from £77m of Covid-19-related work.
The order book at 30 June 2021 was £6.7bn (31 December 2020 £5.9bn), with £1.1bn recognised in the first half and £2.1bn won in order book-qualifying revenue. Book to bill is now above 1x, having increased from 0.78x in 2019, 0.94x in 2020 and is expected to be c.1.3x at the end of this year.
Capita has won positions on 24 Government Procurement frameworks since 2020 giving access to over £23 billion in opportunities in Digital Transformation, Technology Managed Services, Software, Consulting & Transformation, Service Design, Employability Services and Digital BPS (Grant Administration). We have identified opportunities for us to participate in a further £13 billion of framework tenders over the next couple of years.
Since the end of the half, we have won another two-year extension to our Personal Independence Payment (PIP) assessment contracts for the Department of Work (DWP) and Pensions and Northern Ireland’s Department for Communities. The total combined contract value is £161m for the two years to 31 July 2023.
Through a combination of being more client-focused and bringing together products and services from across the Group, we continue to understand better our customer demand and where we can win. 90% of what we sold was defined in 20 Client Value Propositions (CVPs). Key areas include Complex Transformation; Customer Experience Transformation; Customer Experience Delivery; Access to Skills and Managed Service Technology. We also continue to shift our mix of work towards higher-value Consulting and Transformation work, as we move up the value chain to complement our Delivery revenue.
The unweighted pipeline has decreased since 31 December 2020 to £16,074m (31 December 2020: £17,851m) as large opportunities were won and transferred to the order book. We also pulled out of £400m of opportunities because they did not meet our enhanced risk-reward criteria. The quality of opportunities in the pipeline is better and the 2022 pipeline has increased by £2bn over the last 12 months, mostly in large opportunities in Government Services (Ministry of Defence, DWP) and Customer Management (Financial Services and Transport).
We are getting better at converting opportunities and winning bids. Our win rates on all business are increasing and are now at 76%, up 14pts from H1 2020. Our conversion rate of opportunities also continues to improve and is now at 66%, up from 41% last year. Our win rates on renewals remains even higher at 89% (H1 2020: 90%). This gives us confidence in our ability to win business and reflects the quality of leads that are now in the pipeline.
Operating leverage to drive cash and margin improvementOperational deliveryOur day-to-day delivery of operations have remained robust, despite having to continue to work within some Covid-19 affected environments.
Day to day service KPIs demonstrate strong performance, with 91% of our major KPIs on track, up 1% on H1 2020 and service credits remain low, despite activity levels increasing from 2020’s exceptional lows. During the first half, our service credits (arising from KPIs not achieved) were £2.5m, up £0.7m on H1 2020 but significantly better than the £7.0m seen in H1 2019. The majority of these were in Customer Management, arising from a small number of challenging contracts, and in People Solutions where our Pensions Administration business continues to resolve service issues.
We are also now resolving the last of our major problematic legacy contracts. As mentioned at the full year results, 16 contracts, with operational, profit and cash problems, had been reduced to two: Electronic Monitoring Transformation (EMS) and Primary Care Support England (PCSE). For PCSE, we successfully went live in May 2021 with GP Payments and Pensions, completing the transformation projects required under the contract; and we are in the process of finalising commercial terms on the main transformation project for EMS.
Reducing costOur cost savings programme will see a pivotal transition in 2021. We have delivered almost £400m of savings so far as part of the Group’s transformation. Up to now these savings have served to mitigate margin impact as revenues reduced, firstly through high attrition and then from the impact of Covid-19. As revenues stabilise and we move into a growth phase, we expect the cost savings we deliver to enhance margins and to increase the rate of bottom-line growth.
Our Operational Excellence workstream has delivered cost savings through process improvement and productivity and reducing the cost of poor quality (not doing things right first time), allowing us to reduce headcount principally through natural attrition. The Operational Excellence programme is benefiting from the investment we have made in tools and processes that enable us to make better decisions: OrgVue to determine best practice structures, Evolve to improve project management and Lean Six Sigma to eliminate waste (over 2,500 of our people have enrolled in the Six Sigma programme over the last 12 months). There is scope for ongoing efficiency as we settle into the new divisional structure.
Technology savings were secured through continuing to focus on consolidating third party IT spend across the Group, reducing duplication of system usage and using technology to facilitate the reduction of other costs such as travel.
Capita plc
4
As we highlighted at our full year results, we are in the process of significantly reducing our property footprint, by a projected 25% over 2020 and 2021, and by over 60% in London alone. In the first half of this year, we closed 28 locations and reduced our footprint in eight more. The majority of the property consolidation programme will be complete by the end of this year.
We continue to improve procurement processes and internal purchasing behaviours, leverage our scale and consolidate our supplier base.
Our new, more focused structure
On 2 August, we completed the transition into our new divisional structure, comprising two core growth divisions - Capita Public Service and Capita Experience - focused on distinct market and client needs and a third division, Capita Portfolio, which contains our non-core businesses. We will report our Group results in this structure at the full year announcement in March 2022.
Capita Public ServiceCapita is the number one strategic supplier of Business Process Services (BPS) and technology services to the UK Government, with around a 10% share of central government BPS spend and over 20% of local government BPS spend. The division is focused around five verticals in Government where it has particular expertise and scale: Education & Learning; Local Public Services; Health & Welfare; Defence, Security & Fire; and Central Government, Justice & Transport.
Government spending in the UK with private organisations is around £110bn according to Tussell and TechMarketView estimate that the Software and IT Services market is valued at £13bn and the BPS element of that is growing at over 7% per annum. This forecast market growth is driven by Government increasingly looking to leverage technology, new digital products and emerging capabilities in BPS, for example, data analytics, predictive intelligence, AI, RPA, cloud and cyber, in order to deliver faster service transformation using repeatable standardised technology and software. This is expected to improve the citizen experience and enhance productivity and cost efficiency.
The Public Service division is well positioned for growth, benefiting from its scale and capability in the verticals noted above. This is already evident in its strong recent track record of contract wins and improving margin.
In the first half of 2021 Public Services has had a strong start to the year: it has won £1,772m of TCV (H1 2020: £704m), of which £925m was the Royal Navy and Royal Marines Training contract. Excluding the effect of this contract, TCV sales are up by 20% on the comparative period. We expect a strong TCV run rate in the second half. IYR won was £445m, a 40% increase on prior year (H1 2020: £314m) reflecting the Royal Navy and Royal Marines contract. The recent large contract wins have led to a record first half book to bill ratio of 2.52x.
The unweighted pipeline for Public Service is substantial at £9,949m. Key Client Value Propositions in the pipeline centre around Digital Business Processing, Employability, Access to Skills and Assessment as a Service. The biggest examples are the DWP PIP extension (now won), a digital project for the NHS, and opportunities for the MOD and Department for Education. Over half of the revenue won by Capita Public Services in the first half was transformation work, and we have increasing amounts of consulting in its pipeline as the Division moves towards a richer business mix.
Capita Public Service is expected to grow revenue, profit and cash generation over the next three years and will be the main contributor to the Group’s free cash flow in 2022.
Capita ExperienceCapita is one of Western Europe’s leading customer experience businesses, with market-leading positions in the UK, Ireland and Switzerland and a number two position in Germany. Our focus is on chosen industry verticals: Telecoms, Media & Technology; Retail & Consumer Products; Energy & Utilities; Government & Transport and Financial Services. Capita works with a number of blue-chip clients including 50 of Europe’s top companies. The Global customer experience market is valued at around £55bn by NelsonHall and is expected to grow at around 5% between 2020 and 2024. Covid-19 has accelerated the long-standing trend for technology-led change across our client base. The drive to digital includes a customer desire to shift to self-service when convenience matters and high-quality human interactions supported by technology (AI, data, analytics) where high touch is important. In order to support continuity and facilitate these experiences, we focus our efforts on creating omni-channel customer service offerings supported by digital and data-led decision tools. We have also transitioned our business model such that around three-quarters of our people who are currently working from home will be ready for a longer-term hybrid working approach supported by agile and resilient Cloud capabilities.
The digitally enabled, self-service shift, driven both by business need and consumer demand, means that the highest market growth rates are expected in Retail, Healthcare and Financial Services, with Telecoms businesses also benefiting from a shift to online entertainment. Two-thirds of Capita’s current customer management revenue comes from Financial Services, Telecoms and Retail.
Capita Experience won £514m of TCV in H1 (H1 2020: £551m) and £132m of IYR (H1 2020: £172m), with the decrease in both cases mainly reflecting prior year Covid-19-related wins and the delay to some bid processes into the second half of the year. We expect strong second-half sales performance. Weighted pipeline coverage of 69% is in line with our forecasts and the book to bill ratio for the first half was 0.86x, an increase from 0.65x at the end of 2020.
The unweighted pipeline for Capita Experience is £5,089m. Key CVPs in the pipeline centre around Customer Experience Delivery, Customer Experience Transformation and Financial Sustainability. The biggest opportunities are renewals with a major financial services client and with a UK broadcaster, as well as a new opportunity with a Telecoms company. Almost all of the Division’s work won this year has been Delivery, with more Transformation opportunities in the pipeline as noted above.
Capita Experience is currently at an earlier stage in its transformation than Public Services and remains focused on developing its customer propositions, driving profitability through continued efficiency initiatives and delivering cash-backed profitability.
Capita PortfolioCapita Portfolio comprises all our non-core businesses that are intended for disposal. This includes the remaining assets in our Specialist Services division, as well as certain assets transferred from the other previous divisions.
Capita plc
5

Shared and Group Support ServicesA major benefit of the Group’s new organisation structure is that it will drive out complexity, supporting greater client focus but also enabling the transition to smaller, leaner support functions. We have spent the first half of the year completely rewiring the way the business is structured and establishing a new operating model to facilitate this transition.
Shared and Group Support costs are expected to reduce moving forwards as we right-size the functions for the new divisional structure. So far this year we have identified many opportunities to create significant efficiencies through the new structure and this process will continue over the coming months. The two growth divisions will benefit from leaner shared services, in particular as we create a single shared services centre for technology and software, bringing together resource that was previously spread across all six divisions. We remain on track to deliver £50m of cost savings from the new organisation in 2022.
Strengthening the balance sheet
At our full year results in March, we set out a plan to strengthen our balance sheet and to address upcoming debt maturities of £440m over 2021 and 2022. This plan included the target of realising £700m of disposal proceeds and we have made good progress in the first half.
• We announced the disposal of ESS for an initial consideration of £299m, received in February, and an additional £45m deferred until the CMA cleared the subsequent merger of ESS and ParentPay – which we received in July.
• In March, we announced the commencement of three disposal processes, and that we were targeting at least £200m of proceeds in 2021 from them: the AXELOS joint venture with Government, our ‘blue light’ emergency services software business and our specialist insurance business.
• On 21 June we announced we had agreed the sale of AXELOS for £380m with Capita receiving £182m in July 2021.
• The blue light and specialist insurance processes are ongoing and further disposal processes are under way. The combined revenue in 2020 for all the businesses currently for sale was around £200m.
The remaining businesses in the Portfolio division have proforma 2020 revenue of around £350m, which reflects the impact of Covid-19 on certain businesses such as Travel & Events, Evolvi, Enforcement and Optima Legal.
In June, we signed a £300m Revolving Credit Facility (RCF) with our lending banks for 12 months to August 2023. The new facility will start on expiry of the current £452m facility in August 2022. This new facility includes a conditional extension to August 2024. We expect to reduce the size of the RCF over time as our liquidity requirement diminishes and as we continue the execution of the portfolio disposal programme. A sustainability component has been included in the new facility that can adjust the margin by up to five basis points conditional upon achieving agreed ESG KPIs. The facility continues to remain undrawn.
Also in June, we reached a settlement with the Group’s Pension Scheme Trustees in respect of the 2020 triennial valuation. Following the previously agreed payment of almost £140m of deficit reduction contributions in the first half of 2021, the new funding agreement will result in £14m of deficit reduction contributions in the second half of the year, £30m in each of 2022 and 2023 and further contributions of £15m in each of 2024, 2025 and 2026.
In July we repaid £159m of US private placement notes.
With the disposal programme off to a good start and the RCF extension and pension agreement we have de-risked scheduled debt maturities this year and next. We also remain on track for positive free cash flow next year. We are therefore able to take a measured approach to the establishment of an appropriate longer term debt solution to support Capita’s strategy.
Path to sustainable free cash flow2
We remain on track to deliver sustainable free cash flow2 in 2022 reflecting:
• the foundations we have established for sustainable revenue growth;
• the expected delivery of further margin and profit improvement in the core business, supplemented by at least £50m of annual cost savings from simplifying the Group; and
• a major reduction in cash flow headwinds in 2022 from ‘below-the-line’ cash payments, as explained in the financial review below.
Outlook
We have performed in line with our expectations in the first half of the year and expect to deliver full year organic revenue growth and remain on track to generate sustainable free cash flow2 in 2022. This is underpinned by revenue growth and margin expansion through a richer business mix and efficiency delivery and a material reduction in negative one-off cash impacts from deferred VAT payments, pension contributions and restructuring costs.
We will continue to strengthen the balance sheet with our ongoing disposal programme.
We will continue to make this a more predictable and stable business that delivers increasing, sustainable free cash flow2 for our shareholders.
___________________________________________1 Refer to alternative performance measures in the appendix2 Sustainable free cash flow = reported free cash flow excluding the impact of disposals
Capita plc
6

Divisional performance reviewThe following divisional financial performance is presented on an adjusted revenue1 and adjusted operating profit1 basis. Reported profit is not included, because the Board assesses divisional performance on adjusted results. The basis of preparation of the adjusted figures and KPIs is set out in the Alternative Performance Measures (APMs) summary in the appendix to this statement.
Software
Divisional financial summary 2021 2020 % change
Adjusted revenue1 (£m) 121.7 127.4 (4.5)%
Adjusted operating profit1 (£m) 22.0 13.2 66.7%
Adjusted operating margin1 (%) 18.1% 10.4%
Adjusted cash generated by operations (£m) 41.8 36.7 13.9%
Order book (£m) (comparative at 31 December 2020) 424.4 510.9 (16.9)%
Adjusted revenue1 reduced by 4.5% to £121.7m reflecting lower volumes in AMT Sybex and the cessation of certain support contracts in our Secure Solutions and Services business offset by some recovery of volumes within the Pay 360 business.
We have seen positive results from our investments in the last three years in Pay360, Retain and Capita ONE in particular. In a difficult market Retain has renewed 100% of contracts due in the period, Capita ONE has gained new business for the first time in two years and Pay360 has signed up a number of new merchant clients. Across the division renewal rates remain high at 95% on all opportunities bid for.
Notable wins and renewals include: wins within Pay360, a renewal with National Grid in AMT Sybex, HCA Healthcare (HCD) and a number of wins within our Retain business.
Adjusted operating profit1 improved 66.7% to £22.0m despite the reduction in revenue as efficiency programmes delivered savings in property, travel and IT costs.
Operational delivery has been good, supported by the stronger capabilities developed in the last three years. This has resulted in a significantly lower cost of poor quality, with estimated savings of c.£4m so far this year. We have also seen benefits of this in our Digital Development Centres, where the improved systems and faster product developments cycles have been recognised in the CMMI accreditation announced earlier this year. The DDC also administers Capita.com.
We have secured cost savings in the first half of £5m from organisational restructuring and continued benefits from previous technology and procurement initiatives.
Adjusted cash generated by operations1 improved 13.9% to £41.8m reflecting the improvement in profit offset by offset by a lower working capital inflow due to one-off inflow benefits in H1 20.
People Solutions
Divisional financial summary 2021 2020 % change
Adjusted revenue1 (£m) 232.2 221.5 4.8%
Adjusted operating profit1 (£m) 12.2 3.3 269.7%
Adjusted operating margin1 (%) 5.3% 1.5%
Adjusted cash generated by operations (£m) 9.1 6.6 37.9%
Order book (£m) (comparative at 31 December 2020) 941.6 534.4 76.2%
Adjusted revenue1 increased by 4.8% to £232.2m reflecting commencement of the Royal Navy and Royal Marines training contract which more than offset historic contract losses. Retention rates have remained high since early 2020.
Notable wins and renewals include: the 12-year Royal Navy and Royal Marines Training contract which is being delivered in partnership with Government Services, a four-year extension worth £30m with Fujitsu to continue to partner and deliver HR and payroll solutions to the Northern Ireland Civil Service, a £124m contract renewal with a major UK financial client and a five year extension with the Universities Superannuation Scheme.
Following the extension of the Army Recruitment (RPP) contract in December 2020, we achieved 100% of the recruitment target for regular soldiers and officers for the year, and remain on-track to deliver the cloud conversion project which is expected to reach full operating capability in 2022.
Adjusted operating profit1 increased 269.7% to £12.2m with increased revenue and higher margin achievement on some long-term contracts supplemented with lower depreciation and amortisation expenditure from asset sales in 2020 and continued focus on efficiency.
Our focus throughout the year remained consistent focus on clients and operational performance with the strengthening of leadership in key roles aiding client delivery. While service credits are expected to increase this year reflecting a number of pandemic-related freezes on 2020 service credits, these remain materially lower than 2019.
Further progress has been made on cost competitiveness programmes with the flow through from prior year activities realised, particularly property footprint and headcount reductions, combined with savings from Technology and Operational Excellence delivered in 2021.
Adjusted cash generated by operations1 improved 37.9% to £9.1m reflecting increased EBITDA offset by a working capital outflow from recovery of volumes in Learning Services and higher CFA outflows on RPP on transformation.
Capita plc
7

Customer Management
Divisional financial summary 2021 2020 change %
Adjusted revenue1 (£m) 513.5 561.8 (8.6)%
Adjusted operating profit1 (£m) 47.6 41.5 14.7%
Adjusted operating margin1 (%) 9.3% 7.4%
Adjusted cash generated by operations (£m) 27.6 45.7 (39.6)%
Order book (£m) (comparative at 31 December 2020) 2,344.4 2,134.7 9.8%
Adjusted revenue1 fell by 8.6% to £513.5m, mainly as a result of attrition from contract expiries (Debenhams, VW Group and FirstGroup), the cessation of Covid-19-support contracts and volume decreases in particular in the Life & Pensions business. This has been partly offset by wins in the EU business and with Irish Water.
Notable wins and renewals include an extension for up to seven years for a long-standing major European telecommunications client (TCV £528m), a three year renewal of our market-leading Tesco Mobile client (TCV £58m) and the deployment of our new mortgage platform for Virgin Money. Renewals rates have improved to 98% all across opportunities.
We have a number of opportunities expected over the next 12 months, for clients in financial services, transport and a UK-based broadcaster, which will help to offset expected contract losses such as at William Hill.
Adjusted operating profit1 increased by 14.7% to £47.6m as we continue to deliver cost savings, particularly through the operational excellence initiative. Profit in the period also benefited from the impact of deferred income releases from our life insurance business and a contract cessation which have more than offset lost margin on contract losses. Contract losses are expected to have a larger impact on profitability over the remainder of the year.
Our operational delivery remains strong and we have focused on ensuring that we can operate a secure, stable and reliable service for our clients despite Covid-19 lockdown arrangements in our key geographies, in particular in South Africa and India. We have maintained our KPI performance in 2021.
During 2021, we remained profitable on our mobilcom-debitel contract following completion of the three-year transformation programme. We remain on track with a number of initiatives which are expected to underpin future contract profitability. During the period, we received notice of termination of another contract, following the client's decision to change their strategy. The associated deferred income and contract assets will now be released over the termination period (12 months); compared with the previously assumed contract end date.
Adjusted cash generated by operations1 decreased 39.6% to £27.6m reflects working capital outflow due to timing of invoicing on some clients and the impact of contract terminations. This was offset by a client reverting to annual payment basis.
Government Services
Divisional financial summary 2021 2020 % change
Adjusted revenue1 (£m) 401.2 364.8 10.0%
Adjusted operating profit1 (£m) 27.5 14.2 93.7%
Adjusted operating margin1 (%) 6.9% 3.9%
Adjusted cash generated by operations (£m) 70.4 49.8 41.4%
Order book (£m) (comparative at 31 December 2020) 2,357.9 2,057.0 14.6%
Adjusted revenue1 increased 10.0% to £401.2m, reflecting the impact of new business such as the Ministry of Defence Fire and Rescue Project (DFRP) contract and commencement of the Royal Navy and Royal Marines training and Job Entry Targeted Support (JETS) contracts.
Notable wins and renewals include: £0.9bn relating to Royal Navy and Royal Marines Training which is being delivered jointly with People Solutions, additional scope on DFRP and Smart DCC and a new £22m contract for the JETS programme in Scotland. Our renewal rate was 98% across all opportunities and 100% on renewals we chose to bid on.
Since the end of the half, we have been awarded another two-year extension to our Personal Independence Payment (PIP) assessment contracts for the Department of Work (DWP) and Pensions and Northern Ireland’s Department for Communities. The total combined contract value is £161m for two years to 31 July 2023.
Adjusted operating profit1 increased 93.7% to £27.5m largely due to the prior year one-offs including the initial loss on the DFRP contract and bid costs incurred on a number of successful 2020 bids. Transformation savings offset cost change and additional programme costs on the EMS transformation programme.
We have built an effective business winning team with a standardised operational approach to growing pipeline and bidding and rigorous governance which is repeatable across the division. We continue to deliver a consistently high level of client service which has led to a lower level of service credits and additional opportunities on contracts.
There has been continued focus on the two remaining historically problematic contracts. In May 2021 we successfully completed the last legacy transformation element of the Primary Care Support England (PCSE) contract. The GP Pensions and Payments transformation successfully went live enhancing efficiency and consistent operational delivery. We continued to strengthen our relationship and have maintained all service levels in the year to date. We are in the process of agreeing the cessation of the main Electronic Monitoring Transformation project for the Ministry of Justice, although we will continue to deliver the day-to-day monitoring service.
Across the division, we continue to work to improve cash generation, winning the right work and removing costly logistics from previously underperforming contracts utilising efficient IT solutions where possible. This will continue to improve margins on previously underperforming contracts.
Capita plc
8

Adjusted cash generated by operations1 increased 41.4% to £70.4m reflecting the increased profitability and lower contract fulfilment asset spend on DFRP which was offset by the impact of advanced receipts in H1 20.
Technology Solutions
Divisional financial summary 2021 2020 % change
Adjusted revenue1 (£m) 211.6 190.5 11.1%
Adjusted operating profit1 (£m) 18.7 12.7 47.2%
Adjusted operating margin1 (%) 8.8% 6.7%
Adjusted cash generated by operations (£m) 68.1 55.1 23.6%
Order book (£m) (comparative at 31 December 2020) 389.5 370.2 5.2%
Adjusted revenue1 increased by 11.1% to £211.6m with increased volumes on TfL Networks and Trustmarque and one-off Covid-19 wins in intelligent communications. This additional revenue more than offset contract losses with NHS BSA and AAH Pharmaceuticals.
Notable wins and renewals include: A one year contract extension worth £20m with Education Network Northern Ireland, additional scope on our TfL Networks contract with TCV of £13m and a new win with the Business Services Organisation worth £7m. Our renewal rate has improved to 92% from 66% on renewals we chose to bid for. Within our CIC business, previous investments in business capability increased our ability to take on work with additional projects within the NHS completed as a result of the pandemic. As a consequence of our efficient management and turnaround times on programmes we continued to win business as further demand arose. The increased capacity and efficiency will allow future growth.
Adjusted operating profit1 increased by 47.2% to £18.7m due to improved margins from revenue mix and the flow through impact of successful cost saving initiatives in the prior year.
Operational performance has remained strong and we continue to enhance our relationship with TfL on our Networks contract with a number of service improvement go-lives due in 2021. We continue to work hard to maintain service delivery on historically lower performance contracts through enhanced project management and deployment of quality resource.
Cost savings have been delivered through reducing the cost of poor quality with more predictable delivery and better service across our client base, despite continued remote working. Additional cost savings have been realised from reducing our property footprint and through organisational structure changes.
We have continued to invest in data centre consolidation, which is due to be completed in 2022, and in our cloud migration programme. There has been further development and growth within the Centre of Excellence and our cloud offerings which will be key as businesses transfer to the Public and Experience divisions. Our partnerships with Microsoft, AWS and Cisco continue to support delivery on a number of our key contracts.
Adjusted cash generated by operations1 increased by 23.6% to £68.1m reflecting increased profitability and lower contract fulfilment asset spend on TfL Networks compared with the prior period.
Specialist Services
Divisional financial summary 2021 2020 % change
Adjusted revenue1 (£m) 95.3 102.4 (6.9)%
Adjusted operating profit1 (£m) 0.3 (4.1) 107.3%
Adjusted operating margin1 (%) 0.3% (4.0)%
Adjusted cash generated by operations (£m) 2.0 31.4 (93.6)%
Order book (£m) (comparative at 31 December 2020) 234.3 234.2 —%
Adjusted revenue1 reduced 6.9% to £95.3m with a continued impact of Covid-19 restrictions on the travel and enforcement businesses and contract losses within the Tascor business.
Despite the challenging market conditions, in travel and events, which in July was renamed to agiito, client retention has remained strong with additional new clients secured during H1. The business remains well placed for increased volumes when restrictions are eased.
Notable wins include a new contract with Translink worth up to £4m over 4 years.
Adjusted operating profit1 improved from a loss of £4.1m to a profit of £0.3m as cost saving initiatives, including a reduction in property footprint and other reductions in short term discretionary spend, mitigated the impact of margin lost on transactional revenue.
Service levels have remained steady with no service credits incurred to date in 2021. The businesses which have not been impacted by Covid-19, including insurance, Page One and translation and interpretation have continued to perform well.
We have continued with a range of successful cost savings across the division in order to mitigate the impact of Covid-19 and rightsize the division. We have successfully implemented home working across a number of businesses significantly reducing the division’s property footprint which will continue to drive savings.
Adjusted cash generated by operations1 reduced 93.6% to £2.0m despite an improvement in EBITDA reflecting the impact of working capital inflows from reduced business volumes in H1 20.___________________________________________1 Refer to alternative performance measures in the appendix
Capita plc
9
Financial review
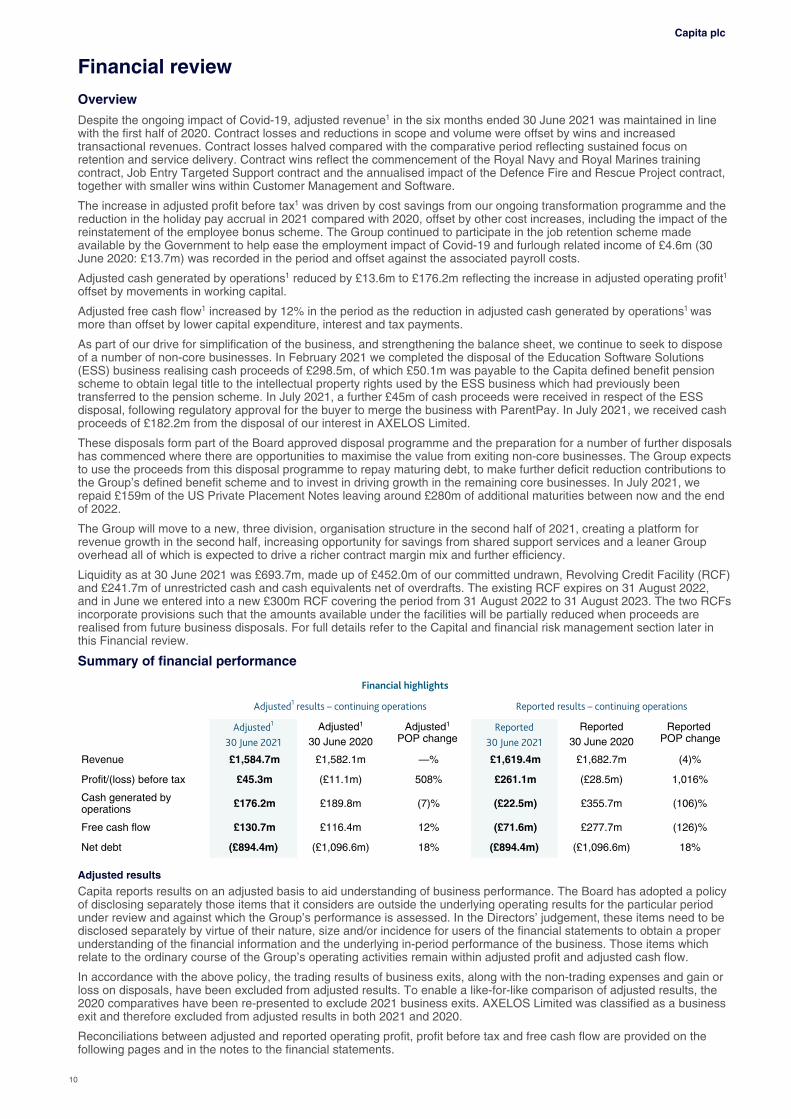
Overview
Despite the ongoing impact of Covid-19, adjusted revenue1 in the six months ended 30 June 2021 was maintained in line with the first half of 2020. Contract losses and reductions in scope and volume were offset by wins and increased transactional revenues. Contract losses halved compared with the comparative period reflecting sustained focus on retention and service delivery. Contract wins reflect the commencement of the Royal Navy and Royal Marines training contract, Job Entry Targeted Support contract and the annualised impact of the Defence Fire and Rescue Project contract, together with smaller wins within Customer Management and Software.
The increase in adjusted profit before tax1 was driven by cost savings from our ongoing transformation programme and the reduction in the holiday pay accrual in 2021 compared with 2020, offset by other cost increases, including the impact of the reinstatement of the employee bonus scheme. The Group continued to participate in the job retention scheme made available by the Government to help ease the employment impact of Covid-19 and furlough related income of £4.6m (30 June 2020: £13.7m) was recorded in the period and offset against the associated payroll costs.
Adjusted cash generated by operations1 reduced by £13.6m to £176.2m reflecting the increase in adjusted operating profit1 offset by movements in working capital.
Adjusted free cash flow1 increased by 12% in the period as the reduction in adjusted cash generated by operations1 was more than offset by lower capital expenditure, interest and tax payments.
As part of our drive for simplification of the business, and strengthening the balance sheet, we continue to seek to dispose of a number of non-core businesses. In February 2021 we completed the disposal of the Education Software Solutions (ESS) business realising cash proceeds of £298.5m, of which £50.1m was payable to the Capita defined benefit pension scheme to obtain legal title to the intellectual property rights used by the ESS business which had previously been transferred to the pension scheme. In July 2021, a further £45m of cash proceeds were received in respect of the ESS disposal, following regulatory approval for the buyer to merge the business with ParentPay. In July 2021, we received cash proceeds of £182.2m from the disposal of our interest in AXELOS Limited.
These disposals form part of the Board approved disposal programme and the preparation for a number of further disposals has commenced where there are opportunities to maximise the value from exiting non-core businesses. The Group expects to use the proceeds from this disposal programme to repay maturing debt, to make further deficit reduction contributions to the Group’s defined benefit scheme and to invest in driving growth in the remaining core businesses. In July 2021, we repaid £159m of the US Private Placement Notes leaving around £280m of additional maturities between now and the end of 2022.
The Group will move to a new, three division, organisation structure in the second half of 2021, creating a platform for revenue growth in the second half, increasing opportunity for savings from shared support services and a leaner Group overhead all of which is expected to drive a richer contract margin mix and further efficiency.
Liquidity as at 30 June 2021 was £693.7m, made up of £452.0m of our committed undrawn, Revolving Credit Facility (RCF) and £241.7m of unrestricted cash and cash equivalents net of overdrafts. The existing RCF expires on 31 August 2022, and in June we entered into a new £300m RCF covering the period from 31 August 2022 to 31 August 2023. The two RCFs incorporate provisions such that the amounts available under the facilities will be partially reduced when proceeds are realised from future business disposals. For full details refer to the Capital and financial risk management section later in this Financial review.
Summary of financial performance
Financial highlights
Adjusted1 results – continuing operations Reported results – continuing operations
Adjusted1 30 June 2021
Adjusted1 30 June 2020
Adjusted1
POP changeReported
30 June 2021Reported
30 June 2020Reported
POP change
Revenue £1,584.7m £1,582.1m —% £1,619.4m £1,682.7m (4)%
Profit/(loss) before tax £45.3m (£11.1m) 508% £261.1m (£28.5m) 1,016%
Cash generated by operations £176.2m £189.8m (7)% (£22.5m) £355.7m (106)%
Free cash flow £130.7m £116.4m 12% (£71.6m) £277.7m (126)%
Net debt (£894.4m) (£1,096.6m) 18% (£894.4m) (£1,096.6m) 18%
Adjusted results
Capita reports results on an adjusted basis to aid understanding of business performance. The Board has adopted a policy of disclosing separately those items that it considers are outside the underlying operating results for the particular period under review and against which the Group’s performance is assessed. In the Directors’ judgement, these items need to be disclosed separately by virtue of their nature, size and/or incidence for users of the financial statements to obtain a proper understanding of the financial information and the underlying in-period performance of the business. Those items which relate to the ordinary course of the Group’s operating activities remain within adjusted profit and adjusted cash flow.
In accordance with the above policy, the trading results of business exits, along with the non-trading expenses and gain or loss on disposals, have been excluded from adjusted results. To enable a like-for-like comparison of adjusted results, the 2020 comparatives have been re-presented to exclude 2021 business exits. AXELOS Limited was classified as a business exit and therefore excluded from adjusted results in both 2021 and 2020.
Reconciliations between adjusted and reported operating profit, profit before tax and free cash flow are provided on the following pages and in the notes to the financial statements.
Capita plc
10

Adjusted revenue
Adjusted revenue1 bridge by key driver £m
Six months ended 30 June 2020 1,582.1Contract losses (62.2)Ongoing contract scope and volume changes (15.4)Transactional revenue growth 17.9Contract wins 62.3Six months ended 30 June 2021 1,584.7
Adjusted revenue1 was broadly in-line with the prior period. The adjusted revenue1 movements were as follows:
• contract losses halved compared with the comparative period reflecting sustained focus on retention and service delivery;
• the relatively small ongoing contract scope and volume reductions reflect 2020 pandemic related work and other projects in Customer Management which did not repeat in 2021;
• transactional revenue improved as 2020 was particularly impacted by Covid-19 when the business experienced a negative impact of around £80m - this half saw the biggest recovery in Technology Solutions and People Solutions; and
• the first half of 2021 benefited from a number of notable contract wins including the commencement of the Royal Navy and Royal Marines training contract, which is being jointly delivered by our Government Services and People Solutions divisions; and the Job Entry Targeted Support contract which commenced in February; and these were combined with the annualised impact of the Defence Fire and Rescue Project contract and smaller wins within Customer Management and Software.
Adjusted profit before tax
Adjusted profit before tax1 bridge by key driver £m
Six months ended 30 June 2020 (11.1)One-offs in 2020 - contract-related 12.5Six months ended 30 June 2020 rebased 1.4Contract losses (16.5)Ongoing contract scope and volume changes (5.2)Transactional revenue growth 6.7Contract wins 10.9Transformation cost savings 78.5Other cost movements (12.9)Subtotal 62.9Holiday pay 22.7Bonus (40.3)
Six months ended 30 June 2021 45.3
Adjusted profit before tax1 increased in 2021. The adjusted profit before tax1 bridge above reflects the following items:
• to ensure a like-with-like starting point, the 2020 one-offs, which included contract asset impairments and contract provisions, are adjusted for;
• the margin effect of revenue losses, scope and volume, transactional changes and contract wins were a net £4.1m negative, with the ramp up mainly in the second quarter from new wins not yet offsetting the impact of contract losses;
• the transformation programme continued to deliver substantial savings in the first half of 2021 with a £78.5m period on period benefit;
• as outlined in the last year's interim results, the Group's holiday pay accrual impacted the first half of 2020. The impact of this has significantly unwound in 2021 as colleagues stepped up the usage of their holiday entitlement. This is a trend expected to continue in the second half of 2021 and therefore the phasing of the leave accrual recognition will result in a weighting of operating profit to the second half; and
• the period on period impact of the reinstatement of the employee bonus scheme this year with £25m accrued at 30 June 2021 compared with the release of the 2019's £15m accrual in the first half of 2020.
Moving into the second half, we expect to see the reward from the investment in cost transformation over the last few years with revenue growth and operating leverage driving the bottom line.
Capita plc
11
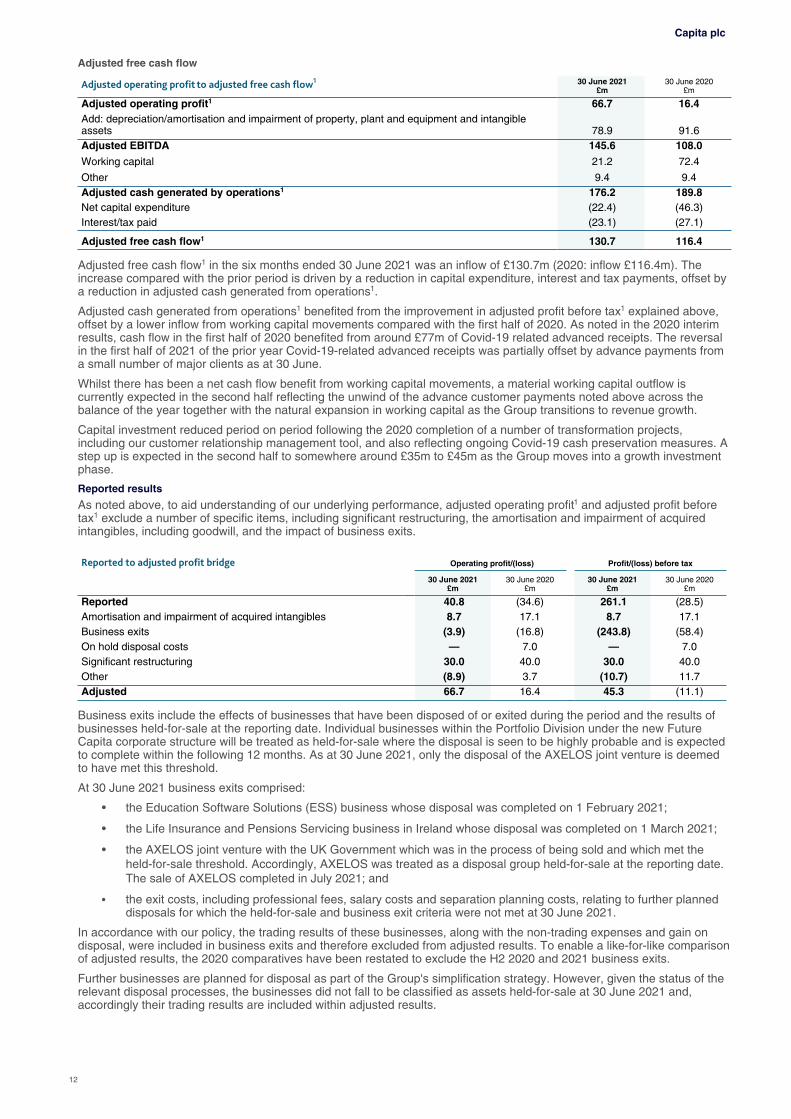
Adjusted free cash flow
Adjusted operating profit to adjusted free cash flow1 30 June 2021 £m
30 June 2020£m
Adjusted operating profit1 66.7 16.4Add: depreciation/amortisation and impairment of property, plant and equipment and intangible assets 78.9 91.6Adjusted EBITDA 145.6 108.0
Working capital 21.2 72.4
Other 9.4 9.4Adjusted cash generated by operations1 176.2 189.8Net capital expenditure (22.4) (46.3)Interest/tax paid (23.1) (27.1)
Adjusted free cash flow1 130.7 116.4
Adjusted free cash flow1 in the six months ended 30 June 2021 was an inflow of £130.7m (2020: inflow £116.4m). The increase compared with the prior period is driven by a reduction in capital expenditure, interest and tax payments, offset by a reduction in adjusted cash generated from operations1.
Adjusted cash generated from operations1 benefited from the improvement in adjusted profit before tax1 explained above, offset by a lower inflow from working capital movements compared with the first half of 2020. As noted in the 2020 interim results, cash flow in the first half of 2020 benefited from around £77m of Covid-19 related advanced receipts. The reversal in the first half of 2021 of the prior year Covid-19-related advanced receipts was partially offset by advance payments from a small number of major clients as at 30 June.
Whilst there has been a net cash flow benefit from working capital movements, a material working capital outflow is currently expected in the second half reflecting the unwind of the advance customer payments noted above across the balance of the year together with the natural expansion in working capital as the Group transitions to revenue growth.
Capital investment reduced period on period following the 2020 completion of a number of transformation projects, including our customer relationship management tool, and also reflecting ongoing Covid-19 cash preservation measures. A step up is expected in the second half to somewhere around £35m to £45m as the Group moves into a growth investment phase.
Reported results
As noted above, to aid understanding of our underlying performance, adjusted operating profit1 and adjusted profit before tax1 exclude a number of specific items, including significant restructuring, the amortisation and impairment of acquired intangibles, including goodwill, and the impact of business exits.
Reported to adjusted profit bridge Operating profit/(loss) Profit/(loss) before tax
30 June 2021£m
30 June 2020£m
30 June 2021£m
30 June 2020£m
Reported 40.8 (34.6) 261.1 (28.5)Amortisation and impairment of acquired intangibles 8.7 17.1 8.7 17.1Business exits (3.9) (16.8) (243.8) (58.4)On hold disposal costs — 7.0 — 7.0Significant restructuring 30.0 40.0 30.0 40.0Other (8.9) 3.7 (10.7) 11.7Adjusted 66.7 16.4 45.3 (11.1)
Business exits include the effects of businesses that have been disposed of or exited during the period and the results of businesses held-for-sale at the reporting date. Individual businesses within the Portfolio Division under the new Future Capita corporate structure will be treated as held-for-sale where the disposal is seen to be highly probable and is expected to complete within the following 12 months. As at 30 June 2021, only the disposal of the AXELOS joint venture is deemed to have met this threshold.
At 30 June 2021 business exits comprised:
• the Education Software Solutions (ESS) business whose disposal was completed on 1 February 2021;
• the Life Insurance and Pensions Servicing business in Ireland whose disposal was completed on 1 March 2021;
• the AXELOS joint venture with the UK Government which was in the process of being sold and which met the held-for-sale threshold. Accordingly, AXELOS was treated as a disposal group held-for-sale at the reporting date. The sale of AXELOS completed in July 2021; and
• the exit costs, including professional fees, salary costs and separation planning costs, relating to further planned disposals for which the held-for-sale and business exit criteria were not met at 30 June 2021.
In accordance with our policy, the trading results of these businesses, along with the non-trading expenses and gain on disposal, were included in business exits and therefore excluded from adjusted results. To enable a like-for-like comparison of adjusted results, the 2020 comparatives have been restated to exclude the H2 2020 and 2021 business exits.
Further businesses are planned for disposal as part of the Group's simplification strategy. However, given the status of the relevant disposal processes, the businesses did not fall to be classified as assets held-for-sale at 30 June 2021 and, accordingly their trading results are included within adjusted results.
Capita plc
12

In 2018, the Board launched a multi-year transformation programme to support the objectives of simplifying and strengthening Capita. The programme has extended to property rationalisation, procurement centralisation, transformation of support functions, including investment in growth, and operational excellence initiatives, including investment in automation. These activities are designed to improve the cost competitiveness of the Group and secure Capita’s position in the markets it serves and strengthen governance and control. In response to the varied impacts of Covid-19 experience during 2020 the Group adapted and rescheduled its restructuring activities such that they now extend throughout 2021.
The costs of the transformation programme, including redundancy costs, are excluded from adjusted operating profit1 as significant restructuring. Restructuring costs of £30.0m were lower than the comparative period and it is expected that strategic restructuring costs will increase in the second half with the implementation of the Future Capita structure which is effective from August. Overall for the 2021 full year we are projecting restructuring costs of between £75m and £90m in what will be the last year of substantial restructuring investment being classified as an adjusting item.
Further detail of the specific items charged in arriving at reported operating profit for 2021 is provided in note 3 to the condensed consolidated financial statements.
Reported to adjusted free cash flow30 June 2021
£m30 June 2020
£m
Reported (71.6) 277.7Pension deficit contributions 139.9 14.1Significant restructuring 23.8 28.1Litigation and claims 18.3 —On hold disposal costs — 2.0Business exits (1.8) (55.4)Non-recourse trade receivables financing 7.2 (32.8)VAT deferral 14.9 (117.3)
Adjusted 130.7 116.4
Reported free cash flow was lower than adjusted free cash flow1 principally reflecting pension deficit contributions (which the directors consider to be debt-like in nature), the cash costs of the strategic restructuring programme and the settlement of individually material litigation and claims.
In addition, in 2020, the benefit from the Covid-19-related Government VAT deferral measures and utilisation of a non-recourse trade receivables financing facility were also excluded from adjusted free cash flow1. The VAT deferral benefit is expected to largely reverse during 2021. The non-recourse trade receivables financing facility was put in place in the early stage of the Covid-19 pandemic to mitigate the risk of customer receipts slippage.
Cash flow headwindsAs previously reported, in 2021 the Group is expected to be impacted by material cash outflows arising from reversal of the VAT deferral noted above, pension deficit contributions and significant restructuring. The actual cash outflows in the first half of 2021 together with forecast outflows in the second half 2021, full year 2021 and full year 2022 in respect of these items is set out in the table below.
Cash flow headwinds
ActualH1 2021
£m
ForecastH2 2021
£m
ForecastFY 2021
£m
ForecastFY 2022
£m
VAT deferral 15 90 105 15Pension deficit contributions 140 14 154 30Below-the-line restructuring 24 51-66 75-90 —
Total 179 155-170 334-349 45
One of the largest outflows in 2021 will be the repayment of deferred VAT under the Government's Covid-19 support measures, which is expected to be largely repaid by the end of the year.
There have been substantial catch-up pension deficit contributions in the first half of the year. Following agreement reached in June with the pension Trustees in respect of the 2020 triennial valuation, we expect to make a further regular deficit contribution of around £14m in the second half of 2021 and £30m in 2022.
Notwithstanding the step up in restructuring costs expected in the second half of the year as the new organisation structure is implemented, moving into 2022 restructuring costs are expected to be materially lower and it is not planned that these costs will be excluded from adjusted results beyond the current financial year.
The material reduction in the cash outflows in 2022 arising from these items, is one of the key factors underpinning the expected transition to sustainable free cash flow2 from that year onwards.
Capita plc
13
Movements in net debt
Net debt at 30 June 2021 was £894.4m (31 December 2020: £1,077.1m). The reduction in net debt largely reflects the proceeds from the ESS disposal.
Net debt30 June 2021
£m31 December 2020
£m
Opening net debt (1,077.1) (1,353.2)
Cash movement in net debt 204.5 344.1
Non-cash movements (21.8) (68.0)
Closing net debt (894.4) (1,077.1)
Remove closing IFRS 16 impact 466.6 508.1
Headline net debt (pre-IFRS 16) (427.8) (569.0)
Cash and cash equivalents net of overdrafts 297.7 141.1
Debt net of swaps (725.5) (710.1)
Headline net debt (pre-IFRS 16)/adjusted EBITDA1 1.9x
Headline net debt (post-IFRS 16)/adjusted EBITDA1 2.9x
The Board’s view is that the appropriate pre-IFRS 16 headline leverage ratio for Capita over the medium term should be between 1.0 and 2.0 times headline net debt to adjusted EBITDA1.
The calculations of the net debt to adjusted EBITDA1 and interest cover ratios for covenant purposes in respect to the Group's US Private Placement Loan Notes and other financing arrangements are set out in the APM appendix to the condensed consolidated financial statements.
At 30 June 2021, the US Private Placement Loan Notes net debt to adjusted EBITDA1 covenant ratio was 1.5 times (30 June 2020: 1.5 times, 31 December 2020: 1.8 times) and was 2.1 times for all other financing agreements (30 June 2020: 2.1 times, 31 December 2020: 2.5 times) compared with maximum permitted levels of 3.0 times and 3.5 times respectively.
At 30 June 2021, the interest cover1 covenant ratio was 12.1 times for the US Private Placement Loan Notes and 12.0 times for other financing arrangements (30 June 2020: 8.1 times and 7.6 times, and 31 December 2020: 8.5 times and 7.8 times respectively) compared with minimum permitted levels of 4.0 times for all debt instruments.
The Group's headline leverage ratio was therefore in line with the Board's target and the Group was compliant with all debt covenants at 30 June 2021.
Capital and financial risk management
Liquidity remains a key area of focus for the Group. Financial instruments used to fund operations and to manage liquidity comprise US Private Placement Loan Notes, Euro fixed-rate bearer notes, a Schuldschein loan, a revolving credit facility ('RCF'), leases and overdrafts.
Liquidity30 June 2021
£m31 December 2020
£m
RCF 452.0 452.0
Backstop liquidity facilities — 150.0
Less: drawing on RCF — —
Undrawn committed facilities 452.0 602.0
Net cash, cash equivalents and overdrafts 297.7 141.1
Less: restricted cash1 (56.0) (34.5)
Liquidity 693.7 708.6
The Group’s RCF provides flexible liquidity available to fund operations and was undrawn both at 30 June 2021 and at 31 December 2020.
The Group's £452m RCF expires on 31 August 2022 and in June 2021 the Group entered into a new RCF for £300m covering the period from 31 August 2022 to 31 August 2023, with a further year extension to 31 August 2024 in the event the Group receives new financing in excess of £250m arising from the issuance of debt and/or equity prior to 31 December 2021. The two facilities incorporate mandatory cancellation provisions such that they will be partially reduced from a starting value of £452m by the following adjustments:
• 50% of net proceeds received from new financing (subject to net proceeds exceeding £250m);
• 35% of aggregate net disposal proceeds received between 21 June 2021 and 31 December 2021 (where aggregate net proceeds received from disposals since 21 June 2021 exceed £150m); and
• 25% of aggregate net disposal proceeds received after 1 January 2022 (where aggregate net disposal proceeds received since 21 June 2021 exceed £150m).
The mandatory cancellation provisions are subject to a minimum remaining facility size of £225m where the cancellation arises from the receipt of new financing, or receipt of new financing as well as disposals, and a minimum remaining facility size of £300m up until 31 August 2022, and £225m thereafter, where the cancellation arises from disposals only. Subsequent to 30 June 2021, the Group has received proceeds from the disposal of AXELOS Limited of £182.2m and £45m of further consideration arising from the sale of the ESS business. In accordance with the mandatory cancellation provisions, the RCF has reduced by £66m to £386m. The new RCF did not reduce from its value of £300m as cancellations are applied to a start point of £452m, and these two transactions do not reduce the facility below its £300m initial value.
Capita plc
14

The Group secured a committed backstop liquidity facility in February 2020. This reduced to £93.5m on 30 June 2020 with the disposal of the Eclipse business. It was then supplemented by a second backstop liquidity facility, bringing the combined value of the two facilities back to £150.0m. Both backstop liquidity facilities terminated on 1 February 2021 with the receipt of proceeds from the disposal of the ESS business.
As part of the Group’s mitigation of the impact of Covid-19, in June 2020 a non-recourse invoice discounting facility was executed. The value of invoices sold under the facility at 30 June 2021 was £6.4m (30 June 2020: £32.8m; 31 December 2021: £13.6m).
At 30 June 2021, the Group had £297.7m of cash and cash equivalents net of overdrafts, and £744.6m of private placement loan notes, fixed-rate bearer notes, and Schuldschein loan. These debt instruments mature over the period to 2027, with repayment of £209.9m and £223.3m, in the second half of 2021 and in 2022 respectively. The 2021 and 2022 maturities are expected to be funded through the Group’s existing facilities, cash and cash equivalents and from the proceeds of the Group’s ongoing portfolio divestment programme without the need to obtain new financing. As such, a measured approach will be taken to any potential refinancing with time taken to implement a longer-term debt solution at the appropriate moment.
Going concern
In assessing the appropriateness of adopting the going concern basis in preparing the condensed consolidated financial statements for the period ended 30 June 2021, the Board has undertaken a rigorous assessment of the financial forecasts, key uncertainties and sensitivities, as outlined in note 2 to the financial statements. In carrying out that assessment, the Board has recognised that, in a severe but plausible downside scenario, the mitigants to the possibility of insufficient liquidity will require third party agreements and approvals which represent events that are outside the direct control of the Company. Accordingly, there remain material uncertainties, as defined in auditing and accounting standards, related to events or conditions that may cast significant doubt on the Group’s ability to continue as a going concern. Nevertheless, reflecting the Board’s confidence in the benefits expected from completion of the transformation programme and execution of the approved disposal programme coupled with the potential to obtain further financing beyond its existing committed funding facilities, the Group continues to adopt the going concern basis in preparing these condensed consolidated financial statements.
Pensions
The 31 March 2020 triennial valuation of the Capita Pension and Life Assurance Scheme ('the Scheme') was concluded in the period and identified a deficit for funding purposes of £182.2m which is expected to be recovered through deficit recovery contributions of £14m in the second half of 2021, £30m in each of the years ending 31 December 2022 and 2023, in addition to the contributions totalling £50m already paid by the Group by 30 June 2021. As part of the triennial valuation, the Group also agreed to pay an additional £15m a year between 2024 and 2026 in order to enable the Scheme to target a lower-risk investment strategy facilitating lower reliance on the covenant provided by the Group.
In addition to the above, £35.4m of deficit contributions in respect of the previous funding agreement, plus a special contribution of £50.2m to buyback the intellectual property rights as part of the ESS disposal, were paid to the Scheme in the first half of 2021.
Balance sheet
Consolidated net assets were £321.1m at 30 June 2021 (31 December 2020: net liabilities £81.1m).
The movement from net liabilities to net assets is predominantly driven by the by the expiry of the put option to acquire the non-controlling interest in AXELOS Limited, the Group's joint venture with the UK Government, and the receipt of proceeds from the disposal of ESS.
__________________________________________1 Refer to alternative performance measures in the appendix2 Sustainable free cash flow = reported free cash flow excluding the impact of disposals
Capita plc
15

Forward looking statementsThis half year results statement is prepared for and addressed only to the Company's shareholders as a whole and to no other person. The Company, its Directors, employees, agents and advisers accept and assume no liability to any person in respect of this trading update save as would arise under English law. Statements contained in this trading update are based on the knowledge and information available to Capita’s Directors at the date it was prepared and therefore facts stated and views expressed may change after that date.
This document and any materials distributed in connection with it may include forward-looking statements, beliefs, opinions or statements concerning risks and uncertainties, including statements with respect to Capita’s business, financial condition and results of operations. Those statements and statements which contain the words "anticipate", "believe", "intend", "estimate", "expect" and words of similar meaning, reflect Capita’s Directors' beliefs and expectations and involve risk and uncertainty because they relate to events and depend on circumstances that will occur in the future and which may cause results and developments to differ materially from those expressed or implied by those statements and forecasts.
No representation is made that any of those statements or forecasts will come to pass or that any forecast results will be achieved. You are cautioned not to place any reliance on such statements or forecasts. Those forward-looking and other statements speak only as at the date of this trading update. Capita undertakes no obligation to release any update of, or revisions to, any forward-looking statements, opinions (which are subject to change without notice) or any other information or statement contained in this trading update. Furthermore, past performance cannot be relied on as a guide to future performance.
No statement in this document is intended as a profit forecast or a profit estimate and no statement in this document should be interpreted to mean that earnings per Capita share for the current or future financial years would necessarily match or exceed the historical published earnings per Capita share.
Nothing in this document is intended to constitute an invitation or inducement to engage in investment activity. This document does not constitute or form part of any offer for sale or subscription of, or any solicitation of any offer to purchase or subscribe for, any securities nor shall it or any part of it nor the fact of its distribution form the basis of, or be relied on in connection with, any contract, commitment or investment decision in relation thereto. This document does not constitute a recommendation regarding any securities.
Capita plc
16

Principal risks and uncertaintiesThe principal risks and uncertainties faced by the Group and its approach to internal control and risk management are set out on pages 50 to 57 of the 2020 Annual Report which is available on the Group’s website at www.capita.com.
The principal risks and uncertainties, as set out below, have been reassessed and the Directors expect them to remain materially the same as those reported in the 2020 Annual Report during the remaining six months of the financial year.
Living our purpose Failure to live our purpose and failure to change stakeholder perception so we are seen to live our purpose
Strategy Failure to define and resource the right medium-term strategy
Innovation Failure to innovate and develop new value propositions for clients and customers to drive sustainable growth
People attraction & retention Failure to attract, develop, engage and retain the right people for current and future client propositions
Culture Failure to change the culture and practices of Capita in line with our responsible business agenda
Data protection Failure to protect data, information and IT systems
Contracts Failure to secure contracts with an acceptable risk and reward balance and that are aligned to Capita’s agreed purpose, values and responsible business strategy
Delighting clients Failure to delight clients and customers with software performance or projects and service delivery
Internal control Failure to maintain an adequate risk-based system of internal control
Political climate Failure to plan for, influence and respond to potential changes in the political climate
Financial stability Failure to maintain financial stability, viability and achieve financial targets / results
Risk title Risk description
Statement of Directors’ responsibilitiesThe Directors confirm, to the best of their knowledge, that this condensed set of financial statements has been prepared in accordance with IAS 34 as adopted for use in the UK and that the Half Year Management Report includes a fair review of the information required by Rules 4.2.7 and 4.2.8 of the Disclosure Guidance and Transparency Rules of the United Kingdom Financial Conduct Authority.
The names and functions of the Directors of Capita plc are listed on the Group website, www.capita.com/about-us/about-the-board.
By order of the Board
J Lewis T Weller
Chief Executive Officer Chief Financial Officer
5 August 2021 5 August 2021
Capita plc
17
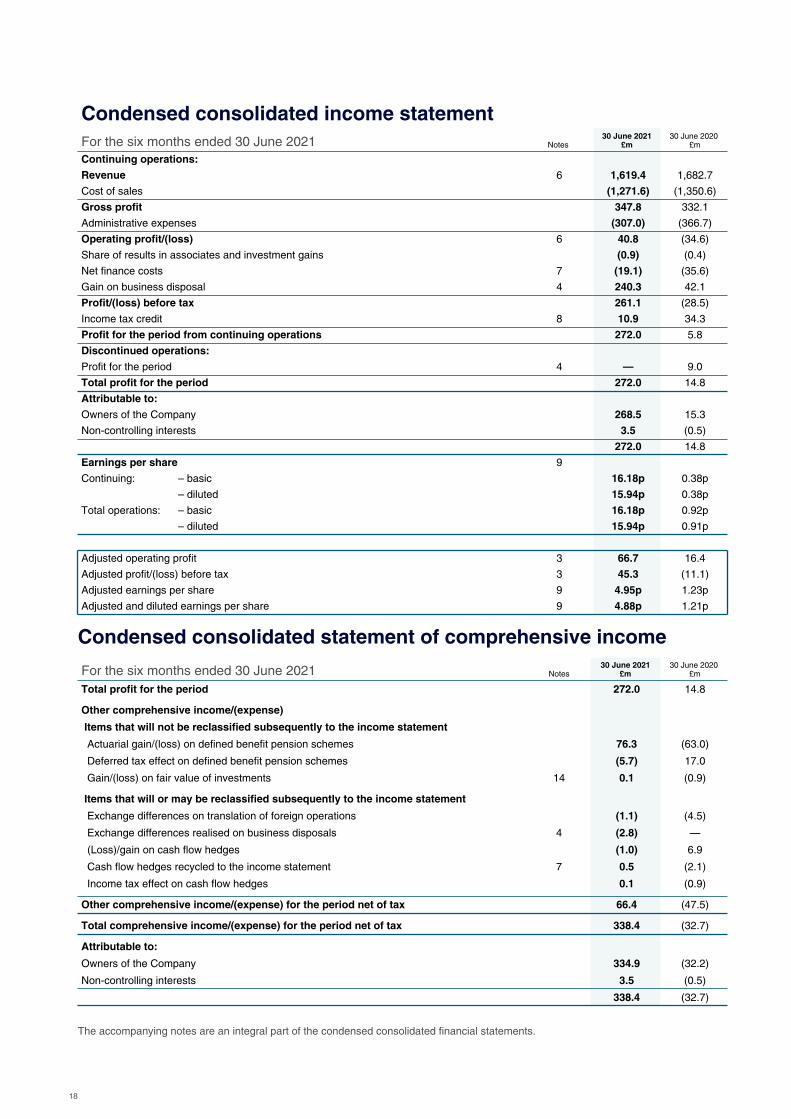
Condensed consolidated income statementFor the six months ended 30 June 2021 Notes
30 June 2021 £m
30 June 2020 £m
Continuing operations:
Revenue 6 1,619.4 1,682.7
Cost of sales (1,271.6) (1,350.6)
Gross profit 347.8 332.1
Administrative expenses (307.0) (366.7)
Operating profit/(loss) 6 40.8 (34.6)
Share of results in associates and investment gains (0.9) (0.4)
Net finance costs 7 (19.1) (35.6)
Gain on business disposal 4 240.3 42.1
Profit/(loss) before tax 261.1 (28.5)
Income tax credit 8 10.9 34.3
Profit for the period from continuing operations 272.0 5.8
Discontinued operations:
Profit for the period 4 — 9.0
Total profit for the period 272.0 14.8
Attributable to:
Owners of the Company 268.5 15.3
Non-controlling interests 3.5 (0.5)
272.0 14.8
Earnings per share 9
Continuing: – basic 16.18p 0.38p
– diluted 15.94p 0.38p
Total operations: – basic 16.18p 0.92p
– diluted 15.94p 0.91p
Adjusted operating profit 3 66.7 16.4
Adjusted profit/(loss) before tax 3 45.3 (11.1)
Adjusted earnings per share 9 4.95p 1.23p
Adjusted and diluted earnings per share 9 4.88p 1.21p
Condensed consolidated statement of comprehensive income
For the six months ended 30 June 2021 Notes30 June 2021
£m30 June 2020
£m
Total profit for the period 272.0 14.8
Other comprehensive income/(expense)
Items that will not be reclassified subsequently to the income statement
Actuarial gain/(loss) on defined benefit pension schemes 76.3 (63.0)
Deferred tax effect on defined benefit pension schemes (5.7) 17.0
Gain/(loss) on fair value of investments 14 0.1 (0.9)
Items that will or may be reclassified subsequently to the income statement
Exchange differences on translation of foreign operations (1.1) (4.5)
Exchange differences realised on business disposals 4 (2.8) —
(Loss)/gain on cash flow hedges (1.0) 6.9
Cash flow hedges recycled to the income statement 7 0.5 (2.1)
Income tax effect on cash flow hedges 0.1 (0.9)
Other comprehensive income/(expense) for the period net of tax 66.4 (47.5)
Total comprehensive income/(expense) for the period net of tax 338.4 (32.7)
Attributable to:
Owners of the Company 334.9 (32.2)
Non-controlling interests 3.5 (0.5)
338.4 (32.7)
The accompanying notes are an integral part of the condensed consolidated financial statements.
18

Condensed consolidated balance sheet
At 30 June 2021
Notes30 June 2021
£m 31 December 2020
£m
Non-current assets
Property, plant and equipment 140.9 157.2
Intangible assets 225.9 265.0
Goodwill 1,053.6 1,120.5
Right-of-use assets 314.4 342.1
Investments in associates and joint ventures 4.3 5.1
Contract fulfilment assets 11 317.1 294.8
Financial assets 14 106.8 117.0
Deferred tax assets 259.1 242.8
Trade and other receivables 20.1 22.1
2,442.2 2,566.6
Current assets
Financial assets 14 35.0 32.1
Disposal group assets held-for-sale 4 101.2 114.6
Trade and other receivables 684.5 551.0
Cash 14 546.0 460.9
Income tax receivable 3.8 2.9
1,370.5 1,161.5
Total assets 3,812.7 3,728.1
Current liabilities
Trade and other payables 722.1 635.0
Deferred income 854.9 822.2
Overdrafts 14 258.4 332.7
Lease liabilities 14 64.6 77.5
Disposal group liabilities held-for-sale 4 62.6 53.9
Financial liabilities 14 315.6 347.8
Provisions 12 88.6 107.0
2,366.8 2,376.1
Non-current liabilities
Trade and other payables 24.7 23.6
Deferred income 147.7 153.0
Lease liabilities 14 402.0 426.0
Financial liabilities 14 446.2 554.3
Deferred tax liabilities 6.7 6.7
Provisions 12 15.2 17.4
Employee benefits 82.3 252.1
1,124.8 1,433.1
Total liabilities 3,491.6 3,809.2
Net assets/(liabilities) 321.1 (81.1)
Capital and reserves
Share capital 15 34.8 34.5
Share premium 15 1,145.5 1,143.3
Employee benefit trust and treasury shares 15 (9.1) (11.2)
Capital redemption reserve 1.8 1.8
Other reserves (17.7) (13.4)
Retained deficit (854.4) (1,289.5)
Equity/(deficit) attributable to owners of the Company 300.9 (134.5)
Non-controlling interests 20.2 53.4
Total equity/(deficit) 321.1 (81.1)
The accompanying notes are an integral part of the condensed consolidated financial statements.
19

Condensed consolidated statement of changes in equityFor the six months ended 30 June 2021
Share capital
£m
Share premium
£m
Employee benefit
trust and treasury shares
£m
Capital redemption
reserve£m
Retained deficit
£m
Other reserves
£m
Total attributable
to the owners of the parent
£m
Non controlling interests
£m
Total equity/ (deficit)
£m
At 1 January 2020 34.5 1,143.3 (11.2) 1.8 (1,295.8) 0.6 (126.8) 62.8 (64.0)
Profit/(loss) for the period — — — — 15.3 — 15.3 (0.5) 14.8
Other comprehensive expense — — — — (46.9) (0.6) (47.5) — (47.5)
Total comprehensive expense for the period — — — — (31.6) (0.6) (32.2) (0.5) (32.7)
Share based payment net of deferred tax effect — — — — 3.7 — 3.7 — 3.7
Dividends1 — — — — — — — (10.6) (10.6)
Movement in put-options held by non-controlling interests — — — — 16.5 — 16.5 — 16.5
At 30 June 2020 34.5 1,143.3 (11.2) 1.8 (1,307.2) — (138.8) 51.7 (87.1)
At 1 January 2021 34.5 1,143.3 (11.2) 1.8 (1,289.5) (13.4) (134.5) 53.4 (81.1)
Profit for the period — — — — 268.5 — 268.5 3.5 272.0
Other comprehensive income/(expense) — — — — 70.7 (4.3) 66.4 — 66.4
Total comprehensive income/(expense) for the period — — — — 339.2 (4.3) 334.9 3.5 338.4
Share based payment net of deferred tax effect — — — — 1.8 — 1.8 — 1.8
Exercise of share options under employee long term incentive plans (note 15) — — 2.4 — (2.4) — — — —
Shares issued (note 15) 0.3 — (0.3) — — — — — —
VAT refund on rights issue issuance costs (note 15) — 2.2 — — — — 2.2 — 2.2
Dividends1 — — — — — — — (36.7) (36.7)
Movement in put-options held by non-controlling interests2 — — — — 96.5 — 96.5 — 96.5
At 30 June 2021 34.8 1,145.5 (9.1) 1.8 (854.4) (17.7) 300.9 20.2 321.1
1. Dividends: £36.7m, of which £10.7m was paid in the period, (30 June 2020: paid £10.6m) relate to dividends to non-controlling interests.
2. The option to acquire the non-controlling interest in AXELOS Limited expired without being exercised on 28 February 2021, and the related liability of £96.5m was de-recognised. See note 14 for further details.
Share capital – The balance classified as share capital is the nominal proceeds on issue of the Company’s equity share capital, comprising 2 1/15p ordinary shares.
Share premium – The amount paid to the Company by shareholders, in cash or other consideration, over and above the nominal value of shares issued to them less issuance costs.
Employee benefit trust and treasury shares – Shares that have been bought back by the Company which are available for retirement or resale; shares held in the employee benefit trust have no voting rights and do not have an entitlement to dividends.
Capital redemption reserve – The Company can redeem shares by repaying the market value to the shareholder, whereupon the shares are cancelled. Redemption must be from distributable profits. The Capital redemption reserve represents the nominal value of the shares redeemed.
Retained deficit – Net (losses)/profits accumulated in the Group after dividends are paid.
Other reserves – This consists of foreign currency translation reserve deficit of £12.5m (31 December 2020: £8.6m) and cash flow hedging reserve deficit of £5.2m (31 December 2020: £4.8m).
Non-controlling interests (NCI) – This represents equity in subsidiaries that is not attributable directly or indirectly to the Parent Company.
The accompanying notes are an integral part of the condensed consolidated financial statements.
20

Condensed consolidated cash flow statement
For the six months ended 30 June 2021
Notes30 June 2021
£m30 June 2020
£m
Cash (used)/generated by operations 13 (22.5) 355.7Cash generated from discontinued operations — 9.0Income tax paid (7.0) (4.6)Net interest paid (18.2) (24.1)Net cash (outflow)/inflow from operating activities (47.7) 336.0Cash flows from investing activitiesPurchase of property, plant and equipment (11.0) (20.9)Purchase of intangible assets (13.1) (28.4)Proceeds from sale of property, plant and equipment / intangible assets 0.2 —Additions to investments in associates — (0.6)Contingent consideration paid — (4.9)Subsidiary partnership payment 14 (4.7) (4.7)Capital element of lease rental receipts 1.5 —Net proceeds on disposal of subsidiary undertakings 4 306.0 48.3Cash disposed of with subsidiary undertakings 4 (17.7) (3.2)Net cash inflow/(outflow) from investing activities 261.2 (14.4)Cash flows from financing activitiesDividends paid to non-controlling interest (10.7) (10.6)Capital element of lease rental payments (47.3) (61.4)VAT refund on rights issue issuance costs 15 2.2 —Repayment of loan notes and other debt (0.5) (162.7)Proceeds from revolving credit facility — 170.0Financing arrangement costs (1.5) —Net cash outflow from financing activities (57.8) (64.7)Increase in cash and cash equivalents 155.7 256.9Cash and cash equivalents at the beginning of the period 141.1 119.3Movement in exchange rates 0.9 (6.0)Cash and cash equivalents at 30 June 297.7 370.2Cash and cash equivalents comprise:Cash 546.0 756.2Overdrafts (258.4) (396.6)Cash, net of overdrafts, included in disposal group assets and liabilities held-for-sale 10.1 10.6Total 297.7 370.2
Adjusted cash generated from operations 13 176.2 189.8Adjusted free cash flows 13 130.7 116.4
The accompanying notes are an integral part of the condensed consolidated financial statements.
21

Notes to the condensed consolidated financial statementsFor the six months ended 30 June 2021
1 Corporate informationCapita plc (the 'Company' or the 'Parent Company') is a public limited liability company incorporated in England and Wales whose shares are publicly traded.
The condensed consolidated financial statements of the Company and its subsidiaries (the 'Group’) for the six months ended 30 June 2021 were authorised for issue in accordance with a resolution of the Directors on 5 August 2021.
2 Basis of preparation, judgements and estimates, and going concern(a) Basis of preparationThese condensed consolidated financial statements have been prepared in accordance with IAS 34 Interim Financial Reporting as adopted for use in the UK and the Disclosure and Transparency Rules of the UK's Financial Conduct Authority.
These condensed consolidated financial statements do not comprise statutory accounts within the meaning of Section 434 of the Companies Act 2006. These condensed consolidated financial statements for the six months ended 30 June 2021 have been reviewed by the Group's auditors pursuant to the Auditing Practices Board guidance on Review of Interim Financial Information.
The annual consolidated financial statements of the group for the year ended 31 December 2021 will be prepared in accordance with UK-adopted international accounting standards. These condensed consolidated financial statements have been prepared by applying the accounting policies and presentation that were applied in the preparation of the company’s published consolidated financial statements for the year ended 31 December 2020. These condensed consolidated financial statements were prepared in accordance with International Financial Reporting Standards (IFRSs) adopted pursuant to Regulation (EC) No 1606/2002 as it applies in the European Union and in accordance with international accounting standards in conformity with the requirements of the Companies Act 2006, except for the Interest Rate Benchmark reform - Phase 2 that came into effect from 1 January 2021 and had no material impact on these condensed consolidated financial statements.
(b) Adjusted resultsIAS 1 permits an entity to present additional information for specific items to enable users to better assess the entity’s financial performance.
The Board has adopted a policy to separately disclose those items that it considers are outside the underlying operating results for the particular period under review and against which the Group’s performance is assessed. In the Directors’ judgement, these need to be disclosed separately by virtue of their nature, size and/or incidence for users of the financial statements to obtain a proper understanding of the financial information and the underlying in-period performance of the business. Those items which relate to the ordinary course of the Group’s operating activities remain within adjusted profit and adjusted cash flow.
A reconciliation between reported and adjusted operating profit and profit before tax is provided in note 3, and between reported and adjusted free cash flow and cash generated from operations is provided in note 13.
(c) Judgements and estimatesThese condensed consolidated financial statements have been prepared in accordance with generally accepted accounting principles which require the Directors to make judgements and assumptions that affect the reported amounts of assets and liabilities and disclosure of contingencies at the date of the financial statements and the reported income and expense during the presented periods. Although these judgements and assumptions are based on the Directors’ best knowledge of the amounts, events or actions, actual results may differ.
The impact of Covid-19 on the Group has been considered in the preparation of these condensed consolidated financial statements, including management’s evaluation of critical accounting estimates and judgements. The impact on the Group has varied by business.
Covid-19 has introduced unprecedented economic uncertainties and has led to increased judgement particularly in forecasting future financial performance. There have also been direct impacts on revenue and costs arising from: new contracts helping customers respond to the pandemic; costs of setting up colleagues to work remotely; and utilisation of the Government’s furlough scheme. The Board has not reported these items separately.
The Board has considered the impact on the provisions recorded at 30 June 2021, with no significant adjustments recorded, and the valuation of the defined benefit pension scheme.
As described in note 5, given the level of judgement and estimation involved in assessing the future profitability of contracts, it is reasonably possible that outcomes within the next financial year may be different from management’s assumptions and could require a material adjustment to the carrying amounts of contract assets and onerous contract provisions. This risk is increased further by the uncertainty Covid-19 brings to forecasting.
(d) Going concernIn determining the appropriate basis of preparation of the condensed consolidated financial statements for the six month period ended 30 June 2021, the Board is required to consider whether the Group can continue in operational existence for the foreseeable future. The Board has concluded that it is appropriate to adopt the going concern basis, having undertaken a rigorous assessment of the financial forecasts, key uncertainties and sensitivities, as set out below.
Accounting standards specify that the foreseeable future for going concern assessment covers a period of at least 12 months from the date of approval of these condensed consolidated financial statements, although those standards do not specify how far beyond 12 months a Board should consider. In its going concern assessment, the Board has considered the period from the date of approval of these condensed consolidated financial statements to 31 December 2022 ('the going concern period'), in recognition of the fact that there are scheduled debt repayments totalling £433m over that period, including £156m scheduled in November 2022.
The base case financial forecasts used in the going concern assessment are derived from financial projections for 2021-2023 as approved by the Board in July 2021.
The going concern assessment considers the Group’s existing debt facilities, committed funding and liquidity positions and covenant compliance throughout the period under review. The value of the Group’s existing committed revolving credit facility (RCF) was £452.0m at 30 June 2021 and it expires on 31 August 2022. In June 2021 the Group entered into a second RCF of £300m covering the period from 31 August 2022 to 31 August 2023 with certain lenders party to the existing RCF.
22

The two RCFs incorporate provisions such that they will partially reduce in quantum as a consequence of specified transactions. Subsequent to 30 June 2021, the existing RCF has reduced by £66m to £386m as at the date of approval of these condensed consolidated financial statements, following receipt of the disposal proceeds from AXELOS Limited of £182.2m and £45m of further consideration arising from the sale of the ESS business. These two transactions are not of sufficient size to require a reduction in the second RCF.
Financial position at 30 June 2021
The Group had net debt of £894.4m at 30 June 2021 (30 June 2020 £1,096.6m; 31 December 2020 £1,077.1m) and liquidity of £693.7m as detailed further in the Financial review.
The Group’s committed RCFs and private placement notes are subject to financial covenants including a maximum ratio of adjusted net debt to adjusted EBITDA and a minimum ratio of adjusted EBITA to borrowing costs. The Group’s covenanted maximum adjusted net debt to adjusted EBITDA ratio is 3.0 to 3.5 times depending on the debt instrument in question and minimum adjusted EBITA to borrowing costs is 4.0 times in all debt instruments. Compliance with these covenants is tested semi-annually.
The components of the adjusted net debt to adjusted EBITDA and adjusted EBITA to borrowing costs ratios are set out in the alternative performance measures in the appendix.
The Group’s adjusted net debt to adjusted EBITDA at 30 June 2021 was 1.5 times for the US Private Placement Loan Notes ratio and 2.1 times for other financing agreements. The Group’s adjusted EBITA to borrowing costs at 30 June 2021 was 12.1 times for the US Private Placement Loan Notes ratio and 12.0 times for other financing agreements. The Group is therefore in compliance with the relevant ratios.
Board assessment
Base case scenarioUnder the base case scenario, completion of the Group’s transformation programme is expected to simplify and strengthen the business and facilitate further efficiency savings enabling sustainable growth in revenue, profit and cash flow over the medium term.
As previously announced, the Board’s plan is to establish an optimal capital structure to support the execution of the Group’s strategy and to dispose of businesses that that do not align with that strategy. The disposal programme requires agreement from third parties, and major disposals may be subject to shareholder and lender approval. Such agreements and approvals, and also any refinancing, are outside the direct control of the Company and as such, the inclusion of the effect of any potential future disposals or uncommitted financing in the Group’s projections is inappropriate for going concern assessment purposes in accordance with IAS 1 Presentation of Financial Statements.
The base case projections used for going concern assessment purposes reflect business disposals completed up to the date of approval of these condensed consolidated financial statements (including the £182.2m disposal of AXELOS Limited and the additional £45m proceeds in respect of the ESS disposal received in July 2021), but do not reflect the benefit of any further disposals that are in the pipeline. In addition, the liquidity headroom assessment in the base case projections reflects only the Group’s existing committed financing facilities and debt redemptions and does not reflect any potential future refinancing.
The base case financial forecasts demonstrate liquidity headroom and compliance with all covenant measures throughout the period to 31 December 2022.
Severe but plausible downsideIn considering severe but plausible downside scenarios, the Board has taken account of trading downside risks, which assume the Group is not successful in delivering the anticipated levels of revenue, profit and cash flow growth from the transformation programme. The downside scenario used for the going concern assessment also includes potential adverse financial impacts from a continuation of the impact of Covid-19, unforeseen operational issues leading to contract losses and cash outflows and unexpected potential fines and losses linked to incidents such as data breaches and/or cyber-attacks.
Absent any mitigating actions, liquidity headroom shown in the Group’s financial forecasts under this severe but plausible downside scenario over the period to 31 December 2022 reduces substantially such that there is a risk of liquidity being insufficient.
There are mitigations, under the direct control of the Group, that could be implemented to address any immediate shortfalls. These include reductions in variable pay rises, setting aside any bonus payments and limiting discretionary spend. While these are available as possible short-term mitigations and would be actioned if required to ensure sufficient liquidity, the Board is mindful that such restrictions may be detrimental to the longer-term success of the Group. In addition, such actions would not necessarily address potential liquidity requirements beyond the going concern period should all the downside risks materialise.
Accordingly, the principal mitigation to the possibility of insufficient liquidity is that the Board has approved a disposal programme which covers businesses that do not align with the longer-term strategy. The Group has a strong track record of executing major planned disposals. Examples include the disposal of the Asset Services business in 2017 (net cash proceeds of c.£865m) and ParkingEye and Constructionline in 2018 (c.£390m). More recently the Group generated net cash proceeds of c.£50m from the disposal of Eclipse Legal Services in June 2020, c.£300m from the disposal of the ESS business agreed in February 2021, with a further £45m deferred cash proceeds received in July 2021. In March 2021, the Group announced its target of realising future gross proceeds of £700m from the ongoing disposal programme. With around 75% of this target having been achieved through the ESS and AXELOS disposals, the Board is confident that the disposal programme will be delivered, thereby introducing substantial net cash proceeds to the Group, albeit with a corresponding removal of consolidated profits and cash flows associated with the disposal businesses.
In addition to the ongoing disposal programme, the Group may seek to mitigate the liquidity risks which might arise in the downside scenario by seeking further sources of financing beyond its existing committed funding facilities. Notwithstanding the extension of RCF availability from August 2022 to August 2023 agreed in June 2021 coupled with the ongoing successful delivery of the disposal programme, the Board continues to assess the potential for such a refinancing.
Material uncertaintiesThe Board recognises that the disposal programme requires agreement from third parties, that major disposals may be subject to shareholder and, potentially, lender approval. Such agreements and approvals, and also any refinancing, are outside the direct control of the Company. Therefore, given that certain of the mitigating actions which might be taken to strengthen the Group's liquidity position in the severe but plausible downside scenario are outside the control of the group, this gives rise to material uncertainties, as defined in accounting standards, relating to events and circumstances which may cast significant doubt about the Group’s ability to continue as a going concern and to realise its assets and discharge its liabilities in the normal course of business.
Adoption of going concern basisReflecting the Board’s confidence in the benefits expected from completion of the transformation programme and execution of the approved disposal programme coupled with the potential to obtain further financing beyond its existing committed funding facilities, the Group continues to adopt the going concern basis in preparing these condensed consolidated financial statements. The Board has concluded that the Group will continue to have adequate financial resources to realise its assets and discharge its liabilities as they fall due over the period to 31 December 2022. Consequently, these condensed consolidated financial statements do not include any adjustments that would be required if the going concern basis of preparation were to be inappropriate.
23

3 Adjusted operating profit and adjusted profit before taxThe items below are excluded from the adjusted results because the Board has concluded that it is appropriate to do so. These amounts are (or have been) material and require separate disclosure for users of the financial statements to obtain a proper understanding of the financial information and the underlying performance of the business. These items are discussed further below:
Operating profit/(loss) Profit/(loss) before tax
Notes30 June 2021
£m30 June 2020
£m30 June 2021
£m30 June 2020
£m
Reported 40.8 (34.6) 261.1 (28.5)Amortisation and impairment of acquired intangibles 8.7 17.1 8.7 17.1Litigation and claims (8.9) 3.8 (8.9) 3.8Net finance costs 7 — — (1.8) 8.0Contingent consideration movements — (0.1) — (0.1)Business exits 4 (3.9) (16.8) (243.8) (58.4)On hold disposal costs — 7.0 — 7.0Significant restructuring 30.0 40.0 30.0 40.0Adjusted 66.7 16.4 45.3 (11.1)
1. Adjusted operating profit of £66.7m (30 June 2020: £16.4m) was generated on adjusted revenue of £1,584.7m (30 June 2020: £1,582.1m) resulting in an adjusted operating profit margin of 4.2% (30 June 2020: 1.0%).
2. The tax impact of the operating profit adjusting items is a £2.5m credit (30 June 2020: £5.1m credit). The tax impact of the profit before tax adjusting items is a £25.7m charge (30 June 2020: £6.7m credit).
Amortisation and impairment of acquired intangible assets: the Group recognised total acquired intangible asset amortisation of £11.8m (30 June 2020: £18.6m) of which £3.1m (30 June 2020: £3.1m) has been classified within 'Business exit - non-trading expenses'; and, impairment of £nil (30 June 2020: £1.6m).
Litigation and claims: the Group received an insurance settlement of £5.0m in respect of an historical legal claim that was settled in the period. The legal claim, which was fully provided at 31 December 2020, was excluded from adjusted results when provided due to its historical nature and size, and accordingly the insurance receipt has also been excluded from adjusted results. Further, the Group has recognised a gain of £3.9m from net movements in historical provisions that were excluded from adjusted results when provided.
Net finance costs: net finance costs excluded from adjusted profits includes movements in the mark-to-market valuation of certain financial instruments.
Business exits: the trading result of businesses exited, or in the process of being exited, and the gain or loss on disposals, are excluded from the Group's adjusted results. Individual businesses within the Portfolio Division under the new Future Capita corporate structure be treated as held-for-sale (and therefore as a business exit) where the disposal is seen to be highly probable, and expected to complete within the following 12 months. Refer to note 4 for further details.
On hold disposal costs: the costs incurred in respect of business exit activities where the anticipated disposal was primarily put on hold due to the impact the Covid-19 pandemic had on the underlying businesses, were excluded from the Group's adjusted results but disclosed separately from other business exits given their materiality. These costs include professional fees in respect of legal and financial due diligence, and separation planning costs.
Significant restructuring: in January 2018, the Group announced a multi-year transformation programme. For the six months ended 30 June 2021, a charge of £30.0m (30 June 2020: £40.0m) was recognised in relation to the cost of the transformation programme. The costs include the following:
• Cost to realise savings and efficiencies from the transformation £22.6m (30 June 2020: £25.7m): including significant reductions in overheads, the elimination of duplicate roles and management layers, and the Group's operational excellence programme which will improve the consistency of the Group's operations, reduce spans and layers, increasing the use of off-shoring and automation, adopting lean methodologies and working smarter. These costs also include rationalisation and increased utilisation of the Group’s property estate in metro centres and regionally. As the Group continues to rationalise its property estate, costs associated with onerous property commitments and dilapidation liabilities, and impairment of property right-of-use assets, will be captured and presented as part of the transformation adjustments.
• Professional fees £4.7m (30 June 2020: £1.5m): including fees paid to consultants in relation to the development and delivery of the Future Capita reorganisation.
• Transformation of central Group functions £2.7m (30 June 2020: £10.3m): investment in programmes to improve the Group’s central functions, including: finance; sales; human resources; and information technology. All costs associated with these programmes are recorded separately, excluding any costs capitalised as part of the investment and the ongoing depreciation and amortisation of such assets.
• Costs of accelerating savings to mitigate the financial impact of Covid-19 £nil (30 June 2020: £2.5m): these were incremental to those planned to be incurred as part of the transformation programme in 2020.
24

4 Business exits, assets held-for-sale and discontinued operationsBusiness exits are businesses that have been disposed of, exited during the period, or are in the process of being disposed of or exited. None of these business exits meet the definition of ‘discontinued operations’ as stipulated by IFRS 5, which requires disclosure and comparatives to be restated where the relative size of a disposal or business closure is significant, which is normally understood to mean a reported segment.
However, the trading result of these businesses, non-trading expenses, and any gain/loss on disposal, have been excluded from adjusted results. To enable a like-for-like comparison of adjusted results, the 30 June 2020 comparatives have been represented to exclude businesses classified as business exits from 1 July 2020 to 30 June 2021.
The Group classifies a non-current asset (or disposal group) as held-for-sale if its carrying amount will be recovered principally through a sale transaction rather than continued use. For this to be the case, the asset (or disposal group) must be available for immediate sale in its present condition subject only to terms that are usual and customary for sales of such assets (or disposal groups) and its sale must be highly probable. For the sale to be highly probable, the appropriate level of management must be committed to a plan to sell the asset (or disposal group), and an active programme to locate a buyer and complete the plan must have been initiated. Further, the asset (or disposal group) must be actively marketed for sale at a price that is reasonable in relation to its current fair value. In addition, the sale should be expected to qualify for recognition as a completed sale within one year from the date of classification.
Based on the above requirements, individual businesses within the Portfolio Division under the new Future Capita corporate structure will only reach the criteria to be treated as held-for-sale where the disposal is seen to be highly probable, and expected to complete within the following 12 months. As at 30 June 2021, only the disposal of the AXELOS joint venture is deemed to have met this threshold.
Business exits at 30 June 2021 comprised:
• the Education Software Solutions (ESS) business whose disposal was completed on 1 February 2021;
• the Life Insurance and Pensions Servicing business in Ireland whose disposal was completed on 1 March 2021;
• the AXELOS joint venture with the UK Government which was in the process of being sold and met the held-for-sale criteria. Accordingly AXELOS was treated as a disposal group held-for-sale at the reporting date. The sale of AXELOS completed in July 2021 - refer to note 20; and
• the exit costs, including professional fees, salary costs and separation planning costs, relating to further planned disposals for which the held-for-sale and business exit criteria were not met at 30 June 2021. Since these disposals did not meet the definition of business exits and assets held-for-sale at 30 June 2021, their trading results were included within adjusted results.
Non-trading disposal30 June
2021 Non-trading disposal30 June
2020
Income statement impact Trading£m
Cash£m
Non-cash£m
Total£m
Total£m
Trading£m
Cash£m
Non-cash£m
Total£m
Total£m
Revenue 34.7 — — — 34.7 100.6 — — — 100.6
Cost of sales (8.2) — — — (8.2) (40.7) — — — (40.7)
Gross profit 26.5 — — — 26.5 59.9 — — — 59.9
Administrative expenses (5.3) (7.2) (10.1) (17.3) (22.6) (20.0) (1.1) (22.0) (23.1) (43.1)
Operating profit/(loss) 21.2 (7.2) (10.1) (17.3) 3.9 39.9 (1.1) (22.0) (23.1) 16.8
Net finance costs — (0.4) — (0.4) (0.4) — (0.5) — (0.5) (0.5)
Gain on business disposal — 288.3 (48.0) 240.3 240.3 — 45.1 (3.0) 42.1 42.1
Profit/(loss) before tax 21.2 280.7 (58.1) 222.6 243.8 39.9 43.5 (25.0) 18.5 58.4
Income tax charge (3.8) (2.1) (25.2) (27.3) (31.1) (6.9) 0.1 2.5 2.6 (4.3)
Profit/(loss) after tax 17.4 278.6 (83.3) 195.3 212.7 33.0 43.6 (22.5) 21.1 54.1
Included within non-cash administrative expenses is £3.1m (30 June 2020: £3.1m) of amortisation of acquired intangibles and within cash net finance costs is £0.4m (30 June 2020: £0.5m) of net finance costs relating to AXELOS Limited. In line with the Group’s policy these costs were excluded from the Group’s adjusted results in both the current and prior period and have been reclassified to Business exits in line with AXELOS Limited being treated as held-for-sale.
Trading revenue and costs represent the current period trading performance of those businesses up to the point of being disposed or exited. Trading expenses primarily comprise payroll costs of £9.7m (30 June 2020: £37.3m) and information technology costs of £1.7m (30 June 2020: £16.5m).
Non-trading administrative costs comprise exit costs relating to business exits and further planned disposals of £14.5m (30 June 2020: £3.3m); goodwill impairment of £nil (30 June 2020: £2.8m); and, other asset amortisation and impairments of £3.1m (30 June 2020: £17.8m) offset by releases of provisions of £0.3m (30 June 2020: £0.8m).
25

2021 disposalsIn the six months ended 30 June 2021, the gain arising on the disposal of the ESS and the Irish Life Insurance and Pensions Servicing businesses of £240.3m comprises: the disposal of net assets of £62.7m for £308.8m consideration; less disposal costs of £8.6m; and realisation of the cumulative foreign currency translation reserve of £2.8m. The net cash proceeds of £291.1m comprised the cash purchase consideration of £308.8m less £17.7m of cash disposed of.
30 June 2021
Gain on business disposal Cash£m
Non-cash£m
Total£m
Intangible assets — 44.6 44.6
Goodwill — 45.3 45.3
Right-of-use assets — 4.2 4.2
Income tax receivable and deferred tax asset — 0.1 0.1
Contract fulfilment assets — 3.0 3.0
Trade and other receivables — 4.1 4.1
Accrued income — 0.7 0.7
Prepayments — 0.7 0.7
Cash and cash equivalents 17.7 — 17.7
Disposal group assets held-for-sale 17.7 102.7 120.4
Trade and other payables — (10.1) (10.1)
Accruals — (3.7) (3.7)
Lease liabilities — (4.3) (4.3)
Other taxes and social security — (0.3) (0.3)
Deferred income — (34.4) (34.4)
Income tax payable and deferred tax liability — (4.4) (4.4)
Provisions — (0.5) (0.5)
Disposal group liabilities held-for-sale — (57.7) (57.7)
Total net assets disposed of 17.7 45.0 62.7
Cash purchase consideration received 308.8 — 308.8
Costs of disposal – paid and accrued1 (2.8) (5.8) (8.6)
Proceeds, less costs, on disposal 306.0 (5.8) 300.2
Realisation of cumulative currency translation difference — 2.8 2.8
Gain on business disposal 288.3 (48.0) 240.3
1. Excludes £20.6m of costs recognised in relation to the disposal of ESS during the year ended 31 December 2020.
The ESS business was sold to Tiger UK Bidco Limited, a newly formed company established by funds advised by Montagu Private Equity (Montagu). Montagu agreed to invest in ParentPay (Holdings) Limited (ParentPay), a provider of education technology. Following successful completion of both investments, ESS will become part of ParentPay Group. Montagu’s agreed investment in ParentPay was subject to regulatory approval which was obtained in July 2021. As a result additional cash proceeds of £45m, which were contingent on this regulatory approval, were received by Capita. In assessing the fair value of the consideration at 30 June 2021, the Board concluded that as the regulatory approval was not concluded and was outside the control of a willing buyer, it should be excluded. No asset was therefore recorded at 30 June 2021.
26

Disposal group assets and liabilities held-for-saleDisposal group assets and liabilities held-for-sale as at 30 June 2021 represent the assets and liabilities of AXELOS Limited. Comparative information as at 31 December 2020 comprises the ESS and the Irish Life Insurance and Pensions Servicing businesses, whose disposals were completed during the first half of 2021.
30 June 2021£m
31 December 2020£m
Property, plant and equipment 0.2 0.1
Intangibles 20.4 44.4
Goodwill 65.8 45.3
Right-of-use assets — 4.5
Income tax receivable and deferred tax asset — 0.1
Contract fulfilment assets 0.2 3.1
Trade and other receivables 4.4 2.9
Accrued income — 0.6
Prepayments 0.1 0.7
Cash and cash equivalents 10.1 12.9
Disposal group assets held-for-sale 101.2 114.6
Trade and other payables 0.5 1.5
Accruals 5.2 3.5
Lease liabilities — 4.6
Other taxes and social security 0.1 0.1
Deferred income 4.0 40.3
Income tax payable and deferred tax liability 4.0 3.5
Provisions — 0.4
Public sector subsidiary partnership payment 22.8 —
Loan payable1 26.0 —
Disposal group liabilities held-for-sale 62.6 53.9
1. The loan payable represents an interest bearing loan payable by AXELOS Limited to HM Government in connection with a dividend payable by this company as at 30 June 2021. The loan is subject to interest at 6% and was settled on completion of the disposal on 29 July 2021.
Business exit cash flowsBusinesses exited and being exited generated net operating cash inflows of £22.5m (30 June 2020: cash inflows of £63.9m).
Discontinued operationsOn 3 November 2017, the Group completed the disposal of its Asset Services businesses, including Capita Financial Managers Ltd (CFM), to the Link Group. The disposal met the definition of a discontinued operation as stipulated by IFRS 5. The prior period income of £9.0m relates to additional payments received in connection with the sale of the Asset Services businesses arising from the return of redress payments made to the FCA regarding the Connaught Income Series 1 Fund.
27

5 Contract accountingAt 30 June 2021, the Group had the following results and balance sheet items relating to long-term contracts:
Note30 June 2021
£m30 June 2020
£m31 December 2020
£m
Long-term contractual adjusted revenue 6 1,146.8 1,167.9Non-current and current deferred income 1,002.6 975.2Non-current contract fulfilment assets 11 317.1 294.8
Non-current and current onerous contract provisions 15.1 16.5
BackgroundThe Group operates a number of diverse businesses. The majority of the Group’s revenue is from contracts greater than two years in duration (long-term contractual), which provided 72.4% of Group adjusted revenue at 30 June 2021 (30 June 2020: 73.8%).
Recoverability of contract fulfilment assets and completeness of onerous contract provisionsManagement first assesses whether the contract assets are impaired and then further considers whether an onerous contract exists. For half and full year reporting, the Audit and Risk Committee specifically reviews the material judgements and estimates and the overall approach in respect of the Group’s major contracts, including comparison against previous forecasts. Major contracts include those that are material in size or risk to the Group’s results. Other contracts are reported to the Audit and Risk Committee as deemed appropriate. These contracts are collectively referred to as 'major contracts' in the remainder of this note.
The major contracts contributed £0.8 billion at 30 June 2021 (30 June 2020: £0.7billion) or 50% (30 June 2020: 44%) of the Group's adjusted revenue. Non-current contract fulfilment assets as at 30 June 2021 were £317.1m, of which £173.6m (31 December 2020: £152.7m) related to major contracts with on-going transformational activities. The remainder relates to contracts post transformation and includes non-major contracts.
The major contracts, both pre- and post-transformation, are rated according to their financial risk profile, which is linked to the level of uncertainty over future assumptions. For those that are in the high and medium rated risk categories the associated non-current contract fulfilment assets in aggregate were £36.8m at 30 June 2021 (31 December 2020: £44.5m). The recoverability of these assets is dependent on no significant adverse change in the key contract assumptions arising in the next financial year. The balance of deferred income associated with these contracts was £203.6m at 30 June 2021 (31 December 2020: £232.3m) and is forecast to be recognised as performance obligations continue to be delivered over the life of the respective contracts.
Following these reviews, contract fulfilment asset impairments of £0.8m at 30 June 2021 (30 June 2020: £4.4m) were identified and recognised within adjusted cost of sales, of which, at 30 June 2021, £nil (30 June 2020: £0.7m) related to contract fulfilment assets added during the period. There were no material onerous contract provisions recognised in the period.
Given the quantum of the relevant contract assets and liabilities, and the nature of the estimates noted above, management has concluded that it is reasonably possible, that outcomes within the next financial year may be different from management’s current assumptions and could require a material adjustment to the carrying amounts of contract assets and onerous contract provisions. However, as noted above, £173.6m of non-current contract fulfilment assets relate to major contracts with on-going transformational activities and £36.8m of non-current contract fulfilment assets relate to the high and medium rated risk categories. Due to the level of uncertainty, combination of variables and timing across numerous contracts, it is not practical to provide a quantitative analysis of the aggregated judgements that are applied. Management do not believe that disclosing a potential range of outcomes on a consolidated basis would provide meaningful information to a user of the condensed consolidated financial statements. Due to commercial sensitivities, the Group does not disclose amounts involved in any individual contract.
28
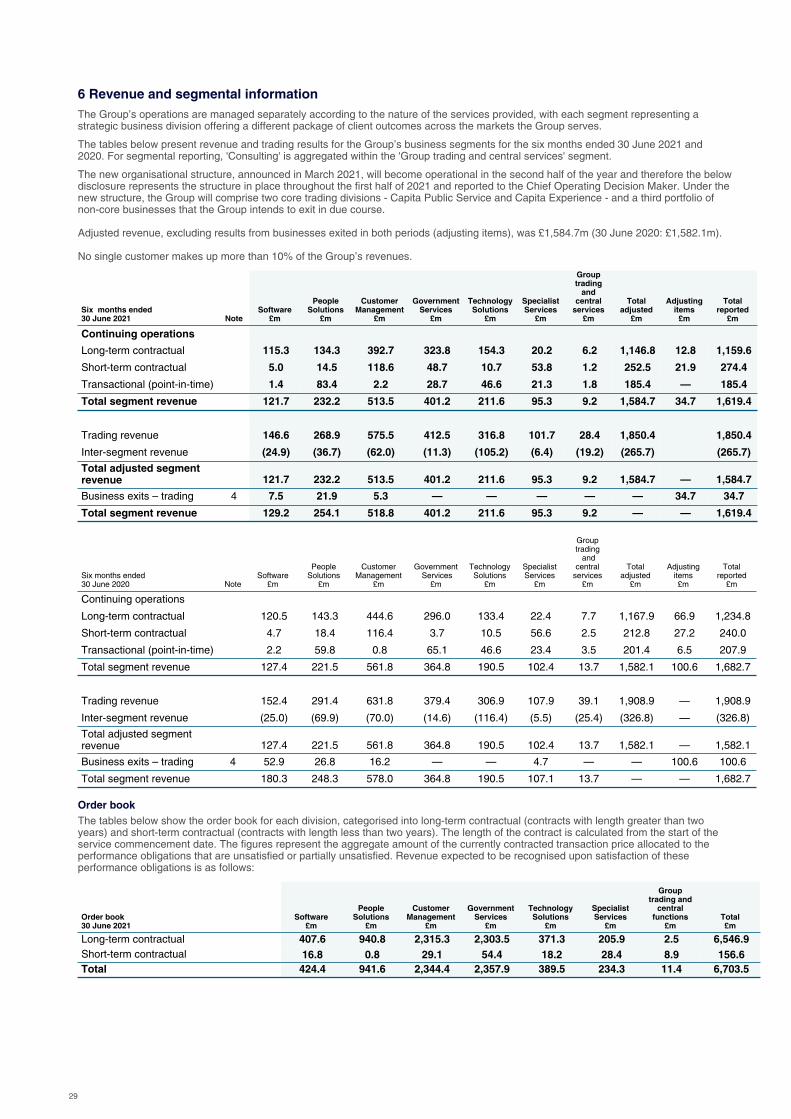
6 Revenue and segmental informationThe Group’s operations are managed separately according to the nature of the services provided, with each segment representing a strategic business division offering a different package of client outcomes across the markets the Group serves.
The tables below present revenue and trading results for the Group’s business segments for the six months ended 30 June 2021 and 2020. For segmental reporting, 'Consulting' is aggregated within the 'Group trading and central services' segment.
The new organisational structure, announced in March 2021, will become operational in the second half of the year and therefore the below disclosure represents the structure in place throughout the first half of 2021 and reported to the Chief Operating Decision Maker. Under the new structure, the Group will comprise two core trading divisions - Capita Public Service and Capita Experience - and a third portfolio of non-core businesses that the Group intends to exit in due course.
Adjusted revenue, excluding results from businesses exited in both periods (adjusting items), was £1,584.7m (30 June 2020: £1,582.1m).
No single customer makes up more than 10% of the Group’s revenues.
Continuing operations
Long-term contractual 115.3 134.3 392.7 323.8 154.3 20.2 6.2 1,146.8 12.8 1,159.6
Short-term contractual 5.0 14.5 118.6 48.7 10.7 53.8 1.2 252.5 21.9 274.4
Transactional (point-in-time) 1.4 83.4 2.2 28.7 46.6 21.3 1.8 185.4 — 185.4
Total segment revenue 121.7 232.2 513.5 401.2 211.6 95.3 9.2 1,584.7 34.7 1,619.4
Trading revenue 146.6 268.9 575.5 412.5 316.8 101.7 28.4 1,850.4 1,850.4
Inter-segment revenue (24.9) (36.7) (62.0) (11.3) (105.2) (6.4) (19.2) (265.7) (265.7)
Total adjusted segment revenue 121.7 232.2 513.5 401.2 211.6 95.3 9.2 1,584.7 — 1,584.7
Business exits – trading 4 7.5 21.9 5.3 — — — — — 34.7 34.7
Total segment revenue 129.2 254.1 518.8 401.2 211.6 95.3 9.2 — — 1,619.4
Six months ended 30 June 2021 Note
Software£m
PeopleSolutions
£m
CustomerManagement
£m
GovernmentServices
£m
TechnologySolutions
£m
SpecialistServices
£m
Grouptrading
andcentral
services£m
Totaladjusted
£m
Adjustingitems
£m
Totalreported
£m
Six months ended 30 June 2020 Note
Software£m
PeopleSolutions
£m
CustomerManagement
£m
Government Services
£m
TechnologySolutions
£m
SpecialistServices
£m
Grouptrading and
centralservices
£m
Totaladjusted
£m
Adjustingitems£m
Totalreported
£m
Continuing operations
Long-term contractual 120.5 143.3 444.6 296.0 133.4 22.4 7.7 1,167.9 66.9 1,234.8
Short-term contractual 4.7 18.4 116.4 3.7 10.5 56.6 2.5 212.8 27.2 240.0
Transactional (point-in-time) 2.2 59.8 0.8 65.1 46.6 23.4 3.5 201.4 6.5 207.9
Total segment revenue 127.4 221.5 561.8 364.8 190.5 102.4 13.7 1,582.1 100.6 1,682.7
Trading revenue 152.4 291.4 631.8 379.4 306.9 107.9 39.1 1,908.9 — 1,908.9
Inter-segment revenue (25.0) (69.9) (70.0) (14.6) (116.4) (5.5) (25.4) (326.8) — (326.8)
Total adjusted segment revenue 127.4 221.5 561.8 364.8 190.5 102.4 13.7 1,582.1 — 1,582.1
Business exits – trading 4 52.9 26.8 16.2 — — 4.7 — — 100.6 100.6
Total segment revenue 180.3 248.3 578.0 364.8 190.5 107.1 13.7 — — 1,682.7
Order bookThe tables below show the order book for each division, categorised into long-term contractual (contracts with length greater than two years) and short-term contractual (contracts with length less than two years). The length of the contract is calculated from the start of the service commencement date. The figures represent the aggregate amount of the currently contracted transaction price allocated to the performance obligations that are unsatisfied or partially unsatisfied. Revenue expected to be recognised upon satisfaction of these performance obligations is as follows:
Order book30 June 2021
Software£m
PeopleSolutions
£m
CustomerManagement
£m
GovernmentServices
£m
TechnologySolutions
£m
SpecialistServices
£m
Grouptrading and
centralfunctions
£mTotal£m
Long-term contractual 407.6 940.8 2,315.3 2,303.5 371.3 205.9 2.5 6,546.9Short-term contractual 16.8 0.8 29.1 54.4 18.2 28.4 8.9 156.6Total 424.4 941.6 2,344.4 2,357.9 389.5 234.3 11.4 6,703.5
29
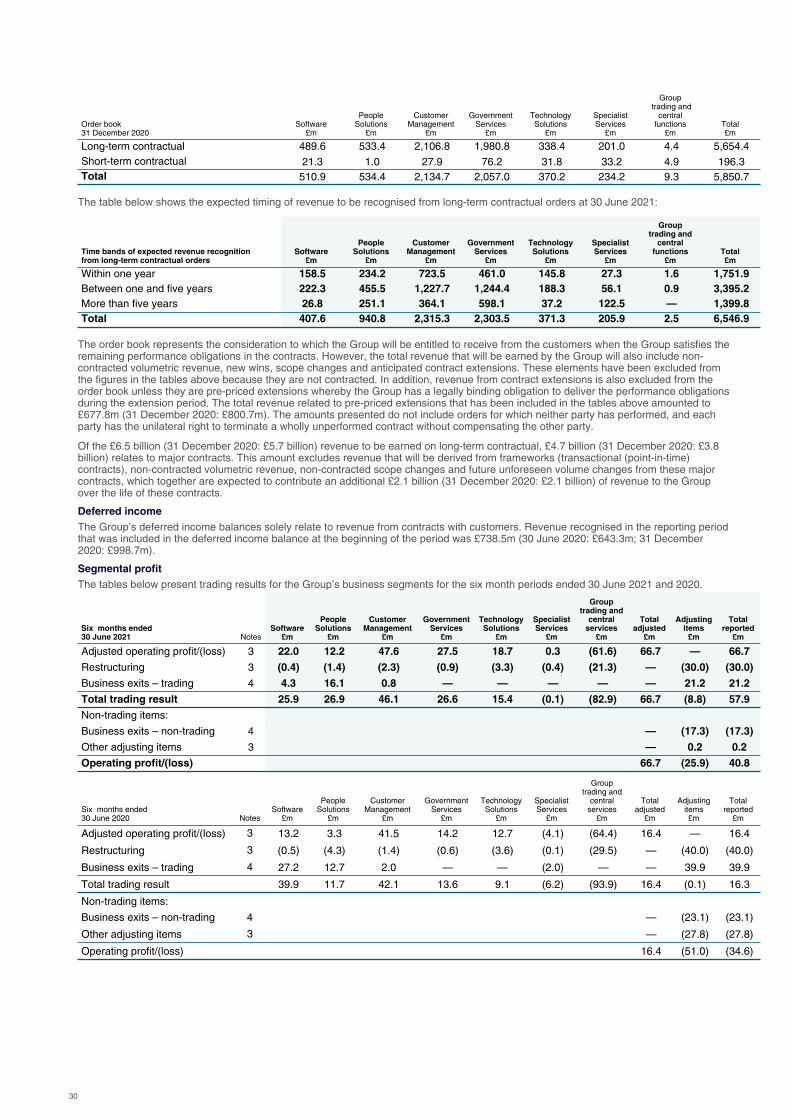
Order book31 December 2020
Software£m
PeopleSolutions
£m
CustomerManagement
£m
GovernmentServices
£m
TechnologySolutions
£m
SpecialistServices
£m
Group trading and
centralfunctions
£mTotal£m
Long-term contractual 489.6 533.4 2,106.8 1,980.8 338.4 201.0 4.4 5,654.4Short-term contractual 21.3 1.0 27.9 76.2 31.8 33.2 4.9 196.3Total 510.9 534.4 2,134.7 2,057.0 370.2 234.2 9.3 5,850.7
The table below shows the expected timing of revenue to be recognised from long-term contractual orders at 30 June 2021:
Time bands of expected revenue recognitionfrom long-term contractual orders
Software£m
PeopleSolutions
£m
CustomerManagement
£m
GovernmentServices
£m
TechnologySolutions
£m
SpecialistServices
£m
Grouptrading and
centralfunctions
£mTotal£m
Within one year 158.5 234.2 723.5 461.0 145.8 27.3 1.6 1,751.9Between one and five years 222.3 455.5 1,227.7 1,244.4 188.3 56.1 0.9 3,395.2More than five years 26.8 251.1 364.1 598.1 37.2 122.5 — 1,399.8Total 407.6 940.8 2,315.3 2,303.5 371.3 205.9 2.5 6,546.9
The order book represents the consideration to which the Group will be entitled to receive from the customers when the Group satisfies the remaining performance obligations in the contracts. However, the total revenue that will be earned by the Group will also include non-contracted volumetric revenue, new wins, scope changes and anticipated contract extensions. These elements have been excluded from the figures in the tables above because they are not contracted. In addition, revenue from contract extensions is also excluded from the order book unless they are pre-priced extensions whereby the Group has a legally binding obligation to deliver the performance obligations during the extension period. The total revenue related to pre-priced extensions that has been included in the tables above amounted to £677.8m (31 December 2020: £800.7m). The amounts presented do not include orders for which neither party has performed, and each party has the unilateral right to terminate a wholly unperformed contract without compensating the other party.
Of the £6.5 billion (31 December 2020: £5.7 billion) revenue to be earned on long-term contractual, £4.7 billion (31 December 2020: £3.8 billion) relates to major contracts. This amount excludes revenue that will be derived from frameworks (transactional (point-in-time) contracts), non-contracted volumetric revenue, non-contracted scope changes and future unforeseen volume changes from these major contracts, which together are expected to contribute an additional £2.1 billion (31 December 2020: £2.1 billion) of revenue to the Group over the life of these contracts.
Deferred incomeThe Group’s deferred income balances solely relate to revenue from contracts with customers. Revenue recognised in the reporting period that was included in the deferred income balance at the beginning of the period was £738.5m (30 June 2020: £643.3m; 31 December 2020: £998.7m).
Segmental profitThe tables below present trading results for the Group’s business segments for the six month periods ended 30 June 2021 and 2020.
Six months ended30 June 2021 Notes
Software£m
PeopleSolutions
£m
CustomerManagement
£m
GovernmentServices
£m
TechnologySolutions
£m
SpecialistServices
£m
Grouptrading and
centralservices
£m
Totaladjusted
£m
Adjustingitems
£m
Totalreported
£m
Adjusted operating profit/(loss) 3 22.0 12.2 47.6 27.5 18.7 0.3 (61.6) 66.7 — 66.7
Restructuring 3 (0.4) (1.4) (2.3) (0.9) (3.3) (0.4) (21.3) — (30.0) (30.0)
Business exits – trading 4 4.3 16.1 0.8 — — — — — 21.2 21.2
Total trading result 25.9 26.9 46.1 26.6 15.4 (0.1) (82.9) 66.7 (8.8) 57.9
Non-trading items:
Business exits – non-trading 4 — (17.3) (17.3)
Other adjusting items 3 — 0.2 0.2
Operating profit/(loss) 66.7 (25.9) 40.8
Six months ended30 June 2020 Notes
Software£m
PeopleSolutions
£m
CustomerManagement
£m
GovernmentServices
£m
TechnologySolutions
£m
SpecialistServices
£m
Grouptrading and
centralservices
£m
Totaladjusted
£m
Adjustingitems£m
Totalreported
£m
Adjusted operating profit/(loss) 3 13.2 3.3 41.5 14.2 12.7 (4.1) (64.4) 16.4 — 16.4
Restructuring 3 (0.5) (4.3) (1.4) (0.6) (3.6) (0.1) (29.5) — (40.0) (40.0)
Business exits – trading 4 27.2 12.7 2.0 — — (2.0) — — 39.9 39.9
Total trading result 39.9 11.7 42.1 13.6 9.1 (6.2) (93.9) 16.4 (0.1) 16.3
Non-trading items:
Business exits – non-trading 4 — (23.1) (23.1)
Other adjusting items 3 — (27.8) (27.8)
Operating profit/(loss) 16.4 (51.0) (34.6)
30
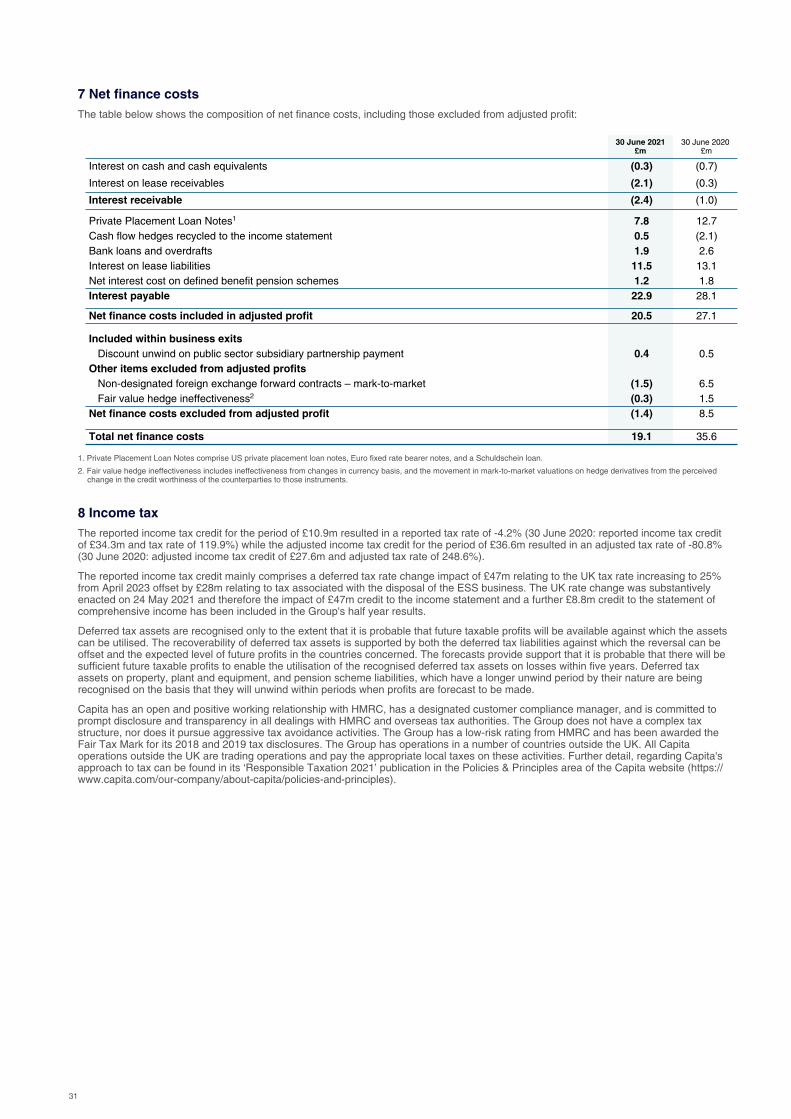
7 Net finance costsThe table below shows the composition of net finance costs, including those excluded from adjusted profit:
30 June 2021 £m
30 June 2020 £m
Interest on cash and cash equivalents (0.3) (0.7)
Interest on lease receivables (2.1) (0.3)
Interest receivable (2.4) (1.0)
Private Placement Loan Notes1 7.8 12.7Cash flow hedges recycled to the income statement 0.5 (2.1)Bank loans and overdrafts 1.9 2.6Interest on lease liabilities 11.5 13.1Net interest cost on defined benefit pension schemes 1.2 1.8Interest payable 22.9 28.1
Net finance costs included in adjusted profit 20.5 27.1
Included within business exits Discount unwind on public sector subsidiary partnership payment 0.4 0.5Other items excluded from adjusted profits Non-designated foreign exchange forward contracts – mark-to-market (1.5) 6.5 Fair value hedge ineffectiveness2 (0.3) 1.5Net finance costs excluded from adjusted profit (1.4) 8.5
Total net finance costs 19.1 35.6
1. Private Placement Loan Notes comprise US private placement loan notes, Euro fixed rate bearer notes, and a Schuldschein loan.
2. Fair value hedge ineffectiveness includes ineffectiveness from changes in currency basis, and the movement in mark-to-market valuations on hedge derivatives from the perceived change in the credit worthiness of the counterparties to those instruments.
8 Income taxThe reported income tax credit for the period of £10.9m resulted in a reported tax rate of -4.2% (30 June 2020: reported income tax credit of £34.3m and tax rate of 119.9%) while the adjusted income tax credit for the period of £36.6m resulted in an adjusted tax rate of -80.8% (30 June 2020: adjusted income tax credit of £27.6m and adjusted tax rate of 248.6%).
The reported income tax credit mainly comprises a deferred tax rate change impact of £47m relating to the UK tax rate increasing to 25% from April 2023 offset by £28m relating to tax associated with the disposal of the ESS business. The UK rate change was substantively enacted on 24 May 2021 and therefore the impact of £47m credit to the income statement and a further £8.8m credit to the statement of comprehensive income has been included in the Group's half year results.
Deferred tax assets are recognised only to the extent that it is probable that future taxable profits will be available against which the assets can be utilised. The recoverability of deferred tax assets is supported by both the deferred tax liabilities against which the reversal can be offset and the expected level of future profits in the countries concerned. The forecasts provide support that it is probable that there will be sufficient future taxable profits to enable the utilisation of the recognised deferred tax assets on losses within five years. Deferred tax assets on property, plant and equipment, and pension scheme liabilities, which have a longer unwind period by their nature are being recognised on the basis that they will unwind within periods when profits are forecast to be made.
Capita has an open and positive working relationship with HMRC, has a designated customer compliance manager, and is committed to prompt disclosure and transparency in all dealings with HMRC and overseas tax authorities. The Group does not have a complex tax structure, nor does it pursue aggressive tax avoidance activities. The Group has a low-risk rating from HMRC and has been awarded the Fair Tax Mark for its 2018 and 2019 tax disclosures. The Group has operations in a number of countries outside the UK. All Capita operations outside the UK are trading operations and pay the appropriate local taxes on these activities. Further detail, regarding Capita's approach to tax can be found in its ‘Responsible Taxation 2021’ publication in the Policies & Principles area of the Capita website (https://www.capita.com/our-company/about-capita/policies-and-principles).
31

9 Earnings per shareBasic earnings per share amounts are calculated by dividing net profit for the period attributable to ordinary shareholders of the Parent Company by the weighted average number of ordinary shares outstanding during the period.
Diluted earnings per share amounts are calculated by dividing the net profit/(loss) for the period attributable to ordinary shareholders of the Parent Company by the weighted average number of ordinary shares outstanding during the period plus the weighted average number of ordinary shares that would be issued on the conversion of all the dilutive potential ordinary shares into ordinary shares.
30 June 2021 30 June 2020
Continuingoperations
p
Totaloperations
p
Continuingoperations
p
Totaloperations
p
Basic earnings per share – adjusted 4.95 4.95 1.23 1.23
– reported 16.18 16.18 0.38 0.92
Diluted earnings per share – adjusted 4.88 4.88 1.21 1.21– reported 15.94 15.94 0.38 0.91
The following tables show the earnings and share data used in the basic and diluted earnings per share calculations:
30 June 2021 30 June 2020
Notes
Continuingoperations
£m
Totaloperations
£m
Continuingoperations
£m
Totaloperations
£m
Adjusted profit/(loss) before tax for the period 3 45.3 45.3 (11.1) (11.1)Income tax credit 36.6 36.6 27.6 27.6Adjusted profit for the period 81.9 81.9 16.5 16.5Less: Non-controlling interest 0.3 0.3 3.9 3.9Adjusted profit attributable to shareholders 82.2 82.2 20.4 20.4
Reported profit/(loss) before tax for the period 261.1 261.1 (28.5) (19.5)Income tax credit 8 10.9 10.9 34.3 34.3Reported profit for the period 272.0 272.0 5.8 14.8Less: Non-controlling interest (3.5) (3.5) 0.5 0.5Total profit attributable to shareholders 268.5 268.5 6.3 15.3
30 June 2021 £m
30 June 2020 £m
Weighted average number of ordinary shares (excluding trust and treasury shares) for basic earnings per share 1,659.0 1,656.0
Dilutive potential ordinary shares: Employee share options 25.8 23.5Weighted average number of ordinary shares (excluding trust and treasury shares) adjusted for the effect of dilution 1,684.8 1,679.5
The earnings per share figures are calculated based on earnings attributable to ordinary shareholders of the Parent Company, and therefore exclude non-controlling interest. Earnings per share are calculated on an adjusted and a total reported basis. Earnings per share for business exits and specific items are bridging items between adjusted and total reported earnings per share.
See note 15 for details of transactions involving ordinary shares or potential ordinary shares between the reporting date and the date on which these consolidated financial statements were authorised for issue.
10 GoodwillIn preparing these condensed consolidated financial statements, the Group undertook a review to identify indicators of impairment of goodwill. Consideration was given to performance against forecasts used in the year end impairment testing and where this gave rise to an indicator of potential impairment, further review was performed. No indicators of impairment were identified as at 30 June 2021.
The new organisational structure, announced in March 2021, will become operational in the second half of the year. Under the new structure, the Group will comprise two core divisions - Capita Public Service and Capita Experience - and a third portfolio of non-core businesses the Group intends to exit in due course. An assessment of the impact on the Group's Cash Generating Units will be undertaken in the second half of the year.
32

11 Contract fulfilment assets
Total£m
At 1 January 2021 294.8Additions 66.8
Impairment (0.8)Utilised during the period (43.5)Transfer to assets held-for-sale (0.1)Exchange rate movement (0.1)At 30 June 2021 317.1
Impairment: During the period, the Group recognised impairment of £0.8m (30 June 2020: £4.4m; 31 December 2020: £17.5m) within adjusted cost of sales, of which £nil (30 June 2020: £0.7m; 31 December 2020: £2.0m) relates to contract fulfilment assets added during the period.
12 Provisions
Restructuringprovision
£m
Business exitprovision
£m
Claims andlitigationprovision
£m
Propertyprovision
£m
Customercontractprovision
£m
Otherprovisions
£mTotal£m
At 1 January 2021 13.5 15.3 41.7 8.7 38.1 7.1 124.4
Provisions in the period 12.8 5.1 5.1 0.9 3.0 9.5 36.4
Releases in the period (2.2) (1.2) (4.5) (0.8) (2.0) (1.3) (12.0)
Utilisation (4.8) (9.7) (25.1) (0.2) (3.5) (1.7) (45.0)
At 30 June 2021 19.3 9.5 17.2 8.6 35.6 13.6 103.8
The provisions made have been shown as current or non-current in the balance sheet according to the Group’s expected timing of the matters reaching conclusion.
Restructuring provision: The provision represents the cost of reducing headcount where communication to affected employees has crystallised a valid expectation that the roles are at risk. Additionally, it relates to unavoidable running costs, such as insurance and security, and dilapidation costs, where properties are exited as a result of the transformation programme. These provisions are likely to unwind over periods of between one and up to five years.
Business exit provision: The provision relates to the cost of exiting businesses through disposal or closure including professional fees related to business exits and the costs of separating the businesses being disposed. These are likely to unwind over a period of one to five years.
Claims and litigation provision: The Group is exposed to claims and litigation proceedings arising in the ordinary course of business. These matters are reassessed regularly and where obligations are probable and estimable, provisions are made representing the Group’s best estimate of the expenditure to be incurred. Due to the nature of these claims, the Group cannot give an estimate of the period over which this provision will unwind.
Property provision: The provision relates to unavoidable running costs, such as insurance and security, of leasehold property where the space is vacant or currently not planned to be used for ongoing operations, and for dilapidation costs, as part of the ordinary course of business and not the group wide transformation programme (where such costs are included in the restructuring provision). The expectation is that this expenditure will be incurred over the remaining periods of the leases which vary up to seven years.
Customer contract provision: The provision includes onerous contract provisions in respect of customer contracts where the unavoidable costs of meeting the obligations under the contracts exceeds the economic benefits expected to be received under them, claims/obligations associated with missed milestones in contractual obligations, and other potential exposures related to contracts with customers. These provisions are forecast to unwind over periods up to seven years.
The provision includes a provision of £11.1m in respect of a contract that has a clause such that the customer can continue to extend the contract indefinitely. Accordingly, judgement is required in assessing the remaining length of the contract to determine the provision. Management considered previous discussions with the customer regarding their intentions and experiences on other contracts and concluded the best estimate of the remaining contract term is the current contractually committed period to 2023. However, the contract may end earlier or be extended for longer, resulting in a material release or increase in the provision in future reporting periods.
Other provisions: Relates to provisions in respect of other potential exposures arising due to the nature of some of the operations that the Group provides. These are likely to unwind over periods of up to five years.
33

13 Cash flow information
30 June 2021 30 June 2020
NoteAdjusted
£mReported
£mAdjusted
£mReported
£m
Cash flows from operating activities:Operating profit/(loss) 3 66.7 40.8 16.4 (34.6)
Adjustments for non-cash items:Depreciation 59.0 60.1 72.2 73.4Amortisation of intangible assets 19.3 31.7 18.1 38.3Share based payment expense 1.8 1.8 5.1 5.1Employee benefits 4.0 4.0 5.3 5.3Loss on disposal of property, plant and equipment / intangible assets 0.1 0.1 2.0 2.0Impairment of disposal group assets — — — 17.9Impairment of non-current assets 0.6 2.1 1.3 12.2
Other adjustments:Movement in provisions 7.8 (20.5) 6.8 12.1Pension deficit contribution — (139.9) — (14.1)Other contributions into pension schemes (4.3) (4.3) (9.8) (9.8)
Movements in working capital:Trade and other receivables (84.4) (84.6) 57.3 58.6Non-recourse trade receivables financing — (7.2) — 32.8Trade and other payables 100.0 107.9 (3.0) 0.7VAT deferral — (14.9) — 117.3Deferred income 28.3 22.9 31.9 51.9Contract fulfilment assets (non-current) (22.7) (22.5) (13.8) (13.4)Cash generated/(used) by operations 176.2 (22.5) 189.8 355.7
Adjustments for free cash flows:Income tax paid (4.8) (7.0) (3.0) (4.6)Net interest paid (18.3) (18.2) (24.1) (24.1)Purchase of property, plant and equipment (10.7) (11.0) (17.9) (20.9)Purchase of intangible assets (11.9) (13.1) (28.4) (28.4)Proceeds from sale of property, plant and equipment / intangible assets 0.2 0.2 — —Free cash flow 130.7 (71.6) 116.4 277.7
Adjusted free cash flow and cash generated from operations
The items below are excluded from the adjusted results because the Board has concluded that it is appropriate to do so. These amounts are (or have been) material and require separate disclosure for users of the financial statements to obtain a proper understanding of the financial information and the underlying performance of the business. These items are discussed further below:
Free cash flowCash generated from
operations
2021 £m
2020 £m
2021 £m
2020 £m
Reported (71.6) 277.7 (22.5) 355.7Pension deficit contributions 139.9 14.1 139.9 14.1Significant restructuring 23.8 28.1 23.8 28.1Litigation and claims 18.3 — 18.3 —On hold disposal costs — 2.0 — 2.0Business exits (1.8) (55.4) (5.4) (60.0)Non-recourse trade receivables financing 7.2 (32.8) 7.2 (32.8)VAT deferral 14.9 (117.3) 14.9 (117.3)Adjusted 130.7 116.4 176.2 189.8
Pension deficit contributions: in November 2018, the Group agreed a deficit recovery plan with the Trustees of the Capita Pension and Life Assurance Scheme (the ‘Scheme’). The payments under the agreed deficit recovery plan total £176.0m, of which the last element totalling £35.4m was paid in the period ended 30 June 2021 (30 June 2020: £14.1m).
As part of the 2017 funding agreement, additional monthly contributions of £4.16m were triggered from July 2020 until the 31 March 2020 valuation was finalised in June 2021. The Trustee Board and the Group agreed that these contributions would be paid into an escrow account (instead of the scheme), with the escrow account being released to the scheme later in 2021. The amounts held in escrow at 30 June 2021 (£45.8m) are included in the pension deficit contributions figures above and are recognised within current other receivables in the consolidated balance sheet. June’s payment, along with £0.4m of other contributions, was paid directly to the Scheme.
34

In 2012, the Group established the Capita Scotland (Pension) Limited Partnership (the ‘Partnership’) with the Scheme. Under this arrangement, intellectual property rights (IPR) in specific Group software were transferred to the partnership and the rights to use, develop and exploit this IPR was licensed back to the Group in return for an annual fee. The Scheme’s interest in the Partnership entitles it to an annual distribution of £8.0m for 15 years from inception. However, as at 31 December 2020, the Scheme's interest in the Partnership ceased and in return the Scheme received a special contribution of £50.2m in February 2021 (for 30 June 2020: distributions of £4.0m were received). In addition, £4.3m in deficit contributions were paid to other schemes that Capita participates in (30 June 2020: £0.4m).
These payments have been excluded from adjusted cash flows because the Group treats them like debt.
Significant restructuring: in April 2018, the Group announced a multi-year transformation programme. In the period to 30 June 2021, a cash outflow of £23.8m (30 June 2020: £28.1m) was incurred in relation to the cost of the transformation programme.
Litigation and claims: the Group settled a legal claim, that had been fully provided for in a prior year, and received an insurance settlement in respect of the same claim. The claim was excluded from adjusted results when provided due to its historical nature and size, and accordingly the insurance receipt has also been excluded from adjusted results. In addition, the Group paid the cash element of an agreed liability relating to past services received under supplier software licence agreements which had been fully provided for in the prior year. This was excluded from adjusted results because it related to services received in prior periods and is not reflective of current trading.
Business exits: the cash flows of businesses exited, or in the process of being exited, and the proceeds from disposals, are disclosed outside the adjusted results. The 30 June 2020 results have been represented for those businesses exited, or in the process of being exited, during the period from 1 July 2020 to 30 June 2021 to enable comparability of the adjusted results.
Non-recourse trade receivables financing: during 2020, a non-recourse receivables financing facility was put in place to mitigate the risk of customer receipts slippage resulting from the impact of the Covid-19 pandemic.
VAT deferral: utilisation of the Government's VAT deferral scheme. This VAT is being paid in eight monthly instalments of £14.7m between June 2021 and January 2022 as part of the Government’s VAT payment deferral measures.
Reconciliation of net cash flow to movement in net debt
Net debt at 1 January 2021
£m
Cash flowmovements
£m
Non-cashmovement2
£m
Net debt at 30 June 2021
£m
Cash, cash equivalents and overdrafts 141.1 155.7 0.9 297.7
Other debt (2.3) — 1.0 (1.3)
Loan included within disposal group liabilities held-for-sale3 — — (26.0) (26.0)
Private Placement Loan Notes1 (765.1) 1.5 19.0 (744.6)
Cross-currency interest rate swaps1 57.5 — (10.4) 47.1
Interest rate swaps1 0.5 — (0.5) —
Lease liabilities (508.1) 47.3 (5.8) (466.6)
Total net liabilities from financing activities (1,217.5) 48.8 (22.7) (1,191.4)
Deferred consideration (0.7) — — (0.7)
Net debt (1,077.1) 204.5 (21.8) (894.4)
1. The sum of these items equates to the fair value of the Group’s Private Placement Loan Note debt: £697.5m (31 December 2020: £707.1m). The £1.5m of cash flow movement during the period represents expenses incurred for renewing and extending in the revolving credit facility.
2. Non-cash movement relates to: the effect of changes in foreign exchange rates on cash; fair value changes on the swaps; amortisation of loan notes issue costs; amortisation of the discount on the Euro debt; and additions, terminations; foreign exchange rate effects on the Group's leases; and the loan detailed in footnote 3 below.
3. The loan included within disposal group liabilities held-for-sale represents an interest bearing loan payable by AXELOS Limited to HM Government in connection with a dividend payable by this company as at 30 June 2021. The loan is subject to interest at 6% and was settled on completion of the disposal on 29 July 2021.
Overdrafts comprise the aggregate value of bank account debit balances within the Group’s notional interest pooling arrangement. The aggregate value is fully offset by credit balances within the same arrangement.
At 30 June 2021, £nil of the Group’s £452.0m committed revolving credit facility was drawn (31 December 2020: £nil drawn).
Net debt at 1 January 2020
£m
Cash flowmovements
£m
Non-cashmovement
£m
Net debt at 30 June 2020
£m
Cash, cash equivalents and overdrafts 122.8 253.4 (6.0) 370.2
Other debt (0.3) — — (0.3)
Private Placement Loan Notes (990.7) 187.2 (66.5) (870.0)
Cross-currency interest rate swaps 77.3 (24.5) 49.2 102.0
Interest rate swaps 1.0 — (0.1) 0.9
Revolving credit facility — (170.0) — (170.0)
Lease liabilities (562.6) 61.4 (27.5) (528.7)
Total net liabilities from financing activities (1,475.3) 54.1 (44.9) (1,466.1)
Deferred consideration (0.7) — — (0.7)
Net debt (1,353.2) 307.5 (50.9) (1,096.6)
35

14 Financial InstrumentsThe Group’s financial assets and liabilities are classified based on the following fair value hierarchy:
• Level-1: quoted (unadjusted) prices in active markets for identical assets or liabilities.
• Level-2: other techniques for which all inputs that have a significant effect on the recorded fair value are observable, either directly or indirectly.
With the exception of current financial instruments (which have a short maturity), the fair value of the Group’s level-2 financial instruments was calculated by discounting the expected future cash flows at prevailing interest rates. The valuation models incorporate various inputs including foreign exchange spot and forward rates and interest rate curves. In the case of floating rate borrowings nominal value approximates to fair value because interest is set at floating rates where payments are reset to market values at intervals of less than one year.
• Level-3: other techniques for which inputs that have a significant effect on the recorded fair value are not based on observable market data.
Other financial instruments, where observable market data is not available, are carried at either amortised cost or cost (undiscounted cash flows) as a reasonable approximation of fair value.
During the six months ended 30 June 2021, there were no assets or liabilities transferred between the fair value levels.
The following table analyses, by classification and category, the carrying value of the Group’s financial instruments and identifies the level of the fair value hierarchy for the instruments carried at fair value:
At 30 June 2021 Note
Fairvalue
hierarchy
At fairvalue
throughP&L£m
At fairvalue
throughOCI£m
Derivativesused forhedging
£m
Amortisedcost£m
Total£m
Current£m
Non-current
£m
Financial assetsLease receivables Level-2 — — — 82.8 82.8 4.0 78.8Non-designated foreign exchange forwards and swaps Level-2 2.7 — — — 2.7 1.0 1.7
Cross-currency interest rate swaps a Level-2 — — 50.8 — 50.8 30.0 20.8Investments Level-3 4.4 — — — 4.4 — 4.4Other investments Level-3 — 1.1 — — 1.1 — 1.1
7.1 1.1 50.8 82.8 141.8 35.0 106.8Other financial assetsCash and cash equivalents Level-1 — — — 546.0 546.0 546.0 —Cash and cash equivalents included within disposal group assets held-for-sale 4 Level-1 — — — 10.1 10.1 10.1 —
Total financial assets 7.1 1.1 50.8 638.9 697.9 591.1 106.8
At 30 June 2021 Note
Fairvalue
hierarchy
At fairvalue
throughP&L£m
At fairvalue
throughOCI£m
Derivativesused forhedging
£m
Amortisedcost£m
Total£m
Current£m
Non-current
£m
Financial liabilitiesPrivate Placement Loan Notes a Level-2 — — — 744.6 744.6 303.4 441.2Other loan notes Level-2 — — — 1.3 1.3 1.3 —Cash flow hedges Level-2 — — 3.4 — 3.4 1.4 2.0Non-designated foreign exchange forwards and swaps Level-2 4.9 — — — 4.9 4.9 —
Cross-currency interest rate swaps a Level 2 — — 3.7 — 3.7 1.4 2.3Deferred consideration Level-2 — — — 0.7 0.7 — 0.7Put options of non-controlling interests d Level-3 — 3.2 — — 3.2 3.2 —
4.9 3.2 7.1 746.6 761.8 315.6 446.2Other financial liabilitiesOverdrafts Level-1 — — — 258.4 258.4 258.4 —
Public sector subsidiary partnership payment included within disposal group liabilities held-for-sale
4,c Level-3 — — — 22.8 22.8 22.8 —
Loan included within disposal group liabilities held-for-sale 4 Level-2 — — — 26.0 26.0 26.0 —
Lease liabilities Level-2 — — — 466.6 466.6 64.6 402.0Total financial liabilities 4.9 3.2 7.1 1,520.4 1,535.6 687.4 848.2
Financial assets measured at amortised cost consist of cash and lease receivables. The carrying value of cash is a reasonable approximation of its fair value due to the short-term nature of the instruments. Lease receivables are measured at amortised cost using the effective interest rate method. Included in other investments are £1.1m (31 December 2020: £1.0m) of strategic investments in unlisted equity securities which are not held-for-trading and the Group elected to recognise at Fair Value through Other Comprehensive Income (FVOCI). During the period no dividends were received from, and no disposals were made of, strategic investments.
Financial liabilities measured at amortised cost consist of loan notes, public sector subsidiary partnership payment, overdrafts and lease liabilities. With the exception of certain series within the fixed rate Private Placement Loan Notes, the carrying value of financial liabilities are a reasonable approximation of their fair value. This is because either the interest payable is close to market rates or the liability is short-term in nature. The Private Placement Loan Note series that remain subject to a fixed rate of interest have an underlying carrying value of £360.1m (31 December 2020: £368.8m) and a fair value of £302.4m (31 December 2020: £309.8m). Lease liabilities are measured at amortised cost using the effective interest rate method.
36

The Group’s key financial liabilities are set out below:
a. Private Placement Loan NotesThe Private Placement Loan Notes were issued in USD, GBP, and EUR at fixed interest rates. The Group manages its exposure to foreign exchange and interest rate movements through cross-currency interest rate swaps, interest rate swaps, and forward foreign exchange contracts.
b. Revolving credit facilityThe Group's revolving credit facility (RCF) was undrawn at both 30 June 2021 and 31 December 2020. The Financial review includes further details on the RCF.
c. Public sector subsidiary partnership paymentThe public sector subsidiary partnership payment liability represents the annual deferred payments to be made by AXELOS Limited. Since the payment conditions have been reached and the liability cap met, sensitivity to changes in either the discount rate or projected cash flows have no impact. This liability will be settled by the purchaser of AXELOS Limited, refer to note 20.
d. Put options of non-controlling interestsThe liability at 30 June 2021 represents the present value of the cost to acquire the non-controlling interest in Fera Science Limited. The option held by the non-controlling shareholder of Fera Science Limited is exercisable from April 2021. A sensitivity analysis assuming a 10% increase/decrease in the earnings potential of the business results in a £0.3m increase/decrease in the valuation.
The option to acquire the non-controlling interest in AXELOS Limited expired without being exercised on 28 February 2021, and the related liability was de-recognised.
At 31 December 2020 Note
Fairvalue
hierarchy
At fairvalue
throughP&L£m
At fairvalue
throughOCI£m
Derivativesused forhedging
£m
Amortisedcost£m
Total£m
Current£m
Non-current
£m
Financial assetsLease receivables Level-2 — — — 82.6 82.6 3.8 78.8Cash flow hedges Level-2 — — 0.1 — 0.1 — 0.1
Non-designated foreign exchange forwards and swaps Level-2 2.9 — — — 2.9 1.3 1.6
Interest rate swaps a Level-2 — — 0.5 — 0.5 0.5 —Cross-currency interest rate swaps a Level-2 — — 60.2 — 60.2 26.5 33.7Investments Level-3 1.8 — — — 1.8 — 1.8Other investments Level-3 — 1.0 — — 1.0 — 1.0
4.7 1.0 60.8 82.6 149.1 32.1 117.0Other financial assetsCash and cash equivalents Level-1 — — — 460.9 460.9 460.9 —
Cash and cash equivalents included within disposal group assets held-for-sale 4 Level-1 — — — 12.9 12.9 12.9 —
Total financial assets 4.7 1.0 60.8 556.4 622.9 505.9 117.0
At 31 December 2020 Note
Fairvalue
hierarchy
At fairvalue
throughP&L£m
At fairvalue
throughOCI£m
Derivativesused forhedging
£m
Amortisedcost£m
Total£m
Current£m
Non-current
£m
Financial liabilitiesPrivate Placement Loan Notes a Level-2 — — — 765.1 765.1 233.9 531.2Other loan notes Level-2 — — — 2.3 2.3 2.3 —Cash flow hedges Level-2 — — 2.8 — 2.8 0.6 2.2
Non-designated foreign exchange forwards and swaps Level-2 1.7 — — — 1.7 1.4 0.3
Cross-currency interest rate swaps a Level-2 — — 2.7 — 2.7 1.2 1.5Public sector subsidiary partnership payment c Level-3 — — — 27.1 27.1 8.7 18.4Deferred consideration Level-2 — — — 0.7 0.7 — 0.7Put options of non-controlling interests d Level-3 — 99.7 — — 99.7 99.7 —
1.7 99.7 5.5 795.2 902.1 347.8 554.3Other financial liabilitiesOverdrafts Level-1 — — — 332.7 332.7 332.7 —Lease liabilities Level-2 — — — 503.5 503.5 77.5 426.0
Lease liabilities included within disposal group liabilities held-for-sale 4 Level-2 — — — 4.6 4.6 4.6 —
Total financial liabilities 1.7 99.7 5.5 1,636.0 1,742.9 762.6 980.3
37

The following table shows the changes from the opening to closing balances for Level-3 fair value financial instruments.
Subsidiarypartnership
payment£m
Put optionsof non-
controllinginterests
£m
Investmentsand other
investments£m
At 1 January 2021 27.1 99.7 2.8Payments made (4.7) — —Change in put-options recognised in equity1 — (96.5) —Reclassification from investments in associates — — 0.8Gain on fair value recognised through profit and loss — — 1.8Gain on fair value recognised through other comprehensive income — — 0.1Discount unwind 0.4 — —Transfer to disposal group liabilities held-for-sale (22.8) — —
At 30 June 2021 — 3.2 5.5
1. The option to acquire the non-controlling interest in AXELOS Limited expired without being exercised on 28 February 2021, and the related liability of £96.5m was de-recognised.
Non-recourse sale of receivablesThe Group holds a non-recourse short-term receivables facility. The outstanding invoices sold under this facility at 30 June 2021 totalled £6.4m (31 December 2020: £13.6m). The costs of selling such invoices (£0.4m) were included in administrative expenses in the condensed consolidated income statement.
15 Issued share capital and share premium
Share capital Share premiumEmployee benefit trust and
treasury shares
Allotted, called up and fully paid m £m £m m £m
Ordinary shares of 2 1/15p
At 1 January 2021 1,671.1 34.5 1,143.3 14.9 (11.2)
Exercise of share options under employee long term incentive plans — — — (7.5) 2.4
Shares issued 13.0 0.3 — 13.0 (0.3)
VAT refund on rights issue issuance costs — — 2.2 — —
At 30 June 2021 1,684.1 34.8 1,145.5 20.4 (9.1)
In the six months to 30 June 2021, the Group did not purchase any treasury shares, and allotted and issued 2,299,955 (30 June 2020: 276,614) treasury shares with an aggregate nominal value of £47,532 (30 June 2020: £5,718) to satisfy exercises under the Group's share option and long term incentive plans. The total consideration received in respect of these shares was £nil (30 June 2020: £nil).
In 2018 the Group offered a rights issue to existing shareholders, raising £700.7m less issuance costs of £38.0m, which was capitalised to share capital and share premium. The issuance costs included VAT that was, at the time, treated as irrecoverable. In 2021 it was agreed with HMRC that £2.2m of this VAT was recoverable and was refunded to the Group.
The Group will use shares held in the Employee Benefit Trust ('EBT') and treasury shares to satisfy future requirements for shares under the Group’s share option and long-term incentive plans. On 19 April 2021, 13m ordinary 2 1/15p shares were allotted to the EBT for an aggregate nominal value of £268,667 to satisfy exercises under the Group’s share plans. The total consideration received in respect of these shares was £268,667. In the six months to 30 June 2021, 5,194,329 (30 June 2020: nil) shares with a value of £2.4m were transferred out of the EBT to satisfy exercises under the Group's share option and long term incentive plans. The total consideration received in respect of these shares was £nil (30 June 2020: £nil).
The Group has an unexpired authority to repurchase up to 10% of its issued share capital.
16 CommitmentsAt 30 June 2021, amounts contracted for but not provided in the financial statements for the acquisition of property, plant and equipment amounted to £5.9m (31 December 2020: £5.3m).
In September 2020, the Group settled a liability relating to past services received under supplier software licence agreements which had previously been disclosed as a contingent liability. The settlement includes a commitment to future purchases of £79m, of which £74m remains - £1m over the period to 31 December 2021 and £73m (payable in US dollars) over the period to 30 June 2024. The Group has forecasts that support the requirement for such products and services. These products are important in supporting the delivery of future performance obligations and digital solutions for the Group's customers and will therefore benefit the Group.
38

17 Related-party transactionsCompensation of key management personnel
30 June 2021£m
30 June 2020 £m
Short-term employment benefits 4.2 3.4Pension 0.2 0.1Share based payments 1.8 1.1
6.2 4.6
Gains on share options exercised in the period by Capita plc Executive Directors were £nil (30 June 2020: £0.1m) and by key management personnel £1.0m (30 June 2020: £nil).
During the period, the Group rendered administrative services to Smart DCC Ltd, a wholly-owned subsidiary which is not consolidated. The Group received £49.1m (30 June 2020: £71.2m) of revenue for these services. The services are procured by Smart DCC Ltd on an arm’s length basis under the DCC licence. The services are subject to review by Ofgem to ensure that all costs are economically and efficiently incurred by Smart DCC Ltd.
Capita Pension and Life Assurance Scheme is a related party of the Group.
18 Contingent liabilitiesContingent liabilities represent potential future cash outflows which are either not probable or cannot be measured reliably.
The Group has provided, through the normal course of its business, performance bonds and bank guarantees of £29.4m (31 December 2020: £55.8m).
The Group is in discussions with a number of its life insurance clients, the outcomes and timings of which are uncertain, that could result in the continuation of contracts with amended terms or the termination of contracts. If a contract is terminated, the Group may incur associated costs, accelerate the recognition of deferred income or the impairment of contract assets. Since the outcome of these discussions is uncertain, the Group has not made any provision for a future outflow of funds that might result from the eventual outcome of the discussions.
During 2020, a provision was recognised for an onerous contract in Customer Management. The contract has a clause such that the customer can continue to extend the contract indefinitely. Accordingly, judgement is required in assessing the remaining length of the contract to determine the amount of the provision. Management considered previous discussions with the client regarding their intentions and experiences on other contracts, and concluded the best estimate of the remaining contract term is the current contractually committed period to 2023. However, the contract may end earlier or be extended for longer, resulting in a material release or increase in the provision in future accounting periods.
The Group completed the disposal of its Capita Asset Services businesses, including CFM, to the Link Group on 3 November 2017. As part of the sale of the Capita Asset Services businesses, Capita plc provided an indemnity against certain legacy claims.
The Group's entities are parties to legal actions and claims which arise in the normal course of business. The Group needs to apply judgement in determining the merit of litigation against it and the chances of a claim being successfully made. It needs to determine the likelihood of an outflow of economic benefits occurring and whether there is a need to disclose a contingent liability or whether a provision might be required due to the probability assessment.
At any time there are a number of claims or notifications that need to be assessed across the Group. The disparate nature of the Group's entities heightens the risk that not all potential claims are known at any point in time. Under the transformation programme, the central support functions including commercial and legal were strengthened and a Chief General Counsel has been appointed. This enhances the processes to assess the likelihood of historical claims arising.
19 Finance transformationIn 2018, the Board launched a multi-year transformation programme to support the objectives of simplifying and strengthening Capita. The programme includes initiatives to improve the Group’s financial reporting systems, processes and controls, by increasing standardisation, automation and the quality of available data.
The new financial systems in support of this programme were originally scheduled for go live in the second half of 2019. While progress was made, the go-live was deferred as more work was required on the core processes and procedures before the system could be effectively implemented. As such, the Group impaired £12.3m of the carrying value of the system investment at 31 December 2019, representing areas that were expected to be redesigned before going live. Several interim activities were progressed during 2020 and the first half of 2021 and the technical asset including the IT infrastructure, software and codebase have been preserved and remain ready to deploy. The Group has continued to invest in shared service centres and offshoring, and in making improvements to the Group’s existing reporting systems, processes and controls. No further impairment has been recorded on the footing that the solution remains fit for purpose. The carrying value of the investment at 30 June 2021 was £58.5m.
The carrying value of the asset will be kept under review through the next phase of the Group’s transformation to assess for any triggers for impairment should there be a material change to the Group’s operating model.
39

20 Post balance sheet eventsThere are no post balance sheet events that have an adjusting effect on these condensed consolidated financial statements.
The following events occurred after 30 June 2021, and before the approval of these condensed consolidated financial statements, but have not resulted in adjustment to these financial results:
Disposal of Education Software Solutions (ESS)
The disposal of the ESS business to Tiger UK Bidco Limited, a newly formed company established by funds advised by Montagu Private Equity (Montagu), completed on 1 February 2021. Cash proceeds of £298.5m were received, with net assets disposed of £51.8m. Refer to note 4.
Montagu also agreed to invest in ParentPay (Holdings) Limited (ParentPay), a provider of education technology. Following successful completion of both investments, ESS will become part of ParentPay Group. Montagu’s agreed investment in ParentPay was subject to regulatory approval which was obtained in July 2021. As a result additional cash proceeds of £45m, which were contingent on this regulatory approval, were received by Capita. In assessing the fair value of the consideration at 30 June 2021, the Board concluded that as the regulatory approval was not concluded and was outside the control of a willing buyer, it should be excluded. No asset was therefore recorded at 30 June 2021.
Disposal of AXELOS Limited
The disposal of the Group's interest in AXELOS Limited to PeopleCert International Limited completed on 29 July 2021. Cash proceeds of £182.2m were received on completion. This includes the settlement of intercompany balances owed by AXELOS Limited to the Group of £27.2m, but not cash dividends totalling £11.1m paid by AXELOS Limited to the Group in the period. Costs of disposal to be borne by the Group are estimated to be £10.4m (of which £8.0m were recognised at 30 June 2021).
40

Independent review report to Capita plcConclusionWe have been engaged by the company to review the condensed set of financial statements in the half-yearly financial report for the six months ended 30 June 2021 which comprises condensed consolidated income statement and condensed consolidated statement of comprehensive income for the six-month period ended 30 June 2021, condensed consolidated balance sheet as at 30 June 2021, condensed consolidated statement of changes in equity and condensed consolidated cash flow statement for the six-month period ended 30 June 2021 and the related explanatory notes.
Based on our review, nothing has come to our attention that causes us to believe that the condensed set of financial statements for the six months ended 30 June 2021 is not prepared, in all material respects, in accordance with IAS 34 Interim Financial Reporting as adopted for use in the UK and the Disclosure Guidance and Transparency Rules (“the DTR”) of the UK’s Financial Conduct Authority (“the UK FCA”).
Material uncertainty related to going concernWe draw attention to note 2 to the condensed set of financial statements which indicates that the group may require completion of its planned disposal programme or a refinancing. Both require agreements and consents from third parties which are not within the direct control of the company. These events and conditions, along with the other matters explained in note 2 (d), constitute material uncertainties that may cast significant doubt on the group’s ability to continue as a going concern.
Our conclusion is not modified in respect of this matter.
Scope of reviewWe conducted our review in accordance with International Standard on Review Engagements (UK and Ireland) 2410 Review of Interim Financial Information Performed by the Independent Auditor of the Entity issued by the Auditing Practices Board for use in the UK. A review of interim financial information consists of making enquiries, primarily of persons responsible for financial and accounting matters, and applying analytical and other review procedures. We read the other information contained in the half-yearly financial report and consider whether it contains any apparent misstatements or material inconsistencies with the information in the condensed set of financial statements.
A review is substantially less in scope than an audit conducted in accordance with International Standards on Auditing (UK) and consequently does not enable us to obtain assurance that we would become aware of all significant matters that might be identified in an audit. Accordingly, we do not express an audit opinion.
Directors’ responsibilitiesThe half-yearly financial report is the responsibility of, and has been approved by, the directors. The directors are responsible for preparing the half-yearly financial report in accordance with the DTR of the UK FCA.
As disclosed in note 2, the latest annual financial statements of the group were prepared in accordance with International Financial Reporting Standards adopted pursuant to Regulation (EC) No 1606/2002 as it applies in the European Union and in accordance with international accounting standards in conformity with the requirements of the Companies Act 2006 and the next annual financial statements will be prepared in accordance with UK-adopted international accounting standards. The directors are responsible for preparing the condensed set of financial statements included in the half-yearly financial report in accordance with IAS 34 as adopted for use in the UK.
Our responsibilityOur responsibility is to express to the company a conclusion on the condensed set of financial statements in the half-yearly financial report based on our review.
The purpose of our review work and to whom we owe our responsibilitiesThis report is made solely to the company in accordance with the terms of our engagement to assist the company in meeting the requirements of the DTR of the UK FCA. Our review has been undertaken so that we might state to the company those matters we are required to state to it in this report and for no other purpose. To the fullest extent permitted by law, we do not accept or assume responsibility to anyone other than the company for our review work, for this report, or for the conclusions we have reached.
Robert Brent
for and on behalf of KPMG LLP
Chartered Accountants15 Canada SquareLondonE14 5GL
5 August 2021
41

Appendix - alternative performance measuresThe Group presents various alternative performance measures (APMs) because the Directors believe that these are helpful for users of the financial statements in providing a balanced view of, and relevant information on, the Group’s financial performance, position and cash flows. This includes key performance indicators (KPIs) such as the return on capital employed, interest cover and gearing ratios by which the Directors monitor performance.
30 June 2021
30 June 2020 Source
Revenue – continuing operations
Reported revenue £1,619.4m £1,682.7m Line item in income statement
Deduct: business exit revenue (£34.7m) (£100.6m) Line item in note 4
1. Adjusted revenue £1,584.7m £1,582.1m
Operating profit – continuing operations
Reported operating profit/(loss) £40.8m (£34.6m) Line item in income statement
Adjusting items in note 3 £25.9m £51.0m
2. Adjusted operating profit1 £66.7m £16.4m
Adjusted operating profit margin 4.2% 1.0% Adjusted operating profit/adjusted revenue
1 Adjusted operating profit excludes items that are separately disclosed and considered to be outside the underlying operating results for the particular period under review and against which the Group’s performance is assessed.
30 June 2021
31 December 2020 Source
ROCE (based on rolling 12-months)
Adjusted operating profit1 a £128.9m £78.7m
Adjusted tax rate2 b 22.7% 26.1%
Tax c = a x b £29.3m £20.5m Adjusted operating profit multiplied by tax rate
Adjusted operating profit after tax d = a – c £99.6m £58.2m Adjusted operating profit less tax
Share capital e £34.8m £34.5m Line information in balance sheet
Share premium f £1,145.5m £1,143.3m Line information in balance sheet
Employee benefit trust and treasury shares g (£9.1m) (£11.2m) Line information in balance sheet
Capital redemption reserve h £1.8m £1.8m Line information in balance sheet
Total net liabilities from financing activities i £1,191.4m £1,217.5m Line information in note 13
Total capital employed j = e+f+g+h+i
£2,364.4m £2,385.9m Used as current year capital employed balance in average capital employed
Prior year capital employed k £2,634.5m £2,643.7m Used as prior period capital employed balance in average employed
Average capital employed l = (j+k)/2 £2,499.5m £2,514.8m
3. ROCE m = d/l 4.0% 2.3%
1. Adjusted operating profit excludes items that are separately disclosed and considered to be outside the underlying operating results for the particular period under review and against which the Group’s performance is assessed.
2. The effective tax rate for 30 June 2021 has been calculated after excluding the one-off gains described in note 8 that resulted in a 80.8% overall effective tax benefit on adjusted profits for the period.
42

Post IFRS 16 Pre IFRS 16
30 June2021
31 December2020
30 June2021
31 December2020
Headline gearing (based on rolling 12-months)
Adjusted profit before tax1 £89.3m £33.0m £100.9m £39.4m
Add back: adjusted net finance costs £40.0m £46.6m £18.8m £22.7m
Add back: adjusted depreciation and impairment on property, plant and equipment
£49.3m £52.7m £49.4m £52.7m
Add back: depreciation on right-of-use assets £78.4m £88.2m £—m £—m
Add back: adjusted amortisation and impairment on intangibles
£20.5m £41.1m £21.8m £41.1m
Remove: Share of results in associates and investment gains
(£3.1m) (£0.8m) (£3.1m) (£0.8m)
Adjusted EBITDA a £274.4m £260.8m £187.8m £155.1m
Impact of business exits on adjusted EBITDA2 £35.1m £86.7m £35.1m £86.5m
Adjusted EBITDA including business exits b £309.5m £347.5m £222.9m £241.6m
Headline net debt £894.4m £1,077.1m £894.4m £1,077.1m Line information in note 13
Remove IFRS 16 impact £—m £—m £466.6m £508.1m
Net debt c £894.4m £1,077.1m £427.8m £569.0m
4. Headline net debt to adjusted EBITDA ratio including business exits
c/b 2.9x 3.1x 1.9x 2.4x
1. Adjusted operating profit excludes items that are separately disclosed and considered to be outside the underlying operating results for the particular period under review and against which the Group’s performance is assessed.
2. 2020 includes the impact of business exits ESS and Axelos on Adjusted EBITDA as the proceeds were not received until after the balance sheet date. In 2021 proceeds were received for ESS and therefore the rolling 12-months adjusted EBITDA ending 30 June 2021 excludes ESS.
43
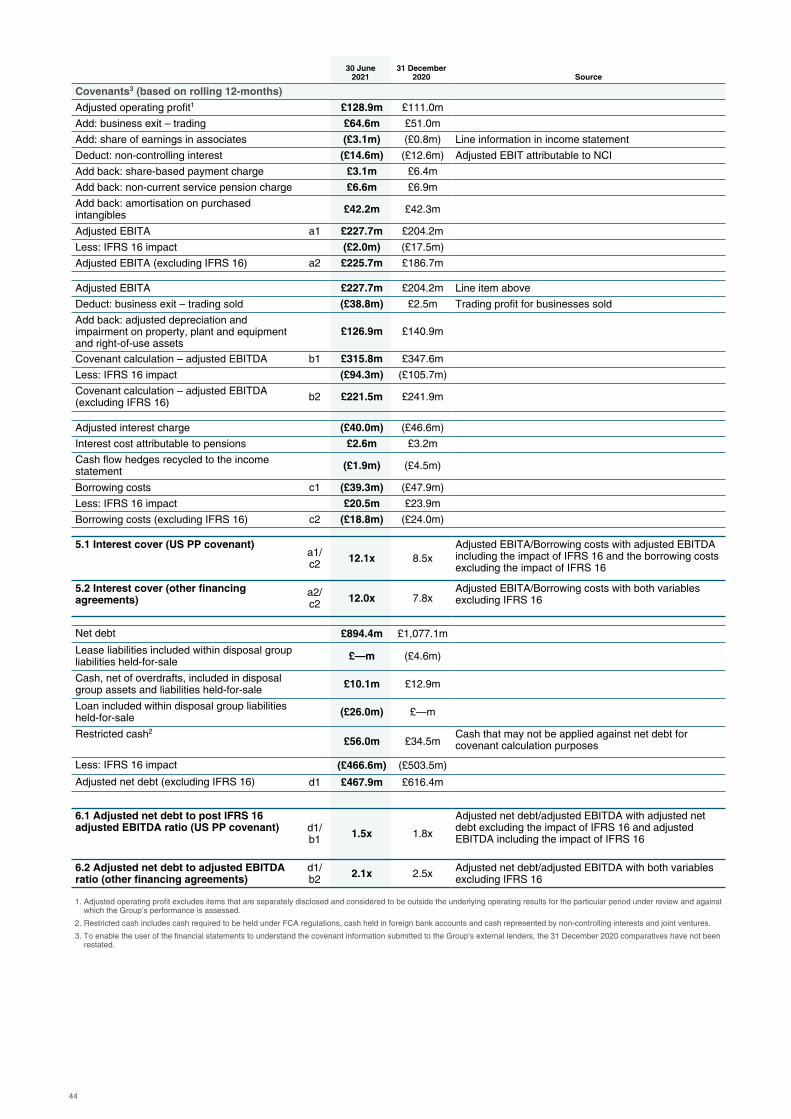
30 June2021
31 December2020 Source
Covenants3 (based on rolling 12-months)
Adjusted operating profit1 £128.9m £111.0m
Add: business exit – trading £64.6m £51.0m
Add: share of earnings in associates (£3.1m) (£0.8m) Line information in income statement
Deduct: non-controlling interest (£14.6m) (£12.6m) Adjusted EBIT attributable to NCI
Add back: share-based payment charge £3.1m £6.4m
Add back: non-current service pension charge £6.6m £6.9m
Add back: amortisation on purchased intangibles £42.2m £42.3m
Adjusted EBITA a1 £227.7m £204.2m
Less: IFRS 16 impact (£2.0m) (£17.5m)
Adjusted EBITA (excluding IFRS 16) a2 £225.7m £186.7m
Adjusted EBITA £227.7m £204.2m Line item above
Deduct: business exit – trading sold (£38.8m) £2.5m Trading profit for businesses sold
Add back: adjusted depreciation and impairment on property, plant and equipment and right-of-use assets
£126.9m £140.9m
Covenant calculation – adjusted EBITDA b1 £315.8m £347.6m
Less: IFRS 16 impact (£94.3m) (£105.7m)
Covenant calculation – adjusted EBITDA (excluding IFRS 16) b2 £221.5m £241.9m
Adjusted interest charge (£40.0m) (£46.6m)
Interest cost attributable to pensions £2.6m £3.2m
Cash flow hedges recycled to the income statement (£1.9m) (£4.5m)
Borrowing costs c1 (£39.3m) (£47.9m)
Less: IFRS 16 impact £20.5m £23.9m
Borrowing costs (excluding IFRS 16) c2 (£18.8m) (£24.0m)
5.1 Interest cover (US PP covenant)a1/c2 12.1x 8.5x
Adjusted EBITA/Borrowing costs with adjusted EBITDA including the impact of IFRS 16 and the borrowing costs excluding the impact of IFRS 16
5.2 Interest cover (other financing agreements)
a2/c2 12.0x 7.8x
Adjusted EBITA/Borrowing costs with both variables excluding IFRS 16
Net debt £894.4m £1,077.1m
Lease liabilities included within disposal group liabilities held-for-sale £—m (£4.6m)
Cash, net of overdrafts, included in disposal group assets and liabilities held-for-sale £10.1m £12.9m
Loan included within disposal group liabilities held-for-sale (£26.0m) £—m
Restricted cash2
£56.0m £34.5mCash that may not be applied against net debt for covenant calculation purposes
Less: IFRS 16 impact (£466.6m) (£503.5m)
Adjusted net debt (excluding IFRS 16) d1 £467.9m £616.4m
6.1 Adjusted net debt to post IFRS 16 adjusted EBITDA ratio (US PP covenant) d1/
b1 1.5x 1.8x
Adjusted net debt/adjusted EBITDA with adjusted net debt excluding the impact of IFRS 16 and adjusted EBITDA including the impact of IFRS 16
6.2 Adjusted net debt to adjusted EBITDA ratio (other financing agreements)
d1/b2 2.1x 2.5x Adjusted net debt/adjusted EBITDA with both variables
excluding IFRS 16
1. Adjusted operating profit excludes items that are separately disclosed and considered to be outside the underlying operating results for the particular period under review and against which the Group’s performance is assessed.
2. Restricted cash includes cash required to be held under FCA regulations, cash held in foreign bank accounts and cash represented by non-controlling interests and joint ventures.
3. To enable the user of the financial statements to understand the covenant information submitted to the Group's external lenders, the 31 December 2020 comparatives have not been restated.
44