firstgroup plc half-yearly results for six months...
TRANSCRIPT
1
Wednesday 5 November 2014
FIRSTGROUP PLC HALF-YEARLY RESULTS FOR
SIX MONTHS TO 30 SEPTEMBER 2014
Group overview:
Trading for the first half was in line with management’s expectations and our multi-year transformation programme is on track
Encouraging progress with First Student turnaround and good performances in First Transit and UK Rail
Core Greyhound customers and some local UK Bus markets not yet seeing benefit of improving economic trends
Reported revenue decreased by 10.9%, in part reflecting structural changes in Rail revenues which have no material impact on operating profit, prior period revenues from UK Bus operations now sold/closed, and foreign exchange. Excluding these items, revenue increased by 3.9%
Adjusted operating profit increased by 2.4% and adjusted attributable profit more than doubled
Statutory operating profit decreased by 11.5%, with prior period benefitting from gain on UK Bus disposals
Seasonally higher mid-year net debt: EBITDA ratio of 2.5 times (2.2 times as at 31 March 2014). Five year, £800m revolving credit facility signed in the period
On course to achieve our medium term financial targets
H1 2014 H1 2013
restated1
Change
Revenue £2,941.1m £3,300.7m (10.9)% Adjusted2 - EBITDA3 £253.3m £260.5m (2.8)% - Operating profit £103.6m £101.2m +2.4% - Profit before tax £33.3m £19.6m +69.9% - Attributable profit £21.6m £10.3m +109.7% - EPS4 1.8p 1.1p +63.6% Statutory - Operating profit £80.2m £90.6m (11.5)% - Profit/(loss) before tax £9.9m £(8.0)m n/m5 - Attributable profit/(loss) £3.1m £(1.1)m n/m5 - EPS4 0.3p (0.1)p n/m5 Net debt6 £1,403.2m £1,446.8m (3.0)% 1 Prior period financial information throughout this statement has been restated due to the reclassification of certain items – see note 1 for details. 2 Before amortisation charges and certain other items as set out in note 3. All references to ‘adjusted’ figures throughout this document are defined in this way. 3 Adjusted operating profit less capital grant amortisation plus depreciation. 4 Change in EPS is less than for profit attributable to ordinary shareholders due to the increased weighted average number of shares in issue fo llowing the rights issue completed in H1 2013 - see note 7 for details. 5 Period on period percentage change not meaningful. 6 Net debt is stated excluding accrued bond interest.
Operating summary:
First Student – above inflation price increases achieved from our contract portfolio pricing strategy during the 2014/15 bid season
First Transit – delivered good financial performance with modest capital requirements
Greyhound – continued revenue growth despite core customers not yet seeing benefits of economic recovery
UK Bus – revenues and margins on track, underpinned by cost efficiencies and our actions to increase volumes
UK Rail – robust passenger revenue growth and strong operating performance continues; positive updates on First Great Western and TransPennine Express franchises
Commenting, Chief Executive Tim O’Toole said: “Trading during the first half was in line with our expectations for the Group and our transformation programmes continue to make progress as planned. We are on track to meet our expectations for the full year. Our annual profits and cash flows are always weighted to the second half because of the overlay of the school year in North America on our financial year. As previously indicated, that weighting will be even greater than usual this financial year because
2
of the lower number of First Student operating days in this first half, together with the timing of annual pricing adjustments to offset inflation and further cost saving actions in UK Bus, which will take place principally in the second half. “First Student’s profitability in the second half will benefit from the price increases achieved in the recent bid season on approximately one third of our buses. Further progress in future bid seasons, together with continued delivery of cost savings, will be required to offset the cost inflation experienced on our contracts. First Transit and UK Rail divisions are expected to continue to deliver solid operating performances, with the second half results likely to be principally driven by the timing of contracts in both divisions. In Greyhound we will remain focused on actively managing our variable costs in response to macroeconomic trends affecting our core customers. Now that the major network redesigns and selected fare rebasing actions have taken place in UK Bus, we are in a better position to cover off cost inflation through annual price increases, underpinned by continued cost efficiencies. We will continue to target volume growth through improving our services and investing in fleet and technology, reflecting the local needs of our customers and communities. “In the period we welcomed the news that the Department for Transport intends to negotiate a longer direct award to at least March 2019 for our largest rail franchise First Great Western. We were one of three bidders shortlisted for the TransPennine Express franchise competition from February 2016 and we are also in negotiations for a direct award to operate the franchise up until then. Although we were very disappointed not to secure any of the franchise competition awards announced in the period, it does not change our medium term objective for rail franchising which is to achieve earnings on a par with the last round of franchising, with an acceptable level of risk. “We are confident that the multi-year plans we are executing across the Group will deliver sustainable improvements in shareholder value.” For further information please contact: FirstGroup plc: Rachael Borthwick, Group Corporate Communications Director Faisal Tabbah, Group Investor Relations Manager Stuart Butchers, Group Head of Media Tel: +44 (0) 20 7725 3354 Brunswick PR: Michael Harrison/Andrew Porter Tel: +44 (0) 20 7404 5959
A presentation to investors and analysts will be held at 9:00AM today Attendance is by invitation
A live telephone ‘listen in’ facility is available For joining details please contact +44 (0) 20 7725 3354
A playback facility will be available at www.firstgroupplc.com/investors.aspx
Photos for media are available, please call +44 (0) 20 7725 3354
3
CHAIRMAN'S STATEMENT
The overall position of the Group in the first half is broadly in line with my last report, however we have made progress in several important areas. In this regard, I would note in particular First Student’s contract portfolio pricing improvements this year, and the continued progress of the UK Bus transformation plan. We have appointed a strong and experienced Board of Directors, have improved balance sheet stability, and continue to review opportunities to accelerate the return of the Group to full health. Overall financial performance was in line with our expectations. While our results in the period improved, some of the most important developments have yet to manifest themselves, but should support improvement going forward. Notwithstanding that revenue was lower as anticipated, adjusted operating profit increased by 2.4%, adjusted profit before tax was 69.9% higher, and adjusted profit attributable to ordinary shareholders increased by 109.7%. Although we are encouraged by this performance, the Group earns the majority of its profit during the second half of the financial year, so maintaining the momentum built up in the year to date is clearly critical. Of particular significance is turning around the operating performance of our bus operations in the UK and North America. Our plans also include increased investment in both fleet and customer-facing technology throughout the Group, to restore or enhance the competitiveness of our services and support long term growth opportunities. Over time, these actions will result in increased cash flow, allowing the Group to reduce leverage and the associated interest burden towards its optimum long term level. In the period we welcomed the announcement by the Department for Transport (‘DfT’) that it intends to negotiate a direct award for our largest rail franchise, First Great Western, to 2019 or beyond. We were also one of three bidders recently shortlisted in the competition to operate the new TransPennine Express franchise from March 2016. We were however disappointed not to secure the renewal of the ScotRail franchise. The Group has run this successfully since 2004, and delivered improvements across every measurable score in that time. We were unsuccessful in three other bids, but these were awarded at economic levels that were unacceptable to us. Overall we were and remain disciplined in our approach to bidding for significant contracts. As one of the largest and most experienced rail operators, we believe we will achieve our medium term desired position in the rail industry over time, at an acceptable level of risk. All of this said, the Board has reviewed thoroughly the business plans, and while comfortable that these are appropriate we continue to keep expense and capital expenditure plans under review for further opportunities. We have also reviewed strategic alternatives, but nothing compelling has become evident. We will nevertheless also keep this aspect under review. I remain convinced that the Group has an attractive portfolio of transport businesses - each a leader in its market, with good prospects - and that the process of turning this into an acceptable returns for shareholders is underway, but yet to be delivered. It is with regret however that I am required to step down from the chairmanship of FirstGroup at the AGM in July 2015, so early in my tenure, in order to fully dedicate myself to the significant task of bringing Barclays to full health. The process to appoint a suitable successor is now underway, led by Senior Independent Director Drummond Hall. In the meantime, I remain confident that with resolute focus on executing and improving the plans currently in place, we will see the expected improvements in shareholder value. John McFarlane Chairman
4
OPERATING AND FINANCIAL REVIEW
GROUP RESULTS Reported Group revenue decreased by 10.9% in the period to £2,941.1m (H1 2013: £3,300.7m), principally reflecting the end of revenue support in First Great Western and First Capital Connect, a reduction in First ScotRail subsidy (with a matching reduction in track access charges), non-recurring revenues from UK Bus operations sold or closed in the prior period and foreign exchange translation. Excluding these items, revenue increased by 3.9%. Adjusted operating profit increased by 2.4% to £103.6m (H1 2013: £101.2m), principally reflecting increased profits in UK Rail, offset by lower profits in First Student due to the reduced number of operating days in the period. Group margins increased, with improvements principally in UK Bus and UK Rail divisions. Adjusted profit attributable to ordinary shareholders more than doubled to £21.6m (H1 2013: £10.3m), due to higher adjusted operating profit and lower net finance costs. Adjusted basic EPS increased by a lower percentage to 1.8p (H1 2013: 1.1p), due to the increased weighted average number of shares in issue following the rights issue completed in the prior period. Adjusted EBITDA decreased 2.8% to £253.3m (H1 2013: £260.5m). All references to ‘adjusted’ figures throughout this document are before amortisation charges and certain other items as set out in note 3. Statutory operating profit was £80.2m (H1 2013: £90.6m), reflecting the gain on disposal of London operations in UK Bus in the prior period. The seasonally higher mid-year net debt: EBITDA ratio was 2.5 times as at 30 September 2014, compared with 2.2 times as at the last year end on 31 March 2014. ROCE was 7.8%, compared with 7.9% for the twelve months to 30 September 2013.
6 months to 30 September 2014
Restated 6 months to 30 September 2013
Year to 31 March 2014
Revenue
Operating profit1
Operating margin1
Revenue
Operating profit1
Operating margin1
Revenue
Operating profit1
Operating margin1
Divisional results £m £m % £m £m % £m £m % First Student 605.7 4.5 0.7 666.4 10.4 1.6 1,467.4 93.5 6.4
First Transit 410.2 29.5 7.2 408.7 31.4 7.7 811.9 60.3 7.4
Greyhound 314.0 29.9 9.5 333.7 32.1 9.6 624.6 46.4 7.4
UK Bus 449.2 16.9 3.8 490.7 15.9 3.2 930.2 44.4 4.8
UK Rail 1,155.6 40.0 3.5 1,395.2 25.8 1.8 2,870.1 55.2 1.9
Group2 6.4 (17.2) 6.0 (14.4) 13.2 (31.8)
Total Group 2,941.1 103.6 3.5 3,300.7 101.2 3.1 6,717.4 268.0 4.0
North America in US Dollars $m $m % $m $m % $m $m % First Student 1,013.1 6.0 0.6 1,029.7 17.3 1.7 2,339.3 152.8 6.5
First Transit 687.7 49.3 7.2 630.8 48.6 7.7 1,290.5 95.7 7.4
Greyhound 527.0 50.3 9.5 514.7 49.6 9.6 990.6 73.2 7.4
Total North America 2,227.8 105.6 4.7 2,175.2 115.5 5.3 4,620.4 321.7 7.0
1Adjusted. 2 Tramlink operations, central management and other items.
FIRST STUDENT First Student’s overall US Dollar revenue was $1,013.1m or £605.7m (H1 2013: $1,029.7m or £666.4m). As previously indicated, the reduction of 1.6% on a US Dollar basis is principally due to fewer operating days in the first half than the prior period as a result of the timing of the Easter school vacation. Adjusted operating profit was $6.0m or £4.5m (H1 2013: $17.3m or £10.4m), resulting in a US Dollar margin of 0.6% (H1 2013: 1.7%), with the reductions principally reflecting the drop through to operating profit of the lower number of operating days. First Student’s operating results will therefore be even more weighted to the second half this year than usual. As a result of our successful bid season, we expect full year revenues to be around the top end of our planning range, with the benefits of improved contract pricing in the new school year being primarily a second half effect. Notwithstanding the ongoing headwind of cost inflation running slightly ahead of price indexation on our multi-year contracts, we continue to expect the proportion of low margin contracts in our portfolio to be below 30% for the full year (from 36% before this bid season), and for operating margins to be in excess of 7.5% for the current financial year. We remain on track to meet our medium term target of double digit margins for First Student. We continue to make progress with our turnaround plans, including addressing contract portfolio pricing on new bids and renewals to ensure that we achieve appropriate returns on capital on our contract portfolio. As is typical, approximately one third of our bus portfolio was up for renewal this year, and we were pleased to achieve average price increases on these contracts of approximately 4.5%. We did so whilst maintaining a contract retention rate of 90% on those contracts up for bid, which was at the upper end of our range of expectations. Together with some
5
organic growth, ‘share shift’ wins from competitors, a modest level of conversions from in-house operations, and a small tuck-in acquisition in New York, we would expect the overall bus portfolio at the end of the current year to be broadly similar to the prior year. As we continue to work through our contract portfolio in future years, our focus will remain on only winning or retaining business on terms that deliver an appropriate return. In addition to the pricing strategy, First Student continues to target a further $50m per annum of cost reductions by 2017. Good progress on overhead management and enforcing best practice procedures across all cost categories delivered $6m of cost reductions in the period. We expect further opportunities in maintenance, procurement and fuel efficiency in the second half to increase cost savings to approximately $20m for the full year. We continue to increase our use of technology to raise customer service levels, promote environmental benefits and differentiate our services. MyFirstPass, a system that gives parents and schools timely information on student ridership through swipe card technology continues to be deployed in selected locations, and our FOCUS GPS system enables us to manage cost and provide real time location information. We continue to offer propane bus solutions where appropriate, and our DriveSmart systems have continued to increase fuel efficiency and reduce cost. In addition our more systematic approach to securing non-school charter work, which is attractive from an asset utilisation perspective, delivered growth of 7.9% in the period. First Student’s turnaround programme has taken an important step forward with the pricing success achieved in this year’s bid season, and while we are encouraged by this progress, continuing vigilance on our costs and bidding strategy will be required to deliver our medium term objectives. FIRST TRANSIT Revenue in our First Transit division was $687.7m or £410.2m (H1 2013: $630.8m or £408.7m), 9.0% higher in US Dollar terms reflecting a number of contract start-ups in the first half. However the rate of growth is expected to moderate in the second half with fewer start-ups and two of our larger contracts rolling off. Adjusted operating profit was $49.3m or £29.5m (H1 2013: $48.6m or £31.4m), resulting in a US Dollar margin of 7.2% (H1 2013: 7.7%). As previously indicated, for the year as a whole we expect revenue growth of approximately 4%, and margins in line with our medium term target of around 7%. Our First Transit division operates approximately 370 contracts covering several transit service and vehicle maintenance sub-segments across North America. Although the average contract size is less than $5m, these typically three to five year contracts vary in size, with the largest being $50m in annual revenues or more. Through our management and bidding expertise, we typically achieve high contract retention rates, with additional growth from new business wins, outsourcing opportunities and organic growth under existing contracts. Whilst all of these trends continue, this year two of our larger contracts will come to an end in the second half and few recently awarded contracts will start up in the second half. We continue to see a range of contract opportunities across our markets, and continue to win business. For example, we have recently been awarded paratransit contracts in Florida and the San Francisco Bay area, some of which begin early in the next financial year. In addition, we utilised expertise from our UK-based divisions and First Transit’s existing client relationships to win business in the North American Bus Rapid Transit (BRT) market. Meanwhile, we continue to see further opportunities to grow our shuttle business in the years ahead, which is the only part of the business which requires significant capital investment. Contract commencements in the first half, including two major contracts for the Chicago Regional Transportation Authority, have gone to plan. Our national service platform, technology infrastructure and management expertise enable us to continue to deliver meaningful cost savings compared with public provision. We continue to invest in our industry-leading technology including a suite of innovative solutions, which include our upgraded management information dashboard, predictive maintenance analytics, paperless engineering shop systems, and mobile-enabled apps allowing registered riders to monitor service disruptions, timetables and the location of services in real time. These innovations deliver cost efficiencies and better information for our clients, and improved financial performance for First Transit. By remaining at the forefront of the industry in terms of technology, coupled with our high level of investment in our people and long-standing customer and industry relationships, First Transit will continue to deliver attractive growth and margins in this relatively low capital intensity business.
6
GREYHOUND During the first half of the year like-for-like US Dollar revenue increased by 2.7%, at the lower end of our range of expectations. Although the US economy is now growing overall, Greyhound’s core customers continue to see negligible real wage growth, and despite improvements in headline employment, underemployment remains a significant factor in this demographic. Revenue was $527.0m or £314.0m (H1 2013: $514.7m or £333.7m). Greyhound Express continued to grow profitably, with like-for-like revenue growth of 5.8% in the first half. Greyhound’s operating profit was $50.3m or £29.9m (H1 2013: $49.6m or £32.1m), resulting in a US Dollar margin of 9.5% (H1 2013: 9.6%). In response to demand, we continue to actively manage our variable costs in order to deliver margin improvement year on year. Meanwhile we are on track with our programme to roll out the real-time pricing, yield management and customer relationship management capabilities which are key to delivering our medium term target of 12% margins. Our traditional Greyhound product today remains a cyclical business. In recent years we have improved our ability to flex costs in response to changes in demand and we continue to invest in the quality of our services, but we remain dependent on the financial position of our predominantly value-focused core customers. Replicating the successful business model we have developed in our newer point-to-point services will give our traditional Greyhound business the tools it needs to stimulate and manage passenger demand more effectively. As we have previously indicated, equipping the traditional Greyhound business with real-time pricing and yield management capabilities, together with the related customer relationship management tools, is a significant project that will help to mitigate the impact of the economic cycle. The programme is progressing well, and is on track to be fully operational across Greyhound’s network over the next 12 months. In the period a redesigned and more smartphone-friendly Greyhound homepage and a BoltBus passenger app were launched. Innovations such as these have increased the importance of the web as a sales channel: now over 55% of all our transactions. Within web sales, mobile is the fastest growing category - with mobile transactions growing at more than 30% in the first half. Greater adoption of web and mobile sales channels achieves two objectives: it will improve our ability to communicate yield and price management actions to customers, making them more effective; and it highlights the price benefits of advance purchases for customers, which in turn enables us to operate more efficiently as we have increased visibility of demand. Further customer relationship management enhancements are planned for the next twelve months. We also increased traditional marketing efforts in conjunction with Greyhound’s 100th anniversary, in order to drive additional interest in our improved offering. We have begun taking pricing and yield management actions in certain regions and gathering the resulting data, in order to help refine the requirements of the nationwide systems and processes that are being developed. We also launched an app for BoltBus drivers, which streamlines boarding and allows us to manage inventory better. Both the BoltBus passenger and driver apps are acting as test beds for similar products to be launched in the next twelve months across the much larger and more complex traditional Greyhound network. UK BUS The UK Bus transformation programme continues to move forward in line with our step by step programme to restore double digit margins over the medium term. In the first half, like-for-like passenger volumes increased by 2.1%, as a result of our efforts to stimulate volume growth in part through selected fare rebasing and improved quality of service. Within this, concession volumes were broadly flat, whilst commercial passenger volumes increased by over 3% for the division as a whole. UK Bus has now achieved 17 consecutive months of commercial passenger volume growth. Like-for-like passenger revenue also increased by 2.1% in line with volumes, indicating no net yield growth for the division overall, as expected at this stage of our transformation programme. Reported revenue was £449.2m (H1 2013: £490.7m, of which £56.0m related to revenues from depots sold or closed, principally in London). As previously indicated, we anticipate making greater revenue progress in the second half, which is expected to benefit from continued volume growth, while parts of the portfolio will begin to make annual inflation-based price increases in line with peers. In the period operating profit increased to £16.9m (H1 2013: £15.9m) and operating margin increased to 3.8% (H1 2013: 3.2%), despite £1.8m of restructuring costs taken to adjusted operating profit in the first half which are not expected to recur. We delivered cost reductions relating to productivity, fuel efficiency and engineering/maintenance savings of approximately £6m in the period, and we expect to achieve double that amount during the second half. These cost efficiencies and the operating leverage of the division to increasing passenger volumes are expected to benefit margins in the second half. Across our portfolio, we continue to see significant variations in performance driven by the underlying economic conditions in each of our local markets. Having completed our programme of major network designs and selected
7
fare rebasing throughout the business, the locally-based management teams now in place ensure our commercial propositions are responsive to the particular needs of our local communities. Our investment continues to improve efficiency and raise customer satisfaction. Mobile ticketing has now been rolled out across all of our networks, ahead of schedule. This important sales channel is seeing encouraging growth and supports our customer relationship building strategy, while improving operational efficiency. Roll out of smartcards across selected networks has also continued during the first half of the year. Further roll outs in the second half are ongoing, as we determine the appropriate approach on a local market-by-market basis. In the half we also took delivery of 170 of our order of 274 Wrightbus MicroHybrid Streetlites, one of the most fuel efficient buses on the market, with the remaining 104 to be delivered in the second half. Our services supported a number of high profile events in partnership with the communities we serve during the period, including the Glasgow 2014 Commonwealth Games, the Ryder Cup, and the IPC European Athletics Championships in Swansea. We continue to explore opportunities to work in closer partnership with local authorities throughout our markets, as our objective to get more people onto buses typically aligns very well with their ambition to reduce congestion and stimulate economic activity. In West Yorkshire we are actively supporting a partnership approach, building on the success we have had in this market by increasing both passenger satisfaction and volumes. We believe the proposal currently tabled by all operators would enable the over-arching objective of the Combined Authority to be realised, which is to see the bus deliver its full potential in supporting the growth of the city region. Going forward, we are a sponsor of Bristol European Green Capital 2015 - the first time a UK city has received this honour - with both our bus and rail divisions supporting the Mayor of Bristol’s ambitions for integrated green transport. While there is still some way to go, we are on course with our programme to restore double digit margins to UK Bus by delivering revenue increases through sustained passenger volume growth, underpinned by periodic inflation-based price increases and operating leverage, whilst delivering further cost efficiencies. UK RAIL The UK rail industry continues to demonstrate resilient growth across the country, with passenger numbers rising to a post-war high of 1.6bn nationwide in 2013/14. We continue to benefit from this robust growth across all of our franchises, with like-for-like passenger revenue increasing by 6.5%. On a reported basis revenues declined to £1,155.6m (H1 2013: £1,395.2m), principally reflecting a reduction in First ScotRail subsidy (with a matching reduction in track access charges, so does not affect operating profit), and the end of revenue support arrangements in First Great Western and First Capital Connect. In the period First Great Western returned to normal commercial terms under the current direct award. Overall financial performance was toward the top of our range of expectations. Operating profit increased to £40.0m (H1 2013: £25.8m), representing a margin of 3.5% (H1 2013: 1.8%). Underlying passenger volume growth increased by 3.5% in the half. Our operating companies have outperformed the industry in delivering customer satisfaction improvements since 2006. In the recent National Passenger Survey all of our train operating companies saw steady or increased customer satisfaction ratings, with First ScotRail and First Hull Trains recording their highest ever scores. In October ScotRail was awarded Rail Operator of the Year at the National Transport Awards for the third time in six years. Since the period end, First TransPennine Express became the first rail company to receive the British Quality Foundation’s UK Excellence Award for their quality management model. We continue to innovate and improve our service offerings for passengers. We are in the midst of the largest roll out of free Wi-Fi in the UK rail industry at First ScotRail and First Great Western, connecting more trains and stations every month, while our open access operator First Hull Trains recently became the first UK transport operator to trial free 4G single-sign-up Wi-Fi providing faster, more reliable service and a seamless connection between the train and station Wi-Fi. The service gives access to ITV content on board for mobile devices regardless of the strength of signal at the train’s location. During the period we became the first rail operator to give passengers the opportunity to earn Nectar loyalty points when booking their journeys online across all of our operating companies. In the period we were one of three bidders that were shortlisted for the competition to run the next TransPennine Express franchise, which is due to be awarded in October 2015. We are also negotiating a direct award with the DfT to continue operating First TransPennine Express between its current end date on 31 March 2015 and the start of the new franchise in February 2016. In June we submitted our bid to operate the InterCity East Coast franchise from March 2015, the winner of which is due to be announced in November 2014. After the period end the DfT released an

8
updated timetable for its rail franchising programme, confirming their intention to negotiate a direct award with the Group to continue running our largest franchise First Great Western through to March 2019, with a further extension of up to one year at the DfT’s discretion. This underscores their confidence in our ability to deliver stability, good value and better services for Great Western passengers during a period when a substantial programme of infrastructure upgrades will take place on the network and new trains are to be introduced. Naturally we were disappointed not to secure any of the franchise competition awards announced in the period, though it does not change our medium term objective for rail franchising: which is to achieve earnings on a par with the last round of franchising, with an acceptable level of risk. We are one of the largest and most experienced operators in the industry, with a strong track record of balancing service improvements for customers, affordability for taxpayers and adequate returns for shareholders, and we will continue to bid on a range of future rail franchises in that same disciplined but ambitious way. We worked to ensure the handover of First Capital Connect was seamless for both passengers and employees, and we will continue to focus on their needs as we operate the First ScotRail franchise through to its handover on 1 April 2015. OUTLOOK Trading during the first half was in line with our expectations for the Group and our transformation programmes continue to make progress as planned. We are on track to meet our expectations for the full year. Our annual profits and cash flows are always weighted to the second half because of the overlay of the school year in North America on our financial year. As previously indicated, that weighting will be even greater than usual this financial year because of the lower number of First Student operating days in this first half, together with the timing of annual pricing adjustments to offset inflation and further cost saving actions in UK Bus, which will take place principally in the second half. First Student’s profitability in the second half will benefit from the price increases achieved in the recent bid season on approximately one third of our buses. Further progress in future bid seasons, together with continued delivery of cost savings, will be required to offset the cost inflation experienced on our contracts. First Transit and UK Rail divisions are expected to continue to deliver solid operating performances, with the second half results likely to be principally driven by the timing of contracts in both divisions. In Greyhound we will remain focused on actively managing our variable costs in response to macroeconomic trends affecting our core customers. Now that the major network redesigns and selected fare rebasing actions have taken place in UK Bus, we are in a better position to cover off cost inflation through annual price increases, underpinned by continued cost efficiencies. We will continue to target volume growth through improving our services and investing in fleet and technology, reflecting the local needs of our customers and communities. We are confident that the multi-year plans we are executing across the Group will deliver sustainable improvements in shareholder value.
9
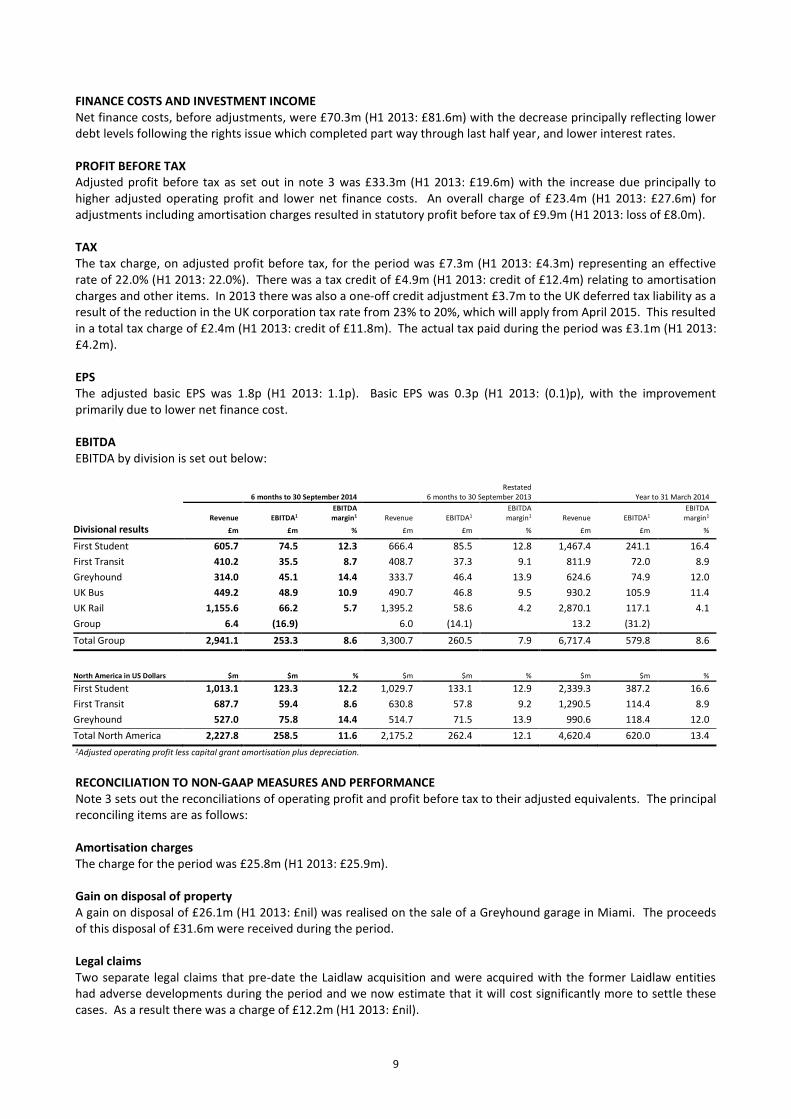
FINANCE COSTS AND INVESTMENT INCOME Net finance costs, before adjustments, were £70.3m (H1 2013: £81.6m) with the decrease principally reflecting lower debt levels following the rights issue which completed part way through last half year, and lower interest rates. PROFIT BEFORE TAX Adjusted profit before tax as set out in note 3 was £33.3m (H1 2013: £19.6m) with the increase due principally to higher adjusted operating profit and lower net finance costs. An overall charge of £23.4m (H1 2013: £27.6m) for adjustments including amortisation charges resulted in statutory profit before tax of £9.9m (H1 2013: loss of £8.0m). TAX The tax charge, on adjusted profit before tax, for the period was £7.3m (H1 2013: £4.3m) representing an effective rate of 22.0% (H1 2013: 22.0%). There was a tax credit of £4.9m (H1 2013: credit of £12.4m) relating to amortisation charges and other items. In 2013 there was also a one-off credit adjustment £3.7m to the UK deferred tax liability as a result of the reduction in the UK corporation tax rate from 23% to 20%, which will apply from April 2015. This resulted in a total tax charge of £2.4m (H1 2013: credit of £11.8m). The actual tax paid during the period was £3.1m (H1 2013: £4.2m). EPS The adjusted basic EPS was 1.8p (H1 2013: 1.1p). Basic EPS was 0.3p (H1 2013: (0.1)p), with the improvement primarily due to lower net finance cost. EBITDA EBITDA by division is set out below:
6 months to 30 September 2014
Restated 6 months to 30 September 2013
Year to 31 March 2014
Revenue
EBITDA1
EBITDA margin1
Revenue
EBITDA1
EBITDA margin1
Revenue
EBITDA1
EBITDA margin1
Divisional results £m £m % £m £m % £m £m % First Student 605.7 74.5 12.3 666.4 85.5 12.8 1,467.4 241.1 16.4
First Transit 410.2 35.5 8.7 408.7 37.3 9.1 811.9 72.0 8.9
Greyhound 314.0 45.1 14.4 333.7 46.4 13.9 624.6 74.9 12.0
UK Bus 449.2 48.9 10.9 490.7 46.8 9.5 930.2 105.9 11.4
UK Rail 1,155.6 66.2 5.7 1,395.2 58.6 4.2 2,870.1 117.1 4.1
Group 6.4 (16.9) 6.0 (14.1) 13.2 (31.2)
Total Group 2,941.1 253.3 8.6 3,300.7 260.5 7.9 6,717.4 579.8 8.6
North America in US Dollars
$m
$m
%
$m
$m
%
$m
$m
% First Student 1,013.1 123.3 12.2 1,029.7 133.1 12.9 2,339.3 387.2 16.6
First Transit 687.7 59.4 8.6 630.8 57.8 9.2 1,290.5 114.4 8.9
Greyhound 527.0 75.8 14.4 514.7 71.5 13.9 990.6 118.4 12.0
Total North America 2,227.8 258.5 11.6 2,175.2 262.4 12.1 4,620.4 620.0 13.4
1Adjusted operating profit less capital grant amortisation plus depreciation.
RECONCILIATION TO NON-GAAP MEASURES AND PERFORMANCE Note 3 sets out the reconciliations of operating profit and profit before tax to their adjusted equivalents. The principal reconciling items are as follows: Amortisation charges The charge for the period was £25.8m (H1 2013: £25.9m). Gain on disposal of property A gain on disposal of £26.1m (H1 2013: £nil) was realised on the sale of a Greyhound garage in Miami. The proceeds of this disposal of £31.6m were received during the period. Legal claims Two separate legal claims that pre-date the Laidlaw acquisition and were acquired with the former Laidlaw entities had adverse developments during the period and we now estimate that it will cost significantly more to settle these cases. As a result there was a charge of £12.2m (H1 2013: £nil).
10
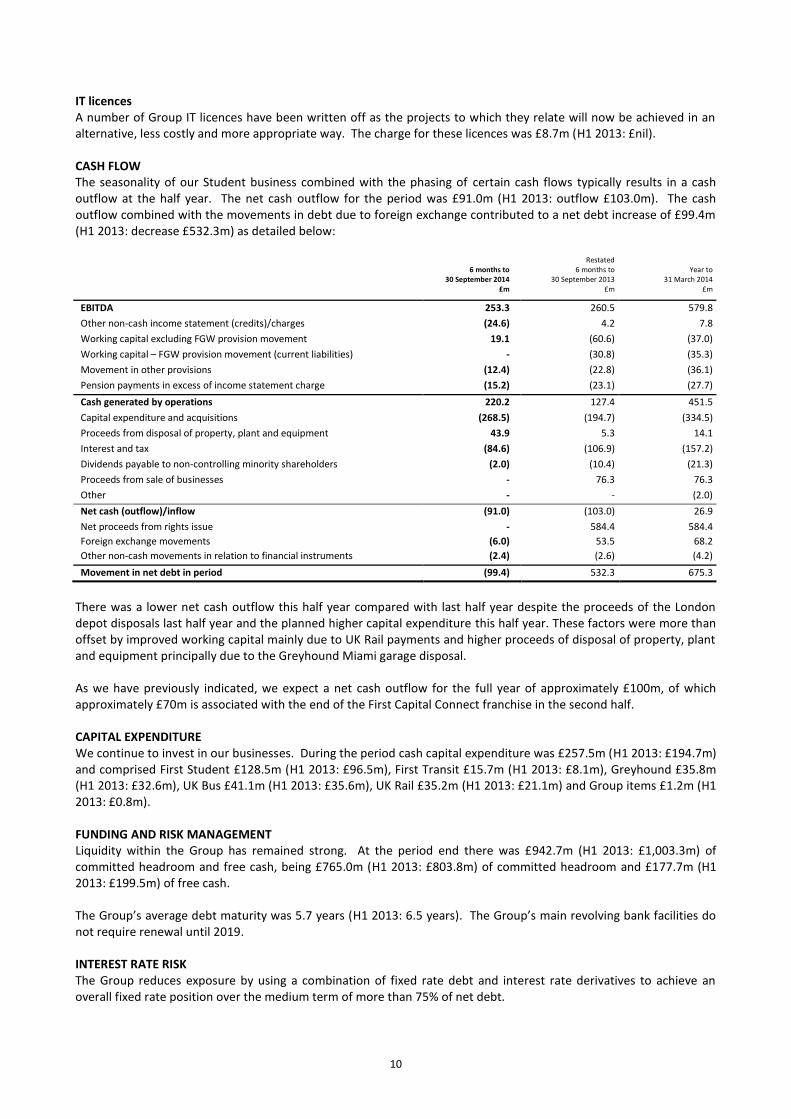
IT licences A number of Group IT licences have been written off as the projects to which they relate will now be achieved in an alternative, less costly and more appropriate way. The charge for these licences was £8.7m (H1 2013: £nil). CASH FLOW The seasonality of our Student business combined with the phasing of certain cash flows typically results in a cash outflow at the half year. The net cash outflow for the period was £91.0m (H1 2013: outflow £103.0m). The cash outflow combined with the movements in debt due to foreign exchange contributed to a net debt increase of £99.4m (H1 2013: decrease £532.3m) as detailed below:
6 months to
30 September 2014
Restated 6 months to
30 September 2013
Year to
31 March 2014 £m £m £m
EBITDA 253.3 260.5 579.8
Other non-cash income statement (credits)/charges (24.6) 4.2 7.8
Working capital excluding FGW provision movement 19.1 (60.6) (37.0)
Working capital – FGW provision movement (current liabilities) - (30.8) (35.3)
Movement in other provisions (12.4) (22.8) (36.1)
Pension payments in excess of income statement charge (15.2) (23.1) (27.7)
Cash generated by operations 220.2 127.4 451.5
Capital expenditure and acquisitions (268.5) (194.7) (334.5)
Proceeds from disposal of property, plant and equipment 43.9 5.3 14.1
Interest and tax (84.6) (106.9) (157.2)
Dividends payable to non-controlling minority shareholders (2.0) (10.4) (21.3)
Proceeds from sale of businesses - 76.3 76.3
Other - - (2.0)
Net cash (outflow)/inflow (91.0) (103.0) 26.9
Net proceeds from rights issue - 584.4 584.4
Foreign exchange movements (6.0) 53.5 68.2
Other non-cash movements in relation to financial instruments (2.4) (2.6) (4.2)
Movement in net debt in period (99.4) 532.3 675.3
There was a lower net cash outflow this half year compared with last half year despite the proceeds of the London depot disposals last half year and the planned higher capital expenditure this half year. These factors were more than offset by improved working capital mainly due to UK Rail payments and higher proceeds of disposal of property, plant and equipment principally due to the Greyhound Miami garage disposal. As we have previously indicated, we expect a net cash outflow for the full year of approximately £100m, of which approximately £70m is associated with the end of the First Capital Connect franchise in the second half. CAPITAL EXPENDITURE We continue to invest in our businesses. During the period cash capital expenditure was £257.5m (H1 2013: £194.7m) and comprised First Student £128.5m (H1 2013: £96.5m), First Transit £15.7m (H1 2013: £8.1m), Greyhound £35.8m (H1 2013: £32.6m), UK Bus £41.1m (H1 2013: £35.6m), UK Rail £35.2m (H1 2013: £21.1m) and Group items £1.2m (H1 2013: £0.8m). FUNDING AND RISK MANAGEMENT Liquidity within the Group has remained strong. At the period end there was £942.7m (H1 2013: £1,003.3m) of committed headroom and free cash, being £765.0m (H1 2013: £803.8m) of committed headroom and £177.7m (H1 2013: £199.5m) of free cash. The Group’s average debt maturity was 5.7 years (H1 2013: 6.5 years). The Group’s main revolving bank facilities do not require renewal until 2019. INTEREST RATE RISK The Group reduces exposure by using a combination of fixed rate debt and interest rate derivatives to achieve an overall fixed rate position over the medium term of more than 75% of net debt.
11
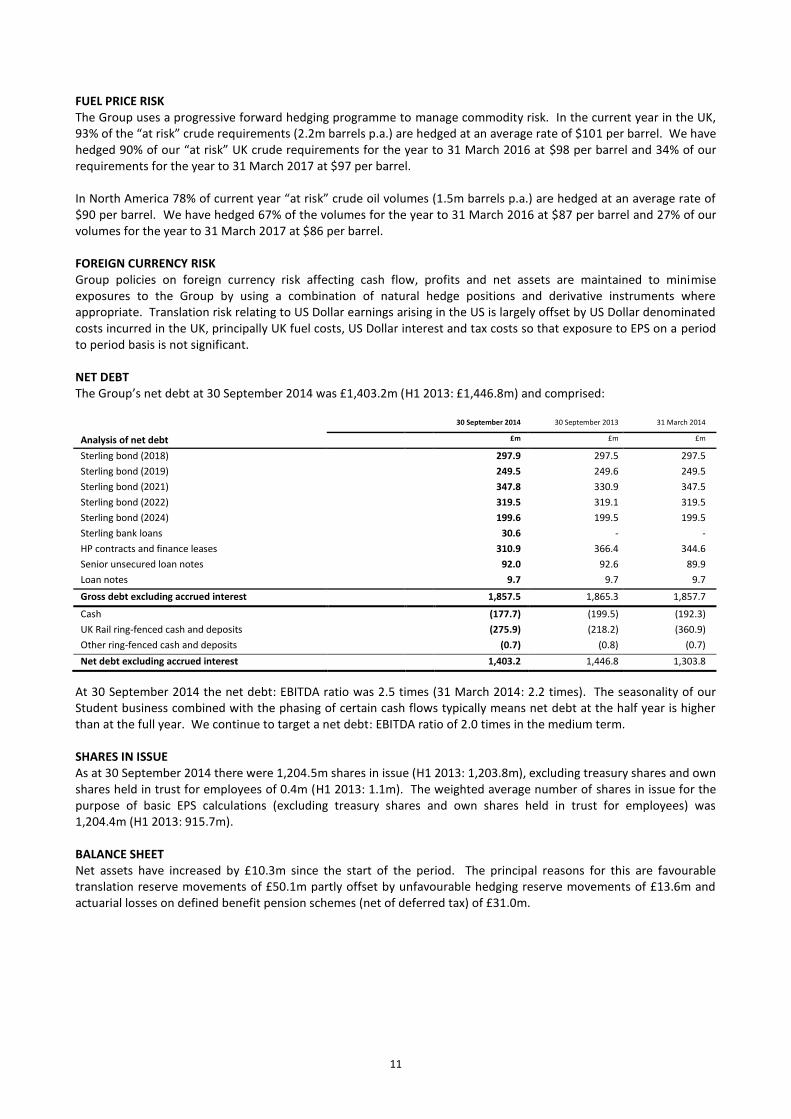
FUEL PRICE RISK The Group uses a progressive forward hedging programme to manage commodity risk. In the current year in the UK, 93% of the “at risk” crude requirements (2.2m barrels p.a.) are hedged at an average rate of $101 per barrel. We have hedged 90% of our “at risk” UK crude requirements for the year to 31 March 2016 at $98 per barrel and 34% of our requirements for the year to 31 March 2017 at $97 per barrel. In North America 78% of current year “at risk” crude oil volumes (1.5m barrels p.a.) are hedged at an average rate of $90 per barrel. We have hedged 67% of the volumes for the year to 31 March 2016 at $87 per barrel and 27% of our volumes for the year to 31 March 2017 at $86 per barrel. FOREIGN CURRENCY RISK Group policies on foreign currency risk affecting cash flow, profits and net assets are maintained to minimise exposures to the Group by using a combination of natural hedge positions and derivative instruments where appropriate. Translation risk relating to US Dollar earnings arising in the US is largely offset by US Dollar denominated costs incurred in the UK, principally UK fuel costs, US Dollar interest and tax costs so that exposure to EPS on a period to period basis is not significant. NET DEBT The Group’s net debt at 30 September 2014 was £1,403.2m (H1 2013: £1,446.8m) and comprised:
30 September 2014 30 September 2013 31 March 2014
Analysis of net debt £m £m £m
Sterling bond (2018) 297.9 297.5 297.5
Sterling bond (2019) 249.5 249.6 249.5
Sterling bond (2021) 347.8 330.9 347.5
Sterling bond (2022) 319.5 319.1 319.5
Sterling bond (2024) 199.6 199.5 199.5
Sterling bank loans 30.6 - -
HP contracts and finance leases 310.9 366.4 344.6
Senior unsecured loan notes 92.0 92.6 89.9
Loan notes 9.7 9.7 9.7
Gross debt excluding accrued interest 1,857.5 1,865.3 1,857.7
Cash (177.7) (199.5) (192.3)
UK Rail ring-fenced cash and deposits (275.9) (218.2) (360.9)
Other ring-fenced cash and deposits (0.7) (0.8) (0.7)
Net debt excluding accrued interest 1,403.2 1,446.8 1,303.8
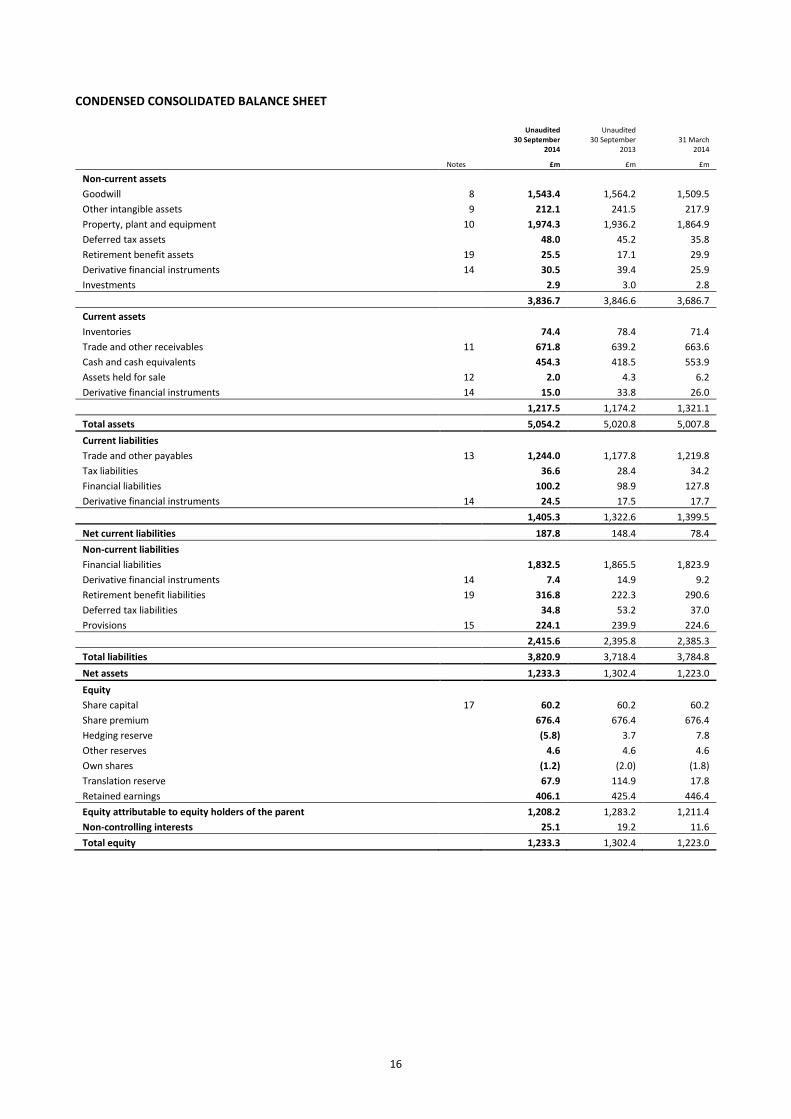
At 30 September 2014 the net debt: EBITDA ratio was 2.5 times (31 March 2014: 2.2 times). The seasonality of our Student business combined with the phasing of certain cash flows typically means net debt at the half year is higher than at the full year. We continue to target a net debt: EBITDA ratio of 2.0 times in the medium term. SHARES IN ISSUE As at 30 September 2014 there were 1,204.5m shares in issue (H1 2013: 1,203.8m), excluding treasury shares and own shares held in trust for employees of 0.4m (H1 2013: 1.1m). The weighted average number of shares in issue for the purpose of basic EPS calculations (excluding treasury shares and own shares held in trust for employees) was 1,204.4m (H1 2013: 915.7m). BALANCE SHEET Net assets have increased by £10.3m since the start of the period. The principal reasons for this are favourable translation reserve movements of £50.1m partly offset by unfavourable hedging reserve movements of £13.6m and actuarial losses on defined benefit pension schemes (net of deferred tax) of £31.0m.
12
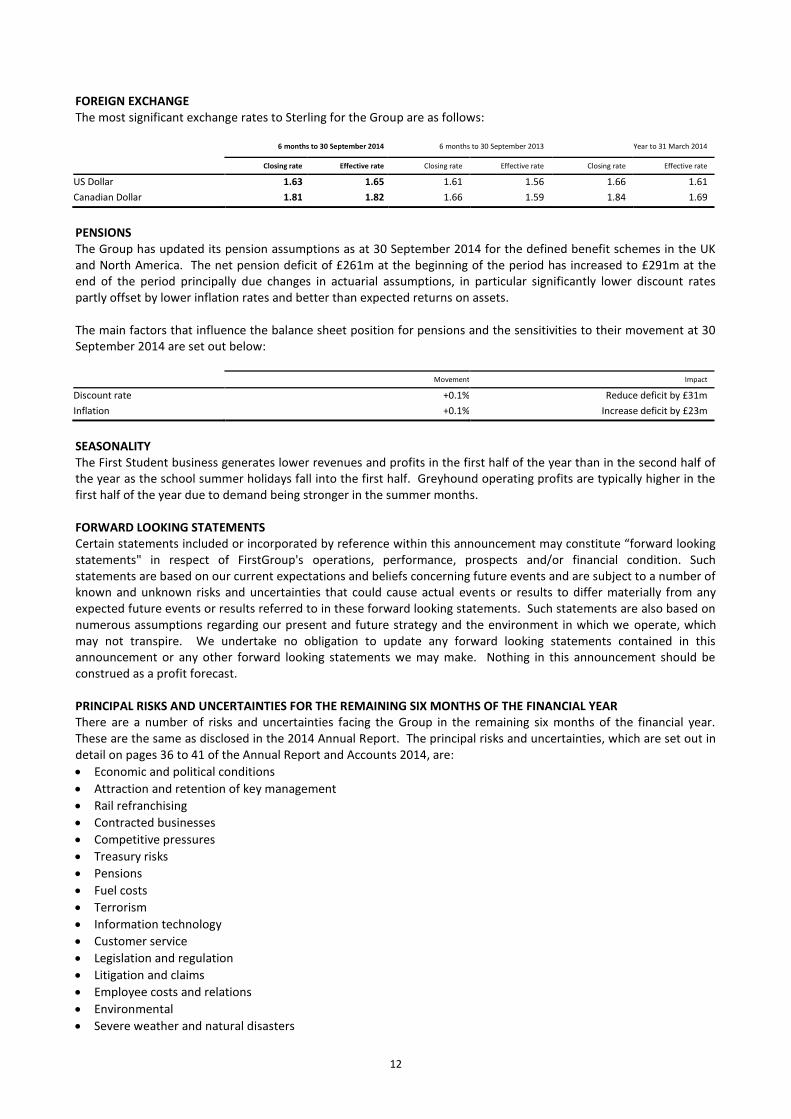
FOREIGN EXCHANGE The most significant exchange rates to Sterling for the Group are as follows:
6 months to 30 September 2014
6 months to 30 September 2013
Year to 31 March 2014
Closing rate Effective rate Closing rate Effective rate Closing rate Effective rate
US Dollar 1.63 1.65 1.61 1.56 1.66 1.61
Canadian Dollar 1.81 1.82 1.66 1.59 1.84 1.69
PENSIONS The Group has updated its pension assumptions as at 30 September 2014 for the defined benefit schemes in the UK and North America. The net pension deficit of £261m at the beginning of the period has increased to £291m at the end of the period principally due changes in actuarial assumptions, in particular significantly lower discount rates partly offset by lower inflation rates and better than expected returns on assets. The main factors that influence the balance sheet position for pensions and the sensitivities to their movement at 30 September 2014 are set out below:
Movement Impact
Discount rate +0.1% Reduce deficit by £31m
Inflation +0.1% Increase deficit by £23m
SEASONALITY The First Student business generates lower revenues and profits in the first half of the year than in the second half of the year as the school summer holidays fall into the first half. Greyhound operating profits are typically higher in the first half of the year due to demand being stronger in the summer months. FORWARD LOOKING STATEMENTS Certain statements included or incorporated by reference within this announcement may constitute “forward looking statements" in respect of FirstGroup's operations, performance, prospects and/or financial condition. Such statements are based on our current expectations and beliefs concerning future events and are subject to a number of known and unknown risks and uncertainties that could cause actual events or results to differ materially from any expected future events or results referred to in these forward looking statements. Such statements are also based on numerous assumptions regarding our present and future strategy and the environment in which we operate, which may not transpire. We undertake no obligation to update any forward looking statements contained in this announcement or any other forward looking statements we may make. Nothing in this announcement should be construed as a profit forecast. PRINCIPAL RISKS AND UNCERTAINTIES FOR THE REMAINING SIX MONTHS OF THE FINANCIAL YEAR There are a number of risks and uncertainties facing the Group in the remaining six months of the financial year. These are the same as disclosed in the 2014 Annual Report. The principal risks and uncertainties, which are set out in detail on pages 36 to 41 of the Annual Report and Accounts 2014, are:
Economic and political conditions
Attraction and retention of key management
Rail refranchising
Contracted businesses
Competitive pressures
Treasury risks
Pensions
Fuel costs
Terrorism
Information technology
Customer service
Legislation and regulation
Litigation and claims
Employee costs and relations
Environmental
Severe weather and natural disasters
13
OTHER INFORMATION Unless otherwise stated, all financial figures refer to the six month period ended 30 September 2014 (the ‘period’, ‘the first half’ or ‘H1 2014’), with growth compared to the same period in 2013 (the ‘prior period’, ‘H1 2013’). No account is taken of foreign exchange translation effects in the description of divisional performance and outlook. RESPONSIBILITY STATEMENT We confirm to the best of our knowledge:
The condensed set of financial statements has been prepared in accordance with IAS34 ‘Interim Financial Reporting’;
The interim management report includes a fair review of the information required by DTR 4.27R (indication of important events during the first six months and description of principal risks and uncertainties for the remaining six months of the year); and
The interim management report includes a fair review of the information required by DTR 4.28R (disclosure of related parties’ transaction and changes therein).
Tim O’Toole Chris Surch Chief Executive Group Finance Director 5 November 2014 5 November 2014
14
CONDENSED CONSOLIDATED INCOME STATEMENT
Unaudited 6 months to 30
September 2014
Unaudited 6 months to 30
September 2013 Year to
31 March 2014
Total Total Total
Notes £m £m £m
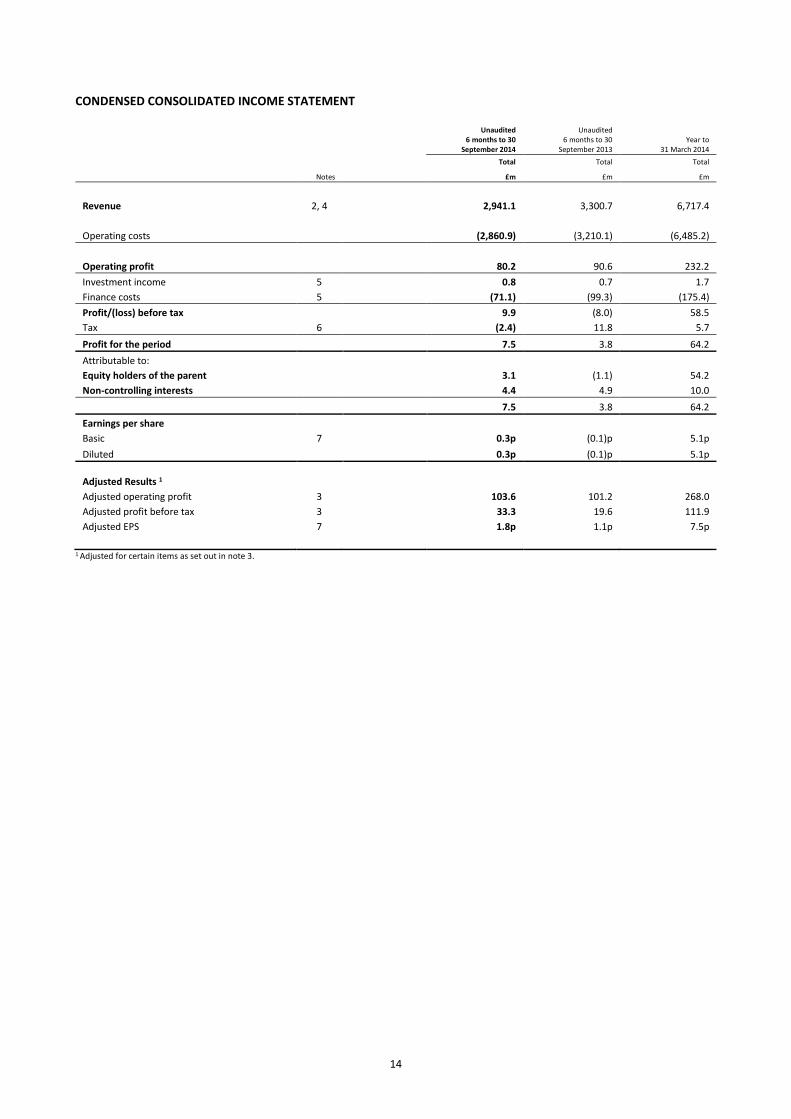
Revenue 2, 4 2,941.1 3,300.7 6,717.4
Operating costs (2,860.9) (3,210.1) (6,485.2)
Operating profit 80.2 90.6 232.2
Investment income 5 0.8 0.7 1.7
Finance costs 5 (71.1) (99.3) (175.4)
Profit/(loss) before tax 9.9 (8.0) 58.5
Tax 6 (2.4) 11.8 5.7
Profit for the period 7.5 3.8 64.2
Attributable to:
Equity holders of the parent 3.1 (1.1) 54.2
Non-controlling interests 4.4 4.9 10.0
7.5 3.8 64.2
Earnings per share
Basic 7 0.3p (0.1)p 5.1p
Diluted 0.3p (0.1)p 5.1p
Adjusted Results 1
Adjusted operating profit 3 103.6 101.2 268.0
Adjusted profit before tax 3 33.3 19.6 111.9
Adjusted EPS 7 1.8p 1.1p 7.5p
1 Adjusted for certain items as set out in note 3.
15
CONDENSED CONSOLIDATED STATEMENT OF COMPREHENSIVE INCOME
Unaudited 6 months to
30 September 2014
Unaudited 6 months to
30 September 2013
Year to
31 March 2014
£m £m £m
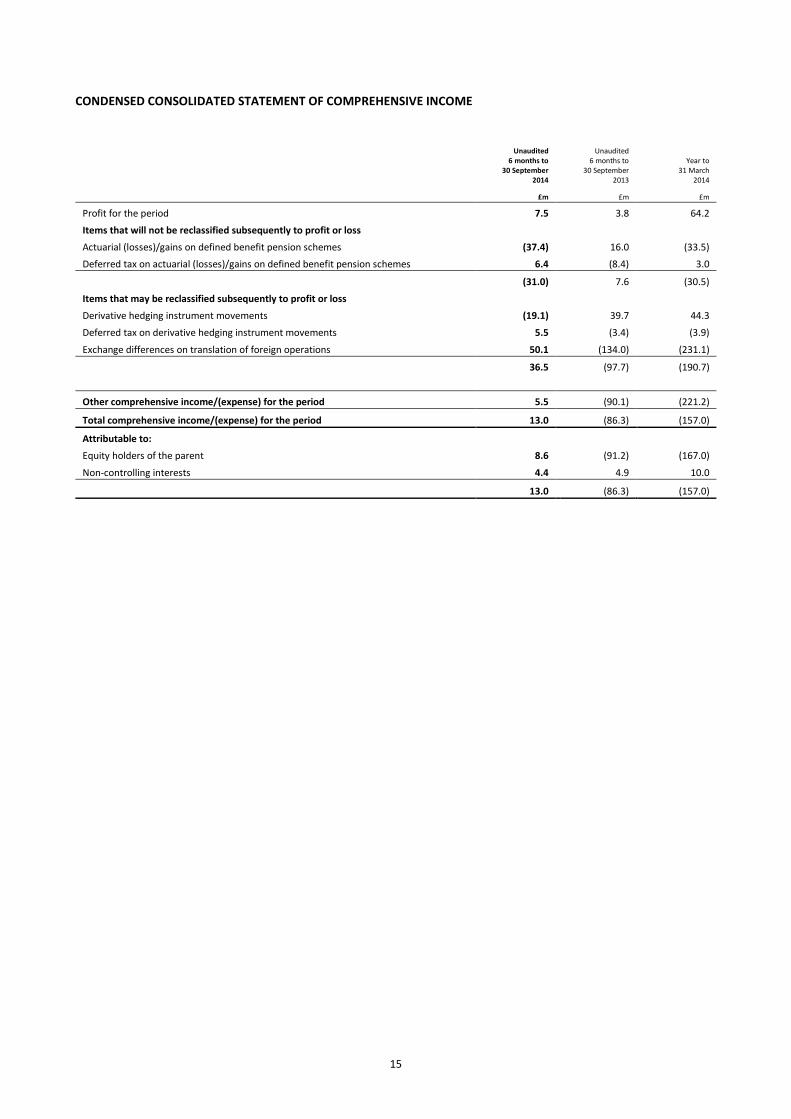
Profit for the period 7.5 3.8 64.2
Items that will not be reclassified subsequently to profit or loss
Actuarial (losses)/gains on defined benefit pension schemes (37.4) 16.0 (33.5)
Deferred tax on actuarial (losses)/gains on defined benefit pension schemes 6.4 (8.4) 3.0
(31.0) 7.6 (30.5)
Items that may be reclassified subsequently to profit or loss
Derivative hedging instrument movements (19.1) 39.7 44.3
Deferred tax on derivative hedging instrument movements 5.5 (3.4) (3.9)
Exchange differences on translation of foreign operations 50.1 (134.0) (231.1)
36.5 (97.7) (190.7)
Other comprehensive income/(expense) for the period 5.5 (90.1) (221.2)
Total comprehensive income/(expense) for the period 13.0 (86.3) (157.0)
Attributable to:
Equity holders of the parent 8.6 (91.2) (167.0)
Non-controlling interests 4.4 4.9 10.0
13.0 (86.3) (157.0)
16
CONDENSED CONSOLIDATED BALANCE SHEET
Unaudited 30 September
2014
Unaudited 30 September
2013
31 March
2014
Notes £m £m £m
Non-current assets
Goodwill 8 1,543.4 1,564.2 1,509.5
Other intangible assets 9 212.1 241.5 217.9
Property, plant and equipment 10 1,974.3 1,936.2 1,864.9
Deferred tax assets 48.0 45.2 35.8
Retirement benefit assets 19 25.5 17.1 29.9
Derivative financial instruments 14 30.5 39.4 25.9
Investments 2.9 3.0 2.8
3,836.7 3,846.6 3,686.7
Current assets
Inventories 74.4 78.4 71.4
Trade and other receivables 11 671.8 639.2 663.6
Cash and cash equivalents 454.3 418.5 553.9
Assets held for sale 12 2.0 4.3 6.2
Derivative financial instruments 14 15.0 33.8 26.0
1,217.5 1,174.2 1,321.1
Total assets 5,054.2 5,020.8 5,007.8
Current liabilities
Trade and other payables 13 1,244.0 1,177.8 1,219.8
Tax liabilities 36.6 28.4 34.2
Financial liabilities 100.2 98.9 127.8
Derivative financial instruments 14 24.5 17.5 17.7
1,405.3 1,322.6 1,399.5
Net current liabilities 187.8 148.4 78.4
Non-current liabilities
Financial liabilities 1,832.5 1,865.5 1,823.9
Derivative financial instruments 14 7.4 14.9 9.2
Retirement benefit liabilities 19 316.8 222.3 290.6
Deferred tax liabilities 34.8 53.2 37.0
Provisions 15 224.1 239.9 224.6
2,415.6 2,395.8 2,385.3
Total liabilities 3,820.9 3,718.4 3,784.8
Net assets 1,233.3 1,302.4 1,223.0
Equity
Share capital 17 60.2 60.2 60.2
Share premium 676.4 676.4 676.4
Hedging reserve (5.8) 3.7 7.8
Other reserves 4.6 4.6 4.6
Own shares (1.2) (2.0) (1.8)
Translation reserve 67.9 114.9 17.8
Retained earnings 406.1 425.4 446.4
Equity attributable to equity holders of the parent 1,208.2 1,283.2 1,211.4
Non-controlling interests 25.1 19.2 11.6
Total equity 1,233.3 1,302.4 1,223.0
17
CONDENSED CONSOLIDATED STATEMENT OF CHANGES IN EQUITY
Share
capital
Share
premium
Hedging reserve
Other
reserves
Own
shares
Translation
reserve
Retained earnings
Total
Non-controlling
interests
Total
equity
£m £m £m £m £m £m £m £m £m £m
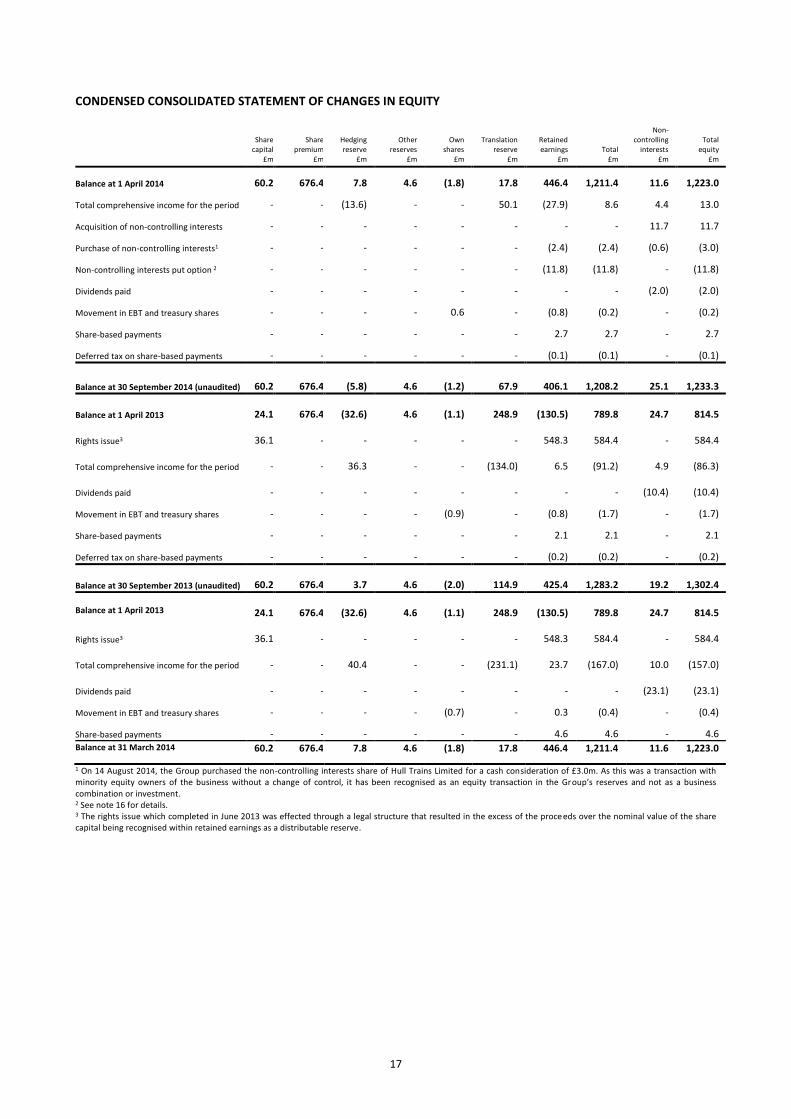
Balance at 1 April 2014 60.2 676.4 7.8 4.6 (1.8) 17.8 446.4 1,211.4 11.6 1,223.0
Total comprehensive income for the period - - (13.6) - - 50.1 (27.9) 8.6 4.4 13.0
Acquisition of non-controlling interests - - - - - - - - 11.7 11.7
Purchase of non-controlling interests1 - - - - - - (2.4) (2.4) (0.6) (3.0)
Non-controlling interests put option 2 - - - - - - (11.8) (11.8) - (11.8)
Dividends paid - - - - - - - - (2.0) (2.0)
Movement in EBT and treasury shares - - - - 0.6 - (0.8) (0.2) - (0.2)
Share-based payments - - - - - - 2.7 2.7 - 2.7
Deferred tax on share-based payments - - - - - - (0.1) (0.1) - (0.1)
Balance at 30 September 2014 (unaudited) 60.2 676.4 (5.8) 4.6 (1.2) 67.9 406.1 1,208.2 25.1 1,233.3
Balance at 1 April 2013
24.1
676.4
(32.6)
4.6
(1.1)
248.9
(130.5)
789.8
24.7
814.5
Rights issue3
36.1
-
-
-
-
-
548.3
584.4
-
584.4
Total comprehensive income for the period
-
-
36.3
-
-
(134.0)
6.5
(91.2)
4.9
(86.3)
Dividends paid
-
-
-
-
-
-
-
-
(10.4)
(10.4)
Movement in EBT and treasury shares - - - - (0.9) - (0.8) (1.7) - (1.7)
Share-based payments - - - - - - 2.1 2.1 - 2.1
Deferred tax on share-based payments - - - - - - (0.2) (0.2) - (0.2)
Balance at 30 September 2013 (unaudited)
60.2
676.4
3.7
4.6
(2.0)
114.9
425.4
1,283.2
19.2
1,302.4
Balance at 1 April 2013
24.1
676.4
(32.6)
4.6
(1.1)
248.9
(130.5)
789.8
24.7
814.5
Rights issue3
36.1
-
-
-
-
-
548.3
584.4
-
584.4
Total comprehensive income for the period
-
-
40.4
-
-
(231.1)
23.7
(167.0)
10.0
(157.0)
Dividends paid
-
-
-
-
-
-
-
-
(23.1)
(23.1)
Movement in EBT and treasury shares - - - - (0.7) - 0.3 (0.4) - (0.4)
Share-based payments - - - - - - 4.6 4.6 - 4.6 Balance at 31 March 2014 60.2 676.4 7.8 4.6 (1.8) 17.8 446.4 1,211.4 11.6 1,223.0
1 On 14 August 2014, the Group purchased the non-controlling interests share of Hull Trains Limited for a cash consideration of £3.0m. As this was a transaction with minority equity owners of the business without a change of control, it has been recognised as an equity transaction in the Group’s reserves and not as a business combination or investment. 2 See note 16 for details. 3 The rights issue which completed in June 2013 was effected through a legal structure that resulted in the excess of the proceeds over the nominal value of the share capital being recognised within retained earnings as a distributable reserve.
18
CONDENSED CONSOLIDATED CASH FLOW STATEMENT
Unaudited 6 months to
30 September 2014
Unaudited 6 months to
30 September 2013
Year to
31 March 2014
Note £m £m £m
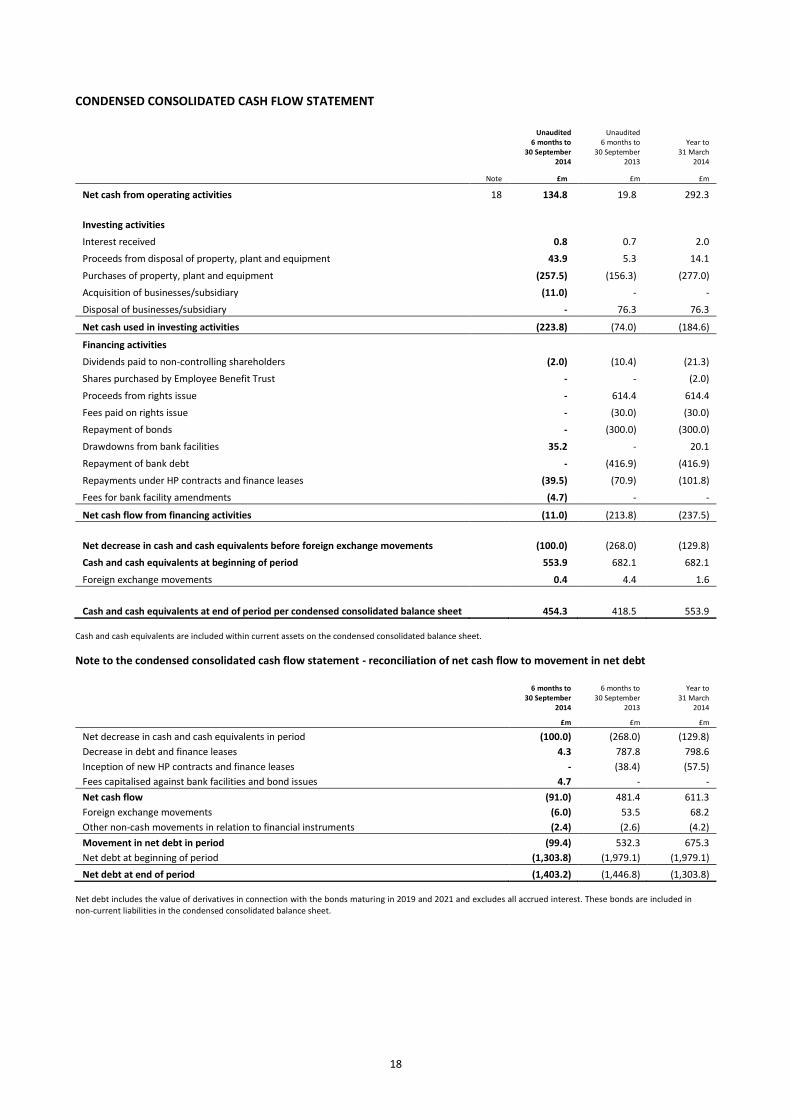
Net cash from operating activities 18 134.8 19.8 292.3
Investing activities
Interest received 0.8 0.7 2.0
Proceeds from disposal of property, plant and equipment 43.9 5.3 14.1
Purchases of property, plant and equipment (257.5) (156.3) (277.0)
Acquisition of businesses/subsidiary (11.0) - -
Disposal of businesses/subsidiary - 76.3 76.3
Net cash used in investing activities (223.8) (74.0) (184.6)
Financing activities
Dividends paid to non-controlling shareholders (2.0) (10.4) (21.3)
Shares purchased by Employee Benefit Trust - - (2.0)
Proceeds from rights issue - 614.4 614.4
Fees paid on rights issue - (30.0) (30.0)
Repayment of bonds - (300.0) (300.0)
Drawdowns from bank facilities 35.2 - 20.1
Repayment of bank debt - (416.9) (416.9)
Repayments under HP contracts and finance leases (39.5) (70.9) (101.8)
Fees for bank facility amendments (4.7) - -
Net cash flow from financing activities (11.0) (213.8) (237.5)
Net decrease in cash and cash equivalents before foreign exchange movements (100.0) (268.0) (129.8)
Cash and cash equivalents at beginning of period 553.9 682.1 682.1
Foreign exchange movements 0.4 4.4 1.6
Cash and cash equivalents at end of period per condensed consolidated balance sheet 454.3 418.5 553.9 Cash and cash equivalents are included within current assets on the condensed consolidated balance sheet.
Note to the condensed consolidated cash flow statement - reconciliation of net cash flow to movement in net debt
6 months to 30 September
2014
6 months to 30 September
2013
Year to 31 March
2014
£m £m £m
Net decrease in cash and cash equivalents in period (100.0) (268.0) (129.8)
Decrease in debt and finance leases 4.3 787.8 798.6
Inception of new HP contracts and finance leases - (38.4) (57.5)
Fees capitalised against bank facilities and bond issues 4.7 - -
Net cash flow (91.0) 481.4 611.3
Foreign exchange movements (6.0) 53.5 68.2
Other non-cash movements in relation to financial instruments (2.4) (2.6) (4.2)
Movement in net debt in period (99.4) 532.3 675.3
Net debt at beginning of period (1,303.8) (1,979.1) (1,979.1)
Net debt at end of period (1,403.2) (1,446.8) (1,303.8) Net debt includes the value of derivatives in connection with the bonds maturing in 2019 and 2021 and excludes all accrued interest. These bonds are included in non-current liabilities in the condensed consolidated balance sheet.
19
NOTES TO THE HALF-YEARLY FINANCIAL REPORT 1 BASIS OF PREPARATION
This half-yearly financial report does not constitute statutory accounts as defined in section 434 of the Companies Act 2006. The statutory accounts for the year ended 31 March 2014 have been delivered to the Registrar of Companies. The auditor reported on those accounts; their report was unqualified, did not draw attention to any matters by way of emphasis and did not contain a statement under section 498(2) or (3) of the Companies Act 2006. The figures for the six months to 30 September 2014 include the results of the UK Rail division for the period ended 13 September 2014 and the results for the other divisions for the 26 weeks ended 27 September 2014. The comparative figures for the six months to 30 September 2013 include the results of the UK Rail division for the period ended 14 September 2013 and the results of the other divisions for the 26 weeks ended 28 September 2013. The condensed set of financial statements included in this half-yearly financial report has been prepared in accordance with the DTR of the Financial Conduct Authority and International Accounting Standard 34, ‘Interim Financial Reporting’, as adopted by the European Union. The accounting policies used in this half-yearly financial report are consistent with International Financial Reporting Standards as adopted by the European Union. The accounting policies applied are consistent with those described in the Group’s latest annual audited financial statements, except for the application of IFRS 10 ‘Consolidated Financial Statements’, IFRS 11 ‘Joint Arrangements’ and IFRS 12 ‘Disclosure of Interests in Other Entities’ which became effective in the period for the first time. There has been no material change as a result of applying these new accounting standards. We have also included certain non-GAAP measures in order to reflect management’s reported view of financial performance excluding non-recurring items and amortisation. These results are unaudited but have been reviewed by the auditor. The comparative figures for the six months to 30 September 2013 are unaudited and are derived from the half-yearly financial report for that period, which was also reviewed by the auditor. The Directors have carried out a detailed review of the Group’s budget for the year to 31 March 2015 and medium term plans, with due regard for the risks and uncertainties to which the Group is exposed, the uncertain economic climate and the impact that this could have on trading performance. Based on this review, the Directors believe that the Company and the Group have adequate resources to continue in operational existence for the foreseeable future. Accordingly, the financial statements have been prepared on a going concern basis in preparing this half-yearly report. The operating and financial review statement contained in this half-yearly report, including the summarised principal risks and uncertainties, has been prepared by the Directors in good faith based on the information available to them up to the time of their approval of this report solely for the Company’s shareholders as a body, so as to assist them in assessing the Group's strategies and the potential for those strategies to succeed and accordingly should not be relied on by any other party or for any other purpose and the Company hereby disclaims any liability to any such other party or for reliance on such information for any such other purpose. The operating and financial review considers the impact of seasonality on the group and also the principal risks and uncertainties facing it in the remaining six months of the financial year. This half-yearly report has been prepared in respect of the Group as a whole and accordingly matters identified as being significant or material are so identified in the context of First Group plc and its subsidiary undertakings taken as a whole. This half-yearly financial report was approved by the Board on 5 November 2014.
20
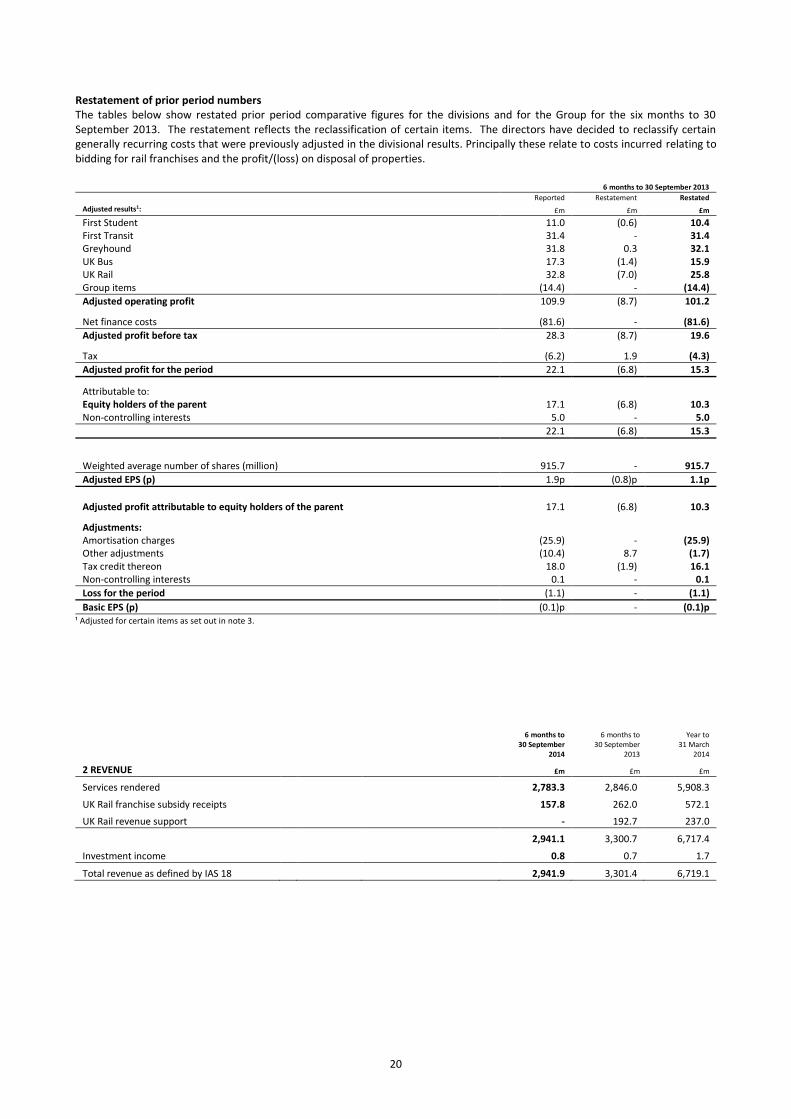
Restatement of prior period numbers The tables below show restated prior period comparative figures for the divisions and for the Group for the six months to 30 September 2013. The restatement reflects the reclassification of certain items. The directors have decided to reclassify certain generally recurring costs that were previously adjusted in the divisional results. Principally these relate to costs incurred relating to bidding for rail franchises and the profit/(loss) on disposal of properties.
6 months to 30 September 2013
Reported Restatement Restated
Adjusted results1: £m £m £m
First Student 11.0 (0.6) 10.4 First Transit 31.4 - 31.4 Greyhound 31.8 0.3 32.1 UK Bus 17.3 (1.4) 15.9 UK Rail 32.8 (7.0) 25.8 Group items (14.4) - (14.4)
Adjusted operating profit 109.9 (8.7) 101.2
Net finance costs (81.6) - (81.6)
Adjusted profit before tax 28.3 (8.7) 19.6
Tax (6.2) 1.9 (4.3)
Adjusted profit for the period 22.1 (6.8) 15.3
Attributable to: Equity holders of the parent 17.1 (6.8) 10.3 Non-controlling interests 5.0 - 5.0
22.1 (6.8) 15.3
Weighted average number of shares (million) 915.7 - 915.7
Adjusted EPS (p) 1.9p (0.8)p 1.1p
Adjusted profit attributable to equity holders of the parent 17.1 (6.8) 10.3
Adjustments: Amortisation charges (25.9) - (25.9) Other adjustments (10.4) 8.7 (1.7) Tax credit thereon 18.0 (1.9) 16.1 Non-controlling interests 0.1 - 0.1
Loss for the period (1.1) - (1.1)
Basic EPS (p) (0.1)p - (0.1)p ¹ Adjusted for certain items as set out in note 3.
6 months to 30 September
2014
6 months to 30 September
2013
Year to 31 March
2014
2 REVENUE £m £m £m
Services rendered 2,783.3 2,846.0 5,908.3
UK Rail franchise subsidy receipts 157.8 262.0 572.1
UK Rail revenue support - 192.7 237.0
2,941.1 3,300.7 6,717.4
Investment income 0.8 0.7 1.7
Total revenue as defined by IAS 18 2,941.9 3,301.4 6,719.1
21
3 RECONCILIATION TO NON-GAAP MEASURES AND PERFORMANCE
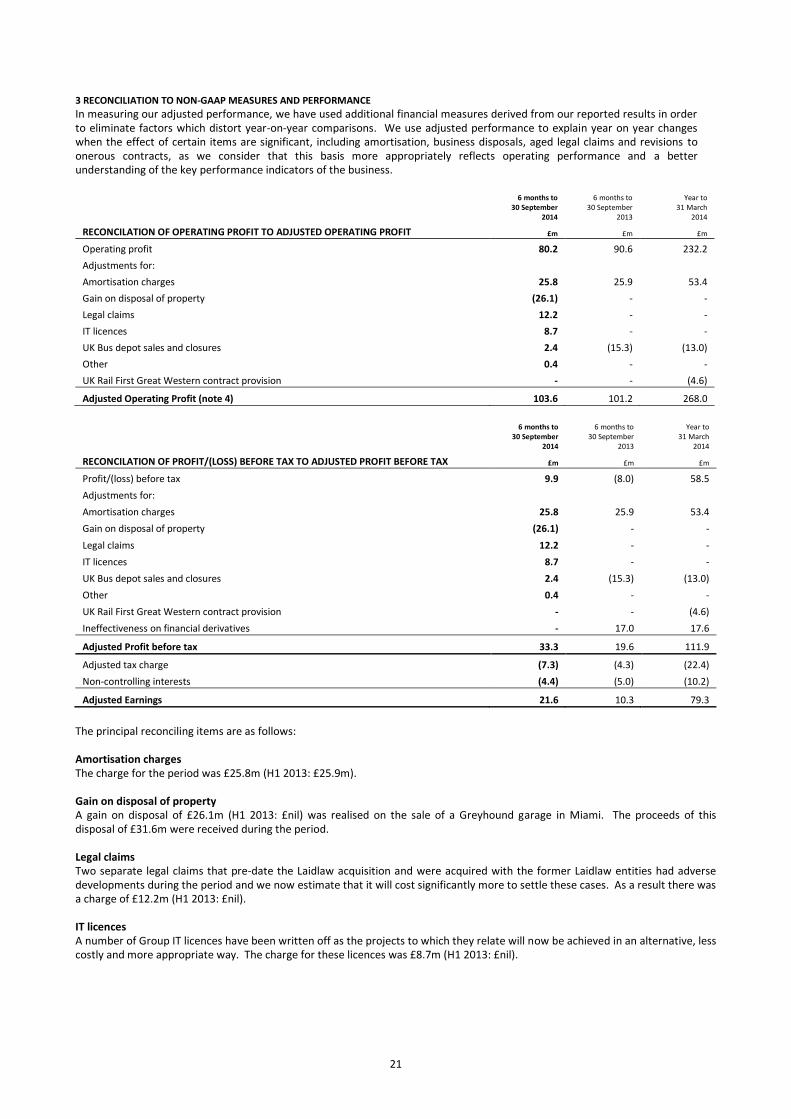
In measuring our adjusted performance, we have used additional financial measures derived from our reported results in order to eliminate factors which distort year-on-year comparisons. We use adjusted performance to explain year on year changes when the effect of certain items are significant, including amortisation, business disposals, aged legal claims and revisions to onerous contracts, as we consider that this basis more appropriately reflects operating performance and a better understanding of the key performance indicators of the business.
6 months to 30 September
2014
6 months to 30 September
2013
Year to 31 March
2014
RECONCILATION OF OPERATING PROFIT TO ADJUSTED OPERATING PROFIT £m £m £m
Operating profit 80.2 90.6 232.2
Adjustments for:
Amortisation charges 25.8 25.9 53.4
Gain on disposal of property (26.1) - -
Legal claims 12.2 - -
IT licences 8.7 - -
UK Bus depot sales and closures 2.4 (15.3) (13.0)
Other 0.4 - -
UK Rail First Great Western contract provision - - (4.6)
Adjusted Operating Profit (note 4) 103.6 101.2 268.0
6 months to 30 September
2014
6 months to 30 September
2013
Year to 31 March
2014
RECONCILATION OF PROFIT/(LOSS) BEFORE TAX TO ADJUSTED PROFIT BEFORE TAX £m £m £m
Profit/(loss) before tax 9.9 (8.0) 58.5
Adjustments for:
Amortisation charges 25.8 25.9 53.4
Gain on disposal of property (26.1) - -
Legal claims 12.2 - -
IT licences 8.7 - -
UK Bus depot sales and closures 2.4 (15.3) (13.0)
Other 0.4 - -
UK Rail First Great Western contract provision - - (4.6)
Ineffectiveness on financial derivatives - 17.0 17.6
Adjusted Profit before tax 33.3 19.6 111.9
Adjusted tax charge (7.3) (4.3) (22.4)
Non-controlling interests (4.4) (5.0) (10.2)
Adjusted Earnings 21.6 10.3 79.3
The principal reconciling items are as follows: Amortisation charges The charge for the period was £25.8m (H1 2013: £25.9m). Gain on disposal of property A gain on disposal of £26.1m (H1 2013: £nil) was realised on the sale of a Greyhound garage in Miami. The proceeds of this disposal of £31.6m were received during the period. Legal claims Two separate legal claims that pre-date the Laidlaw acquisition and were acquired with the former Laidlaw entities had adverse developments during the period and we now estimate that it will cost significantly more to settle these cases. As a result there was a charge of £12.2m (H1 2013: £nil). IT licences A number of Group IT licences have been written off as the projects to which they relate will now be achieved in an alternative, less costly and more appropriate way. The charge for these licences was £8.7m (H1 2013: £nil).
22
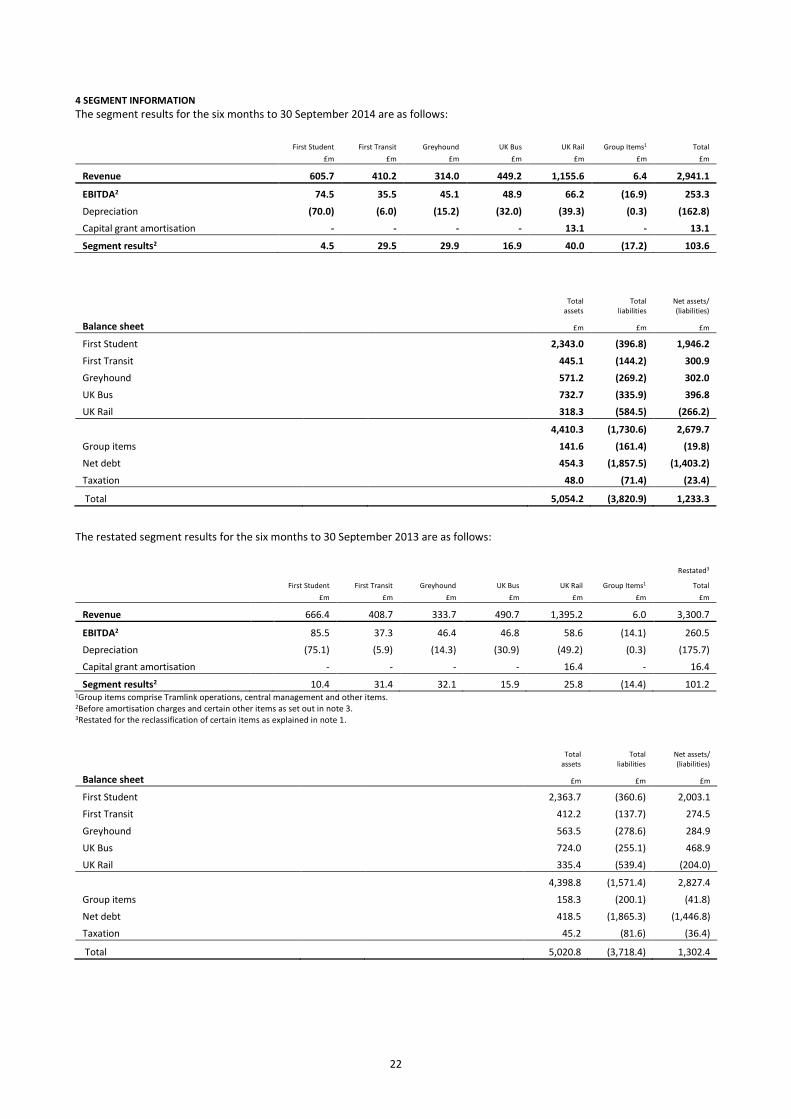
4 SEGMENT INFORMATION
The segment results for the six months to 30 September 2014 are as follows:
First Student First Transit Greyhound UK Bus UK Rail Group Items1 Total
£m £m £m £m £m £m £m
Revenue 605.7 410.2 314.0 449.2 1,155.6 6.4 2,941.1
EBITDA2 74.5 35.5 45.1 48.9 66.2 (16.9) 253.3
Depreciation (70.0) (6.0) (15.2) (32.0) (39.3) (0.3) (162.8)
Capital grant amortisation - - - - 13.1 - 13.1
Segment results2 4.5 29.5 29.9 16.9 40.0 (17.2) 103.6
Total
assets Total
liabilities Net assets/ (liabilities)
Balance sheet £m £m £m
First Student 2,343.0 (396.8) 1,946.2
First Transit 445.1 (144.2) 300.9
Greyhound 571.2 (269.2) 302.0
UK Bus 732.7 (335.9) 396.8
UK Rail 318.3 (584.5) (266.2)
4,410.3 (1,730.6) 2,679.7
Group items 141.6 (161.4) (19.8)
Net debt 454.3 (1,857.5) (1,403.2)
Taxation 48.0 (71.4) (23.4)
Total 5,054.2 (3,820.9) 1,233.3
The restated segment results for the six months to 30 September 2013 are as follows:
Restated3
First Student First Transit Greyhound UK Bus UK Rail Group Items1 Total
£m £m £m £m £m £m £m
Revenue 666.4 408.7 333.7 490.7 1,395.2 6.0 3,300.7
EBITDA2 85.5 37.3 46.4 46.8 58.6 (14.1) 260.5
Depreciation (75.1) (5.9) (14.3) (30.9) (49.2) (0.3) (175.7)
Capital grant amortisation - - - - 16.4 - 16.4
Segment results2 10.4 31.4 32.1 15.9 25.8 (14.4) 101.2 1Group items comprise Tramlink operations, central management and other items.
2Before amortisation charges and certain other items as set out in note 3. 3Restated for the reclassification of certain items as explained in note 1.
Total
assets Total
liabilities Net assets/ (liabilities)
Balance sheet £m £m £m
First Student 2,363.7 (360.6) 2,003.1
First Transit 412.2 (137.7) 274.5
Greyhound 563.5 (278.6) 284.9
UK Bus 724.0 (255.1) 468.9
UK Rail 335.4 (539.4) (204.0)
4,398.8 (1,571.4) 2,827.4
Group items 158.3 (200.1) (41.8)
Net debt 418.5 (1,865.3) (1,446.8)
Taxation 45.2 (81.6) (36.4)
Total 5,020.8 (3,718.4) 1,302.4
23
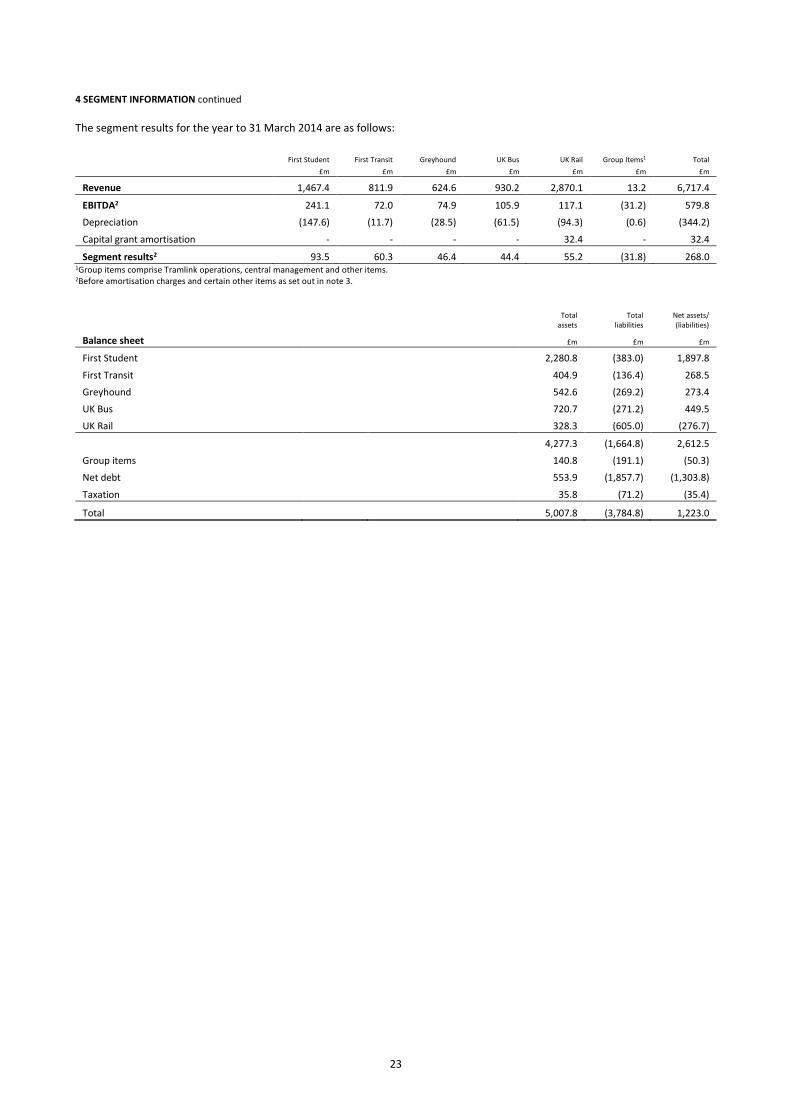
4 SEGMENT INFORMATION continued
The segment results for the year to 31 March 2014 are as follows:
First Student First Transit Greyhound UK Bus UK Rail Group Items1 Total
£m £m £m £m £m £m £m
Revenue 1,467.4 811.9 624.6 930.2 2,870.1 13.2 6,717.4
EBITDA2 241.1 72.0 74.9 105.9 117.1 (31.2) 579.8
Depreciation (147.6) (11.7) (28.5) (61.5) (94.3) (0.6) (344.2)
Capital grant amortisation - - - - 32.4 - 32.4
Segment results2 93.5 60.3 46.4 44.4 55.2 (31.8) 268.0 1Group items comprise Tramlink operations, central management and other items. 2Before amortisation charges and certain other items as set out in note 3.
Total
assets Total
liabilities Net assets/ (liabilities)
Balance sheet £m £m £m
First Student 2,280.8 (383.0) 1,897.8
First Transit 404.9 (136.4) 268.5
Greyhound 542.6 (269.2) 273.4
UK Bus 720.7 (271.2) 449.5
UK Rail 328.3 (605.0) (276.7)
4,277.3 (1,664.8) 2,612.5
Group items 140.8 (191.1) (50.3)
Net debt 553.9 (1,857.7) (1,303.8)
Taxation 35.8 (71.2) (35.4)
Total 5,007.8 (3,784.8) 1,223.0
24
6 months to 30 September
2014
6 months to 30 September
2013
Year to 31 March
2014
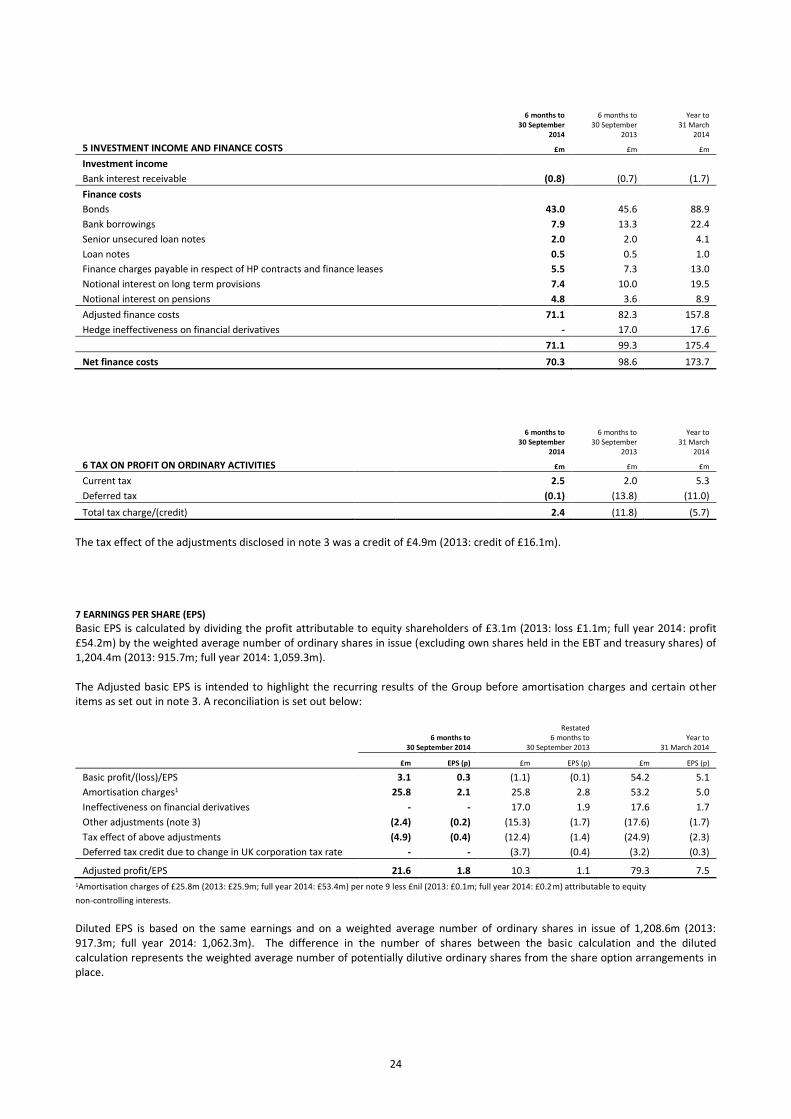
5 INVESTMENT INCOME AND FINANCE COSTS £m £m £m
Investment income
Bank interest receivable (0.8) (0.7) (1.7)
Finance costs
Bonds 43.0 45.6 88.9
Bank borrowings 7.9 13.3 22.4
Senior unsecured loan notes 2.0 2.0 4.1
Loan notes 0.5 0.5 1.0
Finance charges payable in respect of HP contracts and finance leases 5.5 7.3 13.0
Notional interest on long term provisions 7.4 10.0 19.5
Notional interest on pensions 4.8 3.6 8.9
Adjusted finance costs 71.1 82.3 157.8
Hedge ineffectiveness on financial derivatives - 17.0 17.6
71.1 99.3 175.4
Net finance costs 70.3 98.6 173.7
6 months to 30 September
2014
6 months to 30 September
2013
Year to 31 March
2014
6 TAX ON PROFIT ON ORDINARY ACTIVITIES £m £m £m
Current tax 2.5 2.0 5.3
Deferred tax (0.1) (13.8) (11.0)
Total tax charge/(credit) 2.4 (11.8) (5.7)
The tax effect of the adjustments disclosed in note 3 was a credit of £4.9m (2013: credit of £16.1m). 7 EARNINGS PER SHARE (EPS)
Basic EPS is calculated by dividing the profit attributable to equity shareholders of £3.1m (2013: loss £1.1m; full year 2014: profit £54.2m) by the weighted average number of ordinary shares in issue (excluding own shares held in the EBT and treasury shares) of 1,204.4m (2013: 915.7m; full year 2014: 1,059.3m). The Adjusted basic EPS is intended to highlight the recurring results of the Group before amortisation charges and certain other items as set out in note 3. A reconciliation is set out below:
6 months to
30 September 2014
Restated 6 months to
30 September 2013 Year to
31 March 2014
£m EPS (p) £m EPS (p) £m EPS (p)
Basic profit/(loss)/EPS 3.1 0.3 (1.1) (0.1) 54.2 5.1
Amortisation charges1 25.8 2.1 25.8 2.8 53.2 5.0
Ineffectiveness on financial derivatives - - 17.0 1.9 17.6 1.7
Other adjustments (note 3) (2.4) (0.2) (15.3) (1.7) (17.6) (1.7)
Tax effect of above adjustments (4.9) (0.4) (12.4) (1.4) (24.9) (2.3)
Deferred tax credit due to change in UK corporation tax rate - - (3.7) (0.4) (3.2) (0.3)
Adjusted profit/EPS 21.6 1.8 10.3 1.1 79.3 7.5 1Amortisation charges of £25.8m (2013: £25.9m; full year 2014: £53.4m) per note 9 less £nil (2013: £0.1m; full year 2014: £0.2m) attributable to equity
non-controlling interests.
Diluted EPS is based on the same earnings and on a weighted average number of ordinary shares in issue of 1,208.6m (2013: 917.3m; full year 2014: 1,062.3m). The difference in the number of shares between the basic calculation and the diluted calculation represents the weighted average number of potentially dilutive ordinary shares from the share option arrangements in place.
25
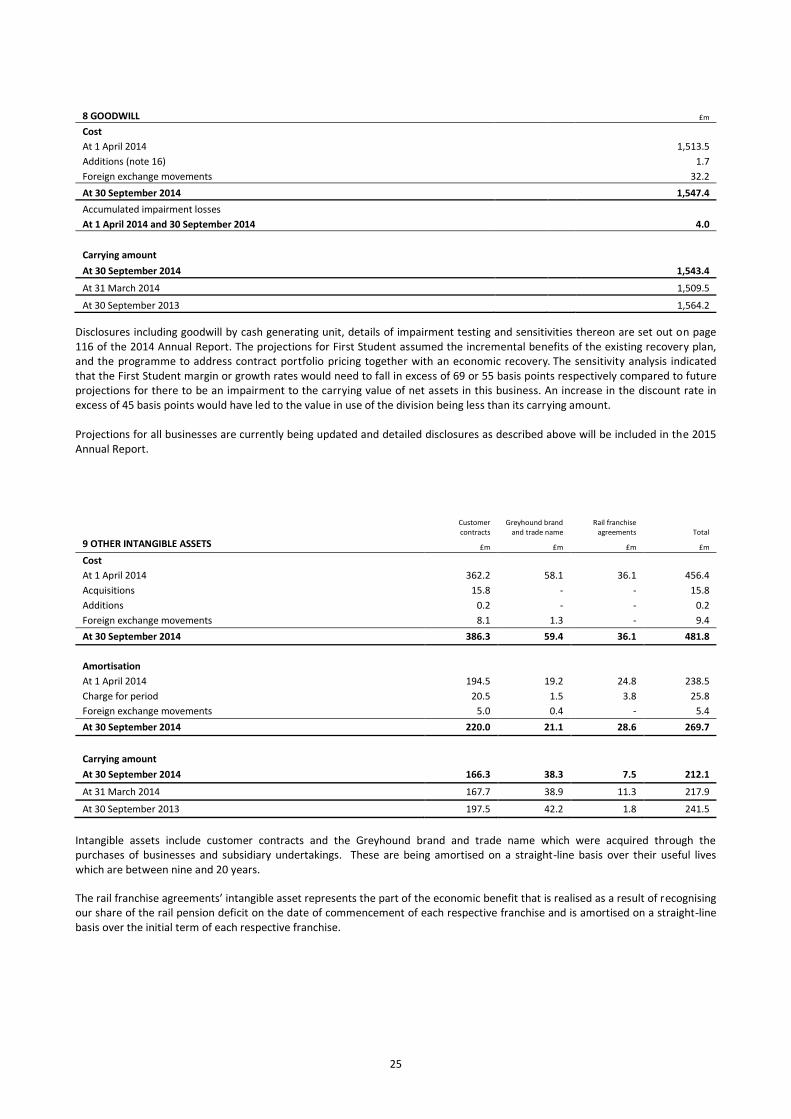
8 GOODWILL £m
Cost
At 1 April 2014 1,513.5
Additions (note 16) 1.7
Foreign exchange movements 32.2
At 30 September 2014 1,547.4
Accumulated impairment losses
At 1 April 2014 and 30 September 2014 4.0
Carrying amount
At 30 September 2014 1,543.4
At 31 March 2014 1,509.5
At 30 September 2013 1,564.2
Disclosures including goodwill by cash generating unit, details of impairment testing and sensitivities thereon are set out on page 116 of the 2014 Annual Report. The projections for First Student assumed the incremental benefits of the existing recovery plan, and the programme to address contract portfolio pricing together with an economic recovery. The sensitivity analysis indicated that the First Student margin or growth rates would need to fall in excess of 69 or 55 basis points respectively compared to future projections for there to be an impairment to the carrying value of net assets in this business. An increase in the discount rate in excess of 45 basis points would have led to the value in use of the division being less than its carrying amount. Projections for all businesses are currently being updated and detailed disclosures as described above will be included in the 2015 Annual Report.
Customer contracts
Greyhound brand and trade name
Rail franchise agreements Total
9 OTHER INTANGIBLE ASSETS £m £m £m £m
Cost
At 1 April 2014 362.2 58.1 36.1 456.4
Acquisitions 15.8 - - 15.8
Additions 0.2 - - 0.2
Foreign exchange movements 8.1 1.3 - 9.4
At 30 September 2014 386.3 59.4 36.1 481.8
Amortisation
At 1 April 2014 194.5 19.2 24.8 238.5
Charge for period 20.5 1.5 3.8 25.8
Foreign exchange movements 5.0 0.4 - 5.4
At 30 September 2014 220.0 21.1 28.6 269.7
Carrying amount
At 30 September 2014 166.3 38.3 7.5 212.1
At 31 March 2014 167.7 38.9 11.3 217.9
At 30 September 2013 197.5 42.2 1.8 241.5
Intangible assets include customer contracts and the Greyhound brand and trade name which were acquired through the purchases of businesses and subsidiary undertakings. These are being amortised on a straight-line basis over their useful lives which are between nine and 20 years. The rail franchise agreements’ intangible asset represents the part of the economic benefit that is realised as a result of recognising our share of the rail pension deficit on the date of commencement of each respective franchise and is amortised on a straight-line basis over the initial term of each respective franchise.
26
Passenger Other
Land and carrying plant and
buildings vehicle fleet equipment Total
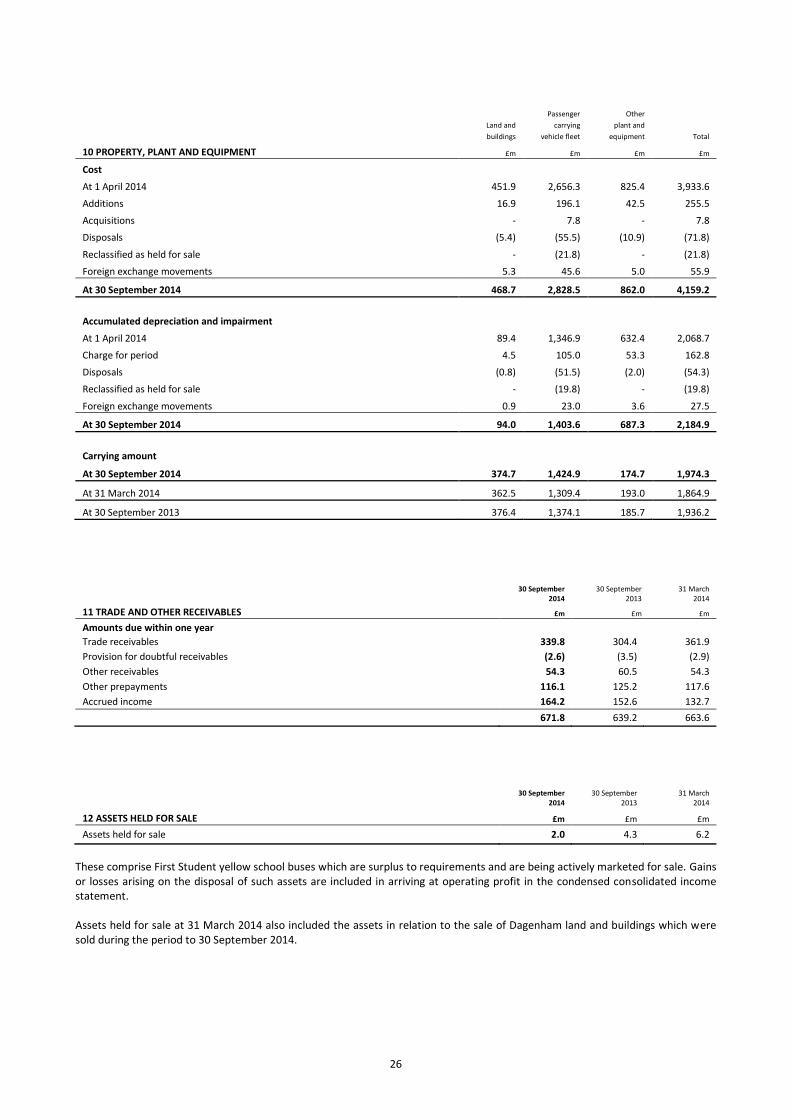
10 PROPERTY, PLANT AND EQUIPMENT £m £m £m £m
Cost
At 1 April 2014 451.9 2,656.3 825.4 3,933.6
Additions 16.9 196.1 42.5 255.5
Acquisitions - 7.8 - 7.8
Disposals (5.4) (55.5) (10.9) (71.8)
Reclassified as held for sale - (21.8) - (21.8)
Foreign exchange movements 5.3 45.6 5.0 55.9
At 30 September 2014 468.7 2,828.5 862.0 4,159.2
Accumulated depreciation and impairment
At 1 April 2014 89.4 1,346.9 632.4 2,068.7
Charge for period 4.5 105.0 53.3 162.8
Disposals (0.8) (51.5) (2.0) (54.3)
Reclassified as held for sale - (19.8) - (19.8)
Foreign exchange movements 0.9 23.0 3.6 27.5
At 30 September 2014 94.0 1,403.6 687.3 2,184.9
Carrying amount
At 30 September 2014 374.7 1,424.9 174.7 1,974.3
At 31 March 2014 362.5 1,309.4 193.0 1,864.9
At 30 September 2013 376.4 1,374.1 185.7 1,936.2
30 September
2014 30 September
2013 31 March
2014
11 TRADE AND OTHER RECEIVABLES £m £m £m
Amounts due within one year
Trade receivables 339.8 304.4 361.9
Provision for doubtful receivables (2.6) (3.5) (2.9)
Other receivables 54.3 60.5 54.3
Other prepayments 116.1 125.2 117.6
Accrued income 164.2 152.6 132.7
671.8 639.2 663.6
30 September
2014 30 September
2013 31 March
2014
12 ASSETS HELD FOR SALE £m £m £m
Assets held for sale 2.0 4.3 6.2
These comprise First Student yellow school buses which are surplus to requirements and are being actively marketed for sale. Gains or losses arising on the disposal of such assets are included in arriving at operating profit in the condensed consolidated income statement. Assets held for sale at 31 March 2014 also included the assets in relation to the sale of Dagenham land and buildings which were sold during the period to 30 September 2014.
27
30 September
2014
30 September
2013
31 March
2014
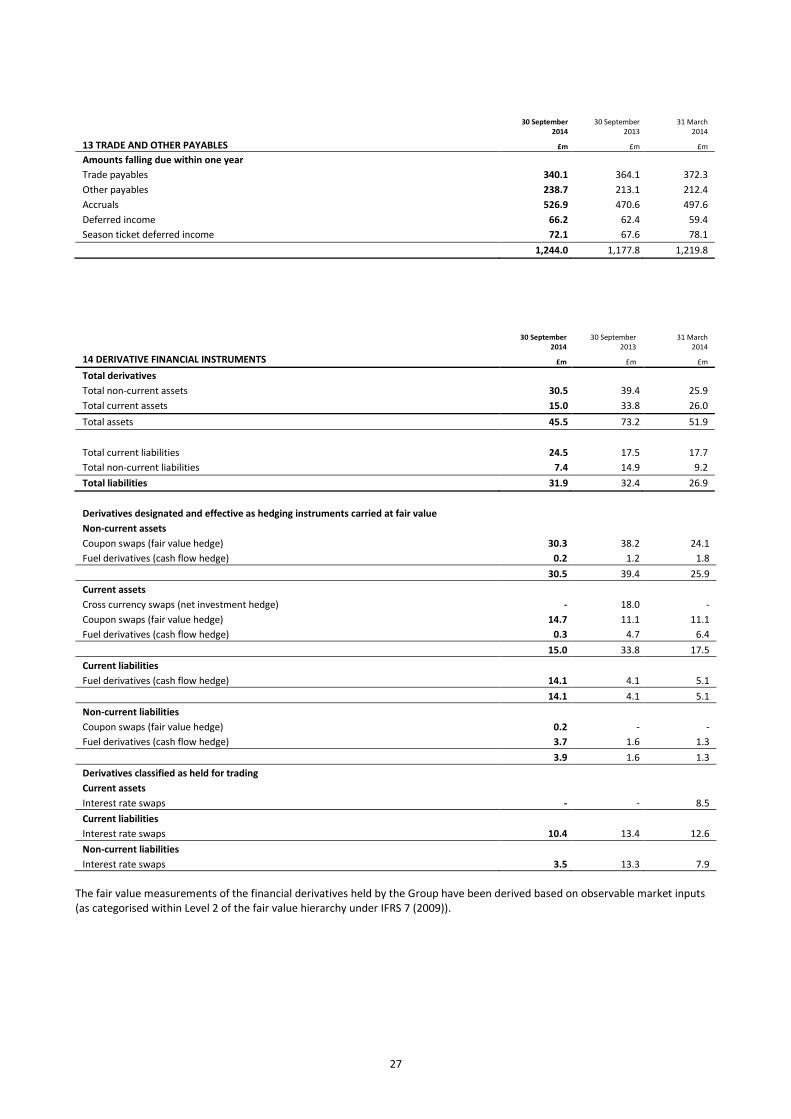
13 TRADE AND OTHER PAYABLES £m £m £m
Amounts falling due within one year
Trade payables 340.1 364.1 372.3
Other payables 238.7 213.1 212.4
Accruals 526.9 470.6 497.6
Deferred income 66.2 62.4 59.4
Season ticket deferred income 72.1 67.6 78.1
1,244.0 1,177.8 1,219.8
30 September
2014 30 September
2013 31 March
2014
14 DERIVATIVE FINANCIAL INSTRUMENTS £m £m £m
Total derivatives
Total non-current assets 30.5 39.4 25.9
Total current assets 15.0 33.8 26.0
Total assets 45.5 73.2 51.9
Total current liabilities 24.5 17.5 17.7
Total non-current liabilities 7.4 14.9 9.2
Total liabilities 31.9 32.4 26.9
Derivatives designated and effective as hedging instruments carried at fair value
Non-current assets
Coupon swaps (fair value hedge) 30.3 38.2 24.1
Fuel derivatives (cash flow hedge) 0.2 1.2 1.8
30.5 39.4 25.9
Current assets
Cross currency swaps (net investment hedge) - 18.0 -
Coupon swaps (fair value hedge) 14.7 11.1 11.1
Fuel derivatives (cash flow hedge) 0.3 4.7 6.4
15.0 33.8 17.5
Current liabilities
Fuel derivatives (cash flow hedge) 14.1 4.1 5.1
14.1 4.1 5.1
Non-current liabilities
Coupon swaps (fair value hedge) 0.2 - -
Fuel derivatives (cash flow hedge) 3.7 1.6 1.3
3.9 1.6 1.3
Derivatives classified as held for trading
Current assets
Interest rate swaps - - 8.5
Current liabilities
Interest rate swaps 10.4 13.4 12.6
Non-current liabilities
Interest rate swaps 3.5 13.3 7.9
The fair value measurements of the financial derivatives held by the Group have been derived based on observable market inputs (as categorised within Level 2 of the fair value hierarchy under IFRS 7 (2009)).
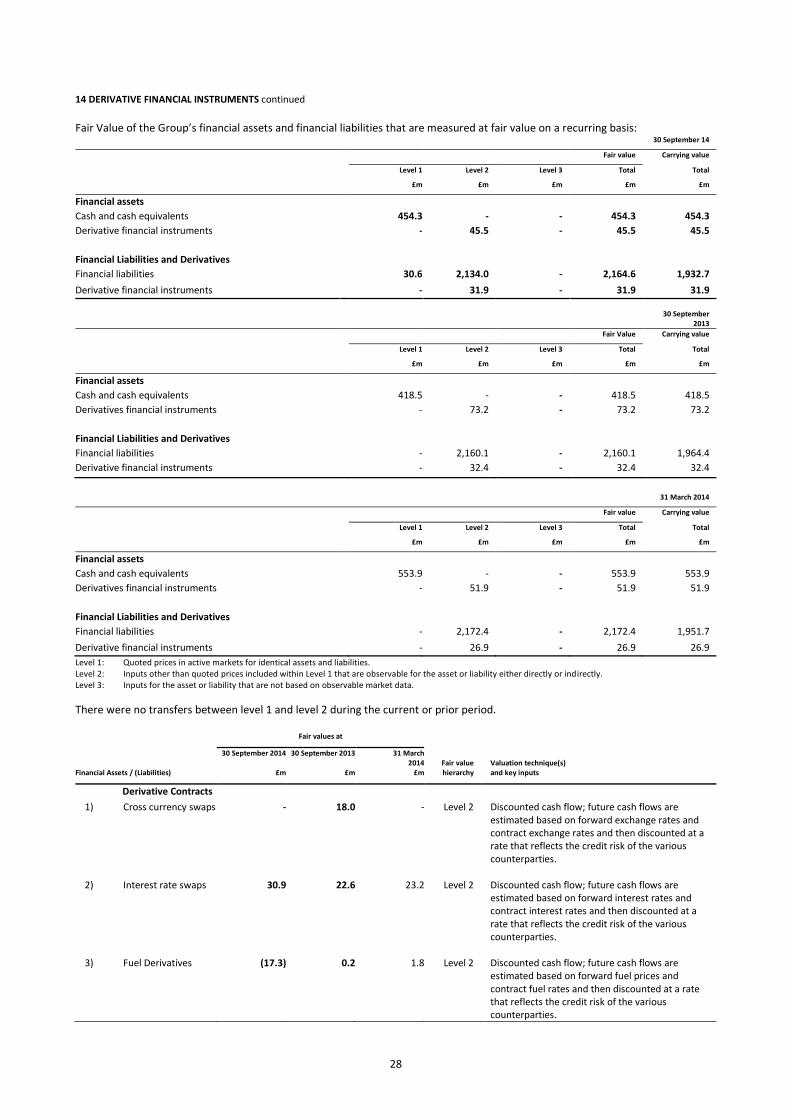
28
14 DERIVATIVE FINANCIAL INSTRUMENTS continued
Fair Value of the Group’s financial assets and financial liabilities that are measured at fair value on a recurring basis:
30 September 14
Fair value Carrying value
Level 1 Level 2 Level 3 Total Total
£m £m £m £m £m
Financial assets
Cash and cash equivalents 454.3 - - 454.3 454.3
Derivative financial instruments - 45.5 - 45.5 45.5
Financial Liabilities and Derivatives
Financial liabilities 30.6 2,134.0 - 2,164.6 1,932.7
Derivative financial instruments - 31.9 - 31.9 31.9
30 September
2013
Fair Value Carrying value
Level 1 Level 2 Level 3 Total Total
£m £m £m £m £m
Financial assets
Cash and cash equivalents 418.5 - - 418.5 418.5
Derivatives financial instruments - 73.2 - 73.2 73.2
Financial Liabilities and Derivatives
Financial liabilities - 2,160.1 - 2,160.1 1,964.4
Derivative financial instruments - 32.4 - 32.4 32.4
31 March 2014
Fair value Carrying value
Level 1 Level 2 Level 3 Total Total
£m £m £m £m £m
Financial assets
Cash and cash equivalents 553.9 - - 553.9 553.9
Derivatives financial instruments - 51.9 - 51.9 51.9
Financial Liabilities and Derivatives
Financial liabilities - 2,172.4 - 2,172.4 1,951.7
Derivative financial instruments - 26.9 - 26.9 26.9
Level 1: Quoted prices in active markets for identical assets and liabilities. Level 2: Inputs other than quoted prices included within Level 1 that are observable for the asset or liability either directly or indirectly. Level 3: Inputs for the asset or liability that are not based on observable market data.
There were no transfers between level 1 and level 2 during the current or prior period.
Fair values at
30 September 2014 30 September 2013 31 March 2014
Fair value hierarchy
Valuation technique(s) and key inputs Financial Assets / (Liabilities) £m £m £m
Derivative Contracts
1) Cross currency swaps - 18.0 - Level 2 Discounted cash flow; future cash flows are estimated based on forward exchange rates and contract exchange rates and then discounted at a rate that reflects the credit risk of the various counterparties.
2) Interest rate swaps 30.9 22.6 23.2 Level 2 Discounted cash flow; future cash flows are estimated based on forward interest rates and contract interest rates and then discounted at a rate that reflects the credit risk of the various counterparties.
3) Fuel Derivatives (17.3) 0.2 1.8 Level 2 Discounted cash flow; future cash flows are estimated based on forward fuel prices and contract fuel rates and then discounted at a rate that reflects the credit risk of the various counterparties.
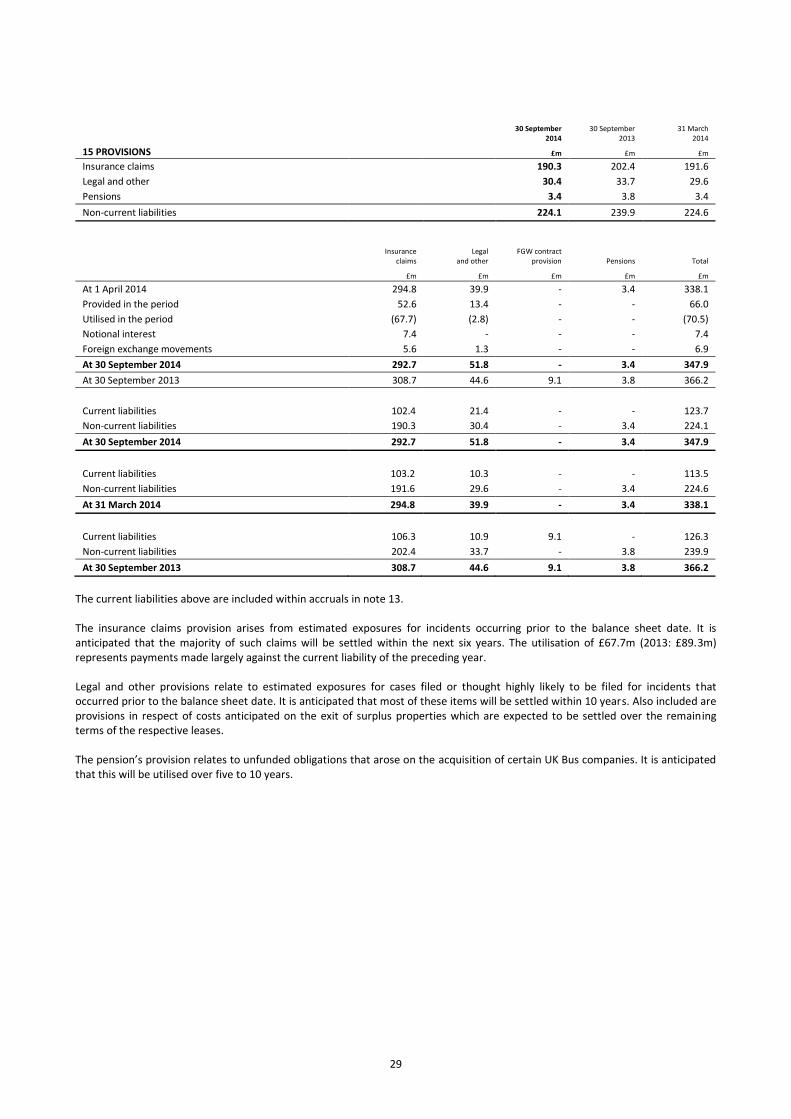
29
30 September
2014 30 September
2013 31 March
2014
15 PROVISIONS £m £m £m
Insurance claims 190.3 202.4 191.6
Legal and other 30.4 33.7 29.6
Pensions 3.4 3.8 3.4
Non-current liabilities 224.1 239.9 224.6
Insurance
claims Legal
and other
FGW contract
provision Pensions
Total
£m £m £m £m £m
At 1 April 2014 294.8 39.9 - 3.4 338.1
Provided in the period 52.6 13.4 - - 66.0
Utilised in the period (67.7) (2.8) - - (70.5)
Notional interest 7.4 - - - 7.4
Foreign exchange movements 5.6 1.3 - - 6.9
At 30 September 2014 292.7 51.8 - 3.4 347.9
At 30 September 2013 308.7 44.6 9.1 3.8 366.2
Current liabilities 102.4 21.4 - - 123.7
Non-current liabilities 190.3 30.4 - 3.4 224.1
At 30 September 2014 292.7 51.8 - 3.4 347.9
Current liabilities 103.2 10.3 - - 113.5
Non-current liabilities 191.6 29.6 - 3.4 224.6
At 31 March 2014 294.8 39.9 - 3.4 338.1
Current liabilities 106.3 10.9 9.1 - 126.3
Non-current liabilities 202.4 33.7 - 3.8 239.9
At 30 September 2013 308.7 44.6 9.1 3.8 366.2
The current liabilities above are included within accruals in note 13. The insurance claims provision arises from estimated exposures for incidents occurring prior to the balance sheet date. It is anticipated that the majority of such claims will be settled within the next six years. The utilisation of £67.7m (2013: £89.3m) represents payments made largely against the current liability of the preceding year. Legal and other provisions relate to estimated exposures for cases filed or thought highly likely to be filed for incidents that occurred prior to the balance sheet date. It is anticipated that most of these items will be settled within 10 years. Also included are provisions in respect of costs anticipated on the exit of surplus properties which are expected to be settled over the remaining terms of the respective leases. The pension’s provision relates to unfunded obligations that arose on the acquisition of certain UK Bus companies. It is anticipated that this will be utilised over five to 10 years.
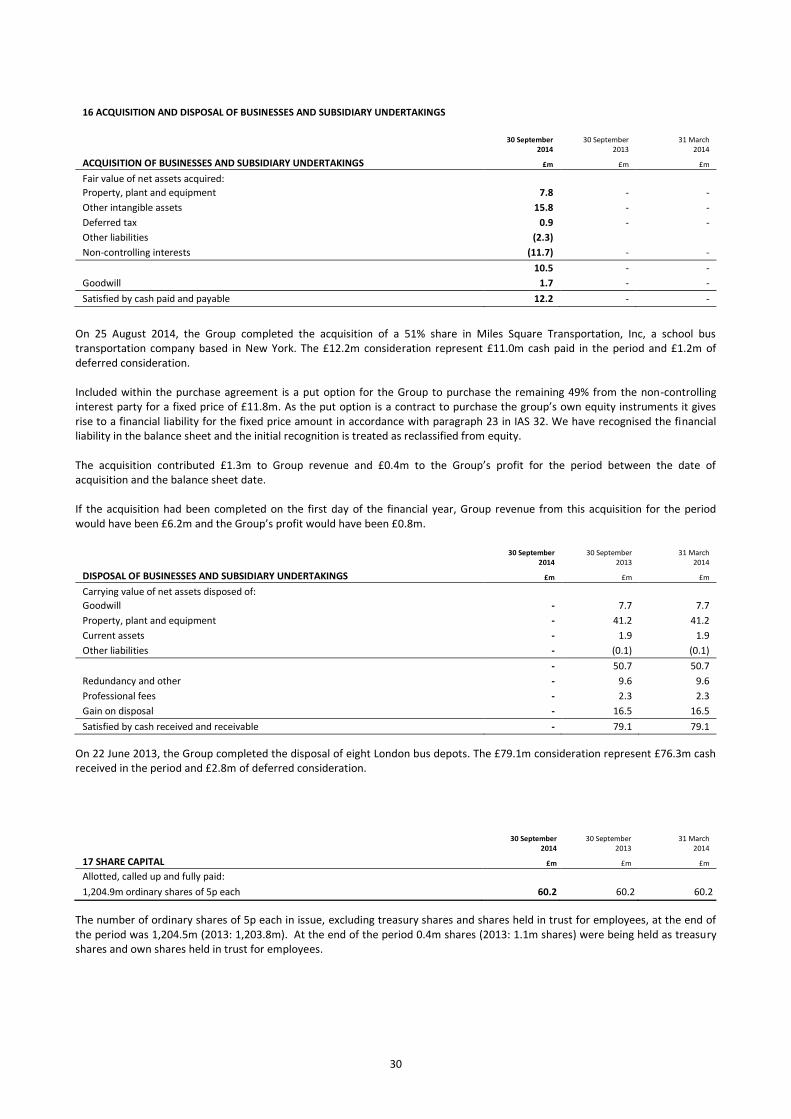
30
16 ACQUISITION AND DISPOSAL OF BUSINESSES AND SUBSIDIARY UNDERTAKINGS
30 September 2014
30 September 2013
31 March 2014
ACQUISITION OF BUSINESSES AND SUBSIDIARY UNDERTAKINGS £m £m £m
Fair value of net assets acquired:
Property, plant and equipment 7.8 - -
Other intangible assets 15.8 - -
Deferred tax 0.9 - -
Other liabilities (2.3)
Non-controlling interests (11.7) - -
10.5 - -
Goodwill 1.7 - -
Satisfied by cash paid and payable 12.2 - -
On 25 August 2014, the Group completed the acquisition of a 51% share in Miles Square Transportation, Inc, a school bus transportation company based in New York. The £12.2m consideration represent £11.0m cash paid in the period and £1.2m of deferred consideration. Included within the purchase agreement is a put option for the Group to purchase the remaining 49% from the non-controlling interest party for a fixed price of £11.8m. As the put option is a contract to purchase the group’s own equity instruments it gives rise to a financial liability for the fixed price amount in accordance with paragraph 23 in IAS 32. We have recognised the financial liability in the balance sheet and the initial recognition is treated as reclassified from equity. The acquisition contributed £1.3m to Group revenue and £0.4m to the Group’s profit for the period between the date of acquisition and the balance sheet date. If the acquisition had been completed on the first day of the financial year, Group revenue from this acquisition for the period would have been £6.2m and the Group’s profit would have been £0.8m.
30 September
2014 30 September
2013 31 March
2014
DISPOSAL OF BUSINESSES AND SUBSIDIARY UNDERTAKINGS £m £m £m
Carrying value of net assets disposed of:
Goodwill - 7.7 7.7
Property, plant and equipment - 41.2 41.2
Current assets - 1.9 1.9
Other liabilities - (0.1) (0.1)
- 50.7 50.7
Redundancy and other - 9.6 9.6
Professional fees - 2.3 2.3
Gain on disposal - 16.5 16.5
Satisfied by cash received and receivable - 79.1 79.1
On 22 June 2013, the Group completed the disposal of eight London bus depots. The £79.1m consideration represent £76.3m cash received in the period and £2.8m of deferred consideration.
30 September
2014 30 September
2013 31 March
2014
17 SHARE CAPITAL £m £m £m
Allotted, called up and fully paid:
1,204.9m ordinary shares of 5p each 60.2 60.2 60.2
The number of ordinary shares of 5p each in issue, excluding treasury shares and shares held in trust for employees, at the end of the period was 1,204.5m (2013: 1,203.8m). At the end of the period 0.4m shares (2013: 1.1m shares) were being held as treasury shares and own shares held in trust for employees.
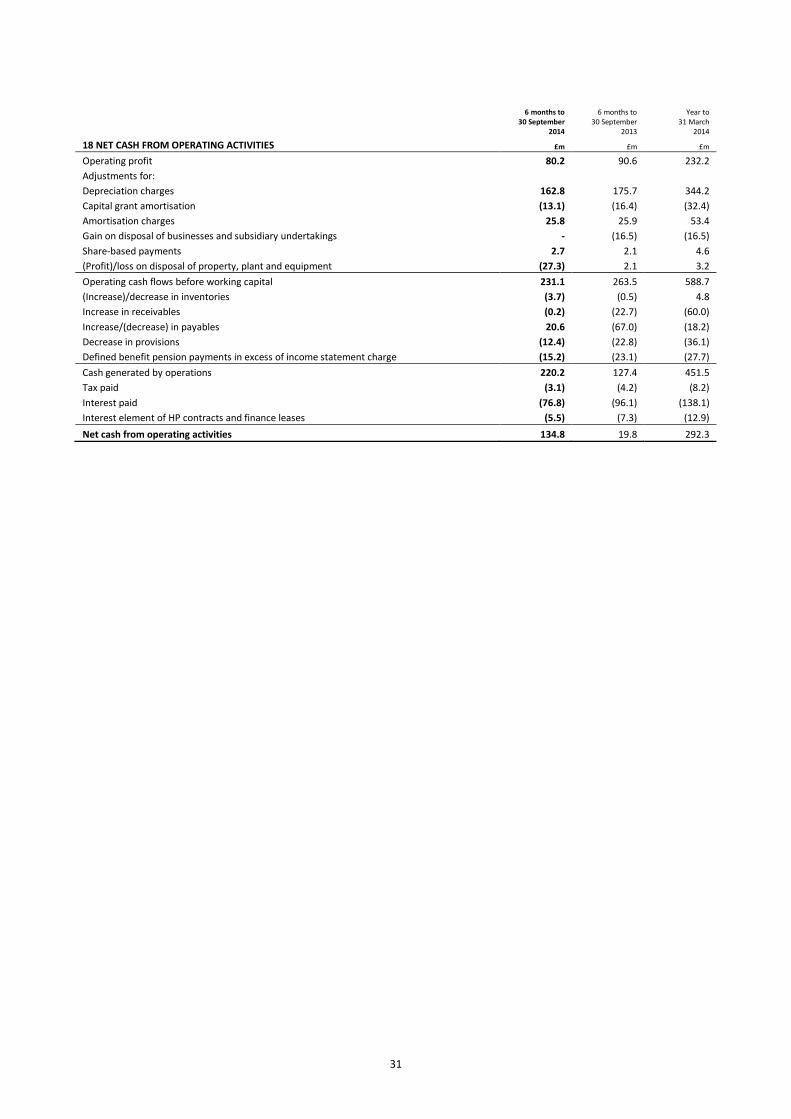
31
6 months to 30 September
2014
6 months to 30 September
2013
Year to 31 March
2014
18 NET CASH FROM OPERATING ACTIVITIES £m £m £m
Operating profit 80.2 90.6 232.2
Adjustments for:
Depreciation charges 162.8 175.7 344.2
Capital grant amortisation (13.1) (16.4) (32.4)
Amortisation charges 25.8 25.9 53.4
Gain on disposal of businesses and subsidiary undertakings - (16.5) (16.5)
Share-based payments 2.7 2.1 4.6
(Profit)/loss on disposal of property, plant and equipment (27.3) 2.1 3.2
Operating cash flows before working capital 231.1 263.5 588.7
(Increase)/decrease in inventories (3.7) (0.5) 4.8
Increase in receivables (0.2) (22.7) (60.0)
Increase/(decrease) in payables 20.6 (67.0) (18.2)
Decrease in provisions (12.4) (22.8) (36.1)
Defined benefit pension payments in excess of income statement charge (15.2) (23.1) (27.7)
Cash generated by operations 220.2 127.4 451.5
Tax paid (3.1) (4.2) (8.2)
Interest paid (76.8) (96.1) (138.1)
Interest element of HP contracts and finance leases (5.5) (7.3) (12.9)
Net cash from operating activities 134.8 19.8 292.3
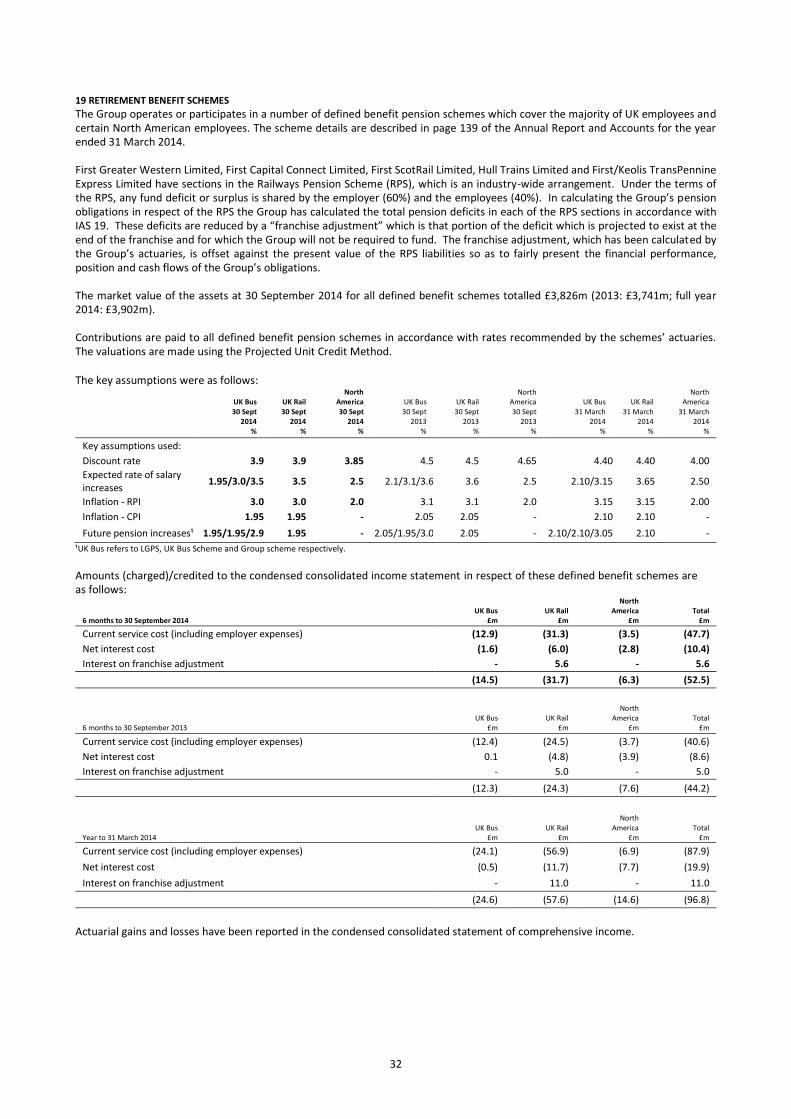
32
19 RETIREMENT BENEFIT SCHEMES
The Group operates or participates in a number of defined benefit pension schemes which cover the majority of UK employees and certain North American employees. The scheme details are described in page 139 of the Annual Report and Accounts for the year ended 31 March 2014. First Greater Western Limited, First Capital Connect Limited, First ScotRail Limited, Hull Trains Limited and First/Keolis TransPennine Express Limited have sections in the Railways Pension Scheme (RPS), which is an industry-wide arrangement. Under the terms of the RPS, any fund deficit or surplus is shared by the employer (60%) and the employees (40%). In calculating the Group’s pension obligations in respect of the RPS the Group has calculated the total pension deficits in each of the RPS sections in accordance with IAS 19. These deficits are reduced by a “franchise adjustment” which is that portion of the deficit which is projected to exist at the end of the franchise and for which the Group will not be required to fund. The franchise adjustment, which has been calculated by the Group’s actuaries, is offset against the present value of the RPS liabilities so as to fairly present the financial performance, position and cash flows of the Group’s obligations. The market value of the assets at 30 September 2014 for all defined benefit schemes totalled £3,826m (2013: £3,741m; full year 2014: £3,902m). Contributions are paid to all defined benefit pension schemes in accordance with rates recommended by the schemes’ actuaries. The valuations are made using the Projected Unit Credit Method. The key assumptions were as follows:
UK Bus 30 Sept
2014
UK Rail 30 Sept
2014
North America 30 Sept
2014
UK Bus 30 Sept
2013
UK Rail 30 Sept
2013
North America 30 Sept
2013
UK Bus 31 March
2014
UK Rail 31 March
2014
North America
31 March 2014
% % % % % % % % %
Key assumptions used:
Discount rate 3.9 3.9 3.85 4.5 4.5 4.65 4.40 4.40 4.00
Expected rate of salary increases
1.95/3.0/3.5 3.5 2.5 2.1/3.1/3.6 3.6 2.5 2.10/3.15 3.65 2.50
Inflation - RPI 3.0 3.0 2.0 3.1 3.1 2.0 3.15 3.15 2.00
Inflation - CPI 1.95 1.95 - 2.05 2.05 - 2.10 2.10 -
Future pension increases¹ 1.95/1.95/2.9 1.95 - 2.05/1.95/3.0 2.05 - 2.10/2.10/3.05 2.10 -
¹UK Bus refers to LGPS, UK Bus Scheme and Group scheme respectively.
Amounts (charged)/credited to the condensed consolidated income statement in respect of these defined benefit schemes are as follows:
UK Bus
UK Rail North
America
Total 6 months to 30 September 2014 £m £m £m £m
Current service cost (including employer expenses) (12.9) (31.3) (3.5) (47.7)
Net interest cost (1.6) (6.0) (2.8) (10.4)
Interest on franchise adjustment - 5.6 - 5.6
(14.5) (31.7) (6.3) (52.5)
North
UK Bus UK Rail America Total 6 months to 30 September 2013 £m £m £m £m
Current service cost (including employer expenses) (12.4) (24.5) (3.7) (40.6)
Net interest cost 0.1 (4.8) (3.9) (8.6)
Interest on franchise adjustment - 5.0 - 5.0
(12.3) (24.3) (7.6) (44.2)
North
UK Bus UK Rail America Total Year to 31 March 2014 £m £m £m £m
Current service cost (including employer expenses) (24.1) (56.9) (6.9) (87.9)
Net interest cost (0.5) (11.7) (7.7) (19.9)
Interest on franchise adjustment - 11.0 - 11.0
(24.6) (57.6) (14.6) (96.8)
Actuarial gains and losses have been reported in the condensed consolidated statement of comprehensive income.
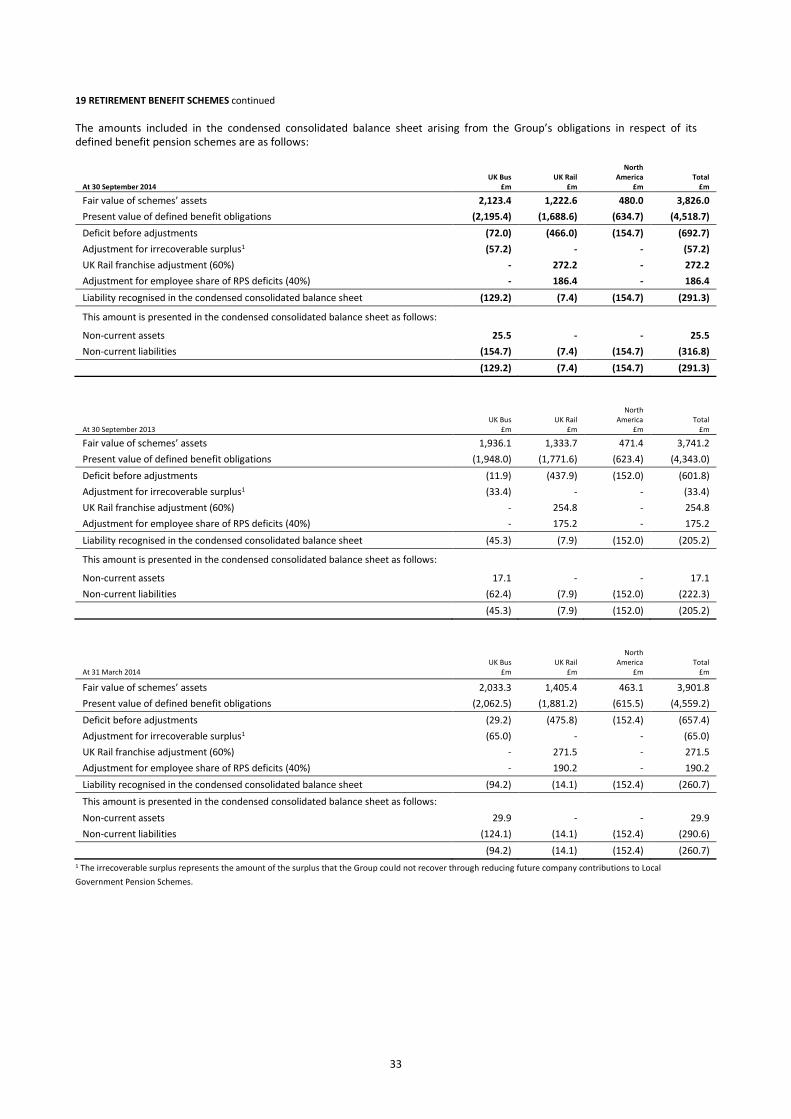
33
19 RETIREMENT BENEFIT SCHEMES continued
The amounts included in the condensed consolidated balance sheet arising from the Group’s obligations in respect of its defined benefit pension schemes are as follows:
North UK Bus UK Rail America Total At 30 September 2014 £m £m £m £m
Fair value of schemes’ assets 2,123.4 1,222.6 480.0 3,826.0
Present value of defined benefit obligations (2,195.4) (1,688.6) (634.7) (4,518.7)
Deficit before adjustments (72.0) (466.0) (154.7) (692.7)
Adjustment for irrecoverable surplus1 (57.2) - - (57.2)
UK Rail franchise adjustment (60%) - 272.2 - 272.2
Adjustment for employee share of RPS deficits (40%) - 186.4 - 186.4
Liability recognised in the condensed consolidated balance sheet (129.2) (7.4) (154.7) (291.3)
This amount is presented in the condensed consolidated balance sheet as follows:
Non-current assets 25.5 - - 25.5
Non-current liabilities (154.7) (7.4) (154.7) (316.8)
(129.2) (7.4) (154.7) (291.3)
North UK Bus UK Rail America Total At 30 September 2013 £m £m £m £m
Fair value of schemes’ assets 1,936.1 1,333.7 471.4 3,741.2
Present value of defined benefit obligations (1,948.0) (1,771.6) (623.4) (4,343.0)
Deficit before adjustments (11.9) (437.9) (152.0) (601.8)
Adjustment for irrecoverable surplus1 (33.4) - - (33.4)
UK Rail franchise adjustment (60%) - 254.8 - 254.8
Adjustment for employee share of RPS deficits (40%) - 175.2 - 175.2
Liability recognised in the condensed consolidated balance sheet (45.3) (7.9) (152.0) (205.2)
This amount is presented in the condensed consolidated balance sheet as follows:
Non-current assets 17.1 - - 17.1
Non-current liabilities (62.4) (7.9) (152.0) (222.3)
(45.3) (7.9) (152.0) (205.2)
North UK Bus UK Rail America Total At 31 March 2014 £m £m £m £m
Fair value of schemes’ assets 2,033.3 1,405.4 463.1 3,901.8
Present value of defined benefit obligations (2,062.5) (1,881.2) (615.5) (4,559.2)
Deficit before adjustments (29.2) (475.8) (152.4) (657.4)
Adjustment for irrecoverable surplus1 (65.0) - - (65.0)
UK Rail franchise adjustment (60%) - 271.5 - 271.5
Adjustment for employee share of RPS deficits (40%) - 190.2 - 190.2
Liability recognised in the condensed consolidated balance sheet (94.2) (14.1) (152.4) (260.7)
This amount is presented in the condensed consolidated balance sheet as follows:
Non-current assets 29.9 - - 29.9
Non-current liabilities (124.1) (14.1) (152.4) (290.6)
(94.2) (14.1) (152.4) (260.7)
1 The irrecoverable surplus represents the amount of the surplus that the Group could not recover through reducing future company contributions to Local
Government Pension Schemes.