financial statements - firstgroup plc/media/files/f/firstgroup-plc/indexed-pdfs... · equity...
TRANSCRIPT

Financial statements
Consolidated income statement 106Consolidated statement of comprehensive income 107Consolidated balance sheet 108Consolidated statement of changes in equity 109Consolidated cash flow statement 110Notes to the consolidated financial statements 111Independent auditor’s report 155Group financial summary 159Company balance sheet 160Statement of changes in equity 161Notes to the Company financial statements 162Shareholder information 166Financial calendar 167Glossary 168
FirstGroup Annual Report and Accounts 2016 105
Financial statements

Consolidated income statementFor the year ended 31 March
Continuing Operations Notes2016
£m2015
£m
Revenue 3,5 5,218.1 6,050.7Operating costs (4,971.8) (5,804.9)
Operating profit 5,6 246.3 245.8
Investment income 8 1.4 1.8Finance costs 8 (134.2) (141.8)
Profit before tax 113.5 105.8Tax 9 (17.1) (20.3)
Profit for the year 96.4 85.5
Attributable to:Equity holders of the parent 90.3 75.2Non-controlling interests 6.1 10.3
96.4 85.5
Earnings per shareBasic 10 7.5p 6.2pDiluted 10 7.5p 6.2p
Adjusted results1
Adjusted operating profit 4 300.7 303.6Adjusted profit before tax 4 168.3 163.9Adjusted EPS 10 10.3p 9.8p
1 Adjusted for certain items as set out in note 4.
The accompanying notes form an integral part of this consolidated income statement.
FirstGroup Annual Report and Accounts 2016106
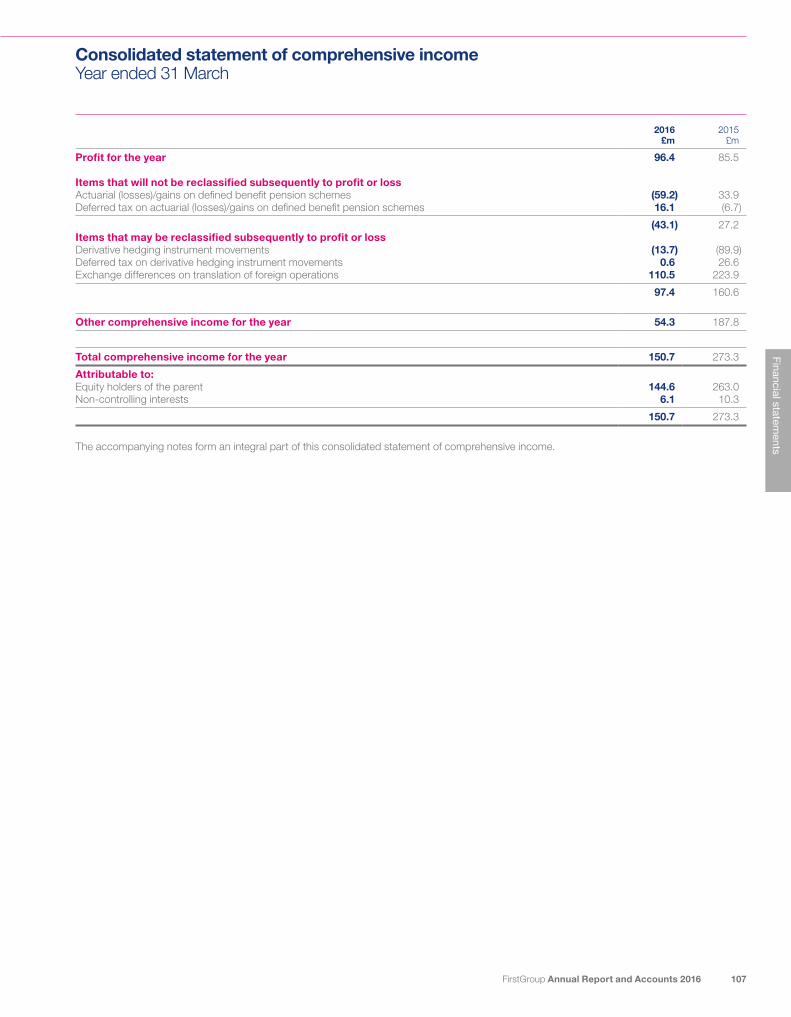
Consolidated statement of comprehensive incomeYear ended 31 March
2016 £m
2015 £m
Profit for the year 96.4 85.5
Items that will not be reclassified subsequently to profit or lossActuarial (losses)/gains on defined benefit pension schemes (59.2) 33.9Deferred tax on actuarial (losses)/gains on defined benefit pension schemes 16.1 (6.7)
(43.1) 27.2Items that may be reclassified subsequently to profit or lossDerivative hedging instrument movements (13.7) (89.9)Deferred tax on derivative hedging instrument movements 0.6 26.6Exchange differences on translation of foreign operations 110.5 223.9
97.4 160.6
Other comprehensive income for the year 54.3 187.8
Total comprehensive income for the year 150.7 273.3
Attributable to:Equity holders of the parent 144.6 263.0Non-controlling interests 6.1 10.3
150.7 273.3
The accompanying notes form an integral part of this consolidated statement of comprehensive income.
FirstGroup Annual Report and Accounts 2016 107
Financial statements

Consolidated balance sheetAs at 31 March
Note2016
£m2015
£m
Non-current assetsGoodwill 11 1,736.3 1,659.2Other intangible assets 12 162.2 197.0Property, plant and equipment 13 2,142.2 2,027.1Deferred tax assets 25 62.7 60.5Retirement benefit assets 35 31.0 32.9Derivative financial instruments 24 41.5 45.3Investments 14 25.4 3.1
4,201.3 4,025.1
Current assetsInventories 16 61.4 69.9Trade and other receivables 17 694.4 716.6Cash and cash equivalents 20 360.1 420.5Assets held for sale 18 3.5 1.4Derivative financial instruments 24 16.7 15.5
1,136.1 1,223.9
Total assets 5,337.4 5,249.0
Current liabilitiesTrade and other payables 19 1,101.9 1,139.0Tax liabilities 37.0 35.3Financial liabilities 21 168.4 136.0Derivative financial instruments 24 68.1 74.5
1,375.4 1,384.8
Net current liabilities 239.3 160.9
Non-current liabilitiesFinancial liabilities 21 1,712.1 1,805.7Derivative financial instruments 24 35.5 22.6Retirement benefit liabilities 35 301.9 272.3Deferred tax liabilities 25 17.0 40.7Provisions 26 262.3 236.7
2,328.8 2,378.0
Total liabilities 3,704.2 3,762.8
Net assets 1,633.2 1,486.2
EquityShare capital 27 60.2 60.2Share premium 676.4 676.4Hedging reserve 28 (68.6) (55.5)Other reserves 28 4.6 4.6Own shares 28 (1.4) (1.9)Translation reserve 29 352.2 241.7Retained earnings 585.4 533.1
Equity attributable to equity holders of the parent 1,608.8 1,458.6Non-controlling interests 24.4 27.6
Total equity 1,633.2 1,486.2
The accompanying notes form an integral part of this consolidated balance sheet.
Tim O’Toole14 June 2016
Matthew Gregory14 June 2016
FirstGroup Annual Report and Accounts 2016108

Consolidated statement of changes in equityYear ended 31 March
Share capital
£m
Share premium
£m
Hedging reserve
£m
Other reserves
£m
Own shares
£m
Translation reserve
£m
Retained earnings
£mTotal
£m
Non-controlling
interests £m
Total equity
£m
Balance at 1 April 2014 60.2 676.4 7.8 4.6 (1.8) 17.8 446.4 1,211.4 11.6 1,223.0Total comprehensive income for the year – – (63.3) – – 223.9 102.4 263.0 10.3 273.3Purchase of non-controlling interests1 – – – – – – (7.0) (7.0) (4.0) (11.0)Acquisition of non-controlling interests – – – – – – – – 11.7 11.7Non-controlling interests put option2 – – – – – – (12.8) (12.8) – (12.8)Dividends paid – – – – – – – – (2.0) (2.0)Movement in EBT and treasury shares – – – – (0.1) – (1.0) (1.1) – (1.1)Share-based payments – – – – – – 5.2 5.2 – 5.2Deferred tax on share-based payments – – – – – – (0.1) (0.1) – (0.1)
Balance at 31 March 2015 60.2 676.4 (55.5) 4.6 (1.9) 241.7 533.1 1,458.6 27.6 1,486.2Total comprehensive income for the year – – (13.1) – – 110.5 47.2 144.6 6.1 150.7Dividends paid – – – – – – – – (10.0) (10.0)Movement in EBT and treasury shares – – – – 0.5 – (1.3) (0.8) – (0.8)Share-based payments – – – – – – 6.4 6.4 – 6.4Other – – – – – – – – 0.7 0.7
Balance at 31 March 2016 60.2 676.4 (68.6) 4.6 (1.4) 352.2 585.4 1,608.8 24.4 1,633.2
1 On 14 August 2014, the Group purchased the non-controlling interests share of Hull Trains Limited for a consideration of £3.0m and on 24 March 2015, the Group purchased the non-controlling interests share of Cardinal Coach Lines UCL for a consideration of CAD$17.0m. As both of these represent a transaction with minority equity owners of the business without a change of control, they have been recognised as an equity transaction in the Group’s reserves and not as a business combination or investment.
2 On 25 August 2014, the Group completed the acquisition of a 51% share in Mile Square Transportation, Inc, a school bus transportation company based in New York. Included within the purchase agreement is a put option for the Group to purchase the remaining 49% from the non-controlling interest party for a fixed price of US$19.1m. As the put option is a contract to purchase the Group’s own equity instruments it gives rise to a financial liability for the fixed price amount in accordance with paragraph 23 in IAS 32. The financial liability has been recognised in the balance sheet and the initial recognition is treated as a reclassification from equity.
The accompanying notes form an integral part of this consolidated statement of changes in equity.
FirstGroup Annual Report and Accounts 2016 109
Financial statements

Consolidated cash flow statementYear ended 31 March
Note2016
£m2015
£m
Net cash from operating activities 31 409.5 325.2 Investing activitiesInterest received 1.4 1.8Proceeds from disposal of property, plant and equipment 19.5 47.5Purchases of property, plant, equipment and software (405.2) (428.9)Acquisition of subsidiary/business – (11.0)
Net cash used in investing activities (384.3) (390.6)
Financing activitiesDividends paid to non-controlling shareholders (10.0) (2.0)Shares purchased by Employee Benefit Trust – (1.1)Repayments under HP contracts and finance leases (80.3) (67.9)Fees for bank facility amendments and bond issues – (4.7)
Net cash flow used in financing activities (90.3) (75.7)
Net decrease in cash and cash equivalents before foreign exchange movements (65.1) (141.1)Cash and cash equivalents at beginning of year 420.5 553.9Foreign exchange movements 4.7 7.7
Cash and cash equivalents at end of year per consolidated balance sheet 360.1 420.5
Cash and cash equivalents are included within current assets on the consolidated balance sheet.
2016 £m
2015 £m
Net decrease in cash and cash equivalents in year (65.1) (141.1)Decrease in debt and finance leases 80.3 67.9Fees capitalised against bank facilities and bond issues – 4.7
Net cash flow 15.2 (68.5)Foreign exchange movements (15.3) (31.7)Other non-cash movements in relation to financial instruments (2.8) (3.3)
Movement in net debt in year (2.9) (103.5)Net debt at beginning of year (1,407.3) (1,303.8)
Net debt at end of year (1,410.2) (1,407.3)
Net debt excludes all accrued interest.
The accompanying notes form an integral part of this consolidated cash flow statement.
Note to the consolidated cash flow statement – reconciliation of net cash flow to movement in net debt
FirstGroup Annual Report and Accounts 2016110

Notes to the consolidated financial statements
1 General informationFirstGroup plc is a company incorporated in the United Kingdom under the Companies Act 2006. The address of the registered office is 395 King Street, Aberdeen, AB24 5RP. The nature of the Group’s operations and its principal activities are set out in the Strategic report on pages 4 to 46.
These financial statements are presented in pounds Sterling because that is the currency of the primary economic environment in which the Group operates. Foreign operations are included in accordance with the accounting policies set out in note 2.
2 Significant accounting policiesBasis of accountingThe financial statements have been prepared in accordance with IFRSs adopted and endorsed for use in the European Union and therefore comply with Article 4 of the EU IAS Regulation.
The financial statements have been prepared on the historical cost basis, except for the revaluation of certain financial instruments, and on a going concern basis as described in the going concern statement within other statutory information on pages 103 to 104. The principal accounting policies adopted are set out below.
The figures for the year to 31 March 2016 include the results of the First Rail business for the year to 31 March 2016 and the results of all the other businesses for the 52 weeks ended 26 March 2016. The figures for the year to 31 March 2015 include the results of the First Rail businesses for the year to 31 March 2015 and the results of all the other businesses for the 52 weeks ended 28 March 2015.
Basis of consolidationThe consolidated financial statements incorporate the financial statements of the Company and entities controlled by the Company (its subsidiaries). Control is achieved where the Company has the power to govern the financial and operating policies of an investee entity so as to obtain benefits from its activities.
Non-controlling interests in subsidiaries are identified separately from the Group’s equity interest therein. Those interests of non-controlling shareholders that are present ownership interests entitling their holders to a proportionate share of net assets upon liquidation may initially be measured at fair value or at the non-controlling interests’ proportionate share of their fair value of the acquiree’s identifiable net assets. The choice of measurement is made on an acquisition by acquisition basis. Other non-controlling interests are initially measured at fair value. Subsequent to acquisition, the carrying amount of non-controlling interests is the amount of those interests at initial recognition plus the non-controlling interests’ share of subsequent changes in equity. Total comprehensive income is attributed to non-controlling interests even if this results in the non-controlling interests having a deficit balance.
The results of subsidiaries acquired or disposed of during the year are included in the consolidated income statement from the effective date of acquisition or up to the effective date of disposal, as appropriate.
Where necessary, adjustments are made to the financial statements of subsidiaries to bring the accounting policies used into line with those used by the Group.
All intra-group transactions, balances, income and expenses are eliminated on consolidation.
Business combinationsThe acquisition of subsidiaries is accounted for using the acquisitions method. The consideration for each acquisition is measured at the aggregate of the fair values, at the date of exchange, of assets given, liabilities incurred or assumed, and equity instruments issued by the Group in exchange for control of the acquiree. Acquisition-related costs are recognised in the income statement as incurred.
The acquiree’s identifiable assets, liabilities and contingent liabilities that meet the conditions for recognition under IFRS 3 Business Combinations are recognised at their fair value at the acquisition date, with the exception of deferred tax assets or liabilities and liabilities or assets related to employee benefit arrangements, liabilities or equity instruments related to the replacement by the Group of an acquiree’s share-based payment and non-current assets (or disposal groups) that are classified as held for sale in accordance with IFRS 5 Non-Current Assets Held for Sale and Discontinued Operations, which are recognised and measured at fair value less costs to sell.
The interest of non-controlling shareholders in the acquiree is initially measured at the non-controlling shareholder’s proportion of the net fair value of the assets, liabilities and contingent liabilities recognised.
Investments in associatesAn associate is an entity over which the Group has significant influence and that is neither a subsidiary nor an interest in a joint venture. Significant influence is the power to participate in the financial and operating policy decisions of the investee but is not control or joint control over those policies. As a general rule, significant influence will be presumed to exist when the Group holds, directly or indirectly through subsidiaries, 20% or more of the voting power, of the investee. However, where it is clear that the Group, although holding 20% or more of the voting power does not have significant influence, the investment is not accounted for as an associate. The Group has a 30% holding in DSBFirst but does not have significant influence and therefore the holding is treated as an investment.
The results and assets and liabilities of associates are incorporated in these financial statements using the equity method of accounting, except when the investment is classified as held for sale, in which case it is accounted for in accordance with IFRS 5 Non-Current Assets Held for Sale and Discontinued Operations.
Under the equity method, investments in associates are carried in the consolidated balance sheet at cost as adjusted for post-acquisition changes in the Group’s share of the net assets of the associate, less any impairment in the value of individual investments. Losses of an associate in excess of the Group’s interest in that associate (which includes any long term interests that, in substance, form part of the Group’s net investment in the associate) are recognised only to the extent that the Group has incurred legal or constructive obligations or made payments on behalf of the associate.
FirstGroup Annual Report and Accounts 2016 111
Financial statements

2 Significant accounting policies continuedAssets held for saleAssets held for sale are measured at the lower of carrying amount and fair value less costs to sell.
Assets are classified as held for sale if their carrying amount will be recovered through a sale transaction rather than through continuing use. This condition is regarded as met only when the sale is highly probable and the asset is available for immediate sale in its present condition. Management must be committed to the sale which should be expected to qualify for recognition as a completed sale within one year of the date of classification.
Goodwill and intangible assetsGoodwill arising on consolidation is recognised as an asset at the date that control is acquired. Goodwill is measured as the excess of the sum of the consideration transferred, the amount of any non-controlling interest in the acquiree and the fair value of the acquirer’s previously held equity interest (if any) in the entity over the net of the acquisition date amounts of the identifiable assets acquired and liabilities assumed.
For the purpose of impairment testing, goodwill is allocated to each of the Group’s cash generating units (CGUs) which are tested for impairment annually, or more frequently where there is an indication that the CGU may be impaired. If the recoverable amount of the CGU is less than the carrying amount of the CGU, the impairment loss is allocated to the goodwill of the CGU and then to the other assets of the CGU pro-rata on the basis of the carrying amount of each asset in the CGU. An impairment loss recognised for goodwill is not reversed in a subsequent period. On disposal of a subsidiary, associate or jointly controlled entity, the attributable amount of goodwill is included in the determination of the profit or loss on disposal.
Goodwill arising on acquisitions before the date of transition to IFRS has been retained at the previous UK GAAP amounts subject to being tested for impairment at that date. Goodwill written off to reserves under UK GAAP prior to 1998 has not been reinstated and is not included in determining any subsequent profit or loss on disposal.
The existing finite life intangible assets have a residual value of nil and are amortised on a straight-line basis over their useful economic lives as follows:
Customer contracts – over the estimated life of the contract (9 to 10 years) Greyhound brand and trade name – over the estimated life of the brand (20 years) Franchise agreements – over the initial term of the franchise (2 to 10 years)
SoftwareComputer software is recognised separately as an intangible asset and is carried at cost less accumulated amortisation and accumulated impairment losses. Costs include software licences, web-site development, costs attributable to the development, design and implementation of the computer software and internal costs directly attributable to the software. Amortisation is calculated using the straight-line method over its estimated useful life of 3 to 5 years.
Revenue recognitionRevenue principally comprises revenue from train passenger services, road passenger transport, and certain management and maintenance services in the UK and North America. Where appropriate, amounts are shown net of rebates and sales taxes.
Revenue is recognised by reference to the stage of completion of the customers’ travel or services provided under contractual arrangements as the proportion of total services to be provided. Receipts for season tickets and travel cards are deferred within ‘Season ticket deferred income’ and recognised in the income statement over the period covered by the relevant ticket.
Revenue in First Rail includes franchise subsidy receipts from the Department for Transport (DfT) and Transport Scotland and amounts receivable under franchise arrangements. Franchise premium payments to the DfT for amounts due under the terms of a franchise are included in operating costs. Revenue also includes amounts attributable to the Train Operating Companies (TOCs), predominantly based on models of route usage, by the Railway Settlement Plan in respect of passenger receipts.
First Bus revenue principally comprises amounts receivable from ticket sales and concessionary fare schemes. Concessionary amounts are recognised in the period in which the service is provided. Greyhound coach revenue mainly comprises of amounts receivable from ticket sales. Other Bus, including First Student and First Transit, and services revenue from contracts with government bodies and similar organisations is recognised as the services are provided.
Interest income is recognised on an accruals basis.
LeasingLeases are classified as finance leases whenever the terms of the lease transfer substantially all the risks and rewards of ownership to the lessee. All other leases are classified as operating leases and the rental charges are charged against income on a straight-line basis over the life of the lease.
Assets held under hire purchase contracts and finance leases are recognised as assets of the Group at their fair value or, if lower, at the present value of the minimum lease payments, each determined at the inception of the lease. The corresponding liability is included in the balance sheet as a finance lease obligation. Lease payments are apportioned between finance charges and reduction of the lease obligation so as to achieve a constant rate of interest on the remaining balance of the liability. Finance charges are charged directly against income, unless they are directly attributable to qualifying assets, in which case they are capitalised in accordance with the Group’s general policy on borrowing costs (see below).
Benefits received and receivable as an incentive to enter into an operating lease are spread on a straight-line basis over the lease term.
Notes to the consolidated financial statementscontinued
FirstGroup Annual Report and Accounts 2016112
2 Significant accounting policies continuedForeign currenciesThe individual financial statements of each Group company are presented in the currency of the primary economic environment in which it operates (its functional currency). For the purpose of the consolidated financial statements, the results and financial position of each Group company are expressed in pounds Sterling, which is the functional currency of the Company, and the presentation currency for the consolidated financial statements.
In preparing the financial statements of the individual companies, transactions in currencies other than the functional currency are recorded at the rates of exchange prevailing on the dates of the transactions. At each balance sheet date, monetary assets and liabilities that are denominated in foreign currencies are retranslated at the rates prevailing on the balance sheet date. Non-monetary assets and liabilities carried at fair value that are denominated in foreign currencies are translated at the rates prevailing at the date when the fair value was determined. Non-monetary items that are measured in terms of historical cost in a foreign currency are not retranslated.
Exchange differences arising on the settlement of monetary items, and on the retranslation of monetary items, are included in profit or loss for the period. Exchange differences arising on the retranslation of non-monetary items carried at fair value are included in profit or loss for the period except for differences arising on the retranslation of non-monetary items in respect of which gains and losses are recognised directly in equity. For such non-monetary items, any exchange component of that gain or loss is also recognised directly in equity.
In order to hedge its exposure to certain foreign exchange risks, the Group holds currency swaps and borrowings in foreign currencies (see note 24 for details of the Group’s policies in respect of foreign exchange risks).
On consolidation, the assets and liabilities of the Group’s overseas operations are translated at the closing exchange rates on the balance sheet date. Income and expense items are translated at the average exchange rates for the period. Exchange differences arising from the average or actual exchange rates used and the period end rate, if any, are classified as equity and transferred to the Group’s translation reserve. Such translation differences are recognised as income or as expenses in the period in which the operation is disposed of.
Goodwill and fair value adjustments arising on the acquisition of a foreign entity are treated as assets and liabilities of the foreign entity and translated at the closing rate.
Borrowing costsBorrowing costs directly attributable to the acquisition, construction or production of qualifying assets, which are assets that necessarily take a substantial period of time to get ready for their intended use or sale, are added to the cost of those assets, until such time as the assets are substantially ready for their intended use or sale.
All other borrowing costs are recognised in profit or loss in the period in which they are incurred.
Non-GAAP measures and performanceIn measuring the Group adjusted performance, additional financial measures derived from the reported results have been used in order to eliminate factors which distort year on year comparisons. The Group’s adjusted performance is used to explain year on year changes when the effect of certain items are significant, including other intangible asset amortisation, business disposals, aged legal and self-insurance claims, revisions to onerous contracts and pension settlement gains or losses, as management consider that this basis more appropriately reflects operating performance and a better understanding of the key performance indicators of the business. See note 4 for the reconciliation to non-GAAP measures and performance.
Subsequent revisions to adjusting items are also recognised as an adjusting item in future periods. In the current year non-GAAP adjusting items principally relate to other intangible asset amortisation charges, pension past service gain, aged self-insurance and legal claims and business disposals. In the prior year the non-GAAP adjusting items principally related to amortisation charges, gain on disposal of property, aged legal claims associated with previous acquisitions, the impairment of a number of Group IT licences and business disposals.
Retirement benefit costsThe Group operates or participates in a number of pension schemes, which include both defined benefit schemes and defined contribution schemes.
Payments to defined contribution retirement benefit schemes are charged as an expense as they fall due. There is no legal or constructive obligation to pay additional contributions into a defined contribution scheme if the fund has insufficient assets to pay all employees’ benefits relating to employee service in the current and prior periods.
For defined benefit schemes, the cost of providing benefits is determined using the Projected Unit Credit Method, with actuarial updates being carried out at each balance sheet date. Actuarial gains and losses are recognised in full in the period in which they occur. They are recognised outside the income statement and presented in the consolidated statement of comprehensive income.
Past service cost is recognised immediately to the extent that the benefits are already vested, and otherwise is amortised on a straight-line basis over the average period until the benefits become vested.
Where changes to the benefits in payment on defined benefit pension schemes require a change in scheme rules or ratification by the Trustees, the change is recognised as a past service charge or credit in the income statement. Where changes in assumptions can be made without changing the Trustee agreement these are recognised as a change in assumptions in other comprehensive income.
The retirement benefit position recognised in the balance sheet represents the present value of the defined benefit obligation as adjusted for unrecognised past service cost, and as reduced by the fair value of scheme assets. Any asset resulting from this calculation is limited to past service cost, plus the present value of available refunds and reductions in future contributions to the scheme.
Various TOCs in the First Rail business participate in the Railways Pension Scheme, which is an industry-wide defined benefit scheme. The Group is obligated to fund the relevant section of the scheme over the period for which the franchise is held. The full liability is recognised on the balance sheet, which is then reduced by a franchise adjustment so that the net liability reflects the Group’s obligations to fund the scheme over the franchise term.
FirstGroup Annual Report and Accounts 2016 113
Financial statements

2 Significant accounting policies continuedTaxThe tax expense represents the sum of the tax currently payable and deferred tax.
The tax currently payable is based on taxable profit for the year. Taxable profit differs from net profit as reported in the income statement because it excludes items of income or expense that are taxable or deductible in other years and it further excludes items that are never taxable or deductible. The Group’s liability for current tax is calculated using tax rates that have been enacted or substantively enacted by the balance sheet date.
Deferred tax is the tax expected to be payable or recoverable on differences between the carrying amounts of assets and liabilities in the financial statements and the corresponding tax bases used in the computation of taxable profit, and is accounted for using the balance sheet liability method. Deferred tax liabilities are generally recognised for all taxable temporary differences and deferred tax assets are recognised to the extent that it is probable that taxable profits will be available against which deductible temporary differences can be utilised. Such assets and liabilities are not recognised if the temporary difference arises from the initial recognition of goodwill, or from the initial recognition (other than in a business combination) of other assets and liabilities in a transaction that affects neither the taxable profit nor the accounting profit.
Deferred tax liabilities are recognised for taxable temporary differences arising on investments in subsidiaries and associates, and interests in joint ventures, except where the Group is able to control the reversal of the temporary difference and it is probable that the temporary difference will not reverse in the foreseeable future.
The carrying amount of deferred tax assets is reviewed at each balance sheet date and reduced to the extent that it is no longer probable that sufficient taxable profits will be available to allow all or part of the asset to be recovered.
Deferred tax is calculated at the tax rates that are expected to apply in the period when the liability is settled or the asset is realised. Deferred tax is charged or credited in the income statement, except when it relates to items charged or credited directly to equity, in which case the deferred tax is also dealt with in equity.
Deferred tax assets and liabilities are offset when there is a legally enforceable right to set off current tax assets against current tax liabilities and when they relate to income taxes levied by the same tax authority and the Group intends to settle its current tax assets and liabilities on a net basis.
Property, plant and equipmentProperties for provision of services or administrative purposes are carried at cost, less any recognised impairment loss. Cost includes professional fees and, for qualifying assets, borrowing costs capitalised in accordance with the Group’s accounting policy. Depreciation of these assets, on the same basis as other property assets, commences when the assets are ready for their intended use.
Passenger carrying vehicles and other plant and equipment are stated at cost less accumulated depreciation and any recognised impairment loss.
Depreciation is charged so as to write off the cost of assets, other than freehold land, the land element of long leasehold properties or on assets in the course of construction, over their estimated useful lives, using the straight-line method, on the following bases:
Freehold buildings 50 years straight-lineLong leasehold buildings 50 years straight-lineShort leasehold properties period of leasePassenger carrying vehicles 7 to 17 years straight-lineOther plant and equipment 3 to 25 years straight-line
Assets held under finance leases are depreciated over their expected useful lives on the same basis as owned assets or, where shorter, over the term of the relevant lease.
The gain or loss arising on the disposal or retirement of an asset is determined as the difference between the sales proceeds and the carrying amount of the asset and is recognised in income.
Capital grantsCapital grants relating to property, plant and equipment are treated as deferred income and released to the income statement over the expected useful lives of the assets concerned. Capital grants are not recognised until there is a reasonable assurance that the Group will comply with the conditions attaching to them and that the grants will be received.
Impairment of tangible and intangible assets excluding goodwillAt each balance sheet date, the Group reviews the carrying amounts of its tangible and intangible assets to determine whether there is any indication that those assets have suffered an impairment loss. If any such indication exists, the recoverable amount of the asset is estimated in order to determine the extent of the impairment loss (if any). Where the asset does not generate cash flows that are independent from other assets, the Group estimates the recoverable amount of the CGU to which the asset belongs.
Recoverable amount is the higher of fair value less costs to sell and value in use. In assessing value in use, the estimated future cash flows are discounted to their present value using a pre-tax discount rate that reflects current market assessments of the time value of money and the risks specific to the asset for which the estimates of future cash flows have not been adjusted.
If the recoverable amount of an asset or CGU is estimated to be less than its carrying amount, the carrying amount of the asset or CGU is reduced to its recoverable amount. An impairment loss is recognised as an expense immediately.
Where an impairment loss subsequently reverses, the carrying amount of the asset or CGU is increased to the revised estimate of its recoverable amount, but so that the increased carrying amount does not exceed the carrying amount that would have been determined had no impairment loss been recognised for the asset or CGU in prior years. A reversal of an impairment loss is recognised as income immediately except in the case of goodwill, unless the relevant asset is carried at a revalued amount, in which case the reversal of the impairment loss is treated as a revaluation increase.
Notes to the consolidated financial statementscontinued
FirstGroup Annual Report and Accounts 2016114

2 Significant accounting policies continuedInventoriesInventories are stated at the lower of cost and net realisable value. Net realisable value represents the estimated selling price less all estimated costs of completion and costs to be incurred in marketing, selling and distribution.
Financial instrumentsFinancial assets and financial liabilities are recognised on the Group’s balance sheet when the Group becomes a party to the contractual provisions of the instrument.
Financial assetsThe Group measures financial assets on initial recognition at fair value, and determines the classification of such assets at initial recognition and on any subsequent reclassification event.
Where there is no active market for a financial asset, fair value is determined using valuation techniques including recent commercial transactions and discounted cash flows. Otherwise financial assets are carried at amortised cost.
Financial assets are classified into one of four primary categories:
Fair value through profit and lossThis covers any financial asset designated on initial recognition to be measured at fair value with fair value changes to go through the profit and loss, and financial assets acquired principally for the purpose of trading in the short term.
Held to maturity investmentsNon-derivative financial assets with fixed or determinable payments and fixed maturity are classified here when the Group has the intention and ability to hold to maturity. These financial assets are held at amortised cost using the effective interest method. Gains and losses are recognised in the income statement when the investments are derecognised or impaired as well as through amortisation.
Loans and receivablesNon-derivative financial assets with fixed or determinable payments that are not quoted in an active market have not been designated as either fair value through profit or loss or available for sale. Such assets are carried at amortised cost. Gains and losses are recognised in the income statement when the loans and receivables are derecognised or impaired as well as through amortisation.
The most significant financial assets under this category are trade receivables and bank deposits.
Trade receivables are measured at fair value, i.e. original invoice amount, less an allowance for uncollectable amounts. Appropriate allowances for estimated irrecoverable amounts are recognised in profit or loss when there is objective evidence that the asset is impaired.
Bank deposits are included within cash and cash equivalents. Cash and cash equivalents as defined for the cash flow statement comprise cash in hand, cash held at bank with immediate access, other short term investments and bank deposits with maturities of three months or less from the date of inception and bank overdrafts. In the consolidated balance sheet cash and cash equivalents exclude bank overdrafts. Bank overdrafts that have no legal right of set-off against cash and cash equivalents are included within borrowings in current liabilities. All are carried on the balance sheet at cost. Cash and cash equivalents includes ring-fenced cash. The most significant ring-fenced cash balances are held by the Group’s First Rail subsidiaries. Under the terms of the Rail franchise agreements, cash can only be distributed by the train operating companies up to the lower of the amount of retained profits or the amount determined by prescribed liquidity ratios. The ring-fenced cash represents that which is not available for distribution or the amount required to satisfy the contractual liquidity ratio at the balance sheet date.
Available for sale financial assetsAvailable for sale financial assets are non-derivative financial assets that are designated as such, or that are not classified in any of the other categories. After initial recognition these assets are measured at fair value with gains or losses being recognised as a separate component of equity until the investment is derecognised or the investment is determined to be impaired, at which time the previously reported cumulative gain or loss is included in the income statement.
Financial liabilities and equity instrumentsFinancial liabilities and equity instruments are classified according to the substance of the contractual arrangements entered into. An equity instrument is any contract that evidences a residual interest in the assets of the Group after deducting all of its liabilities. Equity instruments issued by the Company are recorded at the proceeds received net of direct issue costs.
Financial liabilitiesBank borrowingsInterest-bearing bank loans and overdrafts are recorded at the proceeds received, net of direct issue costs.
Bonds and loan notesThese are measured either on an amortised cost basis or at fair value, if adopted.
Trade payablesTrade payables are initially measured at fair value, and are subsequently measured at amortised cost, using the effective interest rate method.
Derivative financial instruments and hedge accountingThe Group uses derivative financial instruments to hedge interest rate risks, foreign currency risks and fuel price risks. Use of such financial instruments is governed by policies and delegated authorities approved by the Board. The Group does not use derivative financial instruments for speculative purposes.
FirstGroup Annual Report and Accounts 2016 115
Financial statements

2 Significant accounting policies continuedThe main derivative financial instruments used by the Group are interest rate swaps, fuel swaps, and cross currency interest rate swaps. Such instruments are initially recognised at fair value and subsequently remeasured to fair value at the reported balance sheet date. The fair values are calculated by reference to market exchange rates, interest rates and fuel prices at the period end, and supported by counterparty confirmations.
Changes in the fair value of derivative financial instruments that do not qualify for hedge accounting as cash flow hedges or foreign currency hedges of a foreign net investment are recognised in the income statement as they arise.
Hedge accounting is discontinued when the hedging instrument expires or is sold, terminated, or exercised, or no longer qualifies for hedge accounting. At that time, any cumulative gain or loss on the hedging instrument recognised in equity is retained in equity until the forecasted transaction occurs. If a hedged transaction is no longer expected to occur, the net cumulative gain or loss recognised in equity is transferred to the income statement for the period.
Derivatives embedded in other financial instruments or other host contracts are treated as separate derivatives when their risks and characteristics are not closely related to those of host contracts and the host contracts are not carried at fair value with unrealised gains or losses reported in the income statement.
DebtDebt is initially stated at the amount of the net proceeds after the deduction of issue costs. The carrying amount is increased by the amortisation of debt issuance fees in respect of the accounting period and reduced by repayments made in the period.
ProvisionsProvisions are recognised when the Group has a present obligation as a result of a past event and it is probable that the Group will be required to settle that obligation. Provisions are measured at the Directors’ best estimate of the expenditure required to settle the obligation at the balance sheet date and are discounted to present value where the effect is material. Amounts due within 12 months of the balance sheet date are considered to be reliably measured and are therefore included within accruals.
Self-insuranceThe Group’s policy is to self-insure high frequency, low value claims within the businesses. In addition there are typically a smaller number of major claims during a financial year for which cover is obtained through third-party insurance policies subject to an insurance deductible. Provision is made under IAS 37 Provisions, Contingent Liabilities and Contingent Assets for the estimated cost of settling uninsured claims for incidents occurring prior to the balance sheet date.
Share-based paymentsThe Group issues equity-settled share-based payments to certain employees. Equity-settled share-based payments are measured at fair value at the date of grant. The fair value is expensed on a straight-line basis over the vesting period, based on the Group’s estimate of shares that will eventually vest and is adjusted for the effects of non-market-based vesting conditions.
Fair value is measured by use of a Black-Scholes or other appropriate valuation models. The expected life used in the model has been adjusted, based on management’s best estimate, for the effects of non-transferability, exercise restrictions and behavioural considerations.
Dividend distributionDividend distribution to the Company’s shareholders is recognised as a liability in the Group’s financial statements in the period in which the dividends are approved by the Company’s shareholders.
New standards and interpretations not appliedThe International Accounting Standards Board and the International Financial Reporting Interpretations Committee (IFRIC) have issued the following standards and interpretations for annual periods beginning on or after the effective dates as noted below:
IAS/IFRS standards
Effective for accounting periods starting on or after
Amendments to IAS 27 (August 2014) Equity Method in Separate Financial Statements 1 January 20161
Amendments to IAS 1 (December 2015) Disclosure Initiative 1 January 20161
Amendments to IAS 16 and IAS 38 (May 2014) Clarification of Acceptable Methods of Depreciation and Amortisation
1 January 20161
Amendments to IFRS 11 (May 2014) Accounting for Acquisitions of Interests in Joint Operations 1 January 20161
Amendments to IFRS 10, IFRS 12 and IAS 28 (December 2015) Investment Entities: Applying the Consolidation Exception 1 January 20162
Amendments to IAS 12 (January 2016) Recognition of Deferred Tax Assets for Unrealised Losses 1 January 20172
Amendments to IAS 7 Disclosure Initiative 1 January 20172
IFRS 9 Financial Instruments 1 January 20182
IFRS 15 Revenue from Contracts with Customers 1 January 20182
IFRS 16 Leases 1 January 20192
Amendments to IFRS 10 and IAS 28 (September 2014) Sale or Contribution of Assets between an Investor and its Associate or Joint Venture
See below3
1 Mandatory for accounting periods starting on or after 1 January 2016 under EU adopting regulations.2 The mandatory adoption under EU adopting regulations has not yet been confirmed.3 The IASB has acknowledged a conflict between these amendments and IAS 28 Investments in Associates and Joint Ventures. In December 2015 the IASB
published an amendment to IFRS 10 and IAS 28, deferring the effective date of the amendments indefinitely.
Notes to the consolidated financial statementscontinued
FirstGroup Annual Report and Accounts 2016116

2 Significant accounting policies continuedThe Directors do not anticipate the adoption of these other standards will have a material impact on the Group’s accounts in the period of initial application other than the following:
IFRS 9 may impact the measurement and disclosure of the Group’s financial instruments.
The potential impact of IFRS 15 is being assessed.
IFRS 16 is expected to result in a material increase to both assets and liabilities of the Group and will reduce operating costs and increase finance costs.
A full assessment of the impact of these new standards will be undertaken prior to their adoption.
Adoption of new and revised standardsThe accounting policies adopted are consistent with those of the previous financial year except for a number of new and revised Standards and Interpretations which have been adopted in the current year. Their adoption has not had any significant impact on the amounts reported in these financial statements.
Critical accounting judgments and key sources of estimation uncertaintyIn the process of applying the Group’s accounting policies which are described above, management has made the following judgments and estimates that have the most significant effect on the amounts recognised in the financial statements.
Impairment of intangible assets (including goodwill)Determining whether goodwill is impaired requires an estimation of the value in use of the CGUs to which the goodwill has been allocated. The value in use requires the entity to estimate the future cash flows expected to arise from the CGU and a suitable discount rate in order to calculate present value. The carrying amount of goodwill at the balance sheet date was £1,736.3m (2015: £1,659.2m) as set out in note 11 and the carrying amount of other intangible assets at the balance sheet date was £162.2m (2015: £197.0m) as set out in note 12.
Contract and franchise accountingJudgments are made on an ongoing basis with regards to the recoverability of amounts due and the carrying value of related assets and liabilities arising from franchises and long term service contracts. Regular forecasts are compiled on the outcome of these types of franchises and contracts, which require assessments and judgments relating to the expected level of revenues and costs and, in cases where options exist, the life of the contract or franchise.
The useful economic lives of assets are determined by reference to the length of a franchise and matched to the franchise end date. The residual value of assets is determined by their condition at the franchise end date and by the amount of maintenance that has been carried out during the period of operation.
In particular First Rail has a number of contractual relationships including those with the DfT and Network Rail. Due to the regulated nature of the rail industry, disputes and claims typically arise with such bodies as well as other TOCs where one or more TOCs have access to common infrastructure such as railway lines. Judgment is required by management as to the amounts receivable and also payable taking account of the information available at the time.
Defined benefit pension arrangementsMeasurement of defined benefit pension obligations requires estimation of a suitable discount rate, the expected return on scheme assets, expected rate of inflation of future salary and pension costs along with assumptions about mortality rates. The most significant of these are the discount rate and inflation rate assumptions. A 0.1% movement in the discount rate would impact operating profit and the balance sheet position by approximately £1m and £32m respectively. A 0.1% movement in the inflation rate would impact operating profit and the balance sheet position by approximately £1m and £26m respectively. The net pension deficit as at the balance sheet date was £270.9m (2015: £239.4m) as set out in note 35.
Self-insuranceProvision is made for all known incidents for which there is self-insurance using management’s best estimate of the likely settlement of these incidents. The estimated settlement is reviewed on a regular basis with independent actuarial advice and the amount provided is adjusted as required. The Group’s total self-insurance provisions, including those classified within accruals, as at the balance sheet date were £363.8m (2015: £316.2m) as set out in note 26.
Tax provisionsAssessing the outcome of tax uncertainties requires judgements to be made regarding the result of negotiations with and enquires from tax authorities in a number of jurisdictions. Management assessments are based on business transaction facts and circumstances and the status of ongoing discussions with the relevant tax authorities.
3 Revenue2016
£m2015
£m
Services rendered 5,197.7 5,717.4Rail franchise subsidy receipts 20.4 333.3
Revenue 5,218.1 6,050.7Finance income 1.4 1.8
Total revenue as defined by IAS 18 5,219.5 6,052.5
FirstGroup Annual Report and Accounts 2016 117
Financial statements

4 Reconciliation to non-gaap measures and performanceIn measuring the Group adjusted performance, additional financial measures derived from the reported results have been used in order to eliminate factors which distort year on year comparisons. The Group’s adjusted performance is used to explain year on year changes when the effect of certain items are significant, including other intangible asset amortisation, business disposals, aged legal and self-insurance claims, revisions to onerous contracts and pension settlement gains or losses, as management consider that this basis more appropriately reflects operating performance and a better understanding of the key performance indicators of the business.
Reconciliation of operating profit to adjusted operating profit
Year to 31 March
2016 £m
Year to 31 March
2015 £m
Operating profit 246.3 245.8Adjustments for:Other intangible asset amortisation charges 51.9 54.3Gain on disposal of property – (25.3)Legal claims 1.0 12.2IT licences – 8.7First Bus depot sales and closures 1.8 7.5Pensions past service gain (10.8) –North America insurance reserves 10.5 –Other – 0.4
Total operating profit adjustments 54.4 57.8
Adjusted operating profit (note 5) 300.7 303.6
Reconciliation of profit before tax to adjusted profit before tax
Year to 31 March
2016 £m
Year to 31 March
2015 £m
Profit before tax 113.5 105.8Operating profit adjustments (see table above) 54.4 57.8Ineffectiveness on financial derivatives 0.4 0.3
Adjusted profit before tax 168.3 163.9
Adjusted tax charge (38.7) (36.1)Non-controlling interests (6.1) (10.3)
Adjusted earnings 123.5 117.5
The principal adjusting items are as follows:
Other intangible asset amortisation chargesThe charge for the year was £51.9m (2015: £54.3m). The reduction primarily reflects a lower charge in First Rail as the GWR franchise intangible was fully expensed at the end of Direct Award 1 partly offset by a higher charge for First Student due to the full year effect of the Mile Square acquisition.
Legal claimsA legal claim that pre-dates the Laidlaw acquisition and was acquired with the former Laidlaw entities had further adverse developments during the year and has been settled for £1.0m more than was originally provided for within adjusted items.
First Bus depot sales and closuresThere was a charge of £1.8m (2015: £7.5m) in the year relating to operating losses on a legacy depot closure.
Pensions past service gainDuring the year we agreed with the FirstGroup Pension Scheme Trustee to change the basis for revaluing pensions in payment from RPI to CPI. This change has led to a reduction in the liabilities and as a result £10.8m past service gain has been recognised.
North America Insurance reservesThere have been significant adverse developments on a small number of old and unusual insurance claims in North America during the year. The impact of these adverse developments was a charge of £10.5m.
Ineffectiveness on financial derivativesThere was a £0.4m (2015: £0.3m) non-cash charge during the year due to ineffectiveness on financial derivatives.
Year to 31 March 2015 underlyingIn addition, Management have presented underlying revenue for the year to 31 March 2015 which is in constant currency and adjusted for changes in the First Rail franchise portfolio.
Notes to the consolidated financial statementscontinued
FirstGroup Annual Report and Accounts 2016118

4 Reconciliation to non-gaap measures and performance continuedA reconciliation is set out below:
Revenue £m
Year to 31 March 2015 as reported 6,050.7Changes in First Rail franchise portfolio (952.4)Foreign exchange movements 134.0
Year to 31 March 2015 underlying 5,232.3
5 Business segments and geographical informationFor management purposes, the Group is organised into five operating divisions – First Student, First Transit, Greyhound, First Bus and First Rail. These divisions are managed separately in line with the differing services that they provide and the geographical markets which they operate in. The principal activities of these divisions are described in the Strategic report.
The segment results for the year to 31 March 2016 are as follows:
First Student
£m
First Transit
£mGreyhound
£mFirst Bus
£mFirst Rail
£m
Group items1
£mTotal
£m
Revenue 1,553.5 864.8 605.1 870.9 1,308.4 15.4 5,218.1
EBITDA2 266.4 74.7 69.7 113.4 122.4 (30.7) 615.9Depreciation (153.8) (14.6) (34.2) (61.4) (60.0) (1.7) (325.7)Capital grant amortisation – – – – 10.5 – 10.5
Segment results2 112.6 60.1 35.5 52.0 72.9 (32.4) 300.7
Other intangible asset amortisation charges (42.1) (3.4) (3.1) – (3.3) – (51.9)Other adjustments (note 4) (2.8) (7.2) (1.5) (1.8) – 10.8 (2.5)
Operating profit3 67.7 49.5 30.9 50.2 69.6 (21.6) 246.3
Investment income 1.4Finance costs (134.2)
Profit before tax 113.5
Tax (17.1)
Profit after tax 96.4
Other information
First Student
£m
First Transit
£mGreyhound
£mFirst Bus
£mFirst Rail
£m
Group items1
£mTotal
£m
Capital additions 207.5 20.6 24.8 91.3 65.6 2.2 412.0
Balance sheet4
Total assets
£m
Total liabilities
£m
Net assets/ (liabilities)
£m
First Student 2,656.0 (421.9) 2,234.1First Transit 501.6 (151.6) 350.0Greyhound 632.9 (328.4) 304.5First Bus 776.6 (296.5) 480.1First Rail 212.1 (424.1) (212.0)
4,779.2 (1,622.5) 3,156.7Group items1 135.4 (257.4) (122.0)Net debt 360.1 (1,770.3) (1,410.2)Taxation 62.7 (54.0) 8.7
Total 5,337.4 (3,704.2) 1,633.2
1 Group items comprise Tram operations, central management and other items.2 EBITDA is adjusted operating profit less capital grant amortisation plus depreciation. 3 Although the segment results are used by management to measure performance, statutory operating profit by operating division is also disclosed
for completeness.4 Segment assets and liabilities are determined by identifying the assets and liabilities that relate to the business of each segment but excluding intercompany
balances, net debt and taxation.
FirstGroup Annual Report and Accounts 2016 119
Financial statements

5 Business segments and geographical information continuedThe segment results for the year to 31 March 2015 are as follows:
First Student
£m
First Transit
£mGreyhound
£mFirst Bus
£mFirst Rail
£m
Group items1
£mTotal
£m
Revenue 1,478.8 844.8 609.6 896.1 2,207.1 14.3 6,050.7
EBITDA2 260.9 72.1 73.1 118.5 137.8 (38.0) 624.4Depreciation (146.0) (12.4) (31.4) (66.7) (96.2) (0.6) (353.3)Capital grant amortisation – – – – 32.5 – 32.5
Segment results2 114.9 59.7 41.7 51.8 74.1 (38.6) 303.6
Other intangible asset amortisation charges (39.8) (3.4) (2.9) – (8.2) – (54.3)Other adjustments (note 4) (12.2) – 25.3 (7.9) – (8.7) (3.5)
Operating profit3 62.9 56.3 64.1 43.9 65.9 (47.3) 245.8
Investment income 1.8Finance costs (141.8)
Profit before tax 105.8
Tax (20.3)
Profit after tax 85.5
Other information
First Student
£m
First Transit
£mGreyhound
£mFirst Bus
£mFirst Rail
£m
Group items1
£mTotal
£m
Capital additions 179.9 21.1 50.9 93.9 76.1 3.5 425.4
Balance sheet4
Total assets
£m
Total liabilities
£m
Net assets/(liabilities)
£m
First Student 2,524.9 (465.9) 2,059.0First Transit 460.2 (137.3) 322.9Greyhound 616.1 (301.7) 314.4First Bus 723.6 (230.6) 493.0First Rail 275.3 (452.0) (176.7)
4,600.1 (1,587.5) 3,012.6Group items1 167.9 (271.5) (103.6)Net debt 420.5 (1,827.8) (1,407.3)Taxation 60.5 (76.0) (15.5)
Total 5,249.0 (3,762.8) 1,486.2
1 Group items comprise Tram operations, central management and other items.2 EBITDA is adjusted operating profit less capital grant amortisation plus depreciation. 3 Although the segment results are used by management to measure performance, statutory operating profit by operating division is also disclosed
for completeness.4 Segment assets and liabilities are determined by identifying the assets and liabilities that relate to the business of each segment but excluding intercompany
balances, net debt and taxation.
Geographical informationThe Group’s operations are located predominantly in the United Kingdom, United States of America and Canada. The following table provides an analysis of the Group’s revenue by geographical market:
Revenue2016
£m2015
£m
United Kingdom 2,194.7 3,117.5United States of America 2,634.5 2,460.7Canada 388.9 472.5
5,218.1 6,050.7
Notes to the consolidated financial statementscontinued
FirstGroup Annual Report and Accounts 2016120

5 Business segments and geographical information continuedThe following is an analysis of non-current assets excluding financial instruments, deferred tax and pensions, the carrying amount of segment assets, and additions to property, plant and equipment and intangible assets, analysed by the geographical area in which the assets are located:
Non-current assets excluding financial instruments
deferred tax and pensions
Additions to property, plant and equipment and intangible assets
Carrying amount of segment total assets
2016 £m
2015 £m
2016 £m
2015 £m
2016 £m
2015 £m
United Kingdom 788.5 762.7 159.0 173.5 1,489.1 1,587.2United States of America 2,939.8 2,757.9 242.3 226.6 3,383.1 3,164.7Canada 337.8 365.8 10.7 25.3 402.5 436.6Unallocated corporate items – – – – 62.7 60.5
4,066.1 3,886.4 412.0 425.4 5,337.4 5,249.0
6 Operating profitOperating profit has been arrived at after charging/(crediting):
2016 £m
2015 £m
Depreciation of property, plant and equipment (note 13) 325.7 353.3Operating lease charges (note 33) 267.5 489.5Other intangible asset amortisation charges (note 12) 51.9 54.3Capital grant amortisation (10.5) (32.5)Cost of inventories recognised as an expense 600.0 666.2Employee costs (note 7) 2,667.5 2,832.7Auditor’s remuneration (see below) 1.6 1.7Rail franchise payments 105.8 170.3Other operating costs1 962.3 1,269.4
4,971.8 5,804.9
1 Includes £66.6m (2015: £65.7m) received or receivable from government bodies in respect of bus service operator grants and fuel duty rebates.
Amounts payable to Deloitte LLP and their associates by the Company and its subsidiary undertakings in respect of audit and non-audit services are shown below:
2016 £m
2015 £m
Fees payable to the Company’s auditor for the audit of the Company’s annual accounts 0.1 0.1Fees payable to the Company’s auditor and their associates for the audit of theCompany’s subsidiaries pursuant to legislation 1.3 1.4
Total audit fees 1.4 1.5
Audit-related assurance services 0.2 0.1Other taxation advisory services – 0.1
Total non-audit fees 0.2 0.2
Fees payable to Deloitte LLP and their associates for non-audit services to the Company are not required to be disclosed because the consolidated financial statements are required to disclose such fees on a consolidated basis.
Details of the Group’s policy on the use of auditors for non-audit services, the reasons why the auditor was used rather than another supplier and how the auditor’s independence and objectivity was safeguarded are set out in the Corporate governance report on pages 65 to 66. No services were provided pursuant to contingent fee arrangements.
FirstGroup Annual Report and Accounts 2016 121
Financial statements

7 Employee costsThe average monthly number of employees (including Executive Directors) was:
2016 Number
2015 Number
Operational 102,287 107,843Administration 6,337 6,527
108,624 114,370
The aggregate remuneration (including Executive Directors) comprised:
2016 £m
2015 £m
Wages and salaries 2,340.5 2,453.4Social security costs 253.6 262.1Other pension costs (note 35) 73.4 117.2
2,667.5 2,832.7
Wages and salaries include a charge in respect of share-based payments of £6.4m (2015: £5.2m).
Disclosures on Directors’ remuneration, share options, long term incentive schemes and pension entitlements required by the Companies Act 2006 and those specified for audit by the Financial Conduct Authority are contained in the tables/notes within the Directors’ remuneration report on pages 70 to 100 and form part of these audited financial statements.
8 Investment income and finance costs2016
£m2015
£m
Investment incomeBank interest receivable (1.4) (1.8)
Finance costsBonds 84.2 84.9Bank borrowings 13.0 16.8Senior unsecured loan notes 4.3 4.1Loan notes 1.0 1.0Finance charges payable in respect of HP contracts and finance leases 8.9 9.4Notional interest on long term provisions 14.8 15.2Notional interest on pensions 7.6 10.1
Finance costs before adjustments 133.8 141.5
Hedge ineffectiveness on financial derivatives 0.4 0.3
Total finance costs 134.2 141.8
Finance costs before adjustments 133.8 141.5
Investment income (1.4) (1.8)
Net finance cost before adjustments 132.4 139.7
Finance costs are stated after charging fee expenses of £2.5m (2015: £3.6m). There was no interest capitalised into qualifying assets in either the year ended 31 March 2016 or 31 March 2015.
Notes to the consolidated financial statementscontinued
FirstGroup Annual Report and Accounts 2016122
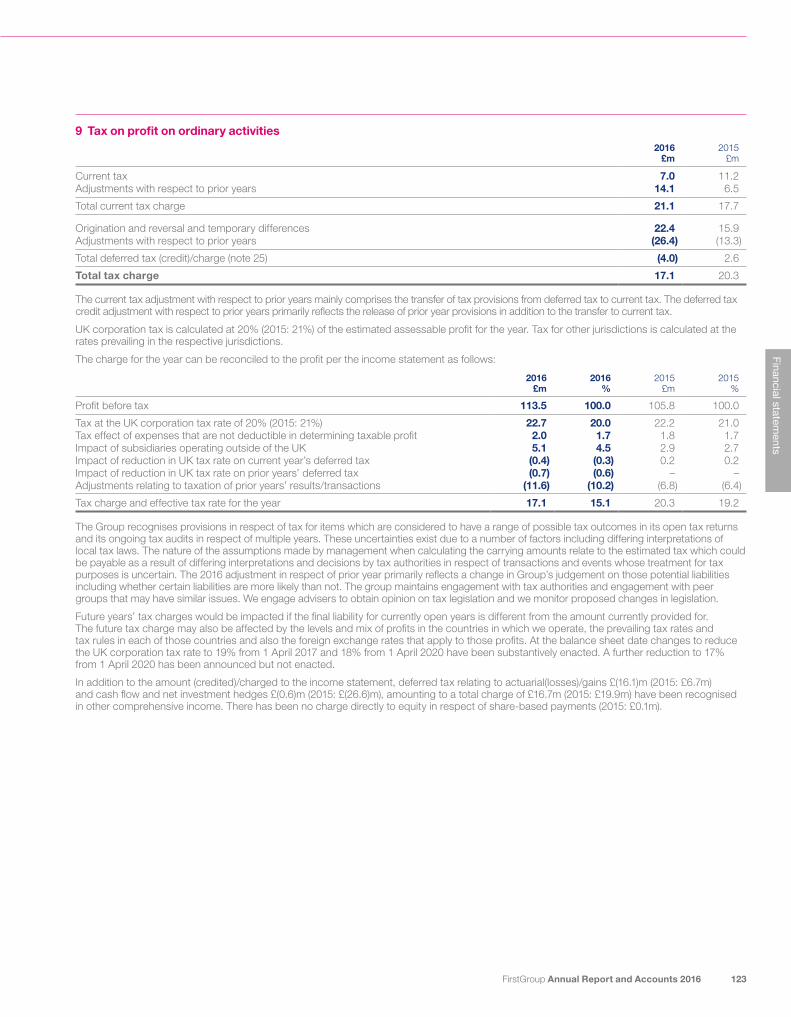
9 Tax on profit on ordinary activities2016
£m2015
£m
Current tax 7.0 11.2Adjustments with respect to prior years 14.1 6.5
Total current tax charge 21.1 17.7
Origination and reversal and temporary differences 22.4 15.9 Adjustments with respect to prior years (26.4) (13.3)
Total deferred tax (credit)/charge (note 25) (4.0) 2.6
Total tax charge 17.1 20.3
The current tax adjustment with respect to prior years mainly comprises the transfer of tax provisions from deferred tax to current tax. The deferred tax credit adjustment with respect to prior years primarily reflects the release of prior year provisions in addition to the transfer to current tax.
UK corporation tax is calculated at 20% (2015: 21%) of the estimated assessable profit for the year. Tax for other jurisdictions is calculated at the rates prevailing in the respective jurisdictions.
The charge for the year can be reconciled to the profit per the income statement as follows:
2016 £m
2016 %
2015 £m
2015 %
Profit before tax 113.5 100.0 105.8 100.0
Tax at the UK corporation tax rate of 20% (2015: 21%) 22.7 20.0 22.2 21.0Tax effect of expenses that are not deductible in determining taxable profit 2.0 1.7 1.8 1.7Impact of subsidiaries operating outside of the UK 5.1 4.5 2.9 2.7Impact of reduction in UK tax rate on current year’s deferred tax (0.4) (0.3) 0.2 0.2Impact of reduction in UK tax rate on prior years’ deferred tax (0.7) (0.6) – –Adjustments relating to taxation of prior years’ results/transactions (11.6) (10.2) (6.8) (6.4)
Tax charge and effective tax rate for the year 17.1 15.1 20.3 19.2
The Group recognises provisions in respect of tax for items which are considered to have a range of possible tax outcomes in its open tax returns and its ongoing tax audits in respect of multiple years. These uncertainties exist due to a number of factors including differing interpretations of local tax laws. The nature of the assumptions made by management when calculating the carrying amounts relate to the estimated tax which could be payable as a result of differing interpretations and decisions by tax authorities in respect of transactions and events whose treatment for tax purposes is uncertain. The 2016 adjustment in respect of prior year primarily reflects a change in Group’s judgement on those potential liabilities including whether certain liabilities are more likely than not. The group maintains engagement with tax authorities and engagement with peer groups that may have similar issues. We engage advisers to obtain opinion on tax legislation and we monitor proposed changes in legislation.
Future years’ tax charges would be impacted if the final liability for currently open years is different from the amount currently provided for. The future tax charge may also be affected by the levels and mix of profits in the countries in which we operate, the prevailing tax rates and tax rules in each of those countries and also the foreign exchange rates that apply to those profits. At the balance sheet date changes to reduce the UK corporation tax rate to 19% from 1 April 2017 and 18% from 1 April 2020 have been substantively enacted. A further reduction to 17% from 1 April 2020 has been announced but not enacted.
In addition to the amount (credited)/charged to the income statement, deferred tax relating to actuarial(losses)/gains £(16.1)m (2015: £6.7m) and cash flow and net investment hedges £(0.6)m (2015: £(26.6)m), amounting to a total charge of £16.7m (2015: £19.9m) have been recognised in other comprehensive income. There has been no charge directly to equity in respect of share-based payments (2015: £0.1m).
FirstGroup Annual Report and Accounts 2016 123
Financial statements

10 Earnings per share (EPS)EPS is calculated by dividing the profit attributable to equity shareholders of £90.3m (2015: £75.2m) by the weighted average number of ordinary shares of 1,204.0m (2015: 1,204.0m). The number of ordinary shares used for the basic and diluted calculations are shown in the table below.
The difference in the number of shares between the basic calculation and the diluted calculation represents the weighted average number of potentially dilutive ordinary share options.
2016 Number
m
2015 Number
m
Weighted average number of shares used in basic calculation 1,204.0 1,204.0Executive share options 8.0 3.6
Weighted average number of shares used in the diluted calculation 1,212.0 1,207.6
The adjusted EPS is intended to highlight the recurring results of the Group before amortisation charges, ineffectiveness on financial derivatives and certain other adjustments as set out in note 4. A reconciliation is set out below:
2016 2015
£m EPS (p) £m EPS (p)
Basic profit/EPS 90.3 7.5 75.2 6.2Amortisation charges (note 12) 51.9 4.4 54.3 4.5Ineffectiveness on financial derivatives 0.4 – 0.3 –Other adjustments (note 4) 2.5 0.2 3.5 0.3Tax effect of above adjustments (21.6) (1.8) (15.8) (1.2)
Adjusted profit/EPS 123.5 10.3 117.5 9.8
Diluted EPS2016
pence2015
pence
Diluted EPS 7.5 6.2Adjusted diluted EPS 10.2 9.7
11 Goodwill2016
£m2015
£m
Cost At 1 April 1,663.2 1,513.5Additions (note 30) – 1.7Foreign exchange movements 77.1 148.0
At 31 March 1,740.3 1,663.2
Accumulated impairment losses
At 1 April and 31 March 4.0 4.0
Carrying amountAt 31 March 1,736.3 1,659.2
Goodwill acquired in a business combination is allocated, at acquisition, to the CGUs that are expected to benefit from that business combination. The carrying amount of goodwill has been allocated as follows:
2016 £m
2015 £m
Carrying amount First Student 1,123.0 1,073.5First Transit 273.2 259.5Greyhound 257.6 244.6First Bus 76.9 76.0First Rail 5.6 5.6
1,736.3 1,659.2
Notes to the consolidated financial statementscontinued
FirstGroup Annual Report and Accounts 2016124

11 Goodwill continuedImpairment testingAt the year end the carrying value of goodwill was reviewed for impairment in accordance with IAS 36 Impairment of Assets. For the purposes of this impairment review goodwill has been tested for impairment on the basis of discounted future cash flows arising in each relevant CGU.
The Group prepares cash flow forecasts derived from the most recent budget for 2016/17 and Three Year Plan projections up to 2018/19 (2015: Five Year Plan) which take account of both past performance and expectations for future market developments. The projections for First Student assume the incremental benefits of the existing recovery plan, the programme to address contract portfolio pricing together with an economic recovery. Cash flows beyond the plan period are extrapolated using estimated growth rates of 2.5% (2015: 2.5%) for the United Kingdom and 3.0% (2015: 3.0%) for North America which do not exceed the long term average growth rate for the market. Cash flows are discounted using a pre-tax discount rate of 8.1% (2015: 9.0%) for the United Kingdom CGUs and 8.9% (2015: 10.0%) for the North American CGUs to arrive at the value in use. The pre-tax discount rates applied are derived from a market participant’s weighted average cost of capital. The assumptions used in the calculation of the Group’s weighted average cost of capital are benchmarked to externally available data.
The Directors consider the assumptions to be reasonable based on the historic performance of each CGU and to be realistic in light of economic and industry forecasts.
The calculation of value in use for each CGU is most sensitive to the principal assumptions of discount rate, growth rates and margins achievable. Sensitivity analysis has been performed on the calculations and confirms that no reasonably possible changes in the assumptions would cause the carrying amount of the CGUs to exceed their recoverable amount in respect of the First Transit, Greyhound, First Bus and First Rail divisions.
The value in use of the First Student division exceeds its carrying amount by £232.3m (2015: £300.9m). The sensitivity analysis indicates that the First Student margin would need to fall in excess of 87 basis points compared to medium term expectations, or long term growth rates would need to fall in excess of 66 basis points for there to be an impairment to the carrying value of net assets in this business. An increase in the discount rate in excess of 59 basis points would lead to the value in use of the division being less than its carrying amount.
Following their review of goodwill the Directors have concluded that there is no impairment to any of the CGUs.
12 Other intangible assets
Customer contracts
£m
Greyhound brand and
trade name £m
Rail franchise
agreements £m
Software £m
Total £m
CostAt 1 April 2014 362.2 58.1 36.1 – 456.4Acquisitions (note 30) 15.8 – – – 15.8Additions 0.3 – – – 0.3Foreign exchange movements 36.5 5.2 – – 41.7
At 31 March 2015 414.8 63.3 36.1 – 514.2Additions – – – 11.6 11.6Cessation of franchise – – (30.6) – (30.6)Foreign exchange movements 19.0 2.7 – – 21.7
At 31 March 2016 433.8 66.0 5.5 11.6 516.9
AmortisationAt 1 April 2014 194.5 19.2 24.8 – 238.5Charge for year 43.3 2.9 8.1 – 54.3Foreign exchange movements 22.5 1.9 – – 24.4
At 31 March 2015 260.3 24.0 32.9 – 317.2Charge for year 45.6 3.1 3.2 – 51.9Cessation of franchise – – (30.6) – (30.6)Foreign exchange movements 15.0 1.2 – – 16.2
At 31 March 2016 320.9 28.3 5.5 – 354.7
Carrying amountAt 31 March 2016 112.9 37.7 – 11.6 162.2
At 31 March 2015 154.5 39.3 3.2 – 197.0
Intangible assets include customer contracts, the Greyhound brand and trade name which were acquired through the purchases of businesses and subsidiary undertakings and software. These are being amortised over their useful economic lives as shown in note 2 to the consolidated financial statements.
The rail franchise agreements’ intangible asset represents the part of the economic benefit that is realised as a result of recognising our share of the rail pension deficit on the date of commencement of each respective franchise and is amortised on a straight-line basis over the initial term of each respective franchise.
FirstGroup Annual Report and Accounts 2016 125
Financial statements

13 Property, plant and equipment
Land and buildings
£m
Passenger carrying
vehicle fleet £m
Other plant and
equipment £m
Total £m
CostAt 1 April 2014 451.9 2,656.3 825.4 3,933.6Additions in the year 32.0 281.8 102.1 415.9Acquisitions (note 30) – 7.8 – 7.8Disposals (7.4) (99.3) (100.2) (206.9)Impairment – – (8.7) (8.7)Reclassified as held for sale – (64.4) – (64.4)Foreign exchange movements 20.6 196.0 23.8 240.4
At 31 March 2015 497.1 2,978.2 842.4 4,317.7Additions in the year 16.7 285.3 98.4 400.4Disposals (41.3) (96.5) (281.2) (419.0)Reclassified as held for sale (1.8) (100.4) – (102.2)Foreign exchange movements 12.3 117.3 14.6 144.2
At 31 March 2016 483.0 3,183.9 674.2 4,341.1
Accumulated depreciation and impairmentAt 1 April 2014 89.4 1,346.9 632.4 2,068.7Charge for year 12.2 216.1 125.0 353.3Disposals (1.1) (88.0) (98.6) (187.7)Reclassified as held for sale – (63.0) – (63.0)Foreign exchange movements 3.7 98.7 16.9 119.3
At 31 March 2015 104.2 1,510.7 675.7 2,290.6Charge for year 9.3 225.8 90.6 325.7Disposals (33.7) (87.2) (274.9) (395.8)Reclassified as held for sale (0.2) (98.5) – (98.7)Foreign exchange movements 2.6 64.0 10.5 77.1
At 31 March 2016 82.2 1,614.8 501.9 2,198.9
Carrying amountAt 31 March 2016 400.8 1,569.1 172.3 2,142.2
At 31 March 2015 392.9 1,467.5 166.7 2,027.1
An amount of £1.2m (2015: £33.4m) in respect of assets under construction is included in the carrying amount of land and buildings, plant and equipment.
At 31 March 2016 the Group had entered into contractual capital commitments amounting to £168.0m (2015: £137.6m), principally representing buses ordered in the United Kingdom and North America and commitments under the Great Western Railway franchise.
Property, plant and equipment held under HP contracts and finance leases are analysed as follows:
2016 £m
2015 £m
Passenger carrying vehicle fleet – cost 465.5 526.7– depreciation (188.2) (170.9)
Net passenger carrying vehicle fleet 277.3 355.8
Other plant and equipment – cost 0.7 3.0– depreciation (0.5) (1.3)
Net other plant and equipment 0.2 1.7
Total net book value 277.5 357.5
The title to the assets under HP contracts and finance leases is held by the lenders.
Notes to the consolidated financial statementscontinued
FirstGroup Annual Report and Accounts 2016126

14 Investments2016
£m2015
£m
US deferred compensation plan assets 22.4 –Other investments 3.0 3.1
25.4 3.1
The US deferred compensation plan assets have been reclassified from prepayments in the current year.
15 SubsidiariesA list of the significant investments in subsidiaries, including the name, country of incorporation and proportion of ownership interest is given below.
A full list of subsidiaries, joint ventures and associates is disclosed in note 38.
UK local bus and coach operators Rail companies North American school bus operators
First Aberdeen Limited1 First Greater Western Limited Cardinal Coach Lines Limited2
First Beeline Buses Limited First/Keolis TransPennine Limited (55%) First Canada ULC2
First Bristol Limited Hull Trains Company Limited First Student, Inc3
First Cymru Buses LimitedFirst Eastern Counties Buses Limited Transit contracting and fleet maintenance
First Essex Buses Limited First Transit, Inc3
First Glasgow (No. 1) Limited1 First Vehicle Services, Inc3
First Glasgow (No. 2) Limited1
First Hampshire and Dorset Limited North American coach operators
First Manchester Limited Americanos USA, Inc3
First Midland Red Buses Limited Greyhound Lines, Inc3
First Potteries Limited Greyhound Canada Transportation ULC2
First Scotland East Limited1
First Somerset & Avon LimitedFirst South West LimitedFirst South Yorkshire LimitedFirst West Yorkshire LimitedFirst York LimitedLeicester CityBus Limited (94%)Midland Bluebird Limited1
All subsidiary undertakings are wholly owned by FirstGroup plc at the end of the year except where percentage of ownership is shown above. All these companies above are incorporated in United Kingdom and registered in England and Wales except those:1 Registered in Scotland.2 Registered in Canada.3 Incorporated in the United States of America.
All shares held in subsidiary undertakings are ordinary shares, with the exception of Leicester CityBus Limited where the Group owns 100% of its redeemable cumulative preference shares, as well as 94% of its ordinary shares.
All of these subsidiary undertakings are owned via intermediate holding companies.
16 Inventories2016
£m2015
£m
Spare parts and consumables 61.4 69.8Property development work in progress – 0.1
61.4 69.9
In the opinion of the Directors there is no material difference between the balance sheet value of inventories and their replacement cost. There was no material write-down of inventories during the current or prior year. The provision for stock obsolescence at the balance sheet date was £7.7m (2015: £7.6m).
FirstGroup Annual Report and Accounts 2016 127
Financial statements

17 Trade and other receivables
Amounts due within one year2016
£m2015
£m
Trade receivables 381.2 355.3Provision for doubtful receivables (4.3) (2.3)Other receivables 72.7 66.3Other prepayments 88.2 126.1Accrued income 156.6 171.2
694.4 716.6
Credit riskCredit risk is the risk that financial loss arises from failure by a customer or counterparty to meet its obligations under a contract.
Credit risk exists in relation to the Group’s financial assets, which comprise trade and other receivables of £694.4m (2015: £716.6m), cash and cash equivalents of £360.1m (2015: £420.5m) and derivative financial instruments of £58.2m (2015: £60.8m).
The Group’s maximum exposure to credit risk for all financial assets at the balance sheet date was £1,112.7m (2015: £1,197.9m). The exposure is spread over a large number of unconnected counterparties and the maximum single concentration with any one counterparty was £75.0m (2015: £60.0m) at the balance sheet date.
The Group’s credit risk is primarily attributable to its trade receivables. The amounts presented in the balance sheet are net of allowances for doubtful receivables, estimated by the Group’s management based on prior experience and their assessment of the current economic environment. The provision for doubtful receivables at the balance sheet date was £4.3m (2015: £2.3m).
Most trade receivables are with public or quasi public bodies, principally the DfT, Network Rail, Transport Scotland and city councils in the UK and school bus boards and city municipal authorities in North America. The Group does not consider any of these counterparties to be a significant risk. Each division within the Group has a policy governing credit risk management on trade receivables.
The counterparties for bank balances and derivative financial instruments are mainly represented by lending banks and large banks with a minimum of ‘A’ credit ratings assigned by international credit rating agencies. These counterparties are subject to approval by the Board. Group treasury policy limits the maximum deposit with any one counterparty to £75m, and limits the maximum term to three months.
An analysis of financial assets which are past due but not impaired and movements in the provision for doubtful receivables are set out below:
Ageing past due but not impaired trade receivables2016
£m2015
£m
Less than 30 days 21.9 25.230 – 90 days 5.6 6.790 – 180 days 7.4 7.9180+ days 4.0 2.2
Total 38.9 42.0
Movement in the provision for doubtful receivables2016
£m2015
£m
At 1 April 2.3 2.9Amounts written off during the year (1.9) (2.1)Amounts recovered during the year (0.1) (0.2)Increase in allowance recognised in the income statement 3.8 1.5Foreign exchange movements 0.2 0.2
At 31 March 4.3 2.3
The Directors consider that the carrying amount of trade and other receivables approximates to their fair value.
Notes to the consolidated financial statementscontinued
FirstGroup Annual Report and Accounts 2016128

18 Assets held for sale2016
£m2015
£m
Assets held for sale 3.5 1.4
The 2016 balance includes £1.8m in relation to a Greyhound property which was sold in April 2016. There are also First Student yellow school buses which are surplus to requirements and are being actively marketed on the Internet. Gains or losses arising on the disposal of such assets are included in arriving at operating profit in the income statement. The Group expects to sell such yellow school buses within 12 months of them going onto the ‘for sale’ list. The value at each balance sheet date represents management’s best estimate of their resale value less cost of disposal. There are no liabilities associated with these held for sale assets at the balance sheet date.
Movement in assets held for sale £m
At 1 April 2015 1.4Net book value of additions 3.5Net book value of disposals (1.5)Foreign exchange movements 0.1
At 31 March 2016 3.5
19 Trade and other payables
Amounts falling due within one year2016
£m2015
£m
Trade payables 242.6 248.3Other payables 239.6 225.9Accruals 554.3 572.1Deferred income 39.4 59.3Season ticket deferred income 26.0 33.4
1,101.9 1,139.0
Trade payables and accruals principally comprise amounts outstanding for trade purchases and ongoing costs. The average credit period taken for trade purchases is 34 days (2015: 30 days). The Group has controls in place to ensure that all payments are paid within the appropriate credit timeframe.
The Directors consider that the carrying amount of trade and other payables approximates to their fair value.
20 Cash and cash equivalents2016
£m2015
£m
Cash and cash equivalents 360.1 420.5
The fair value of cash and cash equivalents approximates to the carrying value. Cash and cash equivalents includes ring-fenced cash of £219.9m (2015: £196.7m). The most significant ring-fenced cash balances are held by the Group’s First Rail subsidiaries. Under the terms of the rail franchise agreements, cash can only be distributed by these subsidiaries up to the lower of the amount of their retained profits or the amount determined by prescribed liquidity ratios. The ring-fenced cash represents cash which is not available for distribution and any additional amounts required to satisfy the liquidity ratios at the balance sheet date. Ring-fenced cash balances of £2.4m (2015: £0.7m) are held outside the First Rail subsidiaries.
FirstGroup Annual Report and Accounts 2016 129
Financial statements

21 Financial liabilities – borrowings2016
£m2015
£m
On demand or within 1 yearFinance leases (note 22) 73.9 77.0Senior unsecured loan notes 35.4 –Bond 8.125% (repayable 2018)1 12.9 12.9Bond 6.125% (repayable 2019)1 3.0 3.0Bond 8.75% (repayable 2021)1 30.2 30.1Bond 5.25% (repayable 2022)1 5.8 5.8Bond 6.875% (repayable 2024)1 7.2 7.2
Total current liabilities 168.4 136.0
Within 1 – 2 yearsFinance leases (note 22) 58.3 69.4Loan notes (note 23) 9.7 9.7Senior unsecured loan notes 70.5 33.5
138.5 112.6
Within 2 – 5 yearsFinance leases (note 22) 106.1 140.3Bond 8.125% (repayable 2018) 298.3 297.8Bond 6.125% (repayable 2019) 279.0 286.3Senior unsecured loan notes – 67.1
683.4 791.5
Over 5 yearsFinance leases (note 22) – 15.5Bond 8.75% (repayable 2021) 370.1 366.6Bond 5.25% (repayable 2022) 320.5 320.0Bond 6.875% (repayable 2024) 199.6 199.5
890.2 901.6
Total non-current liabilities at amortised cost 1,712.1 1,805.7
Fair value of bonds and senior unsecured loan notes issuedPar
value £m
Interest payable Month
2016 Fair value
£m
2015 Fair value
£m
Bond 8.125% (repayable 2018) 300.0 Annually September 352.3 368.3Bond 6.125% (repayable 2019) 250.0 Annually January 275.9 284.0Bond 8.75% (repayable 2021) 350.0 Annually April 464.0 484.8Bond 5.25% (repayable 2022) 325.0 Annually November 363.5 372.8Bond 6.875% (repayable 2024) 200.0 Annually September 248.4 257.7
$m £m £m
Senior unsecured loan notes 150.0 Semi-annually April & October 110.4 108.8
The fair value of the bonds and senior unsecured loan notes are inclusive of accrued interest. The fair values are calculated by discounting the future cash flow that will arise under the contracts. 1 Relates to accrued interest.
Notes to the consolidated financial statementscontinued
FirstGroup Annual Report and Accounts 2016130

21 Financial liabilities – borrowings continuedEffective interest ratesThe effective interest rates at the balance sheet dates were as follows:
2016 2015
Bank overdraft LIBOR + 1% LIBOR + 1%Bank borrowings LIBOR + 0.7% LIBOR + 0.7%Bond 2018 8.32% 8.32%Bond 20191 6.18% 6.18%Bond 20211 8.87% 8.87%Bond 2022 5.49% 5.49%Bond 2024 6.95% 6.95%Senior unsecured loan notes 4.39% 4.39%
HP contracts and finance leases
LIBOR + 0.6% up to average fixed
rate of 4.2%
LIBOR + 0.6% up to average fixed
rate of 4.0%
Loan notes
LIBOR – 0.5% up to total fixed
rate of 11.0%
LIBOR – 0.5% up to total fixed
rate of 11.0%
1 The 2019 and 2021 bonds have been swapped to floating rates and hence have a lower effective rate net of these swaps.
Carrying amount of gross borrowings by currency2016
£m2015
£m
Sterling 1,563.5 1,577.6US Dollar 305.9 351.1Canadian Dollar 11.2 13.0
1,880.6 1,941.7
Borrowing facilitiesThe Group had £800.0m (2015: £800.0m) of undrawn committed borrowing facilities as at 31 March 2016. Total bank borrowing facilities at 31 March 2016 stood at £815.7m (2015: £815.4m) of which £800.0m (2015: £800.0m) was committed and £15.7m (2015: £15.4m) was uncommitted.
Capital managementOverall the Group’s objective is to achieve a post-tax return on capital employed (ROCE) in the range of 10% to 12% in the medium term. We also aim to maintain an investment grade credit rating and appropriate balance sheet liquidity headroom. The Group has net debt:EBITDA of 2.3 times as at March 2016 (2015: 2.3 times) and is targeting net debt:EBITDA of 2.0 times in the medium term.
ROCE is calculated by dividing adjusted operating profit after tax by net assets, excluding debt items.
Liquidity within the Group has remained strong. At 31 March 2016 there was £940.2m (2015: £1,023.8m) of committed headroom and free cash. Largely due to seasonality in the North American school bus business, committed headroom typically reduces during the financial year up to October and increases thereafter. The Group’s Treasury policy requires a minimum of £150m of committed headroom at all times.
The Group’s net debt, excluding accrued bond interest at 31 March 2016, was £1,410.2m (2015: £1,407.3m) as set out on page 46 of the Financial review.
FirstGroup Annual Report and Accounts 2016 131
Financial statements

22 HP contracts and finance leasesThe Group had the following obligations under HP contracts and finance leases as at the balance sheet dates:
2016 Minimum payments
£m
2016 Present value of
payments £m
2015 Minimum
payments £m
2015 Present value of
payments £m
Due in less than one year 75.9 73.9 79.2 77.0Due in more than one year but not more than two years 61.5 58.3 73.3 69.4Due in more than two years but not more than five years 116.8 106.1 157.1 140.3Due in more than five years – – 18.7 15.5
254.2 238.3 328.3 302.2Less future financing charges (15.9) – (26.1) –
238.3 238.3 302.2 302.2
HP lease obligationsSterling denominated fixed rate leases 2016 2015
Sterling fixed rate leases £8.8m £13.0mAverage remaining lives 2 years 3 yearsEffective borrowing rate 3.60% 3.49%
US Dollar denominated fixed rate leases 2016 2015
US Dollar fixed rate leases £200.0m £250.5mAverage remaining lives 2 years 3 yearsEffective borrowing rate 2.80% 2.88%
Canadian Dollar denominated fixed rate leases 2016 2015
Canadian Dollar fixed rate leases £11.2m £13.0mAverage remaining lives 2 years 3 yearsEffective borrowing rate 4.13% 4.00%
The Group considers there to be no material difference between the fair values of the Sterling and Canadian Dollar finance leases and the carrying amount in the balance sheet. The US Dollar finance leases have a fair value of £203.2m (2015: £255.6m). The fair value is calculated by discounting future cash flows that will arise under the lease agreements.
23 Loan notesThe Group had the following loan notes issued as at the balance sheet dates:
2016 £m
2015 £m
Due in more than one year but not more than two years 9.7 9.7
The loan notes have been classified by reference to the earliest date on which the loan note holder can request redemption. Loan notes of £8.7m (2015: £8.7m) are supported by unsecured bank guarantees.
The loan notes have an average effective borrowing rate of 10.1% (2015: 10.1%) and an average remaining term of 4 years (2015: 5 years) assuming that the holders do not request redemption. The fair value of the loan notes has been determined to be £12.9m (2015: £13.4m). This has been calculated by discounting future cash flows that will arise under the loan notes.
Notes to the consolidated financial statementscontinued
FirstGroup Annual Report and Accounts 2016132

24 Derivative financial instruments2016
£m2015
£m
Total derivativesTotal non-current assets 41.5 45.3Total current assets 16.7 15.5
Total assets 58.2 60.8
Total current liabilities 68.1 74.5Total non-current liabilities 35.5 22.6
Total liabilities 103.6 97.1
Derivatives designated and effective as hedging instruments carried at fair valueNon-current assetsCoupon swaps (fair value hedge) 41.3 45.3Fuel derivatives (cash flow hedge) 0.2 –
41.5 45.3
Current assetsCoupon swaps (fair value hedge) 16.4 15.5Fuel derivatives (cash flow hedge) 0.3 –
16.7 15.5
Current liabilitiesFuel derivatives (cash flow hedge) 66.9 66.9
66.9 66.9
Non-current liabilitiesFuel derivatives (cash flow hedge) 35.5 21.4
35.5 21.4
Derivatives classified as held for tradingCurrent liabilitiesInterest rate swaps 1.2 7.6
Non-current liabilitiesInterest rate swaps – 1.2
Total cash flow hedges are a liability of £101.9m (2015: £88.3m asset). Total fair value hedges are an asset of £57.7m (2015: £60.8m).
During the year £80.6m was charged to the hedging reserve in respect of cash flow hedges (2015: £88.6m charge).
The following gains/(losses) transferred from equity into profit or loss during the year are included in line items in the consolidated income statement:
2016 £m
2015 £m
Operating (losses)/gains (66.9) 1.3
FirstGroup Annual Report and Accounts 2016 133
Financial statements

24 Derivative financial instruments continuedFair value of the Group’s financial assets and financial liabilities that are measured at fair value on a recurring basis:
2016
Fair value Carrying
valueLevel 1
£mLevel 2
£mLevel 3
£mTotal
£mTotal
£m
Financial assetsCash and cash equivalents 360.1 – – 360.1 360.1Derivative financial instruments – 58.2 – 58.2 58.2
Financial liabilities and derivativesFinancial liabilities – 2,068.9 – 2,068.9 1,880.6Derivative financial instruments – 103.6 – 103.6 103.6
2015
Fair valueCarrying
valueLevel 1
£mLevel 2
£mLevel 3
£mTotal
£mTotal
£m
Financial assetsCash and cash equivalents 420.5 – – 420.5 420.5Derivative financial instruments – 60.8 – 60.8 60.8
Financial liabilities and derivativesFinancial liabilities – 2,197.1 – 2,197.1 1,941.7Derivative financial instruments – 97.1 – 97.1 97.1
Level 1: Quoted prices in active markets for identical assets and liabilities.
Level 2: Inputs other than quoted prices included within Level 1 that are observable for the asset or liability either directly or indirectly.
Level 3: Inputs for the asset or liability that are not based on observable market data.
There were no transfers between Level 1 and Level 2 during the current or prior year.
Financial assets/(liabilities)
Fair values at 31 March
2016 £m
Fair values at 31 March
2015 £m
Fair value hierarchy Valuation technique(s) and key inputs
Derivative contracts1) Interest rate swaps 56.5 52.0 Level 2 Discounted cash flow; future cash flows are estimated based on
forward interest rates and contract interest rates and then discounted at a rate that reflects the credit risk of the various counterparties.
2) Fuel derivatives (101.9) (88.3) Level 2 Discounted cash flow; future cash flows are estimated based on forward fuel prices and contract rates and then discounted at a rate that reflects the credit risk of the various counterparties.
The following gains and losses on derivatives designated for hedge accounting have been charged through the consolidated income statement in the year:
2016 £m
2015 £m
(Losses)/gains on hedging instruments in fair value hedges (4.1) 19.1Gains/(losses) on hedged item attributable to hedged risk fair value hedges 3.8 (19.2)Change in the fair value of derivatives classified as held for trading – (0.2)
(0.3) (0.3)
Financial risk managementThe Group is exposed to financial risks including liquidity risk, credit risk and certain market-based risks principally being the effects of changes in foreign exchange rates, interest rates and fuel prices. The Group manages these risks within the context of a set of formal policies established by the Board. Certain risk management responsibilities are formally delegated by the Board, principally to a sub-committee of the Board and to the Chief Financial Officer and to the Treasury Committee. The Treasury Committee comprises the Chief Financial Officer and certain senior finance employees and is responsible for approving hedging transactions permitted under Board approved policies, monitoring compliance against policy and recommending changes to existing policies.
Notes to the consolidated financial statementscontinued
FirstGroup Annual Report and Accounts 2016134

24 Derivative financial instruments continuedLiquidity riskLiquidity risk is the risk that the Group may encounter difficulty in meeting obligations associated with financial liabilities. The objective of the Group’s liquidity risk management is to ensure sufficient committed liquidity resources exist. The Group has a diversified debt structure largely represented by medium term unsecured syndicated committed bank facilities, medium to long term unsecured bond debt and finance leases. It is a policy requirement that debt obligations must be addressed well in advance of their due dates.
Group treasury policy requires a minimum of £150m of committed liquidity headroom at all times within medium term bank facilities and such facilities must be renewed or replaced well before their expiry dates. At 31 March 2016, the total amount of these facilities stood at £800.0m (2015: £800.0m), and committed headroom was £800.0m (2015: £800.0m), in addition to free cash balances of £140.2m (2015: £223.8m). The next material contractual expiry of revolver bank facilities is in June 2019. Largely due to the seasonality of the First Student school bus business, headroom tends to reduce from March to October and increases again by the following March.
The average duration of net debt (excluding ring-fenced cash) at 31 March 2015 was 4.4 years (2015: 5.2 years).
The following tables detail the Group’s expected maturity of payables/(receivables) for its derivative financial instruments. The amounts in these tables are different to the balance sheet as the table is prepared on an undiscounted cash flow basis.
2016
< 1 year £m
1 – 2 years £m
2 – 5 years £m
> 5 years £m
Total £m
Interest rate derivatives 1.2 – – – 1.2Coupon swaps (23.1) (23.1) (38.5) (7.7) (92.4)Coupon swaps 6.6 7.1 17.7 1.1 32.5Fuel derivatives 66.6 27.7 7.6 – 101.9
51.3 11.7 (13.2) (6.6) 43.2
2015
< 1 year £m
1 – 2 years £m
2 – 5 years £m
> 5 years £m
Total £m
Interest rate derivatives 7.6 1.2 – – 8.8Coupon swaps (21.9) (23.1) (53.8) (15.5) (114.3)Coupon swaps 6.4 7.6 29.3 7.8 51.1Fuel derivatives 66.9 20.4 1.0 – 88.3
59.0 6.1 (23.5) (7.7) 33.9
Total amounts payable per the tables are £135.6m (2015: £148.2m). Total amounts receivable per the tables are £92.4m (2015: £114.3m).
No derivative financial instruments had collateral requirements or were due on demand in any of the years.
Currency riskCurrency risk is the risk of financial loss to foreign currency net assets, earnings and cash flows reported in pounds Sterling due to movements in exchange rates.
The Group’s principal operations outside the UK are in the US and Canada, with the US being the most significant. Consequently the principal currency risk relates to movements in the US Dollar to pounds Sterling.
“Certain” and “highly probable” foreign currency transaction exposures may be hedged at the time the exposure arises for up to two years at specified levels, or longer if there is a very high degree of certainty. The Group does not hedge the translation of earnings into the Group reporting currency (pounds Sterling), but accepts that reported Group earnings will fluctuate as exchange rates against pounds Sterling fluctuate for the currencies in which the company does business. During the year, the net cash generated in each currency may be converted by Group Treasury into pounds Sterling by way of spot transactions in order to keep the currency composition of net debt broadly constant.
IFRS 7 requires the Group to show the impact on profit after tax and hedging reserve on financial instruments from a movement in exchange rates. The following analysis details the Group’s sensitivity to a 10% strengthening in Sterling against the US Dollar. The analysis has been prepared based on the change taking place at the beginning of the financial year and being held constant throughout the reporting period. A positive number indicates an increase in earnings or equity where Sterling strengthens against the US Dollar.
FirstGroup Annual Report and Accounts 2016 135
Financial statements
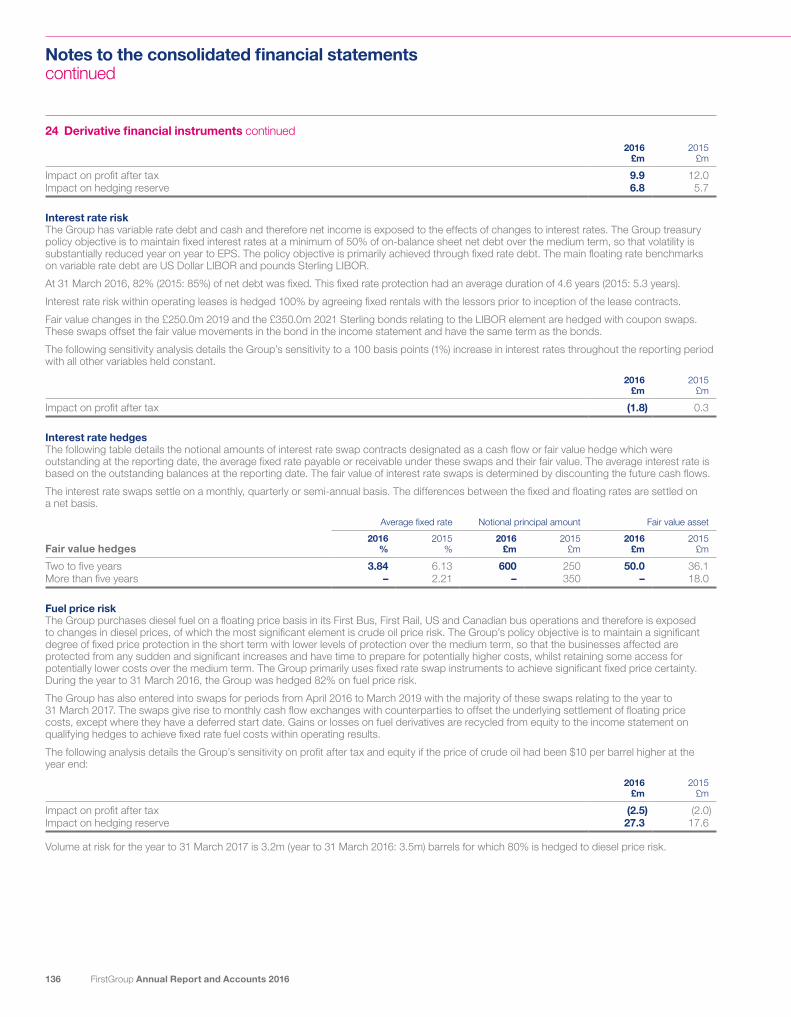
24 Derivative financial instruments continued2016 £m
2015 £m
Impact on profit after tax 9.9 12.0Impact on hedging reserve 6.8 5.7
Interest rate riskThe Group has variable rate debt and cash and therefore net income is exposed to the effects of changes to interest rates. The Group treasury policy objective is to maintain fixed interest rates at a minimum of 50% of on-balance sheet net debt over the medium term, so that volatility is substantially reduced year on year to EPS. The policy objective is primarily achieved through fixed rate debt. The main floating rate benchmarks on variable rate debt are US Dollar LIBOR and pounds Sterling LIBOR.
At 31 March 2016, 82% (2015: 85%) of net debt was fixed. This fixed rate protection had an average duration of 4.6 years (2015: 5.3 years).
Interest rate risk within operating leases is hedged 100% by agreeing fixed rentals with the lessors prior to inception of the lease contracts.
Fair value changes in the £250.0m 2019 and the £350.0m 2021 Sterling bonds relating to the LIBOR element are hedged with coupon swaps. These swaps offset the fair value movements in the bond in the income statement and have the same term as the bonds.
The following sensitivity analysis details the Group’s sensitivity to a 100 basis points (1%) increase in interest rates throughout the reporting period with all other variables held constant.
2016 £m
2015 £m
Impact on profit after tax (1.8) 0.3
Interest rate hedgesThe following table details the notional amounts of interest rate swap contracts designated as a cash flow or fair value hedge which were outstanding at the reporting date, the average fixed rate payable or receivable under these swaps and their fair value. The average interest rate is based on the outstanding balances at the reporting date. The fair value of interest rate swaps is determined by discounting the future cash flows.
The interest rate swaps settle on a monthly, quarterly or semi-annual basis. The differences between the fixed and floating rates are settled on a net basis.
Average fixed rate Notional principal amount Fair value asset
Fair value hedges2016
%2015
%2016
£m2015
£m2016
£m2015
£m
Two to five years 3.84 6.13 600 250 50.0 36.1More than five years – 2.21 – 350 – 18.0
Fuel price riskThe Group purchases diesel fuel on a floating price basis in its First Bus, First Rail, US and Canadian bus operations and therefore is exposed to changes in diesel prices, of which the most significant element is crude oil price risk. The Group’s policy objective is to maintain a significant degree of fixed price protection in the short term with lower levels of protection over the medium term, so that the businesses affected are protected from any sudden and significant increases and have time to prepare for potentially higher costs, whilst retaining some access for potentially lower costs over the medium term. The Group primarily uses fixed rate swap instruments to achieve significant fixed price certainty. During the year to 31 March 2016, the Group was hedged 82% on fuel price risk.
The Group has also entered into swaps for periods from April 2016 to March 2019 with the majority of these swaps relating to the year to 31 March 2017. The swaps give rise to monthly cash flow exchanges with counterparties to offset the underlying settlement of floating price costs, except where they have a deferred start date. Gains or losses on fuel derivatives are recycled from equity to the income statement on qualifying hedges to achieve fixed rate fuel costs within operating results.
The following analysis details the Group’s sensitivity on profit after tax and equity if the price of crude oil had been $10 per barrel higher at the year end:
2016 £m
2015 £m
Impact on profit after tax (2.5) (2.0)Impact on hedging reserve 27.3 17.6
Volume at risk for the year to 31 March 2017 is 3.2m (year to 31 March 2016: 3.5m) barrels for which 80% is hedged to diesel price risk.
Notes to the consolidated financial statementscontinued
FirstGroup Annual Report and Accounts 2016136

25 Deferred taxThe major deferred tax liabilities/(assets) recognised by the Group and movements thereon during the current and prior reporting periods are as follows:
Accelerated tax
depreciation £m
Retirement benefit
schemes £m
Other temporary differences
£m
Tax losses
£mTotal
£m
At 1 April 2014 136.4 (72.2) 115.8 (178.8) 1.2Charge/(credit) to income 13.9 3.5 (18.9) 4.1 2.6(Credit)/charge to other comprehensive income – 6.7 (26.6) – (19.9)Charge direct to equity – – 0.1 – 0.1Acquisition of business/subsidiary – – (0.9) – (0.9)Foreign exchange movements 12.4 (5.4) 11.1 (21.0) (2.9)
At 31 March 2015 162.7 (67.4) 80.6 (195.7) (19.8)
(Credit)/charge to income 4.7 8.1 (10.7) (6.1) (4.0)Credit to other comprehensive income – (16.1) (0.6) – (16.7)Foreign exchange and other movements 6.8 (2.9) 1.4 (10.5) (5.2)
At 31 March 2016 174.2 (78.3) 70.7 (212.3) (45.7)
Certain deferred tax assets and liabilities have been offset. The following is the analysis of the deferred tax balances for financial reporting purposes:
2016 £m
2015 £m
Deferred tax assets (62.7) (60.5)Deferred tax liabilities 17.0 40.7
(45.7) (19.8)
Deferred tax assets of £42.8m (2015: £36.7m) have not been recognised as it is not considered probable that there will be future profits against which these assets can be offset. The earliest period in which some of the assets will expire is year ended 31 March 2027.
No deferred tax asset has been recognised in respect of £2.3m (2015: £nil) of capital losses.
FirstGroup Annual Report and Accounts 2016 137
Financial statements

26 Provisions2016
£m2015
£m
Insurance claims 219.9 205.5Legal and other 39.6 28.1Pensions 2.8 3.1
Non-current liabilities 262.3 236.7
Insurance claims
£m
Legal and other
£mPensions
£mTotal
£m
At 1 April 2015 316.2 49.4 3.1 368.7Charged to the income statement 172.9 11.7 – 184.6Transfer from accruals – 8.3 – 8.3Utilised in the year (153.6) (30.6) (0.3) (184.5)Notional interest 14.7 – – 14.7Foreign exchange movements 13.6 5.2 – 18.8
At 31 March 2016 363.8 44.0 2.8 410.6
Current liabilities 143.9 4.4 – 148.3Non-current liabilities 219.9 39.6 2.8 262.3
At 31 March 2016 363.8 44.0 2.8 410.6
Current liabilities 110.7 21.3 – 132.0
Non-current liabilities 205.5 28.1 3.1 236.7
At 31 March 2015 316.2 49.4 3.1 368.7
The current liabilities above are included within accruals in note 19.
The insurance claims provision arises from estimated exposures for incidents occurring prior to the balance sheet date. It is anticipated that the majority of such claims will be settled within the next six years although certain liabilities in respect of lifetime obligations of £20.3m (2015: £19.0m) can extend for up to 30 years. The utilisation of £153.6m (2015: £163.7m) represents payments made largely against the current liability of the preceding year.
Amounts charged to the income statement for insurance claims contains £25.5m which is recoverable from insurance companies and is included within other receivables in note 17.
Legal and other provisions relate to estimated exposures for cases filed or thought highly likely to be filed for incidents that occurred prior to the balance sheet date. It is anticipated that most of these items will be settled within 10 years. Also included are provisions in respect of costs anticipated on the exit of surplus properties which are expected to be settled over the remaining terms of the respective leases and dilapidation and other provisions in respect of contractual obligations under rail franchises. The dilapidation provisions are expected to be settled at the end of the respective franchise.
The pension’s provision relates to unfunded obligations that arose on the acquisition of certain First Bus companies. It is anticipated that this will be utilised over five to 10 years.
27 Called up share capital2016
£m2015
£m
Allotted, called up and fully paid1,204.9m ordinary shares of 5p each 60.2 60.2
The Company has one class of ordinary shares which carries no right to fixed income.
Notes to the consolidated financial statementscontinued
FirstGroup Annual Report and Accounts 2016138

28 ReservesThe hedging reserve records the movement on designated hedging items.
The share premium account represents the premium on shares issued since 1999 and arose principally on the rights issue on the Ryder acquisition in 1999 and the share placings in 2007 and 2008. The reserve is non-distributable.
The own shares reserve represents the cost of shares in FirstGroup plc purchased in the market and either held as treasury shares or held in trust to satisfy the exercise of share options.
Hedging reserveThe movements in the hedging reserve were as follows:
2016 £m
2015 £m
Balance at 1 April (55.5) 7.8Losses recognised:Fuel derivatives (80.6) (88.6)Charged/(credited) to income statement:Fuel derivatives 66.9 (1.3)Tax on derivative hedging instrument movements 0.6 26.6
Balance at 31 March (68.6) (55.5)
Own sharesThe number of own shares held by the Group at the end of the year was 669,374 (2015: 1,252,757) FirstGroup plc ordinary shares of 5p each. Of these, 479,625 (2015: 1,063,008) were held by the FirstGroup plc Employee Benefit Trust, 32,520 (2015: 32,520) by the FirstGroup plc Qualifying Employee Share Ownership Trust and 157,229 (2015: 157,229) were held as treasury shares. Both trusts and treasury shares have waived the rights to dividend income from the FirstGroup plc ordinary shares. The market value of the shares at 31 March 2016 was £0.6m (2015: £1.1m).
Other reserves
Capital redemption
reserve £m
Capital reserve
£m
Total other reserves
£m
At 31 March 2016 and 31 March 2015 1.9 2.7 4.6
There have been no movements on the capital redemption reserve or capital reserve during the year ended 31 March 2016. The capital redemption reserve represents the cumulative par value of all shares bought back and cancelled. The capital reserve arose on acquisitions in 2000. Neither reserve is distributable.
29 Translation reserve£m
At 1 April 2015 241.7Movement for the financial year 110.5
At 31 March 2016 352.2
The translation reserve records exchange differences arising from the translation of the balance sheets of foreign currency denominated subsidiaries offset by movements on loans used to hedge the net investment in those foreign subsidiaries.
FirstGroup Annual Report and Accounts 2016 139
Financial statements

30 Acquisition of businesses and subsidiary undertakings
Acquisition of businesses and subsidiary undertakings2016
£m2015
£m
Fair value of net assets acquired:Property, plant and equipment – 7.8Other intangible assets – 15.8Deferred tax – 0.9Other liabilities – (2.3)Non-controlling interests – (11.7)
– 10.5Goodwill (note 11) – 1.7
Satisfied by cash paid and payable – 12.2
On 25 August 2014, the Group completed the acquisition of a 51% share in Mile Square Transportation, Inc., a school bus transportation company based in New York. The £12.2m consideration represents £11.0m cash paid in the year to 31 March 2015 and £1.2m of deferred consideration.
Included within the purchase agreement is a put option for the Group to purchase the remaining 49% from the non-controlling interest party for a fixed price of US$19.1m. As the put option is a contract to purchase the Group’s own equity instruments it gives rise to a financial liability for the fixed price amount in accordance with paragraph 23 in IAS 32. We have recognised the financial liability in the balance sheet and the initial recognition is treated as reclassified from equity.
The business acquired during the year contributed £nil (2015: £6.4m) to the Group’s net operating cash flows and utilised £nil (2015: £11.0m) for capital expenditure.
The business acquired during the year contributed £nil (2015: £12.1m) to Group revenue and £nil (2015: £3.5m) to Group operating profit from date of acquisition to 31 March 2016.
If the acquisition of the business acquired during the year had been completed on the first day of the financial year, Group revenue from this acquisition for the period would have been £nil (2015: £16.6m) and the Group operating profit from this acquisition attributable to equity holders of the parent would have been £nil (2015: £3.8m).
31 Net cash from operating activities2016
£m2015
£m
Operating profit 246.3 245.8Adjustments for:Depreciation charges 325.7 353.3Capital grant amortisation (10.5) (32.5)Amortisation charges 51.9 54.3Impairment charges – 8.7Share-based payments 6.4 5.2Profit on disposal of property, plant and equipment – (27.9)
Operating cash flows before working capital and pensions 619.8 606.9Decrease in inventories 10.0 4.5Decrease/(increase) in receivables 29.3 (7.5)Decrease in payables (73.6) (113.0)Decrease in provisions (18.6) (27.2)Defined benefit pension payments in excess of income statement charge (33.6) (12.3)
Cash generated by operations 533.3 451.4Tax paid (7.0) (4.5)Interest paid (107.9) (112.2)Interest element of HP contracts and finance leases (8.9) (9.5)
Net cash from operating activities 409.5 325.2
Notes to the consolidated financial statementscontinued
FirstGroup Annual Report and Accounts 2016140

32 Contingent liabilitiesTo support subsidiary undertakings in their normal course of business, the Company and certain subsidiaries have indemnified certain banks and insurance companies who have issued performance bonds for £505.4m (2015: £489.2) and letters of credit for £310.4m (2015: £304.4m). The performance bonds relate to the North American businesses of £462.2m (2015: £421.1m) and the First Rail franchise operations of £43.2m (2015: £68.1m). The letters of credit relate substantially to insurance arrangements in the UK and North America.
The Company is party to certain unsecured guarantees granted to banks for overdraft and cash management facilities provided to itself and subsidiary undertakings. The Company has given certain unsecured guarantees for the liabilities of its subsidiary undertakings arising under certain loan notes, HP contracts, finance leases, operating leases and certain pension scheme arrangements. It also provides unsecured cross guarantees to certain subsidiary undertakings as required by VAT legislation. First Bus subsidiaries have provided unsecured guarantees on a joint and several basis to the Trustees of the First Bus Pension Scheme.
The Group has issued guarantees of £0.9m (2015: £4.0m) to the Danish and Swedish authorities in respect of DSBFirst. These guarantees relate to the operational performance of the Danish rail activities and certain train maintenance activities in Sweden.
The Group is party to legal proceedings and claims which arise in the normal course of business, including but not limited to employment and safety claims. The Group takes legal advice as to the likelihood of success of claims and counterclaims. No provision is made where due to inherent uncertainties, no accurate quantification of any cost, or timing of such cost, which may arise from any of the legal proceedings can be determined.
In its normal course of business First Rail has ongoing contractual negotiations with government and other organisations.
33 Operating lease arrangements2016
£m2015
£m
Minimum lease payments made under operating leases recognised in the income statement for the year:Plant and machinery 21.0 16.7Track and station access 103.8 267.1Hire of rolling stock 80.8 170.2Other assets 61.9 35.5
267.5 489.5
At the balance sheet dates, the Group had outstanding commitments for future minimum lease payments under non-cancellable operating leases, which fall due as follows:
2016 £m
2015 £m
Within one year 278.2 253.2In the second to fifth years inclusive 1,043.9 816.2After five years 164.7 107.5
1,486.8 1,176.9
Included in the above commitments are contracts held by the First Rail businesses with Network Rail for access to the railway infrastructure track, stations and depots of £343.8m (2015: £146.1m). They also have contracts under which they lease rolling stock of £848.8m (2015: £730.4m).
FirstGroup Annual Report and Accounts 2016 141
Financial statements

34 Share-based paymentsEquity-settled share option plansThe Group recognised total expenses of £6.4m (2015: £5.2m) related to equity-settled share-based payment transactions.
(a) Save as you earn (SAYE)The Group operates an HMRC approved savings related share option scheme. Grants were made as set out below. The scheme is based on eligible employees being granted options and their agreement to opening a sharesave account with a nominated savings carrier and to save weekly or monthly over a specified period. Sharesave accounts are held with Computershare. The right to exercise the option is at the employee’s discretion at the end of the period previously chosen for a period of six months.
SAYE Dec 2011
Options Number
SAYE Dec 2012
Options Number
SAYE Dec 2013
Options Number
SAYE Dec 2014
Options Number
SAYE Dec 2015
Options Number
Outstanding at the beginning of the year 1,987,733 2,469,476 6,009,353 7,429,845 –Awarded during the year – – – – 7,730,075Exercised during the year – (12,773) (57,361) (1,320) –Lapsed during the year (1,987,733) (953,058) (1,500,635) (965,687) (159,070)
Outstanding at the end of the year – 1,503,645 4,451,357 6,462,838 7,571,005
Exercisable at the end of the year – 1,503,645 – – –Weighted average exercise price (pence) 221.4 117.3 94.1 97.0 85.0
Weighted average share price at date of exercise (pence) N/A 110.1 114.5 102.6 N/A
(b) Deferred bonus shares (DBS)DBS 2005
Options Number
DBS 2006 Options Number
DBS 2007 Options Number
DBS 2008 Options Number
DBS 2009 Options Number
Outstanding at the beginning of the year 29,472 74,716 167,333 77,651 68,147Granted during the year – – – – –Forfeited during the year (21,519) – – – –Exercised during the year (7,953) (50,758) (47,755) (19,093) (25,913)
Outstanding at the end of the year – 23,958 119,578 58,558 42,234
Exercisable at the end of the year – 23,958 119,578 58,558 42,234Weighted average exercise price (pence) Nil Nil Nil Nil NilWeighted average share price at date of exercise (pence) 98.3 97.2 101.0 99.9 104.9
DBS 2010 Options Number
DBS 2011 Options Number
DBS 2012 Options Number
DBS 2013 Options Number
DBS 2014 Options Number
DBS 2015 Options Number
Outstanding at the beginning of the year 173,989 223,430 964,755 1,976,021 2,204,516 –Granted during the year – – – – – 3,426,028Forfeited during the year – – (3,472) (75,211) (77,805) (146,670)Exercised during the year (75,331) (55,979) (665,857) (40,328) (16,187) (12,538)
Outstanding at the end of the year 98,658 167,451 295,426 1,860,482 2,110,524 3,266,820
Exercisable at the end of the year 98,658 167,451 295,426 – – –Weighted average exercise price (pence) Nil Nil Nil Nil Nil NilWeighted average share price at date of exercise (pence) 99.9 103.1 118.2 110.5 118.1 108.5
Notes to the consolidated financial statementscontinued
FirstGroup Annual Report and Accounts 2016142

34 Share-based payments continued(c) Buy As You Earn (BAYE)BAYE enables eligible employees to purchase shares from their gross income. The Company provides two matching shares for every three shares bought by employees, subject to a maximum Company contribution of shares to the value of £20 per employee per month. If the shares are held in trust for five years or more, no income tax and national insurance will be payable. The matching shares will be forfeited if the corresponding partnership shares are removed from trust within three years of award.
At 31 March 2016 there were 5,658 (2015: 7,338) participants in the BAYE scheme who have cumulatively purchased 14,438,419 (2015: 11,916,378) shares with the Company contributing 4,783,319 (2015: 3,931,908) matching shares on a cumulative basis.
(d) Long Term Incentive Plan (LTIP)LTIP 2012
Options Number
LTIP 2013 Options Number
LTIP 2014 Options Number
LTIP 2015 Options Number
Outstanding at the beginning of the year 6,321,305 11,649,324 11,051,874 –Granted during the year – – – 3,458,103Forfeited during the year – (901,940) (1,220,972) –Lapsed during the year (6,321,305) – – –
Outstanding at the end of the year – 10,747,384 9,830,902 3,458,103
Weighted average share price at date of exercise (pence) Nil Nil Nil Nil
(e) Divisional Incentive Plan (DIP)DIP 2015
Options Number
Outstanding at the beginning of the year –Granted during the year 8,450,850Forfeited during the year –Exercised during the year –
Outstanding at the end of the year 8,450,850
Exercisable at the end of the year –Weighted average exercise price (pence) NilWeighted average share price at date of exercise (pence) –
(f) Executive Share Plan (ESP)ESP 2015
Options Number
Outstanding at the beginning of the year –Granted during the year 1,446,677Forfeited during the year –Exercised during the year –
Outstanding at the end of the year 1,446,677
Exercisable at the end of the year –Weighted average exercise price (pence) NilWeighted average share price at date of exercise (pence) –
FirstGroup Annual Report and Accounts 2016 143
Financial statements

34 Share-based payments continuedThe fair values of the options granted during the last two years were measured using a Black-Scholes or other appropriate valuation models. The inputs into the models were as follows:
2016 2015
Weighted average share price at grant date (pence)– DBS 123.1/105.1 139.6– SAYE December 2014 – 108.9– SAYE December 2015 103.1 –– LTIP 105.1 129.1– ESP 105.1 N/AWeighted average exercise price at grant date (pence)– DBS – –– SAYE December 2014 – 97.0– SAYE December 2015 85.0 –– LTIP – –– ESP – N/AExpected volatility (%)– DBS N/A N/A– SAYE December 2014 – 35– SAYE December 2015 35 –– LTIP 35 45– ESP N/A N/AExpected life (years)– DBS 2.8/2.3 3– SAYE schemes 3 3– LTIP 2.3 3– ESP 2.5 N/ARate of interest (%)– DBS N/A N/A– SAYE December 2014 – 0.9– SAYE December 2015 0.8 –– LTIP – 1.2– ESP – N/AExpected dividend yield (%)– DBS – –– SAYE December 2014 – –– SAYE December 2015 – –– LTIP – –– EPS – N/A
Expected volatility was determined by calculating the historical volatility of the Group’s share price over the previous five years. The expected life used in the model has been adjusted based on management’s best estimate, for the effects of non-transferability, exercise restrictions and behavioural considerations.
Allowances have been made for the SAYE schemes for the fact that, amongst a group of recipients some are expected to leave before an entitlement vests. The accounting charge is then adjusted over the vesting period to take account of actual forfeitures, so although the total charge is unaffected by the pre-vesting forfeiture assumption, the timing of the recognition of the expense will be sensitive to it. Fair values for the SAYE include a 10% per annum pre-vesting leaver assumption whereas the Executive, LTIP and deferred share plans exclude any allowance for pre-vesting forfeitures.
The Group used the inputs noted above to measure the fair value of the new share options.
2016 pence
2015 pence
Weighted average fair value of options at grant date– DBS 123.1/105.1 139.6– SAYE December 2014 – 39.0– SAYE December 2015 34.0 –– LTIP 86.9 104.7– EPS 105.1 N/A
Notes to the consolidated financial statementscontinued
FirstGroup Annual Report and Accounts 2016144

35 Retirement benefit schemesDefined contribution plansPayments to defined contribution retirement benefit schemes are charged as an expense as they fall due. There is no legal or constructive obligation to pay additional contributions into a defined contribution scheme if the fund has insufficient assets to pay all employees’ benefits relating to employee service in the current and prior periods.
UKThe Group operates defined contribution retirement benefit plans for all Group and First Bus division employees who have joined a pension arrangement since January 2011 and April 2013, respectively. They will receive a Company match to their contributions, which varies by salary and/or service level.
North AmericaEmployees in the US have been able to join a defined contribution arrangement for many years. They will receive a Company match to their contributions, which varies by employment status. The Company match is 50% of member contributions, to a Company maximum of 3% for full-time employees and $250 per annum for part-time employees.
All new employees in Canada join a defined contribution arrangement. Union employees join the Eastern or Western plan, dependent upon their geographical location, whilst managers and supervisors join the Supervisory plan. Members of the Western and Supervisory plans can contribute 2%, 3%, 4% or 5%, and receive a 50% Company match. Members of the Eastern plan may contribute 2%, 3% or 4%, and receive a 100% Company match.
The total expense recognised in the consolidated income statement of £18.2m (2015: £23.0m) represents contributions payable to these plans by the Group at rates specified in the rules of the plans.
Defined benefit plansThe Group sponsors 16 funded defined benefit plans across its operations, covering approximately 70,000 former and current employees.
UKThe majority of defined benefit provision is through Trust-based schemes. With the exception of the Railways Pension Schemes (RPS), these arrangements are now closed to new entrants. In these arrangements the assets of the schemes are invested separately from those of the Group, and the schemes are run by independent Trustee boards. The Trustee board of the pension schemes is required by law, or by their Articles of Association, to act in the best interest of the fund and of all relevant stakeholders in the scheme, i.e. active employees, inactive employees, retirees, beneficiaries and employers. There is a requirement for the Trustee board to have some member representation with the other Trustees being company appointed.
The Trustee board is responsible for the investment policy in respect of the assets of the fund, although the Company must be consulted on this, and typically has some input into the investment decisions.
Schemes are valued at least triennially, when the cost of future service is calculated and the funding position established. The Company and Trustee board are required to agree on assumptions for the valuation and to agree the contributions that result from this. The contributions may need to incorporate deficit recovery contributions in addition to future service contributions, if a deficit position is determined through the valuation. If a surplus is shown at the valuation, this may be used to reduce future service contributions. In agreeing contribution rates, reference must be made to the affordability of contributions by the employer.
In most arrangements, any surplus after benefits have been paid/secured, can be repaid to the employer.
The First UK Bus Pension SchemeThis predominantly provides pension benefits to employees in the First Bus division. Historically the scheme provided final salary benefits and career average benefits. However, with effect from April 2012, the scheme provides career average benefits with a retirement age linked to State Pension age and a cap on the pensionable pay on which defined benefits can be built.
The defined benefit pensionable pay is capped at £21,580 per annum, with defined contribution benefit building on any pensionable pay above this amount.
The costs of future service are shared between the employer and member, so that the employer and employees each meets 50% of the cost.
The funding level of the scheme will be calculated on 5 April 2017, and if agreed funding levels are not achieved, the scheme will close to defined benefit accrual 12 months later.
In addition there is a smaller Group scheme which provides defined benefit pensions to Group employees and executives. This closed to new entrants in 2011. This scheme is subject to the same funding level test at 5 April 2017 as The First UK Bus Pension Scheme, and will also close to defined benefit accrual from April 2018 if the First Bus scheme does.
During the year the Trustee of the Group scheme agreed to change the index used for the revaluation of pensions from the Retail Price Index (RPI) to the Consumer Price Index (CPI). This produced a past service gain of £10.8m in the year.
FirstGroup Annual Report and Accounts 2016 145
Financial statements

35 Retirement benefit schemes continuedThe Railways Pension SchemeThe Group currently sponsors four sections of the RPS, relating to its franchising obligations for its TOCs, and for Hull Trains, its Open Access operator.
Under this scheme members build a 1/60th pension and 1/40th lump sum based upon their pensionable pay. Some members of the RPS are subject to Protected Persons legislation, which requires individual consent to changes to benefits, and certain rights upon transfer between sections of the scheme.
The RPS is a shared cost arrangement. All costs, and any deficit or surplus is shared 60% by the employer and 40% by the members. Furthermore, under the franchising obligations, the responsibility of the employer is to pay the contributions requested of the Trustee whilst it operates the franchise. There is no residual liability or asset for any deficit, or surplus, which remains at the end of the franchise period.
During the year, some changes to benefits were agreed with members of the TOC sections, to take account of the fact that the RPS would no longer be contracted-out from April 2016. Pensionable pay growth for past service benefits is capped at RPI plus 0.25%. The Normal Pension Age for future service has also increased to 62 for members who are not Protected Persons. The pensionable pay cap has resulted in a past service gain of £28.8m. Given the franchise nature of these operations, the balance sheet franchise adjustment has decreased by an offsetting £28.8m, recognising that not all of this benefit will be available to First Rail, and that the element that will be available will be recognised in full via lower cash obligations during the remainder of the franchise.
In calculating the Group’s pension obligations in respect of the RPS the Group has calculated the total pension deficits in each of the RPS sections in accordance with IAS 19. These deficits are reduced by a ‘franchise adjustment’ which is that portion of the deficit which is projected to exist at the end of the franchise and for which the Group will not be required to fund. The franchise adjustment, which has been calculated by the Group’s actuaries, is offset against the present value of the RPS liabilities so as to fairly present the financial performance, position and cash flows of the Group’s obligations. Allowance is also made in the preparation of the financial statements for the cost sharing nature of the benefit and in particular, only 60% of the total profit and loss charge and balance sheet position are attributed to the Group and recognised in the accounts. Hull Trains is not subject to franchising obligations, and as such it is accounted for under IAS 19 as a defined benefit scheme, although subject to the same cost sharing obligations as for the franchised sections.
The Group has re-estimated the calculation of the franchise adjustment under IAS19 (revised) to better reflect the commercial terms and shorter duration of the GWR and TPE franchises. This change in accounting estimate has been triggered by the new Direct Awards operated by GWR and First TransPennine Express in the year and has been applied prospectively from 1 April 2015. As a result of this change in accounting estimate the operating profit charge for First Rail pension schemes for the full year is £18.6m lower at £27.4m than it would otherwise have been. The change in the basis of estimate has no effect on the cash contributions made to the First Rail pension schemes in the year.
Local Government Pension SchemesThe Group participates in five Local Government Pension Schemes (LGPS), three in England and two in Scotland. These differ from Trust-based schemes in that their benefits are prescribed by legislation, and they are administered by local authorities, and pension committees consisting of local councillors. Typically the Group has less control over the investment strategy adopted by the LGPS compared to the UK Trust-based schemes.
Historically benefit accrual in these schemes has been based on final salary. The benefit structure changed to a 1/47th career average benefit in England in April 2014 and in Scotland in April 2015. Normal pension age will be aligned with State Pension Age from that time. Some members have a right to receive some of their benefits on an unreduced basis, conditional on age and service.
As with the Trust-based schemes, valuations take place at least triennially. Generally contribution rates are agreed for the three year period until the next valuation. Whilst these are balance of cost schemes, at termination there is no right for the Company to receive any surplus in the schemes, although there is an obligation on the Company to fully fund the benefits. To reflect this, the Group only recognise existing surpluses relating to the LGPS when determining the balance sheet position, to the extent that these surpluses could be recouped by the reduction of future company contributions.
North AmericaUSThe Group operates two defined benefit arrangements in the US. These are legacy arrangements with benefit accrual having ceased some years ago. The schemes are valued annually, when the funding position and minimum and maximum contributions are established.
Changes in funding position create new surplus or deficit each year, which is normally spread over seven years, as required by legislation. However, funding relief passed by Congress has allowed greater flexibility following the global financial crisis, having the effect of increasing the funding discount rate, which acts to lower liabilities, deficits and contributions or spreading deficit payments over a longer period.
Greyhound CanadaThere are three plans, relating to Eastern, Western and Supervisory employees. All these plans are now closed to new members, although benefit accrual continues for existing members. Very small executive arrangements also exist.
The plans are valued annually, where the cost of future service and the funding position are identified. Future service costs are shared in proportion between the members and the Company, although there are caps on the member rates. Deficit contributions are met entirely by the Company. Cash contributions are required to fund the plans on a ‘going concern’ basis, whilst the (usually higher) ‘solvency’ deficit can be made good through a combination of cash contributions and Letters of Credit. There is a cap on the value of the Letter of Credit, which cannot exceed 15% of the value of the assets held in the plan.
ValuationsAt their last valuations, the defined benefit schemes had funding levels between 76.2% and 105.4% (2015: 74.1% and 105.1%). The market value of the assets at 31 March 2016 for all defined benefit schemes totalled £4,045m (2015: £4,146m).
Notes to the consolidated financial statementscontinued
FirstGroup Annual Report and Accounts 2016146

35 Retirement benefit schemes continuedThe valuation assumptions used for accounting purposes have been made uniform to Group standards, as appropriate, when each scheme is actuarially valued.
First Bus 2016
%
First Rail 2016
%
North America
2016 %
First Bus 2015
%
First Rail 2015
%
North America
2015 %
Key assumptions used:Discount rate 3.70 3.70 3.60 3.50 3.50 3.45Expected rate of salary increases 1.75 3.10 2.50 1.85/2.95 3.45 2.50Inflation – RPI – – – 2.95 2.95 –Inflation – CPI 2.85 2.85 2.00 1.85 1.85 2.00Future pension increases 1.75 1.75 – 1.85/2.85 1.85 –
Disclosures on sensitivity of the defined benefit obligation to changes in the relevant actuarial assumptions can be found in the table/notes in the Financial review on page 45 which forms part of these audited financial statements.
(a) Income statementAmounts (charged)/credited to the income statement in respect of these defined benefit schemes are as follows:
Year to 31 March 2016First Bus
£mFirst Rail
£m
North America
£mTotal
£m
Current service cost (20.2) (46.0) (7.6) (73.8)Franchise adjustment – (10.2) – (10.2)Past service gain on TOC schemes – 28.8 – 28.8Past service gain on Group scheme (note 4) 10.8 – – 10.8Interest cost (1.4) (8.8) (6.1) (16.3)Interest on franchise adjustment – 8.7 – 8.7
(10.8) (27.5) (13.7) (52.0)
Year to 31 March 2015First Bus
£mFirst Rail
£m
North America
£mTotal
£m
Current service cost (25.5) (61.5) (7.2) (94.2)Interest cost (3.2) (11.5) (6.1) (20.8)Interest on franchise adjustment – 10.7 – 10.7
(28.7) (62.3) (13.3) (104.3)
Net interest comprises:
2016 £m
2015 £m
Interest cost (table (c)) (127.7) (160.3)Interest income on assets (table (d)) 114.2 142.4Interest on irrecoverable surplus (table (i)) (2.8) (2.9)
(16.3) (20.8)
During the year £9.7m (2015: £9.8m) of administrative expenses were incurred.
Actuarial gains and losses have been reported in the consolidated statement of comprehensive income.
The actual return on scheme assets was:
2016 £m
2015 £m
First Bus (6.9) 333.2First Rail 73.3 143.6North America (4.1) 88.0
62.3 564.8
FirstGroup Annual Report and Accounts 2016 147
Financial statements
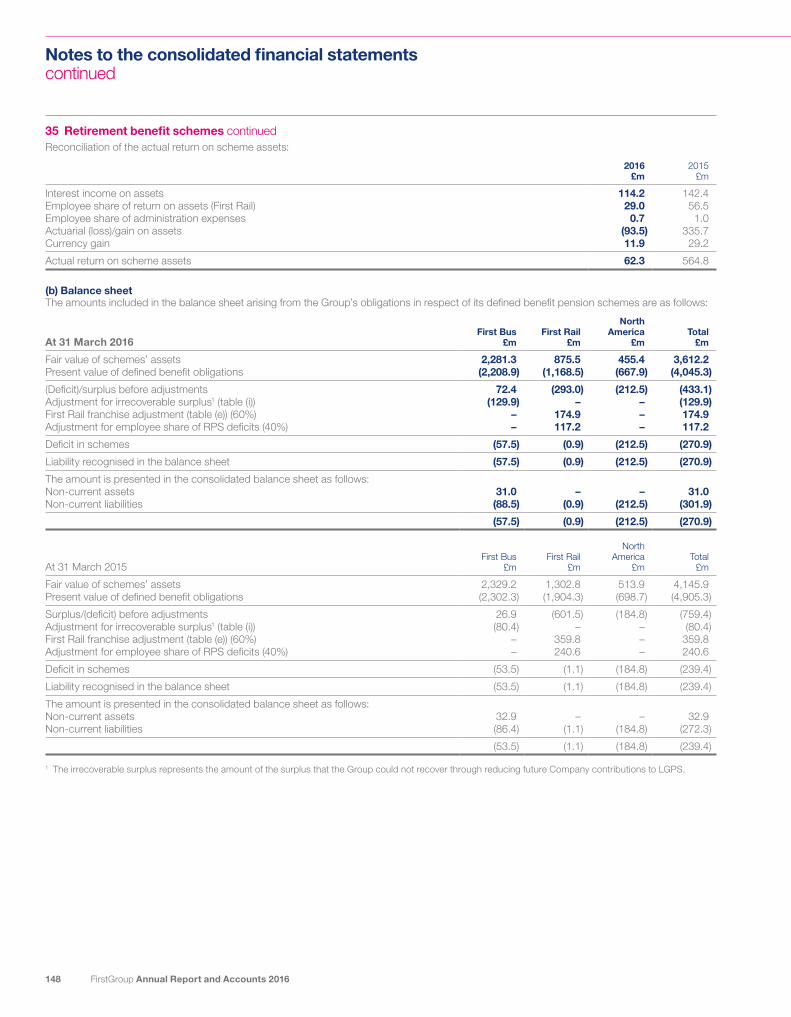
35 Retirement benefit schemes continuedReconciliation of the actual return on scheme assets:
2016 £m
2015 £m
Interest income on assets 114.2 142.4Employee share of return on assets (First Rail) 29.0 56.5Employee share of administration expenses 0.7 1.0Actuarial (loss)/gain on assets (93.5) 335.7Currency gain 11.9 29.2
Actual return on scheme assets 62.3 564.8
(b) Balance sheetThe amounts included in the balance sheet arising from the Group’s obligations in respect of its defined benefit pension schemes are as follows:
At 31 March 2016First Bus
£mFirst Rail
£m
North America
£mTotal
£m
Fair value of schemes’ assets 2,281.3 875.5 455.4 3,612.2Present value of defined benefit obligations (2,208.9) (1,168.5) (667.9) (4,045.3)
(Deficit)/surplus before adjustments 72.4 (293.0) (212.5) (433.1)Adjustment for irrecoverable surplus1 (table (i)) (129.9) – – (129.9)First Rail franchise adjustment (table (e)) (60%) – 174.9 – 174.9Adjustment for employee share of RPS deficits (40%) – 117.2 – 117.2
Deficit in schemes (57.5) (0.9) (212.5) (270.9)
Liability recognised in the balance sheet (57.5) (0.9) (212.5) (270.9)
The amount is presented in the consolidated balance sheet as follows:Non-current assets 31.0 – – 31.0Non-current liabilities (88.5) (0.9) (212.5) (301.9)
(57.5) (0.9) (212.5) (270.9)
At 31 March 2015First Bus
£mFirst Rail
£m
North America
£mTotal
£m
Fair value of schemes’ assets 2,329.2 1,302.8 513.9 4,145.9Present value of defined benefit obligations (2,302.3) (1,904.3) (698.7) (4,905.3)
Surplus/(deficit) before adjustments 26.9 (601.5) (184.8) (759.4)Adjustment for irrecoverable surplus1 (table (i)) (80.4) – – (80.4)First Rail franchise adjustment (table (e)) (60%) – 359.8 – 359.8Adjustment for employee share of RPS deficits (40%) – 240.6 – 240.6
Deficit in schemes (53.5) (1.1) (184.8) (239.4)
Liability recognised in the balance sheet (53.5) (1.1) (184.8) (239.4)
The amount is presented in the consolidated balance sheet as follows:Non-current assets 32.9 – – 32.9Non-current liabilities (86.4) (1.1) (184.8) (272.3)
(53.5) (1.1) (184.8) (239.4)
1 The irrecoverable surplus represents the amount of the surplus that the Group could not recover through reducing future Company contributions to LGPS.
Notes to the consolidated financial statementscontinued
FirstGroup Annual Report and Accounts 2016148

35 Retirement benefit schemes continued(c) Defined benefit obligations (DBO)Movements in the present value of DBO were as follows:
First Bus £m
First Rail £m
North America
£mTotal
£m
At 1 April 2015 2,302.3 1,904.3 698.7 4,905.3Cessation of franchise (First ScotRail) – (724.2) – (724.2)Current service cost 16.2 44.9 4.3 65.4Past service costs and curtailments (10.8) (28.8) – (39.6)Effect of settlements – – (16.5) (16.5)Interest cost 79.6 25.3 22.8 127.7Employee share of change in DBO (not attributable to franchise adjustment) 13.7 46.8 1.1 61.6Experience loss/(gain) on DBO 11.8 (5.6) (1.5) 4.7Loss on change of assumptions (demographic) – – 5.8 5.8Gain on change of assumptions (financial) (111.7) (72.3) (12.1) (196.1)Benefit payments (92.2) (21.9) (55.7) (169.8)Currency loss – – 21.0 21.0
At 31 March 2016 2,208.9 1,168.5 667.9 4,045.3
First Bus £m
First Rail £m
North America
£mTotal
£m
At 1 April 2014 2,062.5 1,881.2 615.5 4,559.2Cessation of franchise (First Capital Connect) – (390.8) – (390.8)Current service cost 20.7 60.0 3.7 84.4Interest cost 89.8 45.3 25.2 160.3Employee share of change in DBO (not attributable to franchise adjustment) 12.6 182.2 1.1 195.9Experience (gain)/loss on DBO (28.8) 13.0 6.4 (9.4)Loss on change of assumptions (demographic) 20.2 11.6 9.1 40.9Loss on change of assumptions (financial) 211.9 146.5 45.0 403.4Benefit payments (86.6) (44.7) (51.3) (182.6)Currency loss – – 44.0 44.0
At 31 March 2015 2,302.3 1,904.3 698.7 4,905.3
(d) Fair value of schemes’ assetsMovements in the fair value of schemes’ assets were as follows:
First Bus £m
First Rail £m
North America
£mTotal
£m
At 1 April 2015 2,329.2 1,302.8 513.9 4,145.9Cessation of franchise (First ScotRail) – (525.1) – (525.1)Settlement impact on assets – – (15.3) (15.3)Interest income on assets 81.0 16.5 16.7 114.2Company contributions 41.6 27.1 20.1 88.8Employee contributions 13.6 21.1 1.1 35.8Employee share of return on assets – 29.0 – 29.0Actuarial (loss)/gain on assets (87.9) 27.1 (32.7) (93.5)Benefit paid from schemes (92.2) (21.9) (55.7) (169.8)Employer administration expenses (4.0) (1.1) (4.6) (9.7)Currency gain – – 11.9 11.9
At 31 March 2016 2,281.3 875.5 455.4 3,612.2
FirstGroup Annual Report and Accounts 2016 149
Financial statements

35 Retirement benefit schemes continued
First Bus £m
First Rail £m
North America
£mTotal
£m
At 1 April 2014 2,033.3 1,405.4 463.1 3,901.8Cessation of franchise (First Capital Connect) – (277.4) – (277.4)Interest income on assets 89.5 33.8 19.1 142.4Company contributions 41.5 48.5 16.5 106.5Employee contributions 12.6 29.9 1.1 43.6Employee share of return on assets – 56.5 – 56.5Actuarial gain on assets 243.7 52.3 39.7 335.7Benefit paid from schemes (86.6) (44.7) (51.3) (182.6)Employer administration expenses (4.8) (1.5) (3.5) (9.8)Currency gain – – 29.2 29.2
At 31 March 2015 2,329.2 1,302.8 513.9 4,145.9
(e) First Rail franchise adjustmentMovements in the total First Rail franchise adjustment were as follows:
2016 £m
2015 £m
At 1 April 599.7 452.5First ScotRail/First Capital Connect/First Great Western (199.1) (113.4)Interest on franchise adjustment 8.7 10.7Employee share of change in franchise adjustment 16.3 104.3Actuarial (loss)/gain on franchise adjustment (133.5) 145.6
At 31 March 292.1 599.7
Under the terms of the RPS cost sharing this franchise adjustment is split 60:40 between the employer and the employees. This is reflected in table (b) which shows the Group’s 60% share of the franchise adjustment.
(f) Asset allocationThe vast majority of the assets held by the pension arrangements are invested in pooled funds with a quoted market price. The analysis of the schemes’ assets at the balance sheet dates were as follows:
At 31 March 2016First Bus
£mFirst Rail
£m
North America
£mTotal
£m
Equities 872.9 222.6 228.8 1,324.3Bonds 769.7 248.1 177.7 1,195.5Property 53.4 82.7 23.0 159.1Cash (13.4) 87.6 7.5 81.7Infrastructure 60.0 – – 60.0Cash plus 451.6 234.5 18.4 704.5Commodities 28.3 – – 28.3Private equity 58.8 – – 58.8
2,281.3 875.5 455.4 3,612.2
At 31 March 2015First Bus
£mFirst Rail
£m
North America
£mTotal
£m
Equities 892.9 – 259.7 1,152.6Bonds 876.2 60.4 218.2 1,154.8Property 68.4 – 20.5 88.9Cash 45.2 4.4 5.4 55.0Infrastructure 6.9 60.8 3.0 70.7Cash plus 335.4 1,016.5 7.1 1,359.0Commodities 22.9 – – 22.9Private equity 81.3 160.7 – 242.0
2,329.2 1,302.8 513.9 4,145.9
Notes to the consolidated financial statementscontinued
FirstGroup Annual Report and Accounts 2016150

35 Retirement benefit schemes continued(g) Accounting for First Rail pension arrangementsHad the Group accounted for First Rail pensions as if the respective franchises had an indefinite duration, the impact on the financial statements would have been as follows:
2016 £m
2015 £m
Balance sheetPension deficit (174.9) (359.8)Intangible assets – (3.6)Deferred tax 31.5 72.7
Impact on net assets (143.4) (290.7)
Income statementUnwinding of discount on franchise adjustment (27.4) (10.7)Past service gain 28.8 –Intangible asset amortisation – 7.8Deferred tax (0.3) 0.5
Impact on profit for the year from continuing operations 1.1 (2.4)
Consolidated statement of comprehensive income Actuarial loss/(gain) on franchise adjustment 133.5 (145.6)Deferred tax on actuarial (loss)/gain (24.0) 29.1
109.5 (116.5)
(h) Consolidated statement of comprehensive incomeAmounts presented in the consolidated statement of comprehensive income comprise:
2016 £m
2015 £m
Actuarial gain/(loss) on DBO 185.6 (434.9)Actuarial (loss)/gain on assets (64.5) 335.7Actuarial (loss)/gain on franchise adjustment (133.5) 145.6Adjustment for irrecoverable surplus (46.8) (12.5)
Actuarial (losses)/gains on defined benefit schemes (59.2) 33.9
(i) Adjustment for First UK Bus irrecoverable surplusMovements in the adjustment for the First UK Bus irrecoverable surplus were as follows:
2016 £m
2015 £m
At 1 April (80.4) (65.0)Interest on irrecoverable surplus (2.7) (2.9)Actuarial loss on irrecoverable surplus (46.8) (12.5)
At 31 March (129.9) (80.4)
Cash contributionsAs at 31 March 2016 the Group is committed to make deficit recovery payments with a net present value of £136m (2015: £130m), over the period to 5 April 2029, in respect of the First UK Bus Pension Scheme. The net present value reflects the current value of deficit recovery payments that would be required to meet the actuarial deficit in full, discounted at 9.0% per annum. The IAS 19 deficit of the scheme at 31 March 2016 is £64.9m (2015: £55.4m). Management consider that, were a pension asset to arise in respect of this scheme, this would be fully recoverable through actions within the Group’s control, in line with the rules of the scheme.
The estimated amounts of employer contributions expected to be paid to the defined benefit schemes during the financial year to 31 March 2017 is £94.8m (year to 31 March 2016: £88.3m).
Risks associated with defined benefit plans:Generally the number of employees in defined benefit plans is reducing rapidly, as these plans are largely closed to new entrants, and in many cases to future accrual. Consequently, the number of defined contribution members is increasing.
Furthermore, changes have been implemented to the First UK Bus Pension Scheme with effect from April 2015 which allow for the closure of the scheme if the funding level is not in line with the target level. This change will serve to limit the risks associated with defined benefit pension provision by the Group.
Despite remaining open to new entrants and future accrual, the risks posed by the RPS are limited, as under the franchise arrangements, the First Rail TOCs are not responsible for any residual deficit at the end of a franchise. As such, there is only short term cash flow risk within this business.
FirstGroup Annual Report and Accounts 2016 151
Financial statements

35 Retirement benefit schemes continuedThe key risks relating to the defined benefit pension arrangements and the steps taken by the Group to mitigate them are as follows:
Risk Description Mitigation
Asset volatility The liabilities are calculated using a discount rate set with reference to corporate bond yields; if assets underperform this yield, this will create a deficit. Most of the defined benefit arrangements hold a significant proportion of return-seeking assets (equities, diversified growth funds and global absolute return funds) which, though expected to outperform corporate bonds in the long term, create volatility and risk in the short term.
Asset liability modelling has been undertaken to ensure that any risks taken are expected to be rewarded.
Inflation risk A significant proportion of the UK benefit obligations are linked to inflation, and higher inflation will lead to higher liabilities.
The business has certain inflation linking in its revenue streams, which helps to offset this risk. In addition, the investment strategy reviews have led to increased inflation hedging, mainly through swaps or holding Index Linked Gilts in the UK schemes.
Uncertainty over level of future contributions
Contributions to defined benefit schemes can be unpredictable and volatile as a result of changes in the funding level revealed at each valuation.
The Group engages with the Trustees and Administering Authorities to consider how contribution requirements can be made more stable. The level of volatility and the Group’s ability to control contribution levels varies between arrangements.
Life expectancy The majority of the scheme’s obligations are to provide benefits for the life of the member, so increases in life expectancy will result in an increase in the liabilities.
Linking retirement age to State Pension Age (as in the First UK Bus Pension Scheme and LGPS) has mitigated this risk to some extent.
Trapped surplus At termination of LGPS arrangements there is no right for the company to receive any surplus that exists within the scheme. Therefore there is a risk of overfunding the schemes.
This issue is discussed with the Administering Authorities when contribution schedules are set, and the Group receives professional advice on potential ways of mitigating some of this risk.
Legislative risk Future legislative changes are uncertain. In the past these have led to increases in obligations, through introducing pension increases, and vesting of deferred pensions, or reduced investment return through the ability to reclaim Advance Corporation Tax.
The Group receives professional advice on the impact of legislative changes.
36 Related party transactionsTransactions between the Company and its subsidiaries, which are related parties, have been eliminated on consolidation and are not disclosed in this note.
Remuneration of key management personnelThe remuneration of the Directors, which comprise the plc Board who are the key management personnel of the Group, is set out below in aggregate for each of the categories specified in IAS 24 Related Party Disclosures. Further information about the remuneration of individual Directors is provided in the Directors’ remuneration report on pages 70 to 100.
Year to 31 March
2016 £m
Year to 31 March
2015 £m
Basic salaries1 1.6 1.6Performance-related bonuses 0.3 0.8Benefits in kind 0.1 0.1Fees 0.6 0.6Payment in lieu of notice – 0.0Share-based payment 0.3 0.3
2.9 3.4
1 Basic salaries include cash emoluments in lieu of retirement benefits and car and tax allowances.
37 Post-balance sheet eventsOn the 1 April 2016 the new TPE rail franchise commenced and as a result additional Performance Bonds of £101.6m became effective.
On the 7 April 2016 the sale of a Greyhound property in San Jose, California was completed. The net book value of the property at 31 March 2016 of £1.8m is included within Assets held for sale in note 18. Proceeds of £23.4m were received in relation to the sale resulting in a gain of £21.6m which will be recognised in the Financial Statements for the year to 31 March 2017.
In April 2016, First Student announced the realignment of its regional management and central service structures resulting in the elimination of 130 positions.
Notes to the consolidated financial statementscontinued
FirstGroup Annual Report and Accounts 2016152

38 Information about related undertakingsIn accordance with Section 409 of the Companies Act 2006, a full list of subsidiaries and equity accounted investments as at 31 March 2016 is disclosed below:
Subsidiaries – wholly owned and incorporated in the United KingdomA E & F R Brewer LimitedAirport Buses LimitedAirport Coaches LimitedBadgerline Group LimitedBolton Coachways and Travel LimitedBristol Bus Station LimitedButler Woodhouse LimitedCawlett LimitedCCB Holdings LimitedCCB TV LimitedCentreWest LimitedCentreWest London Buses LimitedCentreWest ESOP Trustees (UK) LimitedChester City Transport LimitedCrosville LimitedDon Valley Buses LimitedEast Coast Trains LimitedEast West Rail LimitedEastern Scottish Omnibuses LimitedECOC (Holdings) LimitedFB Canada Holdings LimitedFG Canada Investments LimitedFG Learning & Development Limited1
FG Properties LimitedFGI Canada Holdings LimitedFirst Aberdeen limitedFirst Ashton LimitedFirst Beeline Buses LimitedFirst Bristol LimitedFirst Caledonian Sleeper LimitedFirst Capital Connect LimitedFirst Capital East LimitedFirst Capital North LimitedFirst CentreWest Buses LimitedFirst Coaches LimitedFirst Cross Country LimitedFirst Crossrail LimitedFirst Cymru Buses LimitedFirst Docklands LimitedFirst Dublin Metro LimitedFirst East Anglia LimitedFirst East Midlands LimitedFirst Eastern Counties Buses LimitedFirst Essex Buses LimitedFirst European Holdings Limited1
First Games Transport LimitedFirst Glasgow Limited1
First Glasgow (No.1) LimitedFirst Glasgow (No.2) LimitedFirst Great Northern LimitedFirst Great Western Link LimitedFirst Great Western Trains Limited
First Greater Western LimitedFirst Hampshire & Dorset LimitedFirst Information Services Limited1
First International (Holdings) Limited1
First International No.1 LimitedFirst Leicester Buses Limited3
First London Buses Limited3
First Manchester LimitedFirst Merging Pension Schemes LimitedFirst Metro LimitedFirst Midland Red Buses LimitedFirst North West (Schools) LimitedFirst North West LimitedFirst Northern Ireland LimitedFirst Northern Railway Holdings LimitedFirst Northern Railway LimitedFirst Pioneer Bus LimitedFirst Potteries LimitedFirst Provincial Buses LimitedFirst Rail Holdings Limited1
First Scotland East LimitedFirst ScotRail LimitedFirst ScotRailRailways LimitedFirst Shared Services LimitedFirst Somerset & Avon LimitedFirst South West LimitedFirst South Western Trains LimitedFirst South Yorkshire LimitedFirst Student UK LimitedFirst Thameslink LimitedFirst TransPennine Express LimitedFirst Wessex National LimitedFirst West Coast LimitedFirst West Yorkshire LimitedFirst York LimitedFirstBus (North) Limited1
FirstBus (South) Limited1
FirstBus Group LimitedFirstBus Investments Limited1
FirstGroup Airports Limited1
FirstGroup American InvestmentsFirstGroup Canadian Finance Limited1
FirstGroup CIF Trustees LimitedFirstGroup Construction LimitedFirstGroup Holdings Limited1
FirstGroup (QUEST) Trustees Limited1
FirstGroup US Finance Limited1
FirstGroup US HoldingsFleetrisk Management LimitedG.E. Mair Hire Services LimitedG.A.G. Limited1
GB Extended Ventures LimitedGB Railways Group Limited1
GB Railways LimitedGMBN Employees’ Share Scheme Trustee LimitedGreat Western Holdings Limited1
Great Western Trains Company LimitedGreat Western Trustees LimitedGrenville Motors LimitedGreyhound LimitedGreyhound UK Limited
GRT Bus Group LimitedGurna LimitedHalesworth Transit LimitedHampshire Books LimitedHorizon Trains LimitedHull Trains Company LimitedIndexbegin LimitedKCB LimitedKelvin Central Buses LimitedKelvin Scottish Omnibuses LimitedKirkpatrick of Deeside LimitedLynton Bus & Coach LimitedLynton Company Services LimitedMainline ESOP Trustees (No 1) LimitedMainline ESOP Trustees (No 2) LimitedMainline Partnership Limited1
Mainline Partnership Pension Trustees LimitedMainline Employees’ Shareholding Trustees LimitedMidland Bluebird LimitedMidland Travellers LimitedNorth Devon LimitedNorth Western Trains Company Limited4
Northampton Transport LimitedPortsmouth Transit LimitedQuickstep Travel LimitedReiver Venture Properties LimitedReiver Ventures LimitedReynard Buses LimitedRider Holdings LimitedRider Travel LimitedS Turner & Sons LimitedScott’s Hospitality LimitedSheafline (S.U.T.) LimitedSheffield & District Traction Company LimitedSheffield United Transport LimitedSkillplace Training LimitedSmiths of Portland LimitedSMT Omnibuses LimitedSouthampton CityBus LimitedSouthampton City Transport Company LimitedSovereign Quay LimitedStrathclyde Buses LimitedStreamline Buses (Bath) Limited1
Taylors Coaches LimitedThe FirstGroup Midlands & East Anglia Pension Scheme Trustee LimitedThe FirstGroup North West Pension Scheme Trustee LimitedThe FirstGroup Pension Scheme Trustee LimitedThe FirstGroup Scottish Pension Scheme Trustee LimitedThe First South & Wales Pension Scheme Trustee LimitedThe First UK Bus Pension Scheme Trustee LimitedThe New Great Eastern Railway Company Limited1
Totaljourney Limited1
Tram Operations LimitedTransportation Claims LimitedTuronian LimitedWessex of Bristol LimitedWest Dorset Coaches LimitedWestern National Holdings Limited
FirstGroup Annual Report and Accounts 2016 153
Financial statements

Notes to the consolidated financial statementscontinued
38 Information about related undertakings continued
Subsidiaries – wholly owned and incorporated in the United States of AmericaAmericanos USA, LLC ATE Management of DuluthAtlantic Greyhound Lines of Virginia, Inc.Berkshire Transit Management, Inc.Central Mass Transit Management Co, Inc.Central Virginia Transit Management, Inc.Clinton Area Regional Transit Management, Inc.Durham City Transit CompanyFirst DG, Inc.FirstGroup Investment CorporationFirst Management Services LLCFirst Student Management Services LLCFirst Student, Inc.First Transit, Inc.First Vehicle Services, Inc.FirstGroup America Holdings, Inc.FirstGroup America, Inc.FirstGroup International, Inc.Franklin Transit Management, Inc.GLI Corporate Risk Solutions, Inc.Greyhound Lines, Inc.H.N.S. Management Company, Inc.Laidlaw International Finance, Inc.Laidlaw Medical Holdings, Inc.Laidlaw Transportation Holdings, Inc.Laidlaw Transportation Management, Inc.Laidlaw Transportation, Inc.Laidlaw Two, Inc.Laredo Transit Management, Inc.LSX Delivery, LLCMerrimack Valley Area Transportation, Inc.MidSouth Transportation Management, Inc.National Insurance and Indemnity CorporationOn Time Delivery Service, Inc.Paratransit Management of Berkshire, Inc.Paratransit Brokerage Services TM, Inc.Safe Transport LLCSafe Ride Services, Inc.Shuttle Services M.I.A., Inc.South Coast Transit Management, Inc.Southwestern Virginia Transit Management, Inc.Special Transportation Services, Inc.Springfield Area Transit Company, Inc.SuTran, Inc.Transit Management of Abilene, Inc.Transit Management of Alexandria, Inc.Transit Management of Ashville, Inc.Transit Management of Central Maryland, Inc.Transit Management of Denton, Inc.Transit Management of Dutchess County, Inc.Transit Management of Montgomery, Inc.Transit Management of Racine, Inc.Transit Management of Richland, Inc.Transit Management of Rocky Mount, Inc.Transit Management of Sherman, Inc.
Transit Management of Spartanburg, Inc.Transit Management of St Joseph, Inc.Transit Management of Washoe, Inc.Transit Management of Wilmington, Inc.Valley Area Transit Company, Inc.Valley Garage CoValley Transit Co, Inc.
Subsidiaries – not wholly owned but incorporated in the United States of AmericaDG 21 LLC (51%)First Mile Square LLC (51%) SYPS LLC (87.5%)Transportation Realty Income Partners L.P. (50%)
Subsidiary – wholly owned and incorporated in US Virgin IslandsPrimaisla, Inc.
Associates – incorporated in DenmarkDSP APS (30%)DSB Danmark A/S (30%)
Subsidiaries – wholly owned and incorporated in IrelandAeroporto LimitedLast Passive Limited
Subsidiary – wholly owned and incorporated in IndiaTransit Operations India Private Limited
Subsidiary – wholly owned and incorporated in PanamaFirst Transit de Panama, Inc.
Subsidiaries – wholly owned and incorporated in CanadaAutobus Transco (1988) Limited Cardinal Coach Lines ULCFirstCanada ULCGray Coach Travel, Inc.Greyhound Canada Transportation ULCGreyhound Courier Express LimitedManhattan Equipment Supply Company Limited
Subsidiaries not wholly owned but incorporated in CanadaGreyhound and Coach Canada Terminal Operation Limited (50%)
Subsidiaries – wholly owned and incorporated in Puerto RicoFirst Transit of Puerto Rico, Inc.First Transit Rail of Puerto Rico, Inc.
Subsidiary – wholly owned and incorporated in MexicoGreyhound de Mexico, S.A. de C.V.Greyhound Lines Mexico, S.A. de R.L. de C.V.
Subsidiaries not wholly owned but incorporated in the United KingdomCareroute Limited (80%)First/Keolis Holdings Limited (55%)First/Keolis TransPennine Holdings Limited (55%)First/Keolis TransPennine Limited (55%)1
PTI (South East) Limited (20%)PTI Website Limited (20%)1
Leicester City Bus Limited (94%)2
LCB Engineering Limited (94%)Leicester City Bus Benefits Limited (94%)Nicecon Limited (50%)Somerset Passenger Solutions Limited (50%)
1 Directly owned by FirstGroup plc.2 All shares held in subsidiary undertakings are
ordinary shares, with the exception of Leicester CityBus Limited where the Group owns 100% of its redeemable cumulative preference shares and 94% of its ordinary shares.
3 Dissolved 10 May 2016.4 In liquidation.
FirstGroup Annual Report and Accounts 2016154
Independent auditor’s report to the members of FirstGroup plc
Opinion on financial statements of FirstGroup plcIn our opinion:
■■ the financial statements give a true and fair view of the state of the Group’s and of the parent company’s affairs as at 31 March 2016 and of the Group’s profit for the year then ended;
■■ the Group financial statements have been properly prepared in accordance with International Financial Reporting Standards (IFRSs) as adopted by the European Union;
■■ the parent company financial statements have been properly prepared in accordance with United Kingdom Generally Accepted Accounting Practice, including FRS101 “Reduced Disclosure Framework”; and
■■ the financial statements have been prepared in accordance with the requirements of the Companies Act 2006 and, as regards the Group financial statements, Article 4 of the IAS Regulation.
The financial statements comprise the consolidated income statement, the consolidated statement of comprehensive income, the consolidated balance sheet, the consolidated statement of changes in equity and the consolidated cash flow statement, and the related notes 1 to 38, the parent company balance sheet, the parent company statement of changes in equity and the related notes to the parent company balance sheet 1 to 10. The financial reporting framework that has been applied in the preparation of the Group financial statements is applicable law and IFRSs as adopted by the European Union. The financial reporting framework that has been applied in the preparation of the parent company financial statements is applicable law and United Kingdom Accounting Standards (United Kingdom Generally Accepted Accounting Practice), including FRS101 “Reduced Disclosure Framework”.
Going concern and the Directors’ assessment of the principal risks that would threaten the solvency or liquidity of the GroupAs required by the Listing Rules we have reviewed the Directors’ statement regarding the appropriateness of the going concern basis of accounting contained with the Strategic report on page 46 and Other statutory information on pages 103 to 104 and note 2 to the financial statements and the directors’ statement on the longer-term viability of the group contained within the strategic report on page 41.
We have nothing material to add or draw attention to in relation to:
■■ the directors’ confirmation on page 58 that they have carried out a robust assessment of the principal risks facing the Group, including those that would threaten its business model, future performance, solvency or liquidity;
■■ the disclosures on pages 36 to 41 that describe those risks and explain how they are being managed or mitigated;■■ the directors’ statement within the Strategic report on page 46 and Other statutory information on pages 103 to 104 and note 2 to the financial statements about whether they considered it appropriate to adopt the going concern basis of accounting in preparing them and their identification of any material uncertainties to the Group’s ability to continue to do so over a period of at least twelve months from the date of approval of the financial statements; and
■■ the directors’ explanation on page 41 as to how they have assessed the prospects of the Group, over what period they have done so and why they consider that period to be appropriate, and their statement as to whether they have a reasonable expectation that the Group will be able to continue in operation and meet its liabilities as they fall due over the period of their assessment, including any related disclosures drawing attention to any necessary qualifications or assumptions.
We agreed with the directors’ adoption of the going concern basis of accounting and we did not identify any such material uncertainties. However, because not all future events or conditions can be predicted, this statement is not a guarantee as to the group’s ability to continue as a going concern.
IndependenceWe are required to comply with the Financial Reporting Council’s Ethical Standards for Auditors and we confirm that we are independent of the Group and we have fulfilled our other ethical responsibilities in accordance with those standards. We also confirm we have not provided any of the prohibited non-audit services referred to in those standards.
FirstGroup Annual Report and Accounts 2016 155
Financial statements

Independent auditor’s report to the members of FirstGroup plccontinued
Our assessment of risks of material misstatementThe assessed risks of material misstatement described below are those that had the greatest effect on our audit strategy, the allocation of resources in the audit and directing the efforts of the engagement team.
Risk How the scope of our audit responded to the risk
The assessment of the carrying value of First Student goodwill (£1,123m) in the consolidated balance sheetThe assessment of the carrying value of goodwill and intangibles, as described in note 2, involves judgement in relation to forecasting future cash flows and is sensitive to growth rates and the discount rate applied to the future cash flows. The Cash Generating Unit (CGU) most sensitive to variation in these assumptions is the First Student CGU, as described in note 11 to the financial statements, where headroom has decreased from £301m to £232m as it continues to implement its returns based strategy while facing certain cost challenges.
Management has highlighted impairments of intangible assets (including goodwill) as a key accounting judgement and source of estimation uncertainty in note 2.
We challenged management’s assumptions used in their impairment model for goodwill, specifically including the cash flow projections, discount rates and growth rates applied.
Our procedures included:
■■ considering the identification of appropriate cash generating units;■■ assessing profit forecast projections with reference to historical trading performance and profit forecasting accuracy;
■■ comparing the discount rate applied against a broad comparator group as well as involving our internal valuation specialists to review underlying calculations and assess the key components of the discount rate calculation;
■■ comparing the growth rates applied to the long term average growth rate of the relevant jurisdiction, as well as comparing historical growth rates to the equivalent measures;
■■ considering the reasonableness of, and recalculating, the sensitivity assessment applied by management;
■■ performing further independent sensitivity analysis on the impairment model; and ■■ considering the appropriateness of the disclosure on reasonably possible changes.
The assessment of the valuation and completeness of third party claims and associated provisions (£408m) in the consolidated balance sheetThe valuation and completeness of both legal and US self-insurance provisions are a source of estimation uncertainty, as described in note 26, which require management’s best estimate in assessing the likeliness and valuation of settlement, where applicable, the discount rate applied to the expected settlement values. The US self-insurance claims have decreased in both volume and severity during the year, but the claim development has increased.
Management has highlighted self-insurance as a key accounting judgement and source of estimation uncertainty in note 2.
The audit procedures we performed in respect of this risk included:
■■ working with our own actuarial experts to test a range of estimates determined by management and their external actuary considering the methodologies employed and comparing assumptions used to the Group’s historical experience;
■■ independently developed an actuarial calculation and compared the provision recorded to the actuarial range calculated by the external actuary;
■■ tested a sample of the underlying data used to develop the provision for completeness and accuracy and challenged the appropriateness of the discount rate used through comparison to previous years and those used by similar entities;
■■ evaluating historical accuracy of claims forecasting to determine the reasonableness of the provision; and
■■ for legal claims, obtaining confirmations from internal and independent external legal counsel.
Valuation of pension scheme liabilities (£4.0bn) in the consolidated balance sheetThe Group operates in a labour intensive industry with large membership to a number of defined benefit pension schemes. The gross pension liabilities, as disclosed in note 35, are materially sensitive to changes in the underlying assumptions adopted. Management exercise significant judgement when determining those assumptions, particularly the discount rate, inflation, and mortality rates. During the year the Group has revised the calculation of the First Rail franchise pension adjustment under IAS19 (Revised) to more accurately reflect the shorter duration and commercial terms of GWR and TPE franchises. This change in accounting estimate has been triggered by the new direct awards operated by GWR and TPE in the period and has been applied prospectively from 1 April 2015.
Management has highlighted defined benefit pension arrangements as a key accounting judgement and source of estimation uncertainty in note 2.
The audit procedures we performed in respect of this risk included:
■■ working with our own actuarial experts to test the assumptions used by management in valuing the Group’s defined benefit pension scheme liabilities such as the discount rate, inflation and mortality rate;
■■ testing the values of the assets in the schemes and the accuracy and completeness of the member data used by the actuaries in performing their assessment of the schemes;
■■ performing sensitivity analysis on the key assumptions and comparing them to industry benchmarks and the prior years’ rates adopted; and
■■ audited the change in estimate for the calculation of the rail franchise adjustment, confirming its consistency with the principles of IAS19 (Revised) and market practice in the sector.
FirstGroup Annual Report and Accounts 2016156

Risk How the scope of our audit responded to the risk
Revenue recognition including contract accountingThe Group operates a number of long term contracts including First Rail franchises and certain North American passenger and service contracts. Management exercise judgement in determining the appropriate timing and valuation of revenue recognised, valuation of associated deferred and accrued income and the evaluation of the overall profitability of these contracts.
Management has highlighted contract and franchise accounting as a key accounting judgement and source of estimation uncertainty in note 2.
To test the risk of material misstatement in respect of revenue recognition, our procedures included:
■■ assessing and challenging the judgements taken by management by reference to the underlying contract terms and applicable accounting standards; and
■■ challenging the levels of income accrued at the balance sheet date in relation to unbilled contract revenue in particular in the North American businesses, and deferred in relation to ongoing compensation claims in the UK rail businesses.
The description of risks above should be read in conjunction with the significant issues considered by the Audit Committee discussed on page 67.
These matters were addressed in the context of our audit of the financial statements as a whole, and in forming our opinion thereon, and we do not provide a separate opinion on these matters.
Our application of materialityWe define materiality as the magnitude of misstatement in the financial statements that makes it probable that the economic decisions of a reasonably knowledgeable person would be changed or influenced. We use materiality both in planning the scope of our audit work and in evaluating the results of our work.
We determined materiality for the Group to be £8.0m (2015: £7.9m), which is 4.8% (2015: 4.8%) of adjusted pre-tax profit (as defined on page 118), and below 1% (2015: 1%) of equity. The adjusted pre-tax profit measure has been used to exclude the volatility of non-recurring items. In addition, the exclusion of amortisation and the income statement effect of ineffective and unhedged financial derivative valuation is consistent with the key measure used by the Group for internal and external reporting purposes. This measure has been used to facilitate a better understanding of the trading performance of the Group.
We agreed with the Audit Committee that we would report to the Committee all audit differences in excess of £160,000 (2015: £158,000) as well as differences below that threshold that, in our view, warranted reporting on qualitative grounds. We also report to the Audit Committee on disclosure matters that we identified when assessing the overall presentation of the financial statements.
An overview of the scope of our auditOur Group audit was scoped by obtaining an understanding of the Group and its environment, including Group-wide controls, and assessing the risks of material misstatement at the Group level. Based on that assessment, we focused our Group audit scope primarily on the four First Bus operating regions, two significant Train Operating Companies, the operations in North America and the Group, Rail division and Bus division corporate head office functions as well as the UK Shared Service Centre. These locations were subject to full audit procedures. First Rail Holdings was subject to specified audit procedures on rail franchise bid costs based on our assessment of the risks of material misstatement and of the materiality of the Group’s operations at that location. These locations were subject to full audit procedures and represent the principal business units and account for 89% of the Group’s net assets, 99% of the Group’s revenue and 100% of the Group’s profit before tax. They were also selected to provide an appropriate basis for undertaking audit work to address the risks of material misstatement identified above. Our audit work at locations subject to full audit procedures was executed at levels of materiality applicable to each individual location which was lower than Group materiality.
At the parent entity level we also tested the consolidation process and carried out analytical procedures to confirm our conclusion that there were no significant risks of material misstatement of the aggregated financial information of the remaining components not subject to audit or audit of specified account balances.
We include all component audit teams in our team briefing, discuss their risk assessment and a senior member of the Group audit team has visited all locations to review documentation of the findings from their work. Opinion on other matters prescribed by the Companies Act 2006In our opinion:
■■ the part of the Directors’ Remuneration Report to be audited has been properly prepared in accordance with the Companies Act 2006; and■■ the information given in the Strategic Report and the Directors’ Report for the financial year for which the financial statements are prepared is consistent with the financial statements.
FirstGroup Annual Report and Accounts 2016 157
Financial statements

Matters on which we are required to report by exceptionAdequacy of explanations received and accounting recordsUnder the Companies Act 2006 we are required to report to you if, in our opinion:
■■ we have not received all the information and explanations we require for our audit; or■■ adequate accounting records have not been kept by the parent company, or returns adequate for our audit have not been received from branches not visited by us; or
■■ the parent company financial statements are not in agreement with the accounting records and returns.
We have nothing to report in respect of these matters.
Directors’ remunerationUnder the Companies Act 2006 we are also required to report if in our opinion certain disclosures of Directors’ remuneration have not been made or the part of the Directors’ Remuneration Report to be audited is not in agreement with the accounting records and returns. We have nothing to report arising from these matters.
Corporate Governance StatementUnder the Listing Rules we are also required to review the part of the Corporate Governance Statement relating to the Company’s compliance with ten provisions of the UK Corporate Governance Code. We have nothing to report arising from our review.
Our duty to read other information in the Annual Report
Under International Standards on Auditing (UK and Ireland), we are required to report to you if, in our opinion, information in the Annual Report is:
■■ materially inconsistent with the information in the audited financial statements; or■■ apparently materially incorrect based on, or materially inconsistent with, our knowledge of the Group acquired in the course of performing our audit; or■■ otherwise misleading.
In particular, we are required to consider whether we have identified any inconsistencies between our knowledge acquired during the audit and the Directors’ statement that they consider the annual report is fair, balanced and understandable and whether the Annual Report appropriately discloses those matters that we communicated to the Audit Committee which we consider should have been disclosed. We confirm that we have not identified any such inconsistencies or misleading statements.
Respective responsibilities of directors and auditorAs explained more fully in the Directors’ Responsibilities Statement, the Directors are responsible for the preparation of the financial statements and for being satisfied that they give a true and fair view. Our responsibility is to audit and express an opinion on the financial statements in accordance with applicable law and International Standards on Auditing (UK and Ireland). Those standards require us to comply with the Auditing Practices Board’s Ethical Standards for Auditors. We also comply with International Standard on Quality Control 1 (UK and Ireland). Our audit methodology and tools aim to ensure that our quality control procedures are effective, understood and applied. Our quality controls and systems include our dedicated professional standards review team, strategically focused second partner reviews and independent partner reviews.
This report is made solely to the company’s members, as a body, in accordance with Chapter 3 of Part 16 of the Companies Act 2006. Our audit work has been undertaken so that we might state to the Company’s members those matters we are required to state to them in an auditor’s report and for no other purpose. To the fullest extent permitted by law, we do not accept or assume responsibility to anyone other than the Company and the Company’s members as a body, for our audit work, for this report, or for the opinions we have formed.
Scope of the audit of the financial statementsAn audit involves obtaining evidence about the amounts and disclosures in the financial statements sufficient to give reasonable assurance that the financial statements are free from material misstatement, whether caused by fraud or error. This includes an assessment of: whether the accounting policies are appropriate to the Group’s and the parent company’s circumstances and have been consistently applied and adequately disclosed; the reasonableness of significant accounting estimates made by the Directors; and the overall presentation of the financial statements. In addition, we read all the financial and non-financial information in the annual report to identify material inconsistencies with the audited financial statements and to identify any information that is apparently materially incorrect based on, or materially inconsistent with, the knowledge acquired by us in the course of performing the audit. If we become aware of any apparent material misstatements or inconsistencies we consider the implications for our report.
Mark Mullins (Senior Statutory Auditor)for and on behalf of Deloitte LLP Chartered Accountants and Statutory Auditor London
14 June 2016
Independent auditor’s report to the members of FirstGroup plccontinued
FirstGroup Annual Report and Accounts 2016158

Group financial summaryUnaudited
Consolidated income statement2016
£m2015
£m2014
£m2013
£m2012
£m
Group revenue 5,218.1 6,050.7 6,717.4 6,900.9 6,678.7Operating profit before amortisation charges and other adjustments 300.7 303.6 268.0 254.1 361.0Amortisation charges (51.9) (54.3) (53.4) (52.0) (30.9)Other adjustments (2.5) (3.5) 17.6 (62.3) 59.6
Operating profit 246.3 245.8 232.2 139.8 389.7
Net finance cost (132.4) (139.7) (156.1) (163.2) (155.6)Ineffectiveness on financial derivatives (0.4) (0.3) (17.6) (5.5) (11.0)
Profit/(loss) before tax 113.5 105.8 58.5 (28.9) 223.1Tax (17.1) (20.3) 5.7 23.9 (34.9)
Profit/(loss) for the year from continuing operations 96.4 85.5 64.2 (5.0) 188.2
Loss for the year from discontinued operations – – – – (9.5)
Profit/(loss) for the year 96.4 85.5 64.2 (5.0) 178.7
EBITDA 615.9 624.4 579.8 585.7 675.4
Earnings per share pence pence pence pence pence
Adjusted 10.3 9.8 7.5 11.0 24.4Basic 7.5 6.2 5.1 (3.0) 27.8
Consolidated balance sheet £m £m £m £m £m
Non-current assets 4,201.3 4,025.1 3,686.7 4,060.3 4,072.7Net current liabilities (239.3) (160.9) (78.4) (320.4) (265.9)Non-current liabilities (2,066.5) (2,141.3) (2,123.7) (2,602.3) (2,596.1)Provisions (262.3) (236.7) (261.6) (323.1) (338.1)
Net assets 1,633.2 1,486.2 1,223.0 814.5 872.6
Share dataNumber of shares in issue (excluding treasury shares and shares in trusts) millions millions millions millions millions
At year end 1,204.3 1,203.7 1,204.2 591.2 590.7Average 1,204.0 1,204.0 1,059.3 590.8 590.7
Share price pence pence pence pence pence
At year end 97 91 146 201 238High 128 140 224 261 370Low 81 91 92 176 238
Market capitalisation £m £m £m £m £m
At year end 1,168 1,095 1,757 969 1,147
FirstGroup Annual Report and Accounts 2016 159
Financial statements

Company balance sheetAs at 31 March
Note2016
£m2015
£m
Fixed assetsInvestments 3 1,847.0 2,078.4
Current assetsCash and cash equivalents 62.1 102.9Derivative financial instruments – due within one year 4 16.7 15.5
– due after more than one year 4 41.5 45.3Debtors – due within one year 5 2,393.8 1,898.7
– due after more than one year 5 1.6 2.5
2,515.7 2,064.9
Current liabilitiesCreditors – amounts falling due within one year 7 (376.3) (367.2)Derivative financial instruments 4 (68.1) (74.5)
(444.4) (441.7)
Net current assets 2,071.3 1,623.2
Total assets less current liabilities 3,918.3 3,701.6Non-current liabilitiesCreditors – amounts falling due after more than one year 7 (1,538.0) (1,570.8)Derivative financial instruments 4 (35.5) (22.6)
Net assets 2,344.8 2,108.2
Capital and reservesCalled up share capital 8 60.2 60.2Share premium 676.4 676.4Other reserves 268.8 268.8Own shares 9 (1.6) (1.9)Profit and loss account 1,341.0 1,104.7
Shareholders’ funds 2,344.8 2,108.2
Tim O’Toole14 June 2016
Matthew Gregory14 June 2016
Company number SC157176
FirstGroup Annual Report and Accounts 2016160

Statement of changes in equityAs at 31 March
Share capital
£m
Share premium
£m
Own shares
£m
Hedging reserve
£m
Merger reserve
£m
Capital reserve
£m
Capital redemption
reserve £m
Retained earnings
£mTotal
£m
Balance at 1 April 2014 60.2 676.4 (1.8) 6.7 166.4 93.8 1.9 939.0 1,942.6Total comprehensive income for the year – – – – – – – 162.0 162.0Movement in EBT and treasury shares – – (0.1) – – – – (1.5) (1.6)Share-based payments – – – – – – – 5.2 5.2
Balance at 31 March 2015 60.2 676.4 (1.9) 6.7 166.4 93.8 1.9 1,104.7 2,108.2Total comprehensive income for the year – – – – – – – 231.9 231.9Movement in EBT and treasury shares – – 0.3 – – – – (2.0) (1.7)Share-based payments – – – – – – – 6.4 6.4
Balance at 31 March 2016 60.2 676.4 (1.6) 6.7 166.4 93.8 1.9 1,341.0 2,344.8
FirstGroup Annual Report and Accounts 2016 161
Financial statements

Notes to the Company financial statements
1 Significant accounting policiesBasis of accountingThe financial statements have been prepared on a historical cost basis, except for the revaluation of certain financial instruments and on a going concern basis as described in the going concern statement within other statutory information on pages 103 to 104.
The Company has applied Financial Reporting Standard 101 ‘Reduced Disclosure Framework’ (FRS 101) issued by the Financial Reporting Council (FRC) incorporating the Amendments to FRS 101 issued by the FRC in July 2015 other than those relating to legal changes and has not applied the amendments to Company law made by The Companies, Partnerships and Groups (Accounts and Reports) Regulations 2015 that are effective for accounting periods beginning on or after 1 January 2016.
Adoption of FRS 101The separate financial statements of the company are presented as required by the Companies Act 2006. The Company meets the definition of a qualifying entity under Financial Reporting Standard (FRS 101) ‘Reduced Disclosure Framework’ issued by the Financial Reporting Council. Accordingly, in the year ended 31 March 2016 the Company has changed its accounting framework from pre-2015 UK GAAP to FRS 101 and has, in doing so, applied the requirements of IFRS 1.6-33 and related appendices. These financial statements have been prepared in accordance with FRS 101. This transition is not considered to have had a material effect on the financial statements and as such the Company has not presented a restated balance sheet or a reconciliation of equity on transition to FRS 101.
As permitted by FRS 101, the company has taken advantage of the disclosure exemptions available under that standard in relation to share-based payment, financial instruments, capital management, presentation of a cash-flow statement and certain related party transactions.
The financial statements have been prepared on the historical cost basis except for the re-measurement of certain financial instruments to fair value.
Where relevant, equivalent disclosures have been given in the consolidated financial statements. The financial statements have been prepared on the historical cost basis except for the re-measurement of certain financial instruments to fair value. The principal accounting policies adopted are the same as those set out in note 2 to the consolidated financial statements except as noted below.
InvestmentsFixed asset investments in subsidiaries and associates are shown at cost less provision for impairment. For investments in subsidiaries acquired for consideration, including the issue of shares qualifying for merger relief, cost is measured by reference to the nominal value only of the shares issued. Any premium is ignored.
Dividend distributionDividend distribution to the Company’s shareholders is recognised as a liability in the Company’s financial statements in the period in which the dividends are approved by the Company’s shareholders.
Dividend receivable from the Company’s subsidiaries are recognised only when they are approved by Shareholders.
2 Profit for the yearAs permitted by section 408 of the Companies Act 2006, the Company has elected not to present its own profit and loss account for the year. FirstGroup plc reported a profit for the financial year ended 31 March 2016 of £231.9m (2015: £162.0m).
Proposed final dividend per share for the year ended 31 March 2016 of nil p (2015: nil p).
Fees payable to the Company’s auditors for the audit of the Company’s annual financial statements are disclosed in note 6 of the Group accounts.
The Company had no employees in the current or preceding financial year.
3 Investments in subsidiary undertakingsUnlisted
subsidiary undertakings
£m
Cost At 1 April 2015 2,094.3Additions 6.4Disposals (237.8)
At 31 March 2016 1,862.9
Provisions for impairmentAt 1 April 2015 and 31 March 2016 (15.9)
Net book valueAt 31 March 2016 1,847.0
At 31 March 2015 2,078.4
A full list of subsidiaries and investments can be found in note 38 to the consolidated accounts.
During the year the company disposed of its investment in FirstGroup Acquisitions Limited.
FirstGroup Annual Report and Accounts 2016162

4 Derivative financial instruments2016
£m2015
£m
Total derivativesTotal assets – due after more than one year 41.5 45.3Total assets – due within one year 16.7 15.5
Total assets 58.2 60.8
Total creditors – amounts falling due within one year 68.1 74.5Total creditors – amounts falling due after more than one year 35.5 22.6
Total creditors 103.6 97.1
Derivatives designated and effective as hedging instruments carried at fair valueCurrent assetsCoupon swaps (fair value hedge) 16.4 15.5Fuel derivatives (cash flow hedge) 0.3 –
16.7 15.5
Non-current assetsCoupon swaps (fair value hedge) 41.3 45.3Fuel derivatives (cash flow hedge) 0.2 –
41.5 45.3
Total assets 58.2 60.8
Derivatives classified as held for tradingCurrent liabilitiesInterest rate swaps 1.2 7.6Fuel derivatives 66.9 66.9
68.1 74.5
Non-current liabilitiesInterest rate swaps – 1.2Fuel derivatives 35.5 21.4
35.5 22.6
Total liabilities 103.6 97.1
Full details of the Group’s financial risk management objectives and procedures can be found in note 24 of the Group accounts. As the holding company for the Group, the Company faces similar risks over foreign currency and interest rate movements.
5 Trade and other receivables2016
£m2015
£m
Amounts due within one yearAmounts due from subsidiary undertakings 2,387.6 1,889.4Deferred tax asset (note 6) 6.2 7.9Corporation tax recoverable – 1.3Other debtors – 0.1
2,393.8 1,898.7
Amounts due after more than one year
Deferred tax asset (note 6) 1.6 2.5
FirstGroup Annual Report and Accounts 2016 163
Financial statements

6 Deferred taxThe major deferred tax assets recognised by the Company and the movements thereon during the current and prior reporting periods are as follows:
Other temporary differences
£m
At 1 April 2015 (10.4)Charge to income 2.6
At 31 March 2016 (7.8)
The following is the analysis of the deferred tax balances for financial reporting purposes:
2016 £m
2015 £m
Deferred tax asset due within one year (6.2) (7.9)Deferred tax assets due after more than one year (1.6) (2.5)
(7.8) (10.4)
7 Creditors
2016 £m
2015 £m
Amounts falling due within one yearBank loans and overdrafts 56.4 77.5Senior unsecured loan notes 35.4 –Bond interest accrual 59.2 59.0Corporation tax 0.6 –Amounts due to subsidiary undertakings 214.0 222.9Accruals and deferred income 10.7 7.8
376.3 367.2
Amounts falling due after more than one year£300.0m Sterling bond – 8.125% 2018 298.3 297.8£250.0m Sterling bond – 6.125% 2019 279.0 286.3£350.0m Sterling bond – 8.750% 2021 370.1 366.6£325.0m Sterling bond − 5.250% 2022 320.5 320.0£200.0m Sterling bond – 6.875% 2024 199.6 199.5Senior unsecured loan notes 70.5 100.6
1,538.0 1,570.8
Borrowing facilitiesThe maturity profile of the Company’s undrawn committed borrowing facilities is as follows:
2016 £m
2015 £m
Facilities maturing:Due in more than two years 800.0 800.0
Details of the company’s borrowing facilities are given in note 21 to the Group accounts.
Notes to the Company financial statementscontinued
FirstGroup Annual Report and Accounts 2016164

8 Called up share capital2016
£m2015
£m
Allotted, called up and fully paid1,204.9m ordinary shares of 5p each 60.2 60.2
The number of ordinary shares of 5p in issue, excluding treasury shares held in trust for employees, at the end of the period was 1,204.2m (2015: 1,203.7m). At the end of the period 0.7m shares (2015: 1.2m shares) were being held as treasury shares and own share held in trust for employees.
9 Own sharesOwn shares
£m
At 1 April 2015 (1.9)Movement in EBT, QUEST and treasury shares during the year 0.3
At 31 March 2016 (1.6)
The number of own shares held by the Group at the end of the year was 669,374 (2015: 1,252,757) FirstGroup plc ordinary shares of 5p each. Of these, 479,625 (2015: 1,063,008) were held by the FirstGroup plc Employee Benefit Trust, 32,520 (2015: 32,520) by the FirstGroup plc Qualifying Employee Share Ownership Trust and 157,229 (2015: 157,229) were held as treasury shares. Both trusts and treasury shares have waived the rights to dividend income from the FirstGroup plc ordinary shares. The market value of the shares at 31 March 2016 was £0.6m (2015: £1.1m).
10 Contingent liabilitiesTo support subsidiary undertakings in their normal course of business, the Company and certain subsidiaries have indemnified certain banks and insurance companies who have issued performance bonds for £505.4m (2015: £489.2m) and letters of credit for £310.4m (2015: £304.4m). The performance bonds relate to the North American businesses of £462.2m (2015: £421.1m) and the First Rail franchise operations of £43.2m (2015: £68.1m). The letters of credit relate substantially to insurance arrangements in the UK and North America.
The Company is party to certain unsecured guarantees granted to banks for overdraft and cash management facilities provided to itself and subsidiary undertakings. The Company has given certain unsecured guarantees for the liabilities of its subsidiary undertakings arising under certain loan notes, hire purchase contracts, finance leases, operating leases, supply contracts and certain pension scheme arrangements. It also provides unsecured cross guarantees to certain subsidiary undertakings as required by VAT legislation. First Bus subsidiaries have provided unsecured guarantees on a joint and several basis to the Trustees of the First Bus Pension Scheme.
In its normal course of business First Rail has ongoing contractual negotiations with governmental and other organisations.
FirstGroup Annual Report and Accounts 2016 165
Financial statements