annual report 2011 - home – firstgroup plc · firstgroup annual report and accounts 2011 1 ......
TRANSCRIPT

Annual Report and Accounts
2011Annual Report and Accounts
2011

FirstGroup Annual Report and Accounts 2011 1
Op
erat
ing
and
fina
ncia
l rev
iew
Rep
ort
of
the
Dir
ecto
rsFi
nanc
ial s
tate
men
ts
FirstGroup plc is the leading transport operator in the UK and North America. With revenues of over £6 billion a year, we employ approximately 125,000 staff and transport over 2.5 billion passengers every year.
Our commitment to safety and customer service lies at the heart of our business and underpins everything we do.
Operating and financial review
1 Financial highlights 2 Chairman’s statement 4 Our business6 Our strategy7 Key performance indicators8 Market overview: First Student10 Market overview: First Transit12 Market overview: Greyhound14 Market overview: UK Bus16 Market overview: UK Rail18 Chief Executive’s operating review28 Finance Director’s review
Report of the Directors
34 Board of Directors36 Corporate governance44 Directors’ remuneration report50 Directors’ report53 Directors’ responsibilities statement
Financial statements
54 Consolidated income statement55 Consolidated statement of
comprehensive income 56 Consolidated balance sheet57 Consolidated statement of
changes in equity58 Consolidated cash flow statement59 Notes to the consolidated financial
statements105 Independent auditors’ report106 Group financial summary107 Company balance sheet108 Notes to the company financial
statements114 Independent auditors’ report115 Glossary116 Shareholder information117 Financial calendar
Financial highlights
Revenue
£6,429.2m2010: £6,261.9m
Adjusted EBITDA1
£778.2m2010: £763.9m
Adjusted operating profit2
£457.4m2010: £449.6m
Operating profit
£309.3m2010: £364.2m
Adjusted profit before tax2
£275.0m2010: £259.7m
Profit before tax
£127.2m2010: £175.3m
Adjusted basic EPS2
41.2p2010: 38.9p
Basic EPS
21.4p2010: 26.9p
Proposed final dividend per share
15.0p2010: 14.0p
Net debt3
£1,949.4m2010: £2,281.5m
1 Adjusted operating profit plus depreciation.2 Before amortisation charges, ineffectiveness on financial derivatives, non-recurring items, loss on disposal of properties
and discontinued operations. All references to ‘adjusted’ figures throughout this report are defined in this way.3 Net debt is stated excluding accrued bond interest.
Where appropriate, 2010 comparatives have been restated to exclude discontinued operation as explained in note 2 to the consolidated financial statements.

FirstGroup Annual Report and Accounts 2011 2 FirstGroup Annual Report and Accounts 2011 3
Op
erat
ing
and
fina
ncia
l rev
iew
Chairman’s statement
Against the backdrop of continued economic uncertainty we remained firmly focused on our key priorities including the dynamic management of our networks, continued cost control and further efficiencies to develop and improve margins. A strong performance from our UK Rail operations offset a disappointing result from our First Student business which continues to face pressure on operating margin as a result of constraints on school board budgets. We are taking decisive action to address First Student with a detailed plan to recover performance and create a stronger business model that will deliver a sustainable advantage in the longer-term.
I am pleased by the further advances we made in reducing net debt. We delivered our target ratio of 2.5 times net debt to EBITDA at 31 March 2011 demonstrating good progress over the year. We also strengthened our financial foundation in December 2010 with the signing of $1.4bn of five year committed bank facilities to replace existing revolving bank facilities that were due to mature in February 2012. This proactive management supports the maturity of our debt portfolio and prudent levels of liquidity over the medium-term. We are delighted by the continued strong support from our relationship banks demonstrating the confidence in the Group’s underlying strength and resilience.
The Board has proposed a final dividend per share, subject to approval by shareholders, of 15.0p, an increase of 7% making a full year payment of 22.12p. The final dividend will be paid on 19 August 2011 to shareholders on the register at 15 July 2011. We recognise that dividend growth is a key component of the investment decision for many shareholders. We remain committed to delivering sustained real growth in dividends, despite challenges as a result of the current economic environment. This is a priority for the Group and is adequately supported by continued strong cash flows.
This was a year of significant change within the Group. Tim O’Toole became Chief Executive on 1 November 2010, as Sir Moir Lockhead handed over his executive responsibilities ahead of his retirement on 31 March 2011. During his long and successful career Sir Moir made an outstanding contribution to the Group and to the transport industry as a whole. On behalf of the Board, I would like to recognise the pivotal role he played in transforming the Group into one of the world’s leading transport operators.
Tim joins the Group at a significant stage in its development. I am delighted to have attracted a leader of his calibre who has the experience, track record and vision to lead the Group on to further successful development. His extensive knowledge of transport markets in the UK and North America will be invaluable, not only in steering the immediate course ahead but also in ensuring that the Group is well placed to maximise future growth opportunities and extend its leadership position.
I would like to offer my sincere thanks and gratitude to all of our employees for their hard work and continued commitment during the year. In particular, I would like to acknowledge the extraordinary efforts made by our employees to assist passengers during the widespread disruption caused by the severe winter weather conditions. We recognise that, as the face of our business, their ongoing dedication to providing safe and high quality services to customers is vital to our continued success.
With operations that are fundamentally strong and new leadership with a clear focus on creating a stronger business and developing opportunities for growth, the Board is confident that the Group has good prospects in all of its core markets and will continue to deliver long-term value for shareholders.
Martin GilbertChairman11 May 2011
Operating profit referred to throughout this report refers to operating profit before amortisation charges, ineffectiveness on financial derivatives, non-recurring items, loss on disposal of properties and discontinued operations. EBITDA is adjusted operating profit plus depreciation.
The inherent strength of the Group comes from the scope and diversity of its portfolio of operations which enabled us to achieve our overall targets for the year with increased net cash supporting dividend growth, a reduction in net debt and increased capital investment in the business.
Martin Gilbert
Dividend per share (pence)Progressive dividend growth since 2004.
20052004 2006 2007 2008 2009 2010 2011
20.6522.12
11.6512.81
14.1015.50
17.0518.75

FirstGroup Annual Report and Accounts 2011 4 FirstGroup Annual Report and Accounts 2011 5
Op
erat
ing
and
fina
ncia
l rev
iew
FirstGroup plc is the leading transport operator in the UK and North America with revenues of over £6 billion a year. We employ approximately 125,000 staff throughout the UK and North America and transport over 2.5 billion passengers a year.
Our businessA portfolio of businessesOur portfolio of businesses is diversified by geography and customer base and structured into five main operating divisions:
First Student
First Transit
Greyhound
UK Bus
UK Rail.
This balanced portfolio provides a mix of contract-backed and passenger revenues. During these challenging economic times this mix of operations has provided strength and resilience against a changing trading backdrop.
Diverse marketsOur businesses in the UK and North America operate in local markets with different commercial and regulatory features. Pages 8 to 17 provide an overview of the markets in which we operate, their scale and characteristics together with our position in each one. Our position in the local bus and rail markets in the UK and in the student transportation, transit and intercity coach markets in the US and Canada provides us with unrivalled knowledge and experience of the many different commercial and regulatory frameworks in place and also puts us at the forefront in developing new and future opportunities.
Key risks and opportunities There are a number of potential risks and uncertainties that could, without effective management, impact Group performance. Full details of these, together with the mitigating actions, are set out in detail in the Report of the Directors.
The challenging economic environment of recent years has demonstrated the impact that economic activity has on both our passenger demand and contract businesses. For example, the level of economic activity affects the number of bus and rail journeys taken by passengers in the UK and North America and also creates budgetary pressure for school boards and transit authorities in North America.
All of our businesses compete in the areas of pricing, quality and service and face competition from a number of sources. In North America, our businesses cover a wide
geographic spread competing with several large companies as well as a substantial number of smaller, locally owned or government owned operators. Our Greyhound coach operations face competition from a number of other coach operators in North America as well as from budget airlines. In UK Bus and UK Rail, our main competitor is the car. To a lesser extent, long distance coaches and budget airlines are also a competitor to our UK Rail businesses. We believe that the increasing cost of motoring, principally rising fuel costs, is an opportunity to attract more passengers to our services.
For further details on how the Group assesses and manages the key risks and uncertainties please refer to the Corporate Governance section of the report on page 40.
Key stakeholders We work with a range of bodies in each of our markets. Understanding and managing our stakeholders’ expectations is pivotal to our success and therefore continual engagement is vital.
Some of our key stakeholder groups are:
Employees
Government and local authorities
Customers
Supply chain
Investors
Community.
2.5bnPassengers per year
125,000
£6.4bnNumber of staff weemploy in the UK and North America
Revenue for the year
First StudentThe largest provider of student transportation in North America with a fleet of approximately 57,000 yellow school buses, carrying some 6 million students every day across the US and Canada.
First TransitOne of the largest private sector providers of transit management and contracting in North America. First Services, a division of First Transit, is the largest private sector provider of vehicle maintenance and ancillary support services in the US.
GreyhoundThe only national provider of scheduled intercity coach services in the US and Canada. Greyhound provides scheduled passenger services to some 3,800 destinations carrying approximately 20 million passengers a year.
UK BusThe Group is Britain’s largest bus operator running more than one in five of all local bus services. A fleet of some 8,000 buses carries approximately 2.5 million passengers a day in more than 40 major towns and cities.
UK RailThe Group operates approximately one quarter of the UK passenger rail network, with a balanced portfolio of intercity, commuter and regional services, carrying over 290 million passengers a year.
In mainland Europe we operate some 150 buses in south west Germany and, with our partner DSB, we operate passenger rail services on routes in and between Denmark and Sweden.
Revenue £6,429.2mFirst Student 25%First Transit 12%Greyhound 10%UK Bus 18%UK Rail 35%
Employees 125,000First Student 50%First Transit 15%Greyhound 7%UK Bus 18%UK Rail 10%
Operating profit £457.4m
First Student 27%First Transit 12%Greyhound 8%UK Bus 31%UK Rail 22%

FirstGroup Annual Report and Accounts 2011 6 FirstGroup Annual Report and Accounts 2011 7
Op
erat
ing
and
fina
ncia
l rev
iew
Our strategy is to provide safe, reliable, innovative and sustainable transport delivering high quality and attractive services for passengers and long-term value for our shareholders.
The strength of the Group lies in the breadth and diversity of its operations. During the year different parts of our business continued to move through the economic cycle at a different pace, ensuring that the Group
is not dependent on any one market and also offsetting a weaker performance in one area with stronger performances in other parts of the portfolio.
Our strategy Key performance indicators
Throughout the year we retained a clear focus on achieving our priorities.
Delivering high quality services for customers
Customers want high quality services that are reliable and punctual. Across the Group we constantly review operational performance to ensure we deliver the services that meet the needs of our existing passengers and attract new customers to public transport. Overall our performance and customer satisfaction showed a steady or improving trend during the year. Our employees deliver an exceptional service to our customers every day and this year we embarked on our first global staff survey. We recognise that employee engagement is vital in order to continue to improve and develop the Group. The insights and front line experiences of our staff will create real and lasting change and help to position our business for the future.
Increasing cash generation
We retained a strong focus on increasing net cash within the Group and were pleased to exceed our target for the year. This performance was driven by a sustained focus and discipline across our operations including good progress made in implementing initiatives to deliver improvements in working capital. The highly cash generative nature of the Group enables us to increase capital expenditure and supports the Board’s policy to increase dividends by at least 7% per annum as well as deliver our net debt reduction programme.
Managing our networks
We continued to maximise the flexibility that exists within our networks to ensure that we respond quickly to any changing demand. Where we saw tough trading conditions in the towns and cities in which we operate we continued to manage supply through targeted mileage reduction and frequency adjustments. These actions, coupled with rigorous cost control, have been appropriate for the environment, however we retain the capability to restore capacity and service levels as economic growth recovers and demand returns. As we look to the future, our focus is to retain our strong cost discipline while renewing our focus on growth and promoting modal shift.
Strengthening our financial foundation
Net debt reduction is a key priority for the Group. During the year we made good progress, despite the subdued growth environment, in reducing leverage. We achieved our target ratio of 2.5 times net debt to EBITDA at 31 March 2011 (from 3.0 times at 31 March 2010) and we continue to target further improvement in 2011/12. We also strengthened our financial position during the year with the ongoing proactive management of debt. In December, $1.4bn of five year committed bank facilities were signed to replace revolving bank facilities due to mature in 2012. Achieving attractive pricing, terms and conditions we were pleased by the continued strong support for the Group.
Priorities
Description
Reduction in Lost Time Injuries
North American contract businesses
Revenue is principally from train passenger services, road passenger transport, and certain management and maintenance services in the UK and North America.
Adjusted operating profit is intended to highlight the recurring results of the Group before amortisation charges, ineffectiveness on financial derivatives, non-recurring items, loss on disposal of properties and discontinued operations.
Adjusted EBITDA is defined as adjusted operating profit plus depreciation.
Adjusted basic EPS is calculated by dividing the adjusted profit attributable to equity shareholders by the weighted average number of ordinary shares.
Lost Time Injuries refer to work-related injuries or illness that result in one of our employees being unable to work on a subsequent scheduled work day or shift. We achieved an 11% reduction in Lost Time Injuries across the Group.
In our North American contract businesses we retained approximately 90% of the fleet that came up for tender during the year. This reflects a continued strong performance in First Transit and a weaker performance in First Student as a result of the particularly high contract churn during the year and continued constraints on school board budgets.
Revenue increased by 2.7% including favourable foreign exchange movements of £98.0m, representing an increase of 1.1% at constant currencies.
Adjusted operating profit increased by 1.7% to £457.4m.
Adjusted EBITDA increased by 1.9% to £778.2m and EBITDA margin was maintained at over 12%.
Adjusted basic EPS was 41.2p (2010: 38.9p) representing an increase of 5.9%.
Performance
11%
c.90%
Revenue (£m)
2007 2008 2009
6,131.8
4,659.3
3,673.5
2010
6,261.9
2011
6,429.2
Adjusted operating profit (£m)
2007 2008 2009 2010 2011
494.3
356.9
257.1
449.6 457.4
Adjusted EBITDA (£m)
2007 2008 2009 2010 2011
767.5
556.5
396.2
763.9 778.2
2007 2008 2009 2010 2011
Adjusted basic EPS (pence)48.1
40.4
33.338.9 41.2

FirstGroup Annual Report and Accounts 2011 8 FirstGroup Annual Report and Accounts 2011 9
Op
erat
ing
and
fina
ncia
l rev
iew
We are the largest provider of student transportation in
North America with a fleet of approximately 57,000 school buses, carrying some 6 million students every day across the US and Canada.
Market overview: First StudentThe marketSchool buses provide transportation to millions of students across the US and Canada. There are over 15,000 school districts in North America responsible for providing over 530,000 school buses each day. In total, the North American market is estimated to be worth around $22 billion per annum.
Our market share We are the largest private sector operator of school buses in North America – over three times bigger than the next largest competitor
We operate approximately 57,000 school buses – with an average fleet age of 6.9 years
We operate in approximately 40 States in the US and eight Provinces and one Territory in Canada
We have more than 1,500 different contracts in approximately 600 locations
We provide charter hire services for school and non-school activities
Our scale enables us to develop value added services for existing and potential customers to provide greater on demand information and operating efficiencies.
CompetitorsOnly a third of school districts have outsourced their operations – approximately 183,000 school buses – to the private sector. The private outsourced sector market is highly fragmented with only 11 operators running more than 1,000 buses. Our largest competitors are National Express, Student Transportation and Atlantic Express. The 11 largest contractors operate approximately 100,000 buses – some 20% of the total market or 55% of the outsourced market. The next 40 largest contractors operate a further 15,000 buses and the remaining outsourced contracts are operated by more than 4,000 small companies, often termed ‘Mom and Pop’ operators.
Our customersSchool districts provide transportation for students depending on varying criteria determined at State level and contracts are typically awarded for three to five years. School districts receive funding for their activities including transportation from State and local sources, including tax receipts.
LabourThe majority of First Student’s employees are drivers who work part-time and only during the school year. Over two-thirds of First Student’s employees are represented by trade unions. The majority of our employees are represented by the International Brotherhood of Teamsters but many employees have chosen to be represented by other national and local unions.
Market features Contracted revenue
Typically high levels of contract retention
Safety and security
Trusted operator in the local community
Investment in innovation and technology.
Changes in market during 2010/11 Continued pressure on school board budgets as a result of economic weakness
Reduction in routes operated and school and non-school charter activity as a result of funding pressure.
57,000
1,500
6m
Number of school buses
Number of contracts
Students per day
Where we operate
Share of outsourced market
FirstGroup 31%National Express 9%Atlantic Express 3%Student Transportation 4%Illinois Central 1%Cook Illinois 1%Petermann 2%Other 49%
First Student fleet footprint
California 7%Illinois 8%Ontario 12%New England 15%NY/NJ/PA 21%All others 37%
Total market $22bnFirstGroup 11%Other outsourced 24%In-house 65%
ALASKA
Los Angeles
Seattle
New York
Chicago Detroit
Cincinnati
Miami
San FranciscoWashington
Employees
62,000
Operating profit
£128.3m
Revenue
£1,594.4m
Find out more at www.firstgroup.com/north_americaUnless otherwise stated information used in market overviews is based on internal company research
First Student

FirstGroup Annual Report and Accounts 2011 10 FirstGroup Annual Report and Accounts 2011 11
Op
erat
ing
and
fina
ncia
l rev
iew
First Transit is one of the largest private sector providers of transit
management and contracting, managing public transport systems on behalf of city transit authorities. It is one of the largest providers of shuttle bus services in the US and also manages call centres, paratransit operations and other light transit activities.
First Services is the largest private sector provider of vehicle maintenance and ancillary support services in the US.
Market overview: First TransitThe marketThe transit contracting and management services market includes fixed route bus services, paratransit bus services, airport, university and private shuttle services. The North American transit market is estimated to be worth $21 billion per annum with approximately 30% in the private outsourced sector.
We estimate the vehicle maintenance market to be worth $2.9 billion per annum in total with approximately 38% contracted out to private sector providers.
Our market share: Transit We operate in approximately 230 locations in 37 US States, Puerto Rico, US Virgin Islands and four Canadian Provinces
We have approximately 250 contracts
We operate and manage 11,600 buses
Our strategy is to deliver further growth in the light transit market
We are one of the largest providers of airport shuttle services in the US.
Our market share: Services We operate in over 90 locations in 24 US States and four international locations
We have approximately 90 contracts
We maintain over 43,000 vehicles
We provide fleet maintenance services for public and private sector customers
We provide support services including logistics support and facilities management to public and private sector clients including the US Navy and Air Force.
CompetitorsThe transit market is fragmented with the three largest private sector companies operating less than 35% of the total outsourced market. First Transit’s largest competitors are MV Transportation and Veolia Transdev Transportation.
The outsourced fleet maintenance market is highly competitive. We estimate that First Vehicles Services is the third largest in the market behind Penske and Ryder, however there are a number of small and medium sized companies that represent nearly a quarter of the outsourced market.
Our customersFirst Transit manages, operates, maintains and organises transportation services under contract to customers including transit authorities, Departments of Transportation, Federal, State and local agencies, as well as private institutions. The Americans with Disabilities Act requires public authorities operating fixed route transit to provide complementary paratransit services for eligible citizens. Contracts are typically for three to five years.
First Vehicle Services provides fleet vehicle maintenance services under contract to private and public sector clients including the Federal Government, cities and Fire and Police Departments.
First Support Services provides operations and maintenance services, including facilities management and warehousing and supply to agencies of Federal, State and local governments as well as to businesses in the private sector.
LabourThe majority of First Transit’s employees are represented by trade unions. The proportion of unionised staff is higher in heavy transit – our fixed route and paratransit contracts – than in other segments of the business. Less than 10% of First Services employees are represented by a union.
Market features Contracted revenue
High level of customer service and retention
Typically low capital investment.
Changes in market during 2010/11 Pressure on public spending budgets as a result of economic weakness.
300m
$1.2bn
4%
Passengers per year
Revenue for the year
Share of total market
Total market $21bnOutsourced 30%In-house 70%
Share of outsourced market
FirstGroup 14%Other companies 86%
Approximate revenueby type
Fixed route 33%Paratransit 26%Shuttle 14%Transit management 6%Vehicle Services 11%Support Services 10%
Puerto Rico
Los Angeles
San Francisco
Seattle
Washington
Miami
New YorkChicago Detroit
Cincinnati
Employees
19,000
Operating profit
£57.2m
Revenue
£771.5m
Find out more at www.firstgroup.com/north_america
First Transit
Where we operate

FirstGroup Annual Report and Accounts 2011 12 FirstGroup Annual Report and Accounts 2011 13
Op
erat
ing
and
fina
ncia
l rev
iew
Greyhound is the only national provider of scheduled intercity
coach transportation services in North America. Greyhound provides scheduled passenger services to 3,800 destinations throughout the US and Canada carrying approximately 20 million passengers annually.
Market overview: GreyhoundGreyhound has three operating subsidiaries in the United States: Valley Transit Company, serving the Texas-Mexico border; Crucero USA, serving southern California and Arizona into Mexico; and Americanos USA, serving points in Mexico from Texas and New Mexico.
BoltBus, a joint venture, operates between key city pair destinations in the north east of the US. This year we launched Greyhound Express, combining features of BoltBus with the strength of the Greyhound brand, with non-stop services from Chicago to several cities in the Midwest.
The marketThe majority of revenue is generated from passenger services but Greyhound also provides package express services, charter services and, in many terminals, food services. Greyhound has partnerships with a number of independent bus lines across the US. These bus companies provide complementary service to Greyhound’s existing schedules and link to many of the smaller towns in Greyhound’s national route system. In addition, Amtrak passengers use Greyhound to make connections to cities not served by rail on Amtrak Thruway service, by purchasing a ticket for the bus connection from Amtrak in conjunction with the purchase of their rail ticket.
Our market share We are the only national provider of scheduled intercity coach transportation services in the US and Canada
We carry approximately 20 million passengers per annum
We have a fleet of approximately 2,100 vehicles. The average age of the active fleet is 9.4 years.
CompetitorsIntercity coach transportation competes with many other modes of mid to long distance travel, including a number of other coach operators as well as budget airlines. The north east of the US is the most dense travel corridor in the country and is a highly competitive intercity coach market. In 2008 Greyhound launched BoltBus, a low cost, premium, curbside operation in this market.
Our customersGreyhound serves a diverse, value-oriented customer base by offering scheduled passenger services with an unrivalled network and route coverage. Our customers’ primary journey purpose is to visit friends and family. Traditionally, Greyhound customers bought ‘walk up’ tickets, primarily with cash but increasingly customers are buying tickets in advance through Greyhound.com.
BoltBus and our new Greyhound Express brand attract a different customer demographic with yield managed fares, online reservation and a range of features including free wireless internet on all buses.
LabourThe majority of our Greyhound employees are represented by a trade union, principally the Amalgamated Transit Union. A number of other unions also represent employees.
Market features Passenger revenues
Highly flexible operating model – ability to match services to changing passenger demand, particularly in the US
Value for money
Main reason for travel is to see family and friends.
Changes in market during 2010/11 Passenger revenue affected by weak economy and unemployment
Network changes in response to reduced passenger demand
Start of programme to refurbish fleet to improve service quality and performance
Launch of Greyhound Express to markets in the Midwest
Expansion of BoltBus to create a new hub in New Jersey providing services between Newark, Washington and Baltimore
Further agreements with Canadian Provinces to reduce mileage or receive financial support to run certain, low-utilised services in specific areas.
2,100
3,800
20m
Number of vehicles
Number of destinations
Passengers per year
Approximate revenue by type
Passenger 82%Package Express 9%Food Service 2%Charter 2%Other 5%
Approximate revenue USA vs Canada
USA 75%Canada 25%
Approximate distribution of sales and passengers by mileage band
1-200 miles 46%201-450 miles 32%451-1000 miles 15%1001+ miles 7%
Greyhound network in CanadaGreyhound networkin the USAffiliated carriers in Mexico
Employees
8,000
Operating profit
£40.2m
Revenue
£634.6m
Find out more at www.greyhound.com or www.greyhound.ca
Where we operate

FirstGroup Annual Report and Accounts 2011 14 FirstGroup Annual Report and Accounts 2011 15
Op
erat
ing
and
fina
ncia
l rev
iew
We are the largest bus operator in the UK with a fleet of 8,000
buses and a market share of approximately 23%. We carry some 2.5 million passengers every day.
Market overview: UK BusThe majority of our operations are in urban areas where the bus is the most effective means of tackling traffic congestion. We are working with local authorities and other stakeholders to provide punctual and reliable services for our customers and we continue to develop and promote effective partnerships. We also operate Greyhound UK providing regular intercity coach services on routes between London and the south coast, between Cardiff and Swansea and, most recently, between London and Glasgow.
Local bus services in the UK operate on two very different models. Outside London the market is deregulated and within London the market is regulated and competitively tendered.
The marketOutside LondonLocal bus services in the UK, outside London, were deregulated in the mid-1980s. The market is highly competitive between commercial bus operators – large and small – and between the bus and the private car. Revenue principally comes directly from fare paying passengers and indirectly from reimbursement by local authorities for concessionary passengers. Bus operators take revenue and cost risk. Bus markets are local and are affected by local issues from demographics to politics to topography. Local bus services operate on a flexible model with bus operators setting fares, frequencies and routes on a commercial basis to meet customer demand and also providing ‘socially necessary’ local bus services under contract to local authorities.
LondonBus services in London are operated on behalf of Transport for London (TfL). Contracts are gross cost and typically five years in length. TfL specifies fares, routes, timetables and vehicles, takes the revenue risk and pays operators for running services with a bonus and penalty regime linked to service quality.
Our market share We are the UK’s largest bus operator
We operate one in five of all local bus services
Our operations are diversified by geography – 40 major towns and cities – and by customer and journey purpose
Average fleet age is 8.4 years
We also operate Greyhound intercity coach services in the UK.
CompetitorsOur main competition in UK Bus is the car. In addition, the UK Bus market is deregulated and very competitive. In total, there are some 1,250 bus operators in the UK and in all markets in which we operate we face competition. During the year, a number of international transport operators have either entered the market or significantly increased their presence. Some multi- regional operators have increased market share through acquisition and a number of local bus operators have both entered and left the market.
Our customersOur UK Bus customers are diversified by journey purpose with significant proportions using bus services for commuting – to work, school, college or university – for food and non-food shopping and for leisure.
LabourAround 90% of UK Bus employees are members of a union, predominately Unite but with significant representation by other unions including the RMT and Unison.
Market features High customer satisfaction
Investment in new vehicles
Innovation in ticketing, marketing and information.
Changes in market during 2010/11 Lower passenger revenue growth as a result of economic weakness and higher unemployment
Mileage reduced in response to lower passenger demand
Continuation of the Competition Commission’s market study into local bus services in Great Britain
DfT consultation on reimbursement for concessionary bus travel and changes to regulations from 1 April 2011
Comprehensive Spending Review announced a 20% reduction in Bus Service Operators’ Grant from April 2012 and set out reductions in funding for local authorities from April 2011 leading to pressure on budgets for socially necessary bus services.
8,000
2.5m
24%
Number of buses
Passengers per day
Share of deregulated market
Share of deregulatedmarket outside London
FirstGroup 24%Stagecoach 20%DB Arriva 12%National Express 7%Go-Ahead 5%Others 32%
Source: Research note Liberum Capital December 2010Others includes independent operators, 11 local authority owned bus operators and companies owned by overseas operators
Share of London market
FirstGroup 12%Go-Ahead 21.5%DB Arriva 21%Stagecoach 15%ComfortDelGro 12.5%RATP 9.5%Abellio 5.5%Other 3%
Source: TfL website
UK Bus revenueConcessionary fares 21%London tenders 18%Non-London tenders 10%Passenger 51%
AberdeenNorthumberland Park
UxbridgeWillesden Junction
AlpertonWestbourne Park Dagenham
HackneyGreenford
HayesEdinburgh
YorkLeeds
HalifaxSheffield
NorwichLeicester
Northampton Ipswich
Chelmsford
London depots
Slough
PortsmouthSouthampton
Glasgow
Plymouth
ExeterBarnstaple
CardiffBath
Bristol
Manchester
Bradford
Stoke-on-Trent
Birmingham
Worcester
Swansea
Penzance
Weymouth
UK Bus operations
Chester
Employees
23,000
Operating profit
£148.8m
Revenue
£1,137.5m
Find out more at www.firstgroup.com/ukbus
Where we operate

FirstGroup Annual Report and Accounts 2011 16 FirstGroup Annual Report and Accounts 2011 17
Op
erat
ing
and
fina
ncia
l rev
iew
Our UK Rail division operates passenger services in the UK.
We have a strong balanced portfolio of intercity, regional and commuter franchises. Passenger rail franchises consist of First Capital Connect, First Great Western, First ScotRail and First TransPennine Express and one open access operator, First Hull Trains. We also operate the London Tramlink network on behalf of Transport for London carrying some 28 million passengers annually. We are the UK’s largest rail operator carrying over 290 million passengers a year.
The marketPrivatised in the mid-1990s it is a competitive environment between transport operators for the award of passenger rail franchises (contracts with the Department for Transport – and other franchising authorities – for the provision of services) and between rail services and other modes. Revenue comes directly from fare paying passengers or from franchising authorities. Total franchised passenger revenues are over £6 billion per annum. Train operators share revenue risk with franchising authorities – this is referred to as revenue support or revenue share – but bear cost risk. Net cost contracts of variable length – often seven years plus possible three year extension depending on a range of criteria, often related to performance targets.
Rail markets vary but are often grouped into three sectors – London and South East commuter services, regional and long distance. Some passenger rail franchises pay a premium to the franchising authority. Some receive a subsidy from the franchising authority. In some franchises the premium
increases (or subsidy decreases) over the duration of the franchise and in some franchises the level of premium or subsidy is constant.
Operators are responsible for the day to day management of train services. Many elements of the service provided to passengers are mandated as part of the contract, other features are left to the commercial judgment of operators.
Our market share We are the UK’s largest rail operator
Our operations are diversified by sector and by customer and journey purpose
We operate First Hull Trains, an open access passenger rail service
Through our joint venture with Danish State Railways we operate passenger rail services in and between Denmark and Sweden.
CompetitorsCompetition for new rail franchises is intense. We bid against operators of current
UK rail franchises and rail operators from other countries, principally from within the European Union. For example, in March 2011 four bidders pre-qualified for the InterCity West Coast franchise competition: two from the UK, one from France and one from the Netherlands.
The main competitor to rail services is the car but on some passenger flows there is competition from other rail services and, to a lesser extent, long distance coach and budget airlines.
Our customersOur customers are diversified by journey purpose. For our franchises in London and the South East of England, the majority of our passengers are commuters to and from London. First Great Western also has a large proportion of long distance and leisure travellers. First ScotRail and First TransPennine Express also carry a large number of commuters into the major towns and cities on their networks but also serve a significant leisure market.
Market features Passenger journeys at historic highs
Increasing customer satisfaction
Operational performance improving
Investment in passenger benefits.
Changes in market during 2010/11 Passenger revenue growth as a result of volume growth, marketing initiatives and additional services in some franchises and exogenous factors including economic recovery and employment growth, particularly in central London
Comprehensive Spending Review confirms increase to cap on regulated fares to RPI+3% for three years from January 2012, and Government funding for key infrastructure projects including the Thameslink Programme and Crossrail
Publication of the interim report of the McNulty review of value for money in the rail industry
Publication of ‘Reforming Rail Franchising: Government Response to Consultation & Policy Statement’ – future franchises will be longer; specifications will be less prescriptive and there will be greater incentives for operators to act efficiently and invest in the improvements passengers want
Start of InterCity West Coast and Greater Anglia refranchising competitions
Announcement of electrification of the Great Western Main Line to Didcot, Newbury, Oxford, Bristol and Cardiff and also key routes in north west England and go ahead for InterCity Express Programme to replace High Speed Trains
Government starts consultation on High Speed Two proposals.
290m
24%
Four
Passengers per year
Market share
Passenger rail franchises
Market overview: UK Rail
Share of UK rail market
Figures do not add up to 100% due to rounding
FirstGroup 24%Stagecoach 21%Govia 19%National Express 9%DB Arriva 9%DfT 9%Virgin Rail 6%Serco NedRail 3%MTR and other 1%
First Capital ConnectFirst Great Western
First ScotRailFirst TransPennine Express
94
92
90
88
86
84
822007 2008 2009 20112010
PP
M M
AA
0.8
1.0
UK Rail franchises PPM MAA*
First Capital Connect
First Great Western
First Hull Trains
First ScotRail
First TransPennine Express
Employees
13,000
Operating profit
£108.7m
Revenue
£2,269.8m
Find out more at www.firstgroup.com/uktrain
Where we operate
*Public Performance Measure (PPM) on a Moving Annual Average (MAA) basis

FirstGroup Annual Report and Accounts 2011 18 FirstGroup Annual Report and Accounts 2011 19
Op
erat
ing
and
fina
ncia
l rev
iew
Chief Executive’s operating reviewThe Group’s operations are fundamentally robust and, during the year, four out of five of our operating divisions performed in line or significantly better than our expectations.
Overview
During my first six months as Chief Executive I have taken confidence from the breadth and strength of our diverse portfolio of operations which, against an economic backdrop that remains challenging, has enabled us to achieve our overall targets with increased net cash supporting a dividend increase of 7%, a reduction of £332.1m in net debt and targeted capital investment. The Group’s operations are fundamentally robust and, during the year, four out of five of our operating divisions performed in line or significantly better than our expectations.
As a result of decisive action to address specific issues and strengthen the business we have taken the following one-off charges:
£59.9m contract provision principally related to accelerated depreciation for First Great Western following our commercial decision not to take up option to extend franchise for a further three years. We intend to bid for the new long-term Greater Western franchise reflecting the changed environment including significant Government investment in the region.
£39.5m charge to address First Student’s underperformance with a recovery plan to strengthen the business model and create a sustainable competitive advantage for the future.
£16.6m goodwill impairment and contract provision for future losses in relation to a First Support Services contract in Diego Garcia.
We have decided not to take up the option to extend First Great Western beyond the original franchise term which expires at the end of March 2013. The Government has committed significant investment to transform rail services in the region and we believe that through our unrivalled expertise and experience we are best placed to manage these projects and we intend to bid for the new Greater Western franchise.
We remain focused on retaining our leadership position in rail and are in discussion with the Department for Transport (DfT) on a proposal to extend the First TransPennine Express franchise. We were pleased to pre-qualify for the InterCity West Coast franchise and intend to offer compelling and innovative proposals to deliver high quality and attractive services for customers and improved value for taxpayers.
Our First Student business in North America performed significantly below our expectations during the year as we were not able to flex our costs sufficiently to offset the pressure on margins driven by the impact of constraints on school board budgets. Our detailed plan will recover performance and create a stronger business model to deliver a sustainable competitive advantage in the longer-term.
We have provided for the loss making First Support Services contract at Diego Garcia. We remain focused on increasing our share of the fast growing paratransit and shuttle businesses within First Transit’s portfolio and will reduce our exposure to less attractive markets.
Looking ahead, I am very clear about our priorities. We will improve the performance of our First Student business, retain our leadership position in UK Rail and develop the growth potential of our UK Bus, First Transit and Greyhound businesses.
Since I joined the Group I’ve visited locations across the UK and North America and have been privileged to meet many of our employees who are working very hard to deliver a safe, high quality service every day.
I am proud to join a business with safety at the heart of its operations. The safety of our customers and staff is our highest priority. We remain resolutely focused on eradicating unsafe acts and practices and continue to develop ways to actively engage employees. Injury Prevention, our industry leading programme, promotes increased awareness and encourages open and constructive dialogue about safety. Our ultimate ambition is to achieve zero injuries and during the year we made further progress with a reduction in Lost Time Injuries of 11%.
Our highest priority is the safety of our passengers and staff. This year we achieved a 11% reduction in Lost Time Injuries across the Group. Based on feedback from staff we refreshed the internal communications programme surrounding Injury Prevention to ensure everyone plays their part in staying safe and injury free.
Group resultsGroup revenue increased by 2.7% to £6,429.2m (2010: £6,261.9m) and included £98.0m of favourable foreign exchange movements. At constant exchange rates the increase was 1.1%. Adjusted operating profit increased to £457.4m (2010: £449.6m). Statutory operating profit was £309.3m (2010: £364.2m) reflecting higher net non-recurring charges in the year including the recovery programme to create a stronger business model in First Student. Adjusted basic EPS was 41.2p (2010: 38.9p) representing an increase of 5.9%. EBITDA increased to £778.2m (2010: £763.9m).
First Student
2011 2010
Revenue £1,594.4m £1,605.9m
Operating profit £128.3m £180.9m
ResultsUS Dollar revenue reduced by 2.5% to $2,480.2m or £1,594.4m (2010: $2,544.7m or £1,605.9m). Operating profit was $200.2m or £128.3m (2010: $281.1m or £180.9m) representing a significantly lower operating margin of 8.1% (2010: 11.0%).
The environment for our First Student business remained challenging throughout the year with a particularly disappointing trading performance during the fourth quarter of our financial year, which was exacerbated by severe weather conditions across the US in February. As school boards reduced their overall transportation costs as a result of budgetary constraints, we were not able to flex our costs and achieve sufficient operating efficiencies to offset the pressure on operating margin.
Against the backdrop of significant pricing pressure and a particularly high percentage of contract churn within our business our retention rate fell below 90% during the year. We strengthened our commercial development team ahead of the current bid season and focused on delivering our contract retention strategy in respect of the new school year commencing autumn 2011.
While we anticipate the pressure on margins will continue into 2011/12 we are taking action with the implementation of a business recovery plan that will create a more flexible and robust business.
As part of our clear plan to address First Student we are restructuring the business to create a more agile, sustainable operating model and stabilise the operating margin. This will create a business model better placed to withstand changing economic conditions and will also allow for the full potential of the business to be realised. The streamlined organisation structure will reduce overhead costs and simplify reporting layers to provide greater visibility and accountability. We are also right sizing our fleet with respect to a number of vehicles held for sale or as surplus fleet, addressing underperforming contracts within the portfolio and maximising the contract portfolio value.
We delivered a good operating performance in respect of the start-up of the new school year in September 2010, including commencement of a number of large contracts together with several conversion contracts from the public sector following the decision by their school boards to outsource the provision of school transportation.
First Student acquired Star Shuttle Company, a leading provider of school and charter transportation services in East Orange, New Jersey. First Student began operating the company’s 70 buses under the Star Shuttle name in October.
Tim O’Toole

FirstGroup Annual Report and Accounts 2011 20 FirstGroup Annual Report and Accounts 2011 21
Op
erat
ing
and
fina
ncia
l rev
iew
Chief Executive’s operating review continued
During the year, FOCUS, our industry leading GPS-based technology system, which provides enhanced operational data by linking on-board with back office information and systems, was rolled out to a further 117 locations. By the start of the 2011/12 school year we expect to have installed FOCUS into the vast majority of our US school bus fleet providing the platform for greater efficiencies through enhanced data and processes.
We were pleased to show improved performance in the results of our annual customer survey. We achieved higher scores across all categories demonstrating that our customers recognise and value the strong commitment to excellent service at every level throughout the business.
Strong relationships are the foundation of our business at First Student. This year our customers in the US and Canada told us that we are on the right track with improved scores and increased overall satisfaction in our customer-wide annual survey.
First Student is a fundamentally strong business which, as the market leader, is uniquely placed to leverage its scale. We believe that the business is not currently harnessing its full potential and therefore are implementing actions that will create a more efficient business model with significantly increased operational leverage which, as the market stabilises, will enable us to extend our leadership position and ensure that First Student continues to provide long-term, sustainable growth.
First Transit
2011 2010
Revenue £771.5m £727.8m
Operating profit £57.2m £53.0m
ResultsOur First Transit business has developed in line with our expectations. During the period US Dollar revenue increased by 3.4% to $1,199.0m or £771.5m (2010: $1,160.1m or £727.8m). Operating profit was $89.5m or £57.2m (2010: $84.4m or £53.0m).
First Transit delivered an operating margin of 7.5%. We remain encouraged by the good returns from low or no capital investment and continue to develop opportunities for further growth in this fragmented and diverse market. Our strategy remains to focus on the faster growing paratransit and shuttle bus contracting segments with new contracts won during the year, including a five year contract for paratransit services in Reno, Nevada, with annualised revenues of more than $40m.
We are reducing our exposure to less attractive markets and have taken a charge of £16.6m in relation to a First Support Services contract in Diego Garcia, including a goodwill impairment charge of £5.0m and provision for projected losses of £11.6m until this contract ends in 2017.
The contract to operate campus bus services at Rutgers University was awarded to First Transit in October. The service is the second largest bus system in New Jersey, transporting more than six million passengers annually and is due to start in July.
Despite the current environment of reduced transit authority budgets and subsequent increased competition we were pleased that contract retention was 90%, a good result, albeit slightly lower than in prior years. We were pleased to retain a number of significant contracts including paratransit business in Hartford, Connecticut, San Bernardino and San Diego, California and a long-term university shuttle contract in Atlanta, Georgia. We also retained fixed route contracts in Denver, Colorado and Austin, Texas and commenced a major conversion contract, previously operated in the public sector, on behalf of North County Transit District in San Diego, California.
During the year, First Vehicle Services won significant new business including contracts to start in March and April 2011. Our new contract in Summit County, Colorado is a conversion with fleet maintenance previously performed in-house. Our new contracts with transit authorities in Williamsburg, Virginia and Brownsville, Texas are based on our transit contracting experience and, in particular, on our experience in maintaining vehicles for the authorities. As the market leader, we continue to leverage our reputation and good relationships with our customers in one segment of First Transit’s portfolio to win new business for another.
Our customer survey showed improved results, with significant increases in the key areas of continuous efficiency and cost savings, as we continue to work closely with our customers to deliver a cost effective and high quality service. First Transit’s reputation has undoubtedly enhanced our ability to leverage existing business relationships to win new contracts. During the year, we extended our relationships in Fort McMurray, Alberta, the City of Durham, North Carolina and Jacksonville, Florida to either win new contracts in complementary services or add significant service under our existing contracts.
We are working with our customers across both sides of the Atlantic to deliver initiatives to reduce carbon emissions from transport. We are building on our reputation for innovation and leadership in new technologies. Through our partnerships with the State of Connecticut and with Transport for London (TfL) we are building unique experience as an operator at the cutting edge of new technologies. We also operate and maintain a fleet of state of the art zero emission, battery powered vehicles in southern California.
Greyhound
2011 2010
Revenue £634.6m £603.3m
Operating profit £40.2m £23.9m
ResultsWe continue to make good progress in transforming Greyhound. During the year, passenger revenue, on a like-for-like basis, increased by 0.8% with growth accelerating in the fourth quarter of our financial year. This was particularly encouraging against the ongoing difficult trading backdrop, as high unemployment and a slow economic recovery continued to impact consumer confidence and discretionary spending.
US Dollar revenue increased by 2.2% to $985.0m or £634.6m (2010: $963.4m or £603.3m) and operating profit increased to $62.3m or £40.2m (2010: $39.6m or £23.9m), an increase of 57.3% and 68.2% respectively. The margin improvement represents the progress made by the team at Greyhound to substantially improve the operational leverage in the business. We are encouraged by recent trends in passenger volumes, reflecting increased fuel prices which has led to higher costs for car drivers and airline passengers.
Our Greyhound management team remains focused on rigorous management of the network and cost base. Greyhound’s highly flexible operating model has enabled targeted mileage reductions of 2.5% and ensured that revenue per mile is ahead of last year. In addition, we continue to take action to make the fundamental changes to the business model necessary to achieve further sustainable growth.
As we continue to modernise Greyhound we maintain a measured and highly disciplined approach to capital investment. During the year, we focused our investment on a cost-effective refurbishment programme of our mid life coaches that will significantly enhance the customer experience, improve operational performance and extend the life of the vehicles. We have refurbished over 100 coaches this year and plan to refurbish a further 200 next year. This programme, together with targeted investment in new coaches, is delivering a step change in service quality. By April 2012 over 50% of Greyhound’s fleet will be new or like new.
In the first half of the year we relaunched greyhound.com. The redesigned site has an expanded ‘Print at Home’ ticketing capacity and, together with our discounted online fares strategy, is helping to reduce the cost of sales. Internet sales continue to increase with some 25% of all sales now made through greyhound.com.
As part of our drive to improve our customer service offering we launched a new Greyhound website where passengers can buy tickets, check schedules and keep up to date on the latest deals. Since the launch sales from this channel have increased by 25% compared to prior year.
We continue to progress our Network Transformation Project with over 20% of Greyhound’s properties now ‘right sized’ or ‘right located’ to more accessible and convenient sites. We are upgrading the customer experience at the point of sale at each location, during boarding and onboard. In February we introduced new and enhanced ticket kiosks into the north east market and we are working with 7-Eleven, a major convenience store chain, to establish a ticket selling joint venture. We are also installing WiFi and arrival/departure screens in major terminals to improve our offering and to provide our customers with better, timely information.
Operational performance is also a key focus. We are utilising new technology to enable real time monitoring and enhanced tracking by location and by route to improve On Time Performance. This information has enabled Greyhound to re-evaluate turnaround times at each location and identify the root cause of delays so that action plans can be implemented to address specific issues.
BoltBus continues to grow in the highly competitive markets in the north east of the US with strong increases in both passenger volumes and revenue. Passenger loadings per bus continue to improve and during the fourth quarter we created a new hub in New Jersey providing services between Newark and Baltimore, Washington DC, Boston and Philadelphia.
In December we successfully launched Greyhound Express, a new service combining features of BoltBus with the strength of the Greyhound brand, with non-stop services from Chicago to several cities in the Midwest. In April 2011 we expanded Greyhound Express further with the launch of new services between Boston and New York.
We launched our Greyhound Express service offering faster trips with direct and one-stop service between Greyhound’s Chicago hub and cities such as Milwaukee, Wisconsin and Lafayette, Indiana. The Greyhound Express service features brand new buses with reserved seating, extra legroom and power outlets.
In Canada, we continue to work through our ongoing plans to match service provision to customer demand or receive a subsidy to operate certain routes. We have reached agreement with the government of Manitoba to continue a subsidy for rural bus services until 31 March 2012. In Alberta and British Columbia we continue to work towards a modernised regulatory framework and expect the results to be realised in 2011/12.

FirstGroup Annual Report and Accounts 2011 22 FirstGroup Annual Report and Accounts 2011 23
Op
erat
ing
and
fina
ncia
l rev
iew
Chief Executive’s operating review continued
UK Bus
2011 2010
Revenue £1,137.5m £1,170.6m
Operating profit £148.8m £124.6m
ResultsOur UK Bus division delivered a steady performance this year, despite the challenging economic environment. Total revenue reduced by 2.8% to £1,137.5m (2010: £1,170.6m) as a result of targeted mileage reductions in response to trading conditions. However, we are encouraged that like-for-like passenger revenues increased by 1.4%.
Operating profit increased by 19.4% to £148.8m (2010: £124.6m) due to lower hedged fuel costs, operating efficiencies and the actions we took to manage our network where we saw lower levels of customer demand due to higher unemployment and lower levels of retail activity in many of the towns and cities where we operate.
We have a market leading position with established networks in high density, urban areas which provide opportunities for growth. We are responding to signs of increased economic activity and are focused on achieving the optimum combination of frequency, price and cost discipline.
Giles Fearnley joined the Group as Managing Director, UK Bus in February. His track record of achievement together with considerable experience in the industry will bring a strong focus on delivering improved service quality and growth.
As part of our ongoing commitment to learning and development we created a Passenger Carrying Vehicle driver apprenticeship in collaboration with GoSkills and TfL. Focusing on key elements such as safety and customer service the programme has now received accreditation.
Developing best in class operational standardsWe continue to focus on improving our punctuality and reliability. We continually review our performance and monitor the effects of congestion and other factors and, where necessary, amend our services. This delivers a ‘punctuality dividend’ with customers responding favourably to the improvements, leading to an increase in passenger numbers and a significant reduction in customer complaints. We are encouraged by our operational performance in London and we are better than network average and near the top of the TfL league tables on most measures.
DriveGreen, our industry leading programme, has given our drivers the technology to make adjustments to reduce heavy braking and acceleration in real time. Ever higher driving standards improve our customers’ journey experiences and, as a consequence, complaints across our operating companies are at an all time low. DriveGreen has also helped to deliver a like-for-like fuel consumption improvement of 4.9% across the division.
Our DriveGreen initiative is designed to enhance safety, improve customer comfort and reduce our impact on the environment by using the latest GPS and motion sensing technology. Now installed across our UK Bus fleet DriveGreen has saved 8.7 million litres of fuel since the launch in 2009.
Revenue growth through network developments, simplified fares and marketingWe are focusing on developing our networks through a range of initiatives. For example, in Greater Manchester we consolidated two routes into our high frequency Overground network to increase the number of peak services between Middleton and Manchester with coordinated links now providing a bus every five minutes. We believe that on corridors linking the key towns in the region with Manchester city centre, our investment in quality vehicles and focus on operational performance will deliver passenger growth.
In June we launched ‘Simple Fares’ in Leeds. This city-wide initiative consolidated a complex range of single fares to just four prices to make it easier for customers and potential customers to understand and to remove an obstacle to using our services. The initiative has been backed by a significant marketing campaign and we believe fares simplification will be an important building block for passenger growth, not only in Leeds but across our networks generally.
In Glasgow we launched a ‘Price BUSter’ campaign in January to promote reduced price FirstWeek tickets. In Bristol we reduced the price of our FirstDay tickets in February, which has increased passenger volumes and revenue. At the beginning of April we reduced the price of five of our most popular season tickets across Bristol, Somerset and Avon.
We support the concept of multi-operator tickets in urban areas and in January were pleased to be able to participate in the launch of Fusion, a day ticket offering unlimited travel on buses in the Norwich area.
The university market is an important one and during the year we improved our offer to students in the towns and cities where we operate. For example, in Norwich we launched a new, direct service between the city centre and the University of East Anglia and in Bath we launched dedicated services for the two universities. We also relaunched the Unilink service between the University of Stirling and the city centre with new vehicles to increase capacity. In Sheffield we introduced a 50p student ticket which has helped increase passenger numbers and we continue to promote the successful UniCard for students and staff at the University of Essex.
Effective long-term partnershipsWe continue to be at the forefront of partnerships with local authorities and Passenger Transport Executives (PTEs). We have been working closely with the West of England Partnership to deliver the Greater Bristol Bus Network (GBBN) programme which will improve ten route corridors and benefit some 60 bus routes. We were delighted that the first completed route corridor, between Weston-super-Mare and Bristol, was launched in March. A number of infrastructure improvements will make bus services more
accessible and easier to use. In addition, changes to the road network have reduced off peak journey times. We have supported the GBBN programme with an investment of £20m in new buses, fare promotions and increased marketing. On one of the other route corridors, Bath to Midsomer Norton, we negotiated a Quality Partnership Scheme which sets out service standards including maximum fares and minimum frequencies.
We continue to make progress with the three PTEs in Yorkshire and Greater Manchester on partnership and investment proposals which focus on passenger growth and modal shift. With local authorities facing a range of challenges in the year ahead we believe that closer partnership working will ensure these challenges are met. In West Yorkshire, all operators have formed the West Yorkshire Bus Operators Association to progress partnership plans. A similar arrangement already exists in Greater Manchester which has delivered a number of benefits including a new Code of Conduct launched in October.
In Chester we signed a Voluntary Partnership Agreement with Cheshire West and Chester Council to cover the Blacon area. Our investment in upgraded vehicles has helped deliver strong passenger growth. We are also working with Merseytravel on its upcoming Quality Partnership Scheme.
Active assessment and management of our portfolioIn April 2011 we sold our Kings Lynn network to a local bus operator. This enables us to further develop our flagship interurban service operating across the region. We continue to modernise and right size our facilities through investment in new and redeveloped depots in Aberdeen, Braintree, London, Norwich, Southampton and Wigan and the closure of one of our depots in Bristol.
As part of a £6.4m investment in 22 new buses for the city, six new hybrid double deck buses have been launched in Leeds. The 2.5 million passengers who travel on the key corridor each year will experience an improved, more environmentally friendly journey.
Investing for growthIn March we announced our plans to order £160m of new vehicles over the next two years from UK bus manufacturers. The order for 955 vehicles is one of the largest the British bus industry has ever seen. Our new bus order includes 40 hybrid buses, part funded by the DfT’s Green Bus Fund, as we continue to invest in low carbon vehicles which will significantly lower emissions. In partnership with Bath and North East Somerset Council as part of the EU Civitas project, we launched a hybrid vehicle on Park & Ride services in Bath during the year.
In March we started to introduce hybrid vehicles into Leeds for services operating on the Scott Hall Road guided busway. We worked in partnership with Metro and Leeds City Council a generation ago to pioneer guided busways delivering significant improvements to journey times and reliability on the route. This delivered substantial passenger growth and we believe there are further growth opportunities through strong marketing and investment, supported by funding from Metro, to upgrade passenger facilities on the route.
We are the leading operator of hydrogen fuel cell buses on both sides of the Atlantic. Working in partnership with TfL, we introduced eight new hydrogen-powered buses into service in London this year. First Transit also operates four of the zero emissions buses on behalf of the State of Connecticut.
In January we started operating hydrogen fuel cell buses on route RV1 in London. The vehicles run from a purpose built facility at Lea Interchange Depot. This project is in partnership with TfL. We are the only company in the world operating hydrogen fuel cell buses in both the UK and the US. Our engineering and operations teams are at the forefront of the industry and the institutional expertise we are developing will stand us in good stead for the future.
We are actively examining new technologies to improve our ticketing and fares offerings which will support our plans for growth. We have a wide ranging experience with smartcards, in particular in Scotland and Wales. During the year, First Cymru completed the introduction of new smartcard enabled ticket machines, supported with funding from the Welsh Assembly Government. We are also working with Strathclyde Partnership for Transport on a smartcard, multi-operator ticket for the Greater Glasgow bus network.
Contracts Contracted services continue to complement our passenger revenue business. During the year, we were awarded a number of important contracts by London Buses, part of TfL, including the route between Ilford and Oxford Circus requiring a fleet of 65 vehicles. The tender market in London is however increasingly competitive, particularly in the east with operators seeking to utilise spare capacity at depots in the area. We are increasingly successful in winning contracts from TfL for both Underground and Overground rail replacement services utilising buses that would otherwise be idle outside peak operating hours. We are well advanced in our preparations to deliver our commitments to transport spectators by bus and coach during the London 2012 Olympic Games.
We were delighted to retain the high profile Metroshuttle contract in Manchester during the year. Originally introduced in 2002, Metroshuttle now operates three routes, which together provide passengers with a free bus service to all the main city centre areas. The service was successfully relaunched in November with a new fleet of 20 hybrid vehicles funded by Transport for Greater Manchester, again with support from the DfT’s Green Bus Fund.

FirstGroup Annual Report and Accounts 2011 24 FirstGroup Annual Report and Accounts 2011 25
Op
erat
ing
and
fina
ncia
l rev
iew
Chief Executive’s operating review continued
We launched our new ‘Glasgow Shuttle’ route between Glasgow Airport and the city centre on 1 January 2011. We invested £1.5m in ten new high specification buses with leather seats, on bus screens and WiFi. The route is performing ahead of expectations.
The Comprehensive Spending Review (CSR) and the Competition CommissionThe CSR in October announced significant reductions in grant funding for local authorities and a 20% reduction in Bus Service Operators’ Grant (BSOG) from April 2012. With adequate time to plan and prepare, we expect to manage the impact of the reduction in BSOG through mitigating actions including increased efficiencies. Pressure on local authority budgets, together with the impact of the DfT’s revised guidance on concessionary fares reimbursement, has reduced the funding available in some areas. We continue to progress negotiations with local authorities on reimbursement and have successfully secured agreements for up to three years with some authorities. Funding for tendered services has also reduced in a number of areas and authorities are reviewing the criteria for supporting routes and journeys not operated commercially.
The provisional findings of the Competition Commission’s local bus services market inquiry were published in May 2011. We are pleased that the Competition Commission recognises that the tools exist within the current legislative framework to improve bus services for passengers and therefore its possible remedies do not propose any major policy or regulatory changes. We remain actively engaged in the inquiry and will continue to work with the Competition Commission ahead of its final report later in the year.
Greyhound UK was proud to be selected as the official transport provider for the recent Harlem Globetrotters tour. We provided a Greyhound coach for the team’s whistle stop tour of 12 UK venues in 12 days during March.
UK Rail
2011 2010
Revenue £2,269.8m £2,131.0m
Operating profit £108.7m £88.3m
ResultsRevenue increased by 6.5% to £2,269.8m (2010: £2,131.0m). Passenger revenue, on a like-for-like basis, increased by 5.3% reflecting strong volume growth across all of our Train Operating Companies (TOCs). Operating profit increased by 23.1% to £108.7m (2010: £88.3m), despite a reduction in net subsidy/premium, and was supported by management actions to reduce the addressable cost base and lower hedged fuel costs.
We have decided that we will not take up the option to extend First Great Western for a further three years beyond the initial franchise term to 2013. The Government has announced a new franchising policy and major investment in the region including electrification of the Great Western Main Line and the Intercity Express Programme. We intend to bid for the new Greater Western franchise reflecting the changed environment. We will continue to operate First Great Western until March 2013 and will meet all of our obligations under the Franchise Agreement. We remain committed to delivering further improvements for customers in the region.
As the UK’s largest rail operator we have unrivalled experience of every type of passenger rail operation including intercity long distance, commuter, regional and open access. We also have a strong track record of innovation, investment and of working in partnership to deliver improved services and increased capacity for customers.
We remain focused on retaining our leadership position in UK Rail and will continue to leverage our unrivalled expertise and experience. We were pleased to be shortlisted for the InterCity West Coast franchise and we are in discussion with the DfT on a proposal to extend our First TransPennine Express franchise.
During the first half of the year we completed the sale of GBRf to Eurotunnel for a gross consideration of £31.0m. This disposal is consistent with our strategy to focus on the Group’s core businesses in the UK and North America.
First Great WesternThe reliability of infrastructure, particularly in the Thames Valley area, has had a significant impact on operational performance during the year. As a result the Public Performance Measure (PPM) on a Moving Annual Average (MAA) basis has reduced to 90.3%. We have been working closely with Network Rail (NR) and the new Route Director to address the infrastructure issues and improve performance. Whilst we are pleased to report increased punctuality and reliability trends in February and March there remains more to do.
We are continuing discussions with the DfT about how to increase capacity on our services to address issues of overcrowding, particularly in the London and Thames Valley and Greater Bristol areas. Overall satisfaction remained stable at 82% in the National Passenger Survey Autumn 2010.
We continue to see strong growth on branch lines in Devon and Cornwall as a result of improved services and local marketing campaigns. Our successful ‘Club 55’ promotion, delivered in partnership with other FirstGroup TOCs for the first time this year,
continues to deliver growth with a 22% increase in sales compared to the previous promotion in autumn/winter 2009. We continue to promote internet sales and are pleased with the continued growth, an increase of nearly a third year on year.
In December 2010 we successfully launched a new early morning service from London Paddington to Exeter and Torbay. The new train has been welcomed by local business leaders and stakeholders.
Over Christmas and the New Year, NR successfully completed the first stage of its major improvement programme in and around Reading station. This long-term project will ultimately include the construction of a new track layout and four new platforms at the station, allowing more trains to pass through the area, improve punctuality and provide a bigger and more easily accessible station. During the major engineering works, which significantly affected all First Great Western routes, we demonstrated our expertise in operational management working in partnership with NR to effectively manage longer journey times and bus and rail interchanges at key stations.
We are investing £8m to improve our Turbo Class 16x fleet, which operates in London and the Thames Valley and carries more than 36 million passengers every year. The improvement programme includes a GPS-linked public address and Customer Information System to improve the accuracy and clarity of journey information for customers, as well as upgrading toilets and air conditioning systems.
First Capital Connect recently welcomed 30 new train drivers onto the roster. The arrivals are the first batch of new drivers going through the largest ever driver training programme we have undertaken. The remainder will qualify by the end of the year, increasing the total complement of drivers to over 600.
First Capital ConnectWe are focused on improving operational performance at First Capital Connect. Our driver recruitment and training programme is progressing well and we continue to work closely with NR to address infrastructure issues on the network, which remain challenging. Despite our efforts, the PPM, on a MAA basis, has remained at around 89% throughout the year, partly as a result of significant disruption due to a poor autumn and severe winter weather in November and December. Performance on our Thameslink route has improved significantly year on year.
We invested over £1m in a package of measures to improve information to customers and to staff on the front line, principally through an upgrade to our Customer Information System, issuing BlackBerry devices to our revenue protection and station staff teams and the installation of gateline computers for our station-based revenue protection teams. We also redeveloped our website to focus on real time information to customers.
In December 2010, we introduced our new ‘More Seats for You’ timetable on our Great Northern route to deliver a significant capacity improvement and created over 6,500 extra seats on peak time services connecting Moorgate and King’s Cross.
We continue to work with the DfT, NR and other TOCs to deliver the Thameslink Programme. Scheduled to complete in December 2018, the programme will deliver a service with new, longer trains operating at up to 24 services per hour across London in the morning and evening peaks. During the year ahead, we will see the introduction of the first 12 car services in December 2011, with an additional 2,000 seats on services on the Thameslink route and the completion of major station upgrades at Blackfriars, Farringdon and West Hampstead.
The Government’s Comprehensive Spending Review confirmed £6bn of funding for the Thameslink Programme. This will ease overcrowding on First Capital Connect’s Great Northern and Thameslink routes with 1,200 new carriages. The electrification of First Great Western’s routes to Oxford, Newbury and Bristol and the remodelling of Reading station were also confirmed.
We continue to invest in our First Capital Connect franchise to deliver a range of improvements. In addition to capacity increases on the Great Northern route and better customer information, we also introduced gateline schemes at Finsbury Park, Harpenden and Leagrave stations, completed refresh and reliability improvements on our Class 319 trains and made improvements to stations, including cycle facilities, accessibility works and security.
First ScotRailDespite a record PPM of 95% in August and a strong operational performance over the summer months, First ScotRail’s PPM MAA reduced to 90%. The prolonged impact of severe weather affecting transport networks in Scotland during November and December had a significant impact on our performance and targets.
First ScotRail developed innovative solutions to minimise the impact of severe winter weather conditions on services including fitting special ‘skirts’ to its trains in a bid to remove snow and compacted ice from undercarriages more quickly. Powerful pumps were used to blow hot air under the ‘skirts’ to warm up the underside of trains.
For the second consecutive year First ScotRail was named UK Rail Operator of the Year at the National Transport Awards. This is a great achievement. However we must continue to improve our service quality. We are taking action to address the issues raised, particularly customer information, through the National Passenger Survey Autumn 2010 which contributed to our overall satisfaction score of 86%. We are delivering a significant programme of investment to refresh the interiors of our fleet. Work on the Class 314 fleet is underway and enhancements to our Class 334 and Class 170 trains will begin later in the year.

FirstGroup Annual Report and Accounts 2011 26 FirstGroup Annual Report and Accounts 2011 27
Op
erat
ing
and
fina
ncia
l rev
iew
Chief Executive’s operating review continued
We are also introducing our new fleet of Class 380 electric trains into service with the roll out to continue through 2011. This investment by the Scottish Government will offer more seats and improved comfort to passengers including accessible toilets, air conditioning, CCTV, power sockets and enhanced provision for cycles, luggage and wheelchair users. Our Shields Depot, expanded to accommodate the new trains, opened in February 2011.
The Glasgow-Edinburgh via Airdrie and Bathgate line opened in December 2010. Funded by Transport Scotland and built by NR, the £300m link includes three new stations serving the communities of Armadale, Blackridge and Caldercruix. In addition, Bathgate station was relocated, Drumgelloch station rebuilt and Livingston North and Uphall stations upgraded.
First ScotRail continues to focus on leisure advertising, sales promotion and improved digital and online activity. Our ‘Summer Leisure’ campaign and ‘Kids Go Free’ ticket both performed very well. Our autumn ‘Club 55’ promotion and our offer with Sainsbury’s again proved successful in attracting new passengers to the railways, with combined revenue increasing by over 13% on the equivalent promotions last year.
We successfully completed the trial of smartcard ticketing on the Glasgow-Edinburgh route via Falkirk High. The technology has been proven and we now have more than 500 registered users.
Operational excellence, high customer satisfaction scores and a proven commitment to developing and investing in rail travel in the north of England contributed to First TransPennine Express being named Passenger Train Operator of the Year at the National Rail Awards.
First TransPennine ExpressWe were delighted to win the Passenger Operator of the Year title at the National Rail Awards in September. Since the start of the franchise in February 2004 punctuality and reliability has increased from 85% to over 91%, customer satisfaction has increased from 74% to 87% and passenger numbers have increased by 85% to some 24 million a year. In addition, First TransPennine Express has introduced a £260m fleet of new trains, invested £12m in station improvements and expanded its network with the transfer of routes from Manchester Airport to Scotland. We are in discussions with the DfT to extend the franchise.
First TransPennine Express scored 87% overall satisfaction in the National Passenger Survey Autumn 2010 with improvements in 12 of the 13 station categories. Customers were particularly pleased with both the upkeep and cleanliness of the station environments and the attitude and helpfulness of staff.
There was also a significant improvement in the score for managing delays and disruption to train services. Investment in information technology and providing better quality information to staff on trains and at stations has helped them to provide better information and assistance to customers. First TransPennine Express also launched its mobile website allowing customers to check real time arrival and departure information from their station as they travel.
In February 2011 we achieved Investors in People accreditation with learning and development marked as a particular strength, including the provision of NVQs in Customer Service and other professional qualifications. A recent staff survey highlighted that more than four out of five employees enjoyed their job and more than three-quarters of employees who started with First TransPennine Express in 2004 are still with the business.
First TransPennine Express continues to promote its ‘Great Value Fares’ campaign and at the start of the year launched a January sale with 25% off the price of one million Advance tickets. Last year, we ran a major marketing campaign using TV, press, radio and online media. During the period the TV adverts were being shown visits to www.tpexpress.co.uk increased by 43%. The campaign led to a significant boost in sales of Advance purchase tickets.
First Hull Trains An increasing number of passengers are choosing to use our services and this year we carried over 750,000 passengers, the highest in our ten year history. We were pleased to achieve a score of 93% in the National Passenger Survey Autumn 2010. We completed the refresh programme of our Class 180 fleet and feedback from passengers has been encouraging. We are launching a new timetable in May 2011 offering faster journey times and a more regular service pattern.
Corporate Social Responsibility (CSR)
A strong CSR culture should be important to any business. I believe it drives us to improve performance resulting in better employee engagement, improved customer service and higher business efficiency. CSR is also about ensuring we help tackle some of the wider challenges we face as a society including congestion, resource use and climate change.
We are fully committed to playing our part in meeting these challenges by ensuring that public transport provides an attractive, low emission alternative to other forms of travel. Partnerships will be essential to make this happen. Although we have many good examples of effective partnerships we will be looking to build
and develop these relationships to deliver a better service as we continue to grow and develop our customer base. We will also continue to work with our industry partners to support the development of policy changes at both national and local level that will support these objectives.
In the past four years we have donated £4m to our charity partner, Save the Children, through corporate donations, gifts in kind and fundraising. In North America our staff contributed over $195,000 for our charity partner, The Children’s Miracle Network, this year.
Safety remains our core value and our businesses have continued their relentless delivery of improved safety results. Since 2006 Lost Time Injuries are down by approximately 50%. Nonetheless, during the year, four of our employees were tragically killed as a result of accidents at work. Our thoughts are with their families, friends and colleagues. These terrible tragedies serve to remind us that there is nothing more important than the safety of our staff and our customers. We remain relentless in the pursuit of achieving our goal to eliminate accidents and injuries in the workplace.
In the last two years the economic climate has presented challenges. In parts of the business we have had to adjust local networks to meet passenger demand which we recognise has impacted on some of our customers. However, going forward our focus is on growth. We will continue to develop and improve our services through, for example, improvements to Customer Information Systems and communication and investment in new vehicles and infrastructure. We recently announced a £160m order for over 950 new vehicles for our UK Bus division – a demonstration of this commitment.
In the coming year we will be reinvigorating our vision and values to promote improved employee engagement. We will also align CSR more closely with our business strategy to support the delivery of the highest quality customer service and help drive growth in all of our businesses.
Employee engagement is vital in ensuring the continued improvement and development of the Group. This year we completed our first ever global employee survey and the insights and experiences of our front line staff will help to create real and lasting change and position the Group for the future.
A detailed review of our performance is available in our CSR Report. The full report is available on our website at www.firstgroup.com/corporate/csr/. We also publish a summary of our objectives and how we have performed against our targets.
Outlook
Looking ahead the economic outlook remains uncertain. We are encouraged by improving trends in UK Rail and Greyhound and a continued steady performance in our UK Bus and First Transit operations. We expect that our North American First Student business will continue to see pressure on margins during 2011/12. Across the Group we will continue to focus our efforts on improving our operations to drive further efficiencies to maintain and develop margins.
Building on our strong cash performance this year, we will continue to progress the opportunities to increase cash generation within the Group and we are targeting a net cash inflow of £150m in 2011/12. The Board is committed to its key priorities of increased cash generation to support capital investment, debt reduction and dividend growth of at least 7% per annum.
The Group is well placed with market leading positions in a sector that is a key enabler of economic growth. With diverse operations that are fundamentally robust and a team with a clear focus on creating a stronger business, the Group has good prospects in all of its key markets to continue to deliver long-term value for shareholders.
Tim O’TooleChief Executive11 May 2011

FirstGroup Annual Report and Accounts 2011 28 FirstGroup Annual Report and Accounts 2011 29
Op
erat
ing
and
fina
ncia
l rev
iew
Overview
The Group results were in line with expectations however our business portfolio had a mixed performance. Margins and adjusted operating profits improved in all of the businesses except for First Student. Strong results in the UK, particularly in the Rail division and steady and improving performance in UK Bus, First Transit and Greyhound offset a disappointing performance by First Student which was impacted by unprecedented spending cuts by School Boards and Districts.
The results also contain a number of significant non-recurring items which reflect the decisive actions we have taken to address specific issues and to strengthen the business. In particular we have implemented a recovery programme in First Student to strengthen and right size the business model, streamline the cost base, improve margins and reposition the business for future growth opportunities. In addition we have taken a charge, principally related to accelerated depreciation, for projected losses on the First Great Western franchise following our decision not to exercise our option to extend the franchise for the three years beyond March 2013. We have also taken a charge for a goodwill impairment and future losses relating to the provision of US military base services in Diego Garcia in First Transit.
As expected, the net debt to EBITDA ratio was 2.5 times (2010: 3.0 times) showing good progress from last year. Strong cash generation underpins the Group’s commitment to deliver sustained real growth in the dividend while also reducing leverage. For 2011/12 we are targeting a net cash inflow of £150m.
Further progress was made with debt financing. We implemented a new committed five year $1.25bn bank revolver and a $150m term loan bilateral which replaced two revolver facilities due to expire in February 2012. The average debt duration at 31 March 2011 was 6.1 years, broadly in line with last year. Headroom under committed revolver facilities at 31 March 2011 was £526.7m. Shortly after the year end, the Group issued private placement notes for $150m, with an average duration of six years and a coupon rate of 4.26%. The proceeds were used to reduce bank debt, improve liquidity headroom and further reduce refinancing risk.
ResultsGroup revenue was £6,429.2m (2010: £6,261.9m), an increase of 2.7% and includes £98.0m of favourable foreign exchange movements, representing an increase of 1.1% at constant currencies. Adjusted operating profit was £457.4m (2010: £449.6m). Operating margins are broadly in line with last year reflecting improvements in all of the businesses with the exception of First Student. Statutory operating profit was £309.3m (2010: £364.2m) with the reduction principally due to the higher level of non-recurring items and amortisation charges.
Finance Director’s reviewThe Group continues to improve cash generation and as a result cash generated from operations grew 23% to £744.1m (2010: £604.7m) and the net cash inflow was £209.8m (2010: £136.3m), significantly ahead of target.
Divisional results Year to 31 March 2011 Year to 31 March 2010
Operating Operating Operating Operating Revenue profit1 margin1 Revenue profit1 margin1
£m £m % £m £m %
First Student 1,594.4 128.3 8.0 1,605.9 180.9 11.3First Transit 771.5 57.2 7.4 727.8 53.0 7.3Greyhound 634.6 40.2 6.3 603.3 23.9 4.0UK Bus 1,137.5 148.8 13.1 1,170.6 124.6 10.6UK Rail 2,269.8 108.7 4.8 2,131.0 88.3 4.1Group2 21.4 (25.8) – 23.3 (21.1) –
Total Group 6,429.2 457.4 7.1 6,261.9 449.6 7.2
1 Adjusted2 Tram operations, German Bus, central management and other items
First Student revenue was $2,480.2m or £1,594.4m (2010: $2,544.7m or £1,605.9m), a reduction of 2.5% in US Dollars and a reduction of 0.7% in Sterling terms. Operating profit was $200.2m or £128.3m (2010: $281.1m or £180.9m). The reduction in revenue and operating profit is largely a result of the difficult trading conditions with pressure on School Board budgets. During the year the number of buses in the fleet reduced to approximately 57,000 as a result of competitive bidding and organic losses as we saw an overall contraction in the size of the student bus market. The margin decline was exacerbated by an inability to recover cost inflation through price increases, and flex costs and achieve operating efficiencies in light of the reduction in business. As a result the margin fell to 8.0% from 11.3% last year. We anticipate that the recovery plan which was initiated towards the end of the year will address the structural issues and will lead to an improvement in margin in the medium-term.
First Transit revenue was $1,199.0m or £771.5m (2010: $1,160.1m or £727.8m), an increase of 3.4% and 6.0% in US Dollar and Sterling terms respectively. Operating profit was $89.5m or £57.2m (2010: $84.4m or £53.0m). The revenue improvement was principally in shuttle bus and paratransit operations. The margin has improved to 7.4% (2010: 7.3%) which represents an excellent return given the low levels of capital expenditure required in this business.
Greyhound revenue was $985.0m or £634.6m (2010: $963.4m or £603.3m) and operating profit was $62.3m or £40.2m (2010: $39.6m or £23.9m). Passenger revenues were up 0.8% on last year at constant exchange rates with encouraging growth of 1.6% in the final quarter of the year. The business had an excellent performance on costs with reduced variable wheel costs, including a reduction in fuel costs, and further management actions and Greyhound Canada is making good progress in delivering its profit recovery plan.
UK Bus revenue was £1,137.5m (2010: £1,170.6m), a reduction of 2.8%. Operating profit was £148.8m (2010: £124.6m), an increase of 19.4% principally due to lower fuel costs and further cost efficiencies partly offset by the impact of bad weather in the second half of the year (£4.0m). As a result margin improved to 13.1% from 10.6% last year. Passenger revenues did not recover at the rates we anticipated but like-for-like passenger revenues still grew by 1.4%. We have continued to take advantage of the flexible operating model in UK Bus which we can adjust to match supply with demand and during the year we reduced mileage year on year by 6.4%.
UK Rail revenue was £2,269.8m (2010: £2,131.0m), an increase of 6.5%. Operating profit was £108.7m (2010: £88.3m), an increase of 23.1%. Like-for-like passenger revenue growth across all TOCs was 5.3%. We are still receiving revenue support at the highest
level of 80% for both First Great Western and First Capital Connect. The reduction in the net franchise subsidy/premium position and the impact of bad weather in the second half of the year (£5.2m) were more than offset by higher performance regime receipts, lower fuel costs and further management cost savings in the addressable cost base. During the year we disposed of the non-core GB Railfreight business for gross proceeds of £31.0m and settled several disputes with NR for a total receipt of £30.0m, the largest of which related to the previous Great Western Trains franchise. We also recorded a one-off provision for projected future losses on the First Great Western franchise as explained below.
Net Group costs were £25.8m (2010: £21.1m) with the increase mainly due to a higher share-based payment charge as last year’s charge was lower due to the true-up of certain executive options where the required performance conditions were not expected to be met.
Non-recurring items and amortisation charges
2011 2010 £m £m
UK Rail First Great Western contract provision (59.9) –First Student recovery plan (39.5) –UK Rail claim 22.5 –First Transit goodwill impairment and contract provision (16.6) –UK Rail bid costs (2.7) –UK Rail joint venture provision (1.8) –Competition Commission costs (1.4) (3.8)UK Bus restructuring costs (1.0) (6.8)North American restructuring costs – (15.9)North American integration costs – (15.5)Fuel hedge ineffectiveness – (4.8)UK Rail restructuring costs – (2.5)Other non-recurring items (0.4) (0.3)
Total non-recurring items (100.8) (49.6)Amortisation charges (42.9) (34.7)Loss on disposal of properties (4.4) (1.1)
Operating profit charge (148.1) (85.4)Ineffectiveness on financial derivatives 0.3 1.0
Profit before tax charge (147.8) (84.4)Tax credit 43.0 26.6Profit on disposal of discontinued operations 6.7 –
Non-recurring items for the year (98.1) (57.8)
Jeff Carr

FirstGroup Annual Report and Accounts 2011 30 FirstGroup Annual Report and Accounts 2011 31
Op
erat
ing
and
fina
ncia
l rev
iew
Finance Director’s review continued
UK Rail First Great Western contract provisionDuring the year a charge of £59.9m (2010: £nil) was made in respect of the First Great Western franchise. Previously we had considered that certain changes to this franchise in relation to the option period could be negotiated with the DfT. However as a result of the change in Government and subsequent statements on franchise contractual terms this now appears unlikely to happen. We have decided that the best commercial strategy is to put ourselves in a position to rebid for this franchise under new economic conditions including the electrification and new rolling stock projects for a start date of 1 April 2013. We will therefore not exercise our option to extend this franchise for the three years to March 2016 and it will now end in March 2013. The provision reflects our best estimate of the likely losses on the franchise over the two years to 31 March 2013 which arise largely due to the accelerated write off of assets dedicated to this contract due to the earlier than expected end date. We expect that the overall cash flow of First Great Western will be broadly neutral over the remaining two years of the franchise.
First Student recovery planA charge of £39.5m (2010: £nil) has been made in respect of the First Student business relating to a restructuring and right sizing project which was initiated as a result of the disappointing performance during the year. We anticipate that this will strengthen the business model, streamline the cost base, improve margins in the medium-term and maximise the future growth opportunities. These costs include a provision for surplus fleet, a provision for loss making contracts, redundancy and associated costs.
UK Rail claimAgreement was reached with NR during the year in settlement of several disputes, the largest of which related to a long running claim from the previous Great Western Trains franchise. The Group recognised £22.5m net in relation to this matter as compensation as a result of certain changes to the previously agreed rail network.
First Transit goodwill impairment and contract provision During the year a charge of £16.6m (2010: £nil) was made in relation to a loss making contract related to the provision of US military base services in Diego Garcia. Included within this charge is a goodwill impairment charge of £5.0m and provision for projected losses of £11.6m until this contract ends in 2017.
UK Rail bid costsCosts of £2.7m (2010: £nil) were incurred during the year principally on our bid for the Intercity West Coast franchise.
UK Rail joint venture provisionA provision of £1.8m (2010: £nil) has been made for the investment in DSBFirst due to operational and financial uncertainties with this joint venture which have only recently come to light. Further details are set out in note 33 to the Annual Report.
Competition Commission costsCosts of £1.4m (2010: £3.8m) were incurred on the ongoing Competition Commission investigation into the UK Bus market.
UK Bus restructuring costsRestructuring costs of £1.0m (2010: £6.8m) were incurred during the year and principally represent redundancy and related costs in respect of closing and consolidating certain depots.
Amortisation chargesThe charge for the year was £42.9m (2010: £34.7m) with the increase mainly due to the write off of the remaining balance of the First Great Western franchise intangible asset (£7.6m) as a result of projected losses to the end of this franchise in March 2013.
Loss on disposal of propertiesA loss on disposal of properties of £4.4m (2010: £1.1m) was recorded during the year. Principally due to market conditions there were no significant disposals of properties during the year either in the UK or North America.
Ineffectiveness on financial derivativesDue to the ineffective element and undesignated fair value movements on financial derivatives there was a £0.3m (2010: £1.0m) credit to the consolidated income statement during the year.
TaxThe tax credit as a result of this non-recurring expenditure was £41.3m (2010: £26.6m). In addition there was a one-off deferred tax credit of £1.7m as a result of the reduction in the UK corporation tax rate from 28% to 26%.
Finance costs and investment incomeNet finance costs, before non-recurring items, were £182.4m (2010: £189.9m) with the reduction principally due to lower interest rates.
Profit before taxAdjusted profit before tax was £275.0m (2010: £259.7m) with the increase due principally to higher operating profit and lower net finance costs. An overall charge of £147.8m (2010: £84.4m) for non-recurring items and amortisation charges resulted in statutory profit before tax of £127.2m (2010: £175.3m).
TaxThe tax charge, on adjusted profit before tax, for the year was £60.0m (2010: £57.8m) and results in an effective rate of 21.8% (2010: 22.4%). There was a tax credit of £41.3m (2010: £26.6m) relating to amortisation charges and non-recurring items and a one-off credit adjustment of £1.7m to the UK deferred tax liability as a result of the reduction in the UK corporation tax rate from 28% to 26% which will apply from April 2011. This resulted in a total tax charge of £17.0m (2010: £31.2m) on continuing operations.
The actual tax paid during the year was £25.0m (2010: £1.3m). North American cash tax remains low due to tax losses brought forward and tax depreciation in excess of book depreciation. We expect the North American cash tax rate to remain low for the medium-term. The UK cash tax for the year was higher than last year due to higher UK operating profits, the UK Rail claim receipt and lower capital allowances.
Discontinued operationsA profit on disposal of £6.7m arose on the sale of GB Railfreight representing the gross proceeds of £31.0m less the carrying value of net assets, including goodwill, and transaction costs. This, as well as the operating profit after tax to the date of disposal of £0.2m (2010: £3.0m), has been classified within discontinued operations in the consolidated income statement.
DividendsIn line with our stated commitment the Board has proposed a final dividend per share, subject to approval by shareholders, of 15.0p (2010: 14.0p), an increase of 7%, making a full year payment of 22.12p (2010: 20.65p). It will be paid on 19 August 2011 to shareholders on the register at 15 July 2011. The dividend is covered 1.9 times (2010: 1.9 times) by adjusted basic EPS.
EPSThe adjusted basic EPS was 41.2p (2010: 38.9p), an increase of 5.9%. Basic EPS was 21.4p (2010: 26.9p), a reduction of 20.4%.
Cash flowThe net cash inflow was £209.8m (2010: £136.3m) during the year. This contributed to a net debt reduction of £332.1m (2010: £222.0m) as detailed below:
Year to Year to 31 March 2011 31 March 2010 £m £m
Operational cash flows before working capital 708.8 726.3Working capital 78.4 (45.4)Movement in provisions 0.4 (34.1)Pension payments in excess of income statement charge (43.5) (42.1)
Cash generated by operations 744.1 604.7Capex and acquisitions (261.8) (202.1)Interest and tax (186.7) (150.8)Dividends (113.2) (112.2)Proceeds from sale of business 24.3 0.4Other 3.1 (3.7)
Net cash inflow 209.8 136.3Foreign exchange movements 129.2 90.3Other non-cash movements in relation to financial instruments (6.9) (4.6)
Movement in net debt in year 332.1 222.0
The improvement in net cash flow was primarily due to:
Working capital inflow being £123.8m favourable due to better collections of receivables, extended payment terms with suppliers, non-cash exceptional items (excluding the projected FGW losses for the year to 31/03/13 which are included in provisions) and the timing of certain UK Rail payments to government bodies.
Lower cash settlements of provisions of £34.5m mainly reflecting the FGW provision which was a non-cash item during the year.
Net proceeds of the GB Railfreight disposal of £24.3m.
Partly offset by: Operating cash flows before working capital being £17.5m lower principally due to a higher level of non-recurring charges.
Higher capital expenditure and acquisitions of £59.7m due to additional investment principally in First Student and UK Bus.
Higher tax, interest and dividend payments of £36.9m.
Capital expenditureCash capital expenditure was £258.7m (2010: £201.7m) and comprised First Student £107.7m (2010: £89.1m), First Transit £6.8m (2010: £10.7m), Greyhound £33.8m (2010: £30.0m), UK Bus £64.6m (2010: £32.5m), UK Rail £45.1m (2010: £36.3m) and Group items £0.7m (2010: £3.1m).
Funding and risk managementAt the year end, there was £526.7m of headroom under committed revolving bank facilities. Largely due to seasonality in the North American school bus business, committed headroom typically reduces during the financial year up to October and increases thereafter. Treasury policy requires a minimum of £175m of committed headroom at all times.
The Group’s average debt maturity was 6.1 years (2010: 6.3 years). The Group’s main revolving bank facilities expire in December 2015.
As the Group is a net borrower, cash and bank deposits, which arise principally in the UK Rail companies are minimised. The Group can only withdraw cash and bank deposits from the UK Rail companies on a permanent basis to the lower of retained profits or the amount determined by prescribed liquidity ratios.
The Group does not enter into speculative financial transactions and uses only authorised financial instruments for certain risk management purposes only.
EBITDA EBITDA by division is set out below: Year to 31 March 2011 Year to 31 March 2010
Revenue EBITDA1 EBITDA1 Revenue EBITDA1 EBITDA1
£m £m % £m £m %
First Student 1,594.4 278.1 17.4 1,605.9 324.3 20.2First Transit 771.5 66.3 8.6 727.8 62.1 8.5Greyhound 634.6 68.7 10.8 603.3 52.6 8.7UK Bus 1,137.5 220.5 19.4 1,170.6 200.2 17.1UK Rail 2,269.8 166.1 7.3 2,131.0 141.9 6.7Group 21.4 (21.5) – 23.3 (17.2) –
Total Group 6,429.2 778.2 12.1 6,261.9 763.9 12.2
1 Adjusted operating profit plus depreciation

FirstGroup Annual Report and Accounts 2011 32 FirstGroup Annual Report and Accounts 2011 33
Op
erat
ing
and
fina
ncia
l rev
iew
Finance Director’s review continued
Interest rate riskThe Group reduces exposure by using a combination of fixed rate debt and interest rate derivatives to achieve an overall fixed rate position over the medium-term of between 75% and 100% of net debt. At 31 March 2011 87% (2010: 100%) of net debt was fixed and in excess of 85% of net debt is fixed for the next two years.
Fuel price riskIn the UK, 90% of crude oil costs were hedged at an average rate of $76 per barrel during the year. At the end of the year we have hedged 82% of our ‘at risk’ UK crude requirements for the year to 31 March 2012 (2.6m barrels p.a.) at $88 per barrel and 34% of our requirements for the year to 31 March 2013 at $94 per barrel.
In North America 90% of crude oil costs were hedged at an average rate of $89 per barrel during the year. At the end of the year we have hedged 59% of the ‘at risk’ volume for the year to 31 March 2012 (1.7m barrels p.a.) at $95 per barrel. In addition we have hedged 22% of ‘at risk’ volumes for the year to 31 March 2013 at $92 per barrel.
Foreign currency riskGroup policies on foreign currency risk affecting cash flow, profits and net assets are maintained to minimise exposures to the Group by using a combination of natural hedge positions and derivative instruments where appropriate. Translation risk relating to US Dollar earnings arising in the US is largely offset by US Dollar denominated costs incurred in the UK, principally UK fuel costs, US Dollar interest and tax costs so that exposure to EPS on a year to year basis is not significant.
With regard to balance sheet translation risk, the Group hedges part of its exposure to the impact of exchange rate movements on translation of foreign currency net assets by holding currency swaps and net borrowings in foreign currencies. At 31 March 2011 foreign currency net assets were 62% (2010: 63%) hedged.
Shares in issueAs at 31 March 2011 there were 480.8m shares in issue (2010: 480.2m), excluding treasury shares and own shares held in trust for employees of 1.3m (2010: 1.9m). The weighted average number of shares in issue for the purpose of basic EPS calculations (excluding treasury shares and own shares held in trust for employees) was 480.4m (2010: 480.5m).
Balance sheetNet assets have increased by £40.4m since the start of the year. The principal reasons for this are favourable hedging reserve movements of £149.4m, the retained profit for the year of £117.1m and the retail price index (RPI) to consumer price index (CPI) change on certain defined benefit pension arrangements of £84.9m which were partly offset by unfavourable foreign currency movements of £143.4m, dividend payments of £113.2m and actuarial losses on defined benefit pension schemes of £55.5m.
GoodwillThe goodwill impairment charge of £5.0m during the year relates to the loss making contract in First Transit described above. Goodwill was tested for impairment in all cash generating units (CGUs) and there is more than sufficient headroom in all of the CGUs. It should be noted that the headroom on First Student has reduced to £243m (2010: £630m) reflecting the disappointing results during the year and the length of time that it will take the recovery plan to be fully delivered. The projections for this business assume the incremental benefits of the recovery plan together with a moderate economic recovery. As a result operating profits and margins are projected to recover to historic levels by the end of 2013/14. The First Student margin would need to fall in excess of 1.5% compared to future projections for there to be a goodwill impairment on this business.
Foreign exchangeThe most significant exchange rates to Sterling for the Group are as follows:
Year to Year to 31 March 2011 31 March 2010
Closing Effective Closing Effective rate rate rate rate
US Dollar 1.60 1.56 1.49 1.57Canadian Dollar 1.57 1.56 1.53 1.60
PensionsThe Group has updated its pension assumptions as at 31 March 2011 for the defined benefit schemes in the UK and North America. In addition, during the year the Government announced its intention to change the measure that it uses for cost of living increases to public sector pensions and to change the basis for the statutory revaluation and indexation of occupational pension schemes in the private sector. Increases to pensions in payment and deferred pensions in the Local Government Pension Schemes and the Railways Pension Scheme are expected to be linked to the rise in the CPI in future rather than the rise in the RPI, as are revaluations to deferred pensions in the Group Scheme and the UK Bus Occupational Scheme.
The net pension deficit of £331m at the beginning of the year has decreased to £243m at the end of the year principally due to the change to CPI instead of RPI which has had the impact of reducing pension liabilities at 31 March 2011 by £85m.
The main factors that influence the balance sheet position for pensions and the sensitivities to their movement at 31 March 2011 are set out below:
Movement Impact
Discount rate +0.1% Reduce deficit by £24mInflation +0.1% Increase deficit by £14m
Net debtThe Group’s net debt at 31 March 2011 was £1,949.4m (2010: £2,281.5m) and comprised: 31 March 2011 31 March 2010
Fixed Variable Total Total £m £m £m £m
Sterling bond (2013)1 298.0 – 298.0 297.5Sterling bond (2018)2 325.9 – 325.9 350.7Sterling bond (2019)2 – 273.4 273.4 294.2Sterling bond (2021)3 331.1 – 331.1 341.3Sterling bond (2024)1 199.0 – 199.0 198.9Sterling bank loans – – – 10.5US Dollar bank loans – 506.3 506.3 699.0Canadian Dollar bank loans – 113.1 113.1 156.3Euro and other bank loans – 29.0 29.0 30.2HP contracts and finance leases 163.6 88.3 251.9 227.4Loan notes 8.7 1.0 9.7 10.5Cash – (89.4) (89.4) (76.0)UK Rail ring-fenced cash and deposits – (283.8) (283.8) (234.2)Other ring-fenced cash and deposits – (14.8) (14.8) (24.8)Interest rate swaps 374.0 (374.0) – –
Total 1,700.3 249.1 1,949.4 2,281.5
1 Excludes accrued interest 2 Stated excluding accrued interest, swapped to US Dollars and adjusted for movements on associated derivatives3 Stated excluding accrued interest, partially swapped to US Dollars and adjusted for movements on associated derivatives
Leverage reduction is a key priority. At 31 March 2011 the net debt to EBITDA ratio was 2.5 times (2010: 3.0 times) and it is expected that this ratio will continue to decrease in the year to 31 March 2012.
SeasonalityThe First Student business generates lower revenues and profits in the first half of the year than in the second half of the year as the school summer holidays fall into the first half. Greyhound operating profits are typically higher in the first half of the year due to demand being strongest in the summer months.
Going concernThe Group has established a strong balanced portfolio of businesses with approximately 50% of Group revenues secured under medium-term contracts with government agencies and other large organisations in the UK and North America.
The Group has a diversified funding structure with an average life of 6.1 years at March 2011, and which is largely represented by a medium-term unsecured syndicated committed bank facility and long-term unsecured bond debt. The Group has $1,250m of committed revolving banking facilities of which $845m was undrawn at the year end. This facility expires in December 2015.
The Directors have carried out a detailed review of the Group’s budget for the year to 31 March 2012 and medium-term plans, with due regard for the risks and uncertainties to which the Group is exposed, the uncertain economic climate and the impact that this could have on trading performance.
Based on this review, the Directors believe that the Company and the Group have adequate resources to continue in operational existence for the foreseeable future. Accordingly, the financial statements have been prepared on a going concern basis and details of the going concern review are shown on page 52 of the Directors’ Report.
Jeff CarrFinance Director11 May 2011

FirstGroup Annual Report and Accounts 2011 35
Rep
ort
of
the
Dir
ecto
rs
34 FirstGroup Annual Report and Accounts 2011
Board of Directors
Martin Gilbert LLD MA LLB CA Chairman Chairman of the Nomination Committee3
A Chartered Accountant, he is one of the founders and Chief Executive of Aberdeen Asset Management PLC. He was appointed to the Board of FirstGroup plc in 1995. He is Chairman of Chaucer Holdings PLC and a director of a number of investment trusts. He is a Non-Executive Director of Primary Health Properties PLC and Aberdeen Football Club plc.
Tim O’Toole CBE JD Chief Executive4,5
Appointed to the Board as a Non-Executive Director in May 2009, he was subsequently appointed as Group Chief Operating Officer in June 2010 and as Chief Executive in November 2010. He was, until the end of April 2009, Managing Director, London Underground. He joined Transport for London in 2003 prior to which he was President and Chief Executive of Consolidated Rail Corporation. He is a Non-Executive Director of CSX Corporation, a rail freight transportation company in North America.
Sidney Barrie LLB Commercial Director Company Secretary4,5
Appointed to the Board in August 2005 as Commercial Director and subsequently Company Secretary. He joined the Group from Paull & Williamsons, solicitors in Aberdeen, where he was a senior partner and Head of Corporate acting for a number of listed and private companies. He had a long association with the Group in an advisory capacity going back to the original employee buy-out of GRT Bus Group PLC. In his current role he has responsibility for a range of commercial activities across the Group.
Jeff Carr BEng ACMA Finance Director4,5
Appointed to the Board in September 2009 as Finance Director, he joined the Group from easyJet plc where he was Group Finance Director since 2005. Prior to that he held a number of senior financial roles at Associated British Foods plc, Reckitt Benckiser Group plc, Grand Metropolitan PLC and Unilever plc. He is a Non-Executive Director of McBride plc.
Audrey Baxter DBA LLD DipAcc BANon-Executive Director1,2,3 Chairman of the Remuneration Committee
Appointed to the Board as a Non-Executive Director in August 2006. She is Chairman and Chief Executive of W.A. Baxter & Sons Limited. She has held a number of non-executive positions and was formerly a member of the Scottish Business Forum and the Scottish Economic Council.
Professor David Begg DSc BA Non-Executive Director1,2,3
Appointed to the Board as a Non-Executive Director in August 2005. He is Chief Executive of Transport Times and a Non-Executive Director of BAA Limited. He is also Chairman of the Business Infrastructure Commission and a Director of Portobello Partnership. He is a visiting professor at Plymouth University and an adviser to Greater Manchester Passenger Transport Executive. Until 2005 he was Chairman of the Commission for Integrated Transport and a Non-Executive Director of the Strategic Rail Authority.
Colin Hood BSc MSc FIET Non-Executive Director1,2,3
Appointed to the Board as a Non-Executive Director in May 2009, he is a Director and Chief Operating Officer of Scottish and Southern Energy plc. He is Chairman of Forth Energy, a Director of Scotia Gas Networks Limited and a Non-Executive Director of Southern Water Services Limited.
John Sievwright DHC MA CA Senior Independent Non-Executive Director1,2,3 Chairman of the Audit Committee
Appointed to the Board in May 2002, he was, until 2008, a Senior Vice President and Chief Operating Officer of International for Merrill Lynch & Co. A Chartered Accountant, he has held various senior management positions in banking in London, New York, Dublin and Japan. He is a member of the North American Board of the Michael Smurfit Business School, Dublin and a Non-Executive Director of ICAP plc.
Martyn Williams Non-Executive Employee Director
Appointed to the Board as Employee Director in January 2003, he is currently serving a third term as Employee Director. He is employed as a customer services supervisor in Swansea and has worked for the Group for 33 years.
1 Member of the Audit Committee
2 Member of the Remuneration Committee
3 Member of the Nomination Committee
4 Member of the Executive Safety Committee
5 Member of the Executive Committee

FirstGroup Annual Report and Accounts 2011 37
Rep
ort
of
the
Dir
ecto
rs
36 FirstGroup Annual Report and Accounts 2011
Governance framework Shareholders
Board
Executive Committee Nomination Committee Remuneration Committee Audit Committee
Executive Management Board
Executive Safety Committee Risk Group
Corporate governance
The Company applies all of the main and supporting principles of good governance set out in section 1 of the Combined Code on Corporate Governance issued by the Financial Reporting Council in 2008 (the ‘Code’). The way in which it has applied those principles is set out below. The Company has complied with all of the provisions of section 1 of the Code. The new UK Corporate Governance Code issued by the Financial Reporting Council in June 2010 (the ‘New Code’) applies to the Company for the accounting period commencing on 1 April 2011.
1 The Board and its principal committeesDetails of the Board, its members and its principal committees are set out below.
1.1 The Board(a) Board structure and responsibilitiesThe Board currently consists of the Chairman, three Executive Directors and five Non-Executive Directors. The Board meets at least nine times each year and is responsible for setting and reviewing the Company’s strategy and objectives, reviewing the financial and operational performance of each of the Group’s business units, agreeing and reviewing progress against the Group’s annual budgets and setting and reviewing on a regular basis its longer-term business plans. It also has a schedule of matters specifically reserved to it including approval of the half-year and full-year financial statements, financing arrangements, material capital commitments, business acquisitions and disposals, relationships with regulatory authorities and operating and accounting policies.
During the year, the Board met nine times and all members of the Board attended all meetings whilst they were members.
On 8 June 2010, Nicola Shaw, Director Bus UK, Ireland and Germany resigned as a Director.
On 1 November 2010, Sir Moir Lockhead, Chief Executive, resigned as a Director but remained as an employee of the Group until his retirement on 31 March 2011.
(b) Board balance and independenceThe independence of the Non-Executive Directors has been reviewed against the definition of independence in the Code. Audrey Baxter, David Begg, Colin Hood and John Sievwright are considered to be independent within this definition. As Martyn
Williams is an employee of one of the Group’s subsidiaries, he cannot be considered to be independent. However, the Board feels strongly that it is beneficial for its employees to be represented on the Board in this way so that important employee-related issues can be raised at the highest level and a two-way communication process between the management of the Company and its employees is maintained.
Therefore, the Company complies with the Code provision that at least one half of the Board, excluding the Chairman, is made up of Non-Executive Directors who are considered by the Board to be independent. The Directors are satisfied that the current Board possesses the breadth of business, financial and international experience necessary to manage effectively an organisation of the size and complexity of the Group.
(c) Roles of the Chairman and Chief Executive The ChairmanThe Chairman of the Board is Martin Gilbert. He has a written statement of responsibilities which has been approved by the Board.
The Chairman is responsible for:
leadership of the Board, ensuring its effectiveness on all aspects of its role and setting its agenda, taking into account the issues relevant to the Group and the concerns of all Board members;
ensuring, with the Chief Executive and Company Secretary, the provision of accurate, timely and clear information to the Board;
ensuring effective communication with shareholders and that the Board develops an understanding of the views of major investors;
managing the Board, ensuring that sufficient time is allowed for the discussion of complex or contentious issues;
ensuring a regular evaluation of the performance of the Board as a whole, its Committees and individual Directors;
taking the lead in identifying and meeting the development needs of individual Directors and the Board as a whole, with a view to enhancing the overall effectiveness of the team;
facilitating the effective contribution of Non-Executive Directors and ensuring constructive relations between Executive and Non-Executive Directors;
ensuring, with the Chief Executive and Company Secretary, that new Directors receive a comprehensive induction programme to ensure their early contribution to the Board; and
encouraging active engagement by all members of the Board.
The Board is of the opinion, reinforced by the performance evaluation review referred to below, that Martin Gilbert’s significant and in depth knowledge and experience of the Group’s business, combined with his external business experience, enables him to provide effective leadership of the Board and to continue to make a positive contribution to the Group’s ongoing business.
The Chairman’s other significant business commitments, which remain relatively unchanged from last year, are described in his biography on page 34. The Board performance evaluation process referred to below confirmed that the other Board members are satisfied that Martin Gilbert has the necessary time available to devote to the proper performance of his duties as Chairman.
The Chief ExecutiveThe Chief Executive is Tim O’Toole. He also has a written statement of responsibilities which has been approved by the Board.
The Chief Executive is responsible for:
running the day-to-day business of the Group, within the authorities delegated to him by the Board;
ensuring implementation across the Group of the policies and strategy set by the Board for the Group;
day-to-day management of the executive and senior management team;
leading the development of senior management within the Group with the aim of assisting the training and development of suitable individuals for future Director roles;
ensuring that the Chairman is kept appraised in a timely manner of the issues facing the Group and of any important events and developments; and
leading the development of the Group’s future strategy including identifying and assessing opportunities for the growth of its business and reviewing the performance of its existing businesses.
(d) Senior Independent Non-Executive DirectorJohn Sievwright, who chairs the Audit Committee, is the Senior Independent Non-Executive Director. He is available to shareholders if they have concerns that contact through the normal channels of Chairman, Chief Executive or Finance Director has failed to resolve or for which such contact is inappropriate.
(e) Information and professional development of Board membersThe Board receives detailed papers on the business to be conducted at each meeting well in advance and individual Board members have direct access to senior executives should they wish to receive additional information on any of the items for discussion. The head of each operating division attends Board meetings on a regular basis to ensure that the Board is properly informed about the performance of and current issues facing that division. Management give presentations on current issues facing the business.
All Directors have access to the advice and services of the Company Secretary and, if necessary, can seek independent professional advice at the Company’s expense in the furtherance of their duties. The Company Secretary is responsible for advising the Board on corporate governance matters and for ensuring compliance with Board procedures.
Directors receive induction on appointment to the Board, which is tailored to their individual needs. This includes meetings with senior management and relevant external advisers. In addition, information is provided on their responsibilities and obligations under law, regulation and best practice guidelines. The induction process is supported during the year by the programme of business presentations described above.
The Board also receives updates, as required, on changes to the law and the regulatory regimes affecting the Group.
(f) Performance evaluationDuring the course of the year, the Board undertook an evaluation of its performance. The Chairman led the process, assisted by the Company Secretary. The objectives of this exercise were to ensure that the Board, its Committees and each individual Director continued to act effectively and to fulfil the duties and responsibilities expected of them and to identify any additional training requirements. A tailored questionnaire was developed, which each Director completed. The responses were analysed and discussed at a meeting of the Board. The Senior Independent Non-Executive Director led a process of evaluation of the performance of the Chairman. No significant issues were raised in the course of the evaluation process.
(g) Re-election of DirectorsWhilst the Company was not required to comply with the New Code for the accounting period ended on 31 March 2011, all the Directors are offering themselves for re-election in accordance with the provisions of the New Code at the Annual General Meeting to be held on Friday 15 July 2011.
(h) Appointment of Non-Executive DirectorsNon-Executive Directors are appointed by the Board for an initial term of three years, subject to re-appointment by shareholders. They have letters of appointment which are available on request for inspection.
(i) Directors’ and Officers’ liability insuranceThe Company maintained Directors’ and Officers’ liability insurance cover throughout the year as permitted by the Companies Act 2006. The cover was renewed on 1 April 2011.
2 Committees of the BoardIn addition to the Audit, Remuneration and Nomination Committees, the terms of reference for which are published on the Company’s website and details of which are set out below, the Board has also delegated certain matters to Committees. The principal such Committees are:
2.1 Executive Safety Committee (‘ESC’)The ESC is chaired by the Chief Executive and meets on a monthly basis. It comprises the Executive Directors, other senior managers and safety officers. The ESC reviews the Group’s safety performance and practices, develops safety policies and procedures and follows up on outstanding issues. During the year a number of meetings were attended by independent safety experts and senior representatives of relevant industry bodies, including the Health & Safety Executive.

FirstGroup Annual Report and Accounts 2011 39
Rep
ort
of
the
Dir
ecto
rs
38 FirstGroup Annual Report and Accounts 2011
Corporate governance continued
4.2 Control environmentThe Board is committed to business integrity, high ethical and moral values and professionalism in all its activities, principles with which all managers and employees are required to comply. The Group has a Code of Business Ethics, which is part of the Group’s Corporate Social Responsibility Policy and applies to all of its subsidiary undertakings, a copy of which is available on the Company’s website.
In addition, the Board has established an anti-bribery policy pursuant to the provisions of the Bribery Act 2010, a copy of which is available on the Company’s website. It has also established a Group Hospitality and Gifts Register which records all hospitality or gifts, the value of which exceeds a de minimis amount, given or received by all Board and EMB members. Additional Hospitality and Gift Registers are also maintained at the divisional level ensuring that all senior management in the Group are required to disclose hospitality or gifts given or received.
The Group has a defined divisional organisational structure with lines of authority and delegated responsibility which allows the Board to plan, execute, control and monitor the business in a manner consistent with the Group’s objectives. The day-to-day business management is delegated to the Executive Directors and subsidiary unit managing directors under the overall direction of the Chief Executive. As noted above, the Board reserves to itself a number of specific items, which ensures that it retains control over key business decisions and significant transactions in terms of size, type or risk. A number of the Group’s key functions, including treasury, taxation, insurance, corporate finance, legal, corporate communications and procurement are dealt with centrally. Each of these functions is monitored by an Executive Director.
4.3 MonitoringThe Group adopts a financial reporting and information system which complies with generally accepted accounting practice. The Group Finance Manual, circulated by the Group Finance function to all subsidiaries, details the Group accounting policies and procedures with which subsidiaries must comply. These are also available on the Group’s intranet. Budgets are prepared by subsidiary company management and are subject to review by both Group management and the Executive Directors. Regular forecast updates are completed during the year and compared against actions required. Each subsidiary unit prepares a monthly report of operating performance, with a commentary on variances against budget and prior year. Similar reports are prepared at a Group level. Key performance indicators, both financial and operational, are monitored on a weekly basis. In addition, business units participate in strategic reviews which include consideration of long-term financial projections and the evaluation of business alternatives.
Throughout the year internal audit conduct a comprehensive programme of reviews of internal controls within the operating units. These reviews invariably bring to light a number of minor control weaknesses. These are discussed with management and remedial action plans are agreed. Where appropriate, follow up visits to the operating entity then confirm that the action plans have been completed and that the controls that have been put in place are working effectively. No material losses, contingencies or uncertainties that would require disclosure in the Group’s Annual Report and Accounts have resulted from this process.
The business considered and discussed by the Committee during the year included the reports of the external auditors on the half-year and full-year results, the 2011/12 internal audit plan and budget, papers concerning any regular and special audits and an executive summary of each internal audit report, risk analysis assessments and a review of the implications of changes in accounting standards.
3 Financial reportingThe Directors have a commitment to best practice in the Group’s external financial reporting in order to present a balanced and comprehensible assessment of the Group’s financial position and prospects to its shareholders, employees, customers, suppliers and other third parties. This commitment encompasses all published information including, but not limited to, the year-end and half-yearly financial statements, regulatory news announcements and other public information. A statement of the Directors’ responsibilities for preparing the financial statements may be found on page 53.
4 Internal controlsThe Board has established procedures to provide an ongoing process for identifying, evaluating and managing any significant risks faced by the Group and to meet the requirements of the Code and its related guidance on internal controls. These procedures are subject to regular review.
4.1 ResponsibilityThe Board has overall responsibility for the system of internal control and assessing risk. The responsibility for establishing detailed control and risk management procedures within each subsidiary lies with the Executive Directors and subsidiary unit managing directors. A sound system of internal control is designed to manage rather than eliminate the risk of failure to achieve business objectives and can only provide reasonable and not absolute assurance against material misstatement or loss.
The Board has continued to strengthen the ongoing process for identifying, evaluating and managing the significant risks faced by the Group. As part of this process a Risk Group, comprising senior management representatives from all of the Group’s main businesses as well as from the finance, treasury, legal, insurance and internal audit functions, reviews the significant risks facing the Group. The Risk Group, which is chaired by the Commercial Director, meets at least four times annually and reports to the Board with the express purpose of reviewing the risk and control procedures in each of the business areas and support functions. As an integral part of planning and review, management from each of the business areas and support functions identify the risks facing their operations, as well as the controls in place to mitigate those risks. The probability of risks occurring as well as the likely impact on the Group’s business, should the risks occur, are also assessed and documented. These risks are assessed on a regular basis, taking into account changes in both external and internal circumstances, which may include alterations to regulatory requirements, disruption to information systems, industrial relation issues, control breakdowns, as well as changes in the economic climate and social, ethical and environmental issues. From the reports submitted to it by the Risk Group the Board is able to keep under regular review the major risks and mitigating controls facing the Group.
and other senior managers attended where requested and as appropriate.
The Board considers that each member of the Committee has sufficient and recent financial experience to enable the Committee to discharge its functions effectively.
Under its remit, the Committee keeps under review the effectiveness of the Company’s financial reporting and internal control policies and procedures for the identification, assessment and reporting of risk. It also keeps under review the nature, scope and results of the audits conducted by the internal audit department and the external auditors, the consistency of accounting policies and reporting across the Group and the half-year and full-year financial statements before they are presented to the Board.
The Committee considers the Group’s compliance with the Code and its related guidance and oversees the objectivity and effectiveness of internal audit. The work of the internal audit department is focused on areas of priority as identified by risk analysis and in accordance with an annual audit plan approved by the Committee and the Board. Reports are sent to senior executives of the Group and subsidiary units and there is a follow-up process to ensure that actions to resolve identified control weaknesses are implemented. The Group Director of Internal Audit has the right of direct access to the Chairman of the Audit Committee.
The Committee is responsible for making recommendations to the Board in respect of the appointment or re-appointment of the Group’s external auditors and recommends to the Board the audit fee to be paid to the external auditors. The Board’s decision on these matters is subject to the approval of shareholders. The independence, objectivity and effectiveness of the external auditors have been examined by the Committee and discussions were held regarding their terms of engagement, remuneration and proposal for partner rotation. The appointment of Senior Statutory Auditor is rotated every five years. Deloitte LLP were originally appointed in 1999.
The majority of non-audit work is put out to tender, with the exception of due diligence work on acquisitions or potential acquisitions in both the UK and overseas, where the current auditors’ knowledge of the Company’s business processes and controls means that they are best placed to undertake this work cost-effectively on the Company’s behalf. Details of the audit and non-audit fees, including a breakdown of the non-audit fee, are set out in note 6 to the financial statements. The Committee concluded that the nature and extent of the non-audit fees did not compromise audit independence.
The Committee reviews with management a detailed analysis of the Group’s financial information prior to completion and announcement of the half-year and full-year results and receives a report from the external auditors on the audit process. If necessary, the external auditors also meet separately with the Committee and/or the Chairman, Chief Executive and Finance Director. The Annual Report and Accounts and half-yearly Financial Report go through a detailed verification and due diligence process involving external advisers.
The Committee may request the Executive Directors and any other officers of the Group to attend its meetings but none has the right of attendance. Committee meetings may be requested by the external or internal auditors if they consider it necessary.
2.2 Executive Management Board (‘EMB’)The EMB, which comprises the Executive Directors and certain senior business managers, is chaired by the Chief Executive. It acts as a general operating management committee and meets on a monthly basis to review outstanding issues and to consider the Group’s operational and financial performance.
2.3 Executive CommitteeThe Executive Committee comprises the Executive Directors and meets on an ad hoc basis to consider matters which arise in the ordinary course of the Group’s operations. It is chaired by the Chief Executive and has specific delegated powers within prescribed limits to deal with matters arising in the ordinary course of business which need to be considered before the next scheduled Board meeting.
2.4 Nomination Committee and appointments to the BoardThe Nomination Committee is chaired by Martin Gilbert, the Chairman, and includes Audrey Baxter, David Begg, Colin Hood and John Sievwright. Tim O’Toole attends meetings of the Committee at the invitation of the Chairman of the Committee and Martyn Williams also attends such meetings at the invitation of the Chairman of the Committee to represent the Group’s employees. The Committee meets as required to discuss appointments to the Board of both Executive and Non-Executive Directors. Its recommendations are then put to the full Board for consideration. External search consultants are used to assist the process, where appropriate.
During the year the Committee met twice and all members of the Committee attended each meeting held whilst they were Directors.
The Employee Director is elected by the Employee Directors’ forum, which comprises the Employee Directors and representatives of the Company’s UK subsidiaries, and serves a maximum of three three-year terms.
The Company’s policy is to permit Executive Directors to accept a limited number of outside non-executive directorships, recognising that this is an effective way to broaden their knowledge and expertise. However, no such appointment can be taken up without prior Board approval. The Company’s policy on fees relating to such outside directorships is set out on page 46 of the Directors’ Remuneration Report.
2.5 Remuneration CommitteeThe Remuneration Committee, under the chairmanship of Audrey Baxter, met eight times during the year and all members of the Committee attended all of its meetings held whilst they were Directors except for Audrey Baxter and Colin Hood, who were each absent from one of these meetings. Details of the membership of the Committee are set out in the Directors’ Remuneration Report on pages 44 to 49, together with a statement of the Group’s remuneration strategy and policy. Full details of Directors’ remuneration appear on page 47.
2.6 Audit CommitteeThe Audit Committee is chaired by John Sievwright and includes Audrey Baxter, David Begg and Colin Hood. It met four times during the year and all members attended each meeting except for Tim O’Toole who was absent from one of these meetings whilst he was a member. The Group Director of Internal Audit and the Company’s external auditors attended all of these meetings. Executive Directors

FirstGroup Annual Report and Accounts 2011 41
Rep
ort
of
the
Dir
ecto
rs
40 FirstGroup Annual Report and Accounts 2011
Corporate governance continued
Retention of key management Attracting and keeping key members of senior management is vital in ensuring that the Group continues to have the necessary expertise and continuity to execute its strategy. In order that management have diverse and challenging careers they are given autonomy, within parameters set by the Board, to run their businesses. The Group also offers market based compensation packages consisting of an appropriate mix of long- and short- term incentives.
Customer service and associated contract retentionThe Group’s revenues are at risk if it does not continue to provide the level of service expected by customers. This could result in contracts not being renewed in the case of our North American business and passengers no longer using our services in the UK and North America. To mitigate this risk, relevant staff undertake intensive training programmes to ensure they are aware of and abide by the levels of service that are required by our customers in each business. The Board also monitors in detail a series of customer service KPIs at each meeting to ensure strict targets are being met.
Legislation and regulationOur businesses are subject to numerous laws regulating safety procedures, equipment specifications, employment requirements, environmental procedures, insurance coverage and other operating issues and considerations. These laws and regulations are constantly subject to change. The costs associated with complying with the adoption of new legislation, regulation or other laws and reduced funding available for public transport could adversely impact the results of our operations.
To help mitigate the risk of legislative or regulatory changes the Group regularly lobbies both Government and transport bodies.
Labour costs and employee relationsLabour costs represent the largest component of the Group’s operating costs. Future labour shortages or decreasing unemployment rates could hinder the Group’s ability to recruit and retain qualified employees leading to a higher than expected increase in the cost of recruitment, training and other staff costs.
In addition, it is important for a labour intensive Group that good employee relations are maintained. The Group seeks to mitigate these risks by its recruitment and retention policies, training schemes and working practices.
Fuel costsFuel prices and supply levels can be influenced significantly by international, political and economic circumstances. If fuel supply shortages were to arise because of national strikes, world supply difficulties, disruption of refining capacity or oil imports, the resultant higher fuel prices and disruption to services could adversely impact the Group’s operating results and financial position.
To mitigate the risk of volatile fuel costs the Group regularly enters into forward contracts providing fixed prices. In addition, the Group may limit the impact of unexpected fuel price rises through efficiency and pricing measures.
Treasury risks and insurance costs The Board maintains a comprehensive policy for the management of treasury risks. These include liquidity risks and risks arising from changes to foreign exchange rates, fuel prices and interest rates. This is set out in more detail in note 25 to the financial statements. The policy and delegated authorities are reviewed periodically to ensure compliance with best practice and to control and monitor these risks effectively.
The Group has three main insurable risks: third party claims arising from vehicle and general operations, employee injuries and property damage. The size of the Group’s operations is such that there is a high frequency of low value claims which the Group self-insures up to certain limits, and purchases insurance above these limits from reputable global insurance firms.
Although the Group seeks to mitigate the risk of rising insurance costs through its emphasis on safety, there can be no assurance that future self-insurance and external insurance costs may not adversely impact the Group’s business and results of operations.
4.4 Risks and uncertaintiesThere are a number of key potential risks and uncertainties that without effective management could have an adverse impact on the Group’s performance.
Competitive pressuresAll of the Group’s businesses compete in the areas of pricing and service and face competition from a number of sources.
In UK Bus, the main competitor remains the car. The cost of driving a car is often perceived as being lower than travelling by bus, especially if there is more than one person in the car. To make bus travel an attractive alternative to the car, the Group continues to focus on improvements to the whole bus journey experience, including working with its Local Authority partners to introduce bus priority measures and general infrastructure measures for the benefit of customers. The UK Bus market is deregulated and very competitive with low public subsidies. There are over 500 bus operators in the UK and in all markets in which the Group operates it faces competitive activity. The success of deregulation is demonstrated by high levels of customer satisfaction. Notwithstanding this, there is currently ongoing a Competition Commission Inquiry into the supply of local bus services in the United Kingdom, excluding London and Northern Ireland. The Competition Commission has recently published its preliminary findings and we are currently reviewing these before submitting our response.
The main competitor to the Group’s UK Rail businesses is again the car and, to a lesser extent, long distance coach and budget airlines. To help mitigate the risks posed by these pressures the Group is working with a number of local and national bodies to ensure that the services provided meet, or exceed, the requirements of our stakeholders.
In North America, the Group’s businesses cover a wide geographic spread competing with several large companies as well as a substantial number of smaller, locally owned operators. Our competitors in the yellow school bus business also include school districts which self-operate approximately two thirds of yellow school buses in North America. Similarly, while there is a significant amount of transit and service businesses operated by private entities, including several large companies, our First Transit and First Services businesses also compete with many public authorities who self-operate their service. Our Greyhound coach operations face competition from a number of other coach operators in North America as well as from budget airlines. In North America all of our businesses continue to compete on service, quality and price.
Rail franchise agreementsThe Group is required to comply with certain conditions as part of its rail franchise agreements. If it fails to comply with these conditions it may be liable to penalties including the potential termination of one or more of the rail franchise agreements. This would result in the Group losing the right to continue operating the affected operations and, consequently, the related revenues or cash flows. The Group may also lose some or all of the amounts set aside as security for performance bonds and season ticket bonds.
Compliance with franchise conditions is closely managed and monitored on a monthly basis by senior management and procedures are in place to minimise the risk of non-compliance.
Risk Impact Mitigating control
Competitive pressures Loss of business Focus on stakeholder requirements including service, quality and price
Rail franchise agreements Potential termination of one or more of the rail franchise agreements
Close monitoring and management of all franchise obligations
Legislation and regulation Adverse impact on our ability to operate Regular lobbying of both Government and transport bodies and monitoring of quality procedures
Labour costs and employee relations
Inability to recruit and retain qualified employees
Adoption of appropriate recruitment and retention, training and working practices
Fuel costs Adverse impact on operating results Adoption of forward contracts to buy fuel at fixed costs together with efficiency and pricing measures
Treasury risks and insurance costs
Funding not achieved/adverse impact on operating results
Comprehensive treasury management policies, monitoring and oversight, and Group emphasis on safety
Pensions Material changes to accounting cost and cash requirements
Diversification of investments and regular review of investment positions
Terrorism Reputational damage and the demand for our services
Implementation of security measures and the training of employees
Retention of key management Inability to execute Group strategy Adoption of market based compensation packages
Customer service and associated contract retention
Revenue levels reduce and impact on brand image
Intensive staff training on service requirements and close monitoring of service KPIs
Environmental Financial loss/reputational damage Detailed fuel handling procedures, monitoring of utilities usage, adoption of emission reduction policies and comprehensive Corporate Social Responsibility programmes
Economy Loss of business Organisational structure of businesses and close monitoring of prices, capacity and demand
PensionsThe Group has significant defined benefit pension obligations relating to its UK Bus, Rail and Greyhound businesses. Under the franchise arrangements the UK Rail business is not responsible for any residual deficit at the end of a franchise so there is only short-term cash-flow risk within this business. For both UK Bus and Greyhound the volatility of the underlying investments and liabilities can create material changes in the accounting cost and cash requirements in subsequent years. Through diversification of investments the Group seeks to mitigate these risks, although in extreme market conditions it is not possible to completely negate them.
Terrorism The threat from terrorism remains a concern in the countries in which we operate. We recognise that public transport has been subject to attack previously and it is important we take all reasonable steps to help guard against such activity on any of the services we operate. Taking these steps helps protect our customers and staff, provides reassurance and supports our commitment to safety and security. Our Group Head of Security leads this and coordinates the work needed to respond effectively to this threat. This includes developing and applying good practice and training our employees so that they can respond effectively to any perceived threat or incident.
FirstGroup Annual Report and Accounts 2011 43
Rep
ort
of
the
Dir
ecto
rs
42 FirstGroup Annual Report and Accounts 2011
Corporate governance continued
5 Relations with shareholdersThe Group recognises the importance of regular communication with all of its shareholders. The full Annual Report and Accounts are made available to all shareholders and a Half-yearly Financial Report is published and sent to shareholders at the half-year. These reports are intended to provide shareholders and other interested parties with a clear and balanced understanding of the Group’s operational performance, its financial results and prospects.
All investors are kept informed of key business activities, decisions, appointments, etc. via regulatory news and press releases and the Group’s website. There is also regular dialogue with institutional shareholders throughout the year and general presentations are made by the Chief Executive and Finance Director following the announcement of the half-year and full-year results. Other Directors, including Non-Executive Directors, attend meetings with major shareholders if requested.
Regular reports on investor relations activity and feedback from investors are submitted to the Board and senior management. The Non-Executive Directors have also had informal contact with major shareholders regarding the Group during the year and they expect that informal dialogue to continue.
6 Annual General MeetingAll shareholders have the opportunity to put questions to the Directors at the Company’s Annual General Meeting, at which a report is made on the highlights of the key business developments during the year under review. The Chairmen of the Nomination, Remuneration and Audit Committees attend the Annual General Meeting to answer specific questions from shareholders. All Directors who then held office were present at the 2010 Annual General Meeting.
Notice of the Annual General Meeting is circulated to all shareholders at least 20 working days prior to the meeting. Separate resolutions are proposed at the Annual General Meeting on each substantially separate issue. Proxy votes are counted on all resolutions and, where votes are taken on a show of hands, the proxy results are subsequently announced to the meeting.
(b) UK RailThe Group’s franchised passenger rail operators, First Capital Connect, First ScotRail, First TransPennine Express and First Great Western, are each party to a franchise agreement with Scottish Ministers (in respect of First ScotRail) and with the Secretary of State for Transport (in respect of the other operators). These franchise agreements are subject to termination clauses which may apply on a change of control. These operators and the Group’s non-franchised rail operator, First Hull Trains, each hold railway licences as required by the Railways Act 1993 (as amended); these licences may be revoked on three months’ notice if a change of control occurs without the approval of the Office of Rail Regulation. All of these operators also require and hold track access agreements with Network Rail Infrastructure Limited under which they are permitted to access railway infrastructure. Failure by any of the operators to maintain its railway licence is a potential termination event under the terms of the track access agreements. The Group’s railway operators also lease rolling stock from specialist rolling stock leasing companies such as Eversholt Rail Group, Porterbrook Leasing Company Limited and Angel Trains Limited. A material number of the individual leasing agreements include change of control provisions.
(c) Joint venture agreementsThe Company has joint venture agreements with Keolis (UK) Limited in relation to First TransPennine Express and with DSB in relation to DSB/First Aps and DSB Sverige AB. As is customary, these joint venture agreements include provisions addressing change of control.
(d) London bus contractsThe Group’s UK Bus business operates London bus routes with London Bus Services Limited. These agreements include change of control provisions and are significant when all the routes are considered together.
4.9 AuditorsDeloitte LLP have expressed their willingness to continue in office as auditors and a resolution to re-appoint them will be proposed at the forthcoming Annual General Meeting.
4.7 Treasury operationsThe Board has set a policy for the management of the risks from treasury operations and this is set out in more detail in note 25 to the financial statements. A Group Treasury Policy has been formulated and adopted to ensure compliance with best practice and to control and monitor effectively the risks attendant upon treasury and banking operations.
Currency exchange rate fluctuation and exposureThe Group’s principal operations are in the UK, the US and Canada and are therefore subject to currency fluctuations, both in terms of its trading activities and the translation of its financial statements. The Group currently has a significant natural hedge arising from dollar-denominated earnings in the US businesses offset by dollar- denominated interest costs and fuel costs in its UK businesses.
4.8 Significant agreements – change of control(a) Financing agreementsThe Group has a number of syndicated facilities (including a US $1,250m multi-currency revolving credit and guarantee facility between, amongst others, the Company and The Royal Bank of Scotland plc dated 9 December 2010). The relevant syndicated financing agreements contain provisions entitling the lenders to exercise termination or other rights in the event of a change of control of the Company. Following any change of control of the Company, the majority of the lenders are obliged to negotiate with the Company with a view to resolving any concerns arising from such change of control and, if the matter has not been resolved to the reasonable satisfaction of the majority of the lenders in that time, then, if the majority of the lenders so require, the agent must cancel the total commitments under the facility and require prepayment of all outstanding amounts. The Company’s bilateral financing agreements contain similar provisions and, following a change of control of the Company, the banks shall negotiate with the Company with a view to resolving any concerns arising from such change of control and, if the matter has not been resolved to the reasonable satisfaction of the banks in that time, they may (if they so require) cancel the total commitments under the facilities and require prepayment of all outstanding amounts.
The £300m 6.875% bonds due 2013, the US $150m 4.26% notes due in three instalments of US $50m from 2016 to 2017, the £250m 6.125% bonds due 2019, the £300m 8.125% bonds due 2018, the £350m 8.750% bonds due 2021 and the £200m 6.875% bonds due 2024 issued by the Company may also be affected by a change of control of the Company. A change of control in respect of the £300m 6.875% bonds due 2013 and the £250m 6.125% bonds due 2019 may result in an increase in the interest rate payable on those bonds of 1.5% per annum. However, the interest rate on the bonds will only be so increased if certain further conditions in relation to the credit rating of the bonds are also satisfied. In respect of the £300m 8.125% bonds due 2018, the £350m 8.750% bonds due 2021 and the £200m 6.875% bonds due 2024, upon a change of control of the Company, together with the satisfaction of certain further conditions in relation to the credit rating of the bonds, the bondholders have the option to require the Company to redeem the bonds. In respect of the US $150m 4.26% notes from 2016 to 2017, upon a change of control, the Company must make an offer to noteholders to prepay the notes.
EnvironmentalWe store and manage large quantities of fuel at our maintenance sites, which presents a potential regulatory and financial risk in the event of significant loss or spillage. To mitigate these risks our storage facilities are subject to regular inspection and all fuel handling operations are subject to detailed operating procedures.
We are subject to ongoing changes in environmental regulations. Our operations are covered by the Carbon Reduction Commitment Energy Efficiency Scheme, which came into force in April 2010. Purchasing of carbon allowances has now been delayed to 2012 and current proposals suggest the costs to the Group may be higher than originally anticipated. In response we have put in place a comprehensive data management and reporting package for monitoring the utilities usage covered by the regulations and are developing an energy reduction strategy to deliver greater reductions in energy usage.
Along with all businesses we face the challenge of addressing climate change, both managing its impact and reducing emissions, in line with the targets established in the Climate Change Act. Climate change has the potential to impact on our UK and North American operations, a risk we need to keep under review. We continue to reduce our own emissions and promote passenger growth to ensure we capitalise on the opportunities the need to reduce carbon emissions brings for a business such as ours that offers low carbon solutions to people’s mobility needs.
EconomyAn economic downturn, whether at a global, regional or national level could have a negative impact on the Group’s businesses and the opportunity to grow existing contracts. The level of economic activity affects the number of bus and train journeys taken by passengers in the UK and North America. Many areas of the Group’s business offer a certain degree of protection against economic downturn in specific geographic markets, in particular the North American school bus business and the revenue support and profit sharing arrangements in place in certain rail franchises, the ability of most UK Bus operating companies to modify services on giving 56 days’ notice and the even greater flexibility given to the Greyhound operations, particularly in North America.
4.5 WhistleblowingThe Group has well established procedures whereby employees may, in confidence, raise concerns relating to personal issues, potential fraud, health and safety, harassment, discrimination, security or any other matter. The confidential hotline covers all businesses across the Group and each country in which it operates.
The Group is confident that these ‘whistleblowing’ arrangements are satisfactory and will enable a proportionate and independent investigation of such matters and appropriate follow-up action to be taken.
4.6 Review of effectiveness of financial controlsThe Directors confirm that they have reviewed the effectiveness of the system of internal controls for the year under review and to the date of approval of the Annual Report and Accounts through the monitoring process described above. In addition, the Directors confirm that they have kept under regular review the effectiveness of the Group’s internal audit function.

Rep
ort
of
the
Dir
ecto
rs
FirstGroup Annual Report and Accounts 2011 45FirstGroup Annual Report and Accounts 2011 44
Company’s TSR is below median. These vesting criteria are the same as for that part of the 2008 and 2009 awards which is subject to TSR.
As with the previous awards the foregoing EPS vesting targets for the 2010 award and the level of the award as a factor of salary in relation to the Executive Directors were agreed by the Committee following consultation with the six largest shareholders of the Company.
Awards will lapse at the end of the performance period to the extent that the performance conditions have not been satisfied. There will be no re-testing.
Following testing of the conditions for vesting of the 2008 award at 31 March 2011 the Committee decided that neither the EPS nor the TSR targets had been met and accordingly there has been no vesting of any part of the award. The award has therefore lapsed.
The Committee can set different performance conditions from those described above and may also vary or adjust the performance conditions applying to awards which have been made to take account of events the Committee considers exceptional, including technical events, such as changes in accounting standards and treatment and the take-over of a company in the TSR comparator group, provided that in the opinion of the Committee the amended condition is fair and reasonable and no less challenging than the original condition would have been but for the event.
Generally awards under the LTIP to any participant in any one financial year cannot exceed one and a half times basic salary at the time of the award. However, in exceptional circumstances, this may be increased to up to two times basic salary. Awards under the LTIP are not pensionable.
Share SchemesExecutive Share Option SchemeThe Company operated an Executive Share Option Scheme (‘ESOS’) up to June 2004 for Executive Directors and other senior management. In common with other large companies the Company has not granted any further awards to Executive Directors or senior management under the ESOS after 2004.
Save As You Earn (‘SAYE’) SchemeThe Company operated a SAYE Scheme for eligible employees during the year under review under which options may be granted on an annual basis at a discount of up to 20% of market value. As with the previous scheme the Executive Directors are eligible to participate in the current scheme.
Buy As You Earn (‘BAYE’) SchemeThe Company operates a Share Incentive Plan under the title ‘Buy As You Earn’. The scheme, which is open to all UK employees of the Group, enables employees (including the Executive Directors) to purchase partnership shares from their gross income (before income tax and National Insurance deductions). The Company provides two matching shares for every three partnership shares, subject to a maximum Company contribution of shares to the value of £20 a month. The shares are held in trust for up to five years, in which case, no income tax or National Insurance will be payable. The matching shares will be forfeited if the corresponding partnership shares are removed from trust within three years from award.
Bonus payments comprise a mixture of cash and deferred share awards. The deferral period in respect of that part of any bonus award comprising deferred shares is three years. The same deferral period also applies to senior management within the Group. Share awards will lapse if the relevant individual leaves the Group during the deferral period for any reason other than redundancy, retirement or ill-health. The Committee considers it is appropriate for a proportion of the annual bonus to be taken in the form of deferred shares as this acts as a retention mechanism and also aligns Executives’ longer-term interests with those of the Company’s shareholders.
As the award of any bonus is already dependent on the achievement of stringent targets, the Committee considers that it is not appropriate to attach further performance conditions on vesting of the deferred share element of any bonus other than that the relevant Executive remains employed by the Group and has not tendered his resignation at the end of the deferral period.
The bonus awards for the year were 43.4% of basic salary in the case of the Chief Executive, 43.6% in the case of the Finance Director and 43.6% in the case of the Commercial Director. The Chief Executive has agreed to accept all of his bonus in the form of deferred shares. Each of the Finance Director and Commercial Director will receive 75% of their bonus in cash and the remaining 25% in the form of deferred shares.
A bonus of 43.6% of basic salary was paid to Sir Moir Lockhead, formerly Chief Executive. 75% of his bonus is payable in cash and the remaining 25% is payable in shares which will vest on the date of grant.
Long-Term Incentive Plan (‘LTIP’)The LTIP was established in 2008 and provides for the award to acquire shares, exercisable at the end of a three year performance period subject to the satisfaction of performance conditions and continued employment. 50% of the award is subject to growth in the Company’s earnings per share (‘EPS’) and the remaining 50% of the award is subject to the Company’s total shareholder return (‘TSR’).
Details of the vesting targets for both parts of the 2008 and 2009 awards were set out in previous Directors’ Remuneration Reports.
The part of the 2010 award which is subject to EPS growth will vest in full if EPS at the end of the performance period is not less than 51.7p. If EPS is not less than 47.7p then 25% of that part of the award will vest. That part of the award will vest on a straight-line basis if EPS at the end of the performance period is between 47.7p and 51.7p. There will be no vesting if EPS is less than 47.7p.
In relation to that part of the 2010 award which is subject to TSR, it will vest if the Company’s TSR over the three year performance period falls within the top half of a ranking of the TSR of the companies within a comparator group. The comparator group is made up from a mixture of the 75 largest companies in the FTSE 250 and the companies in the lower quartile of the FTSE 100 (excluding investment trusts) at the commencement of the performance period. If the Company’s TSR falls within the upper quartile of the comparator group that part of the award will vest in full. If it falls at median, only 25% of it will vest. If the Company’s TSR falls between median and the upper quartile, straight-line apportionment will be applied. There will be no vesting if the
Structure of remuneration packages There are currently five main elements to the executive remuneration package:
basic salary and benefits in kind;
annual cash and deferred share bonus (both paid under the Executive Annual Bonus Plan);
long-term incentive plan;
share schemes; and
retirement benefits.
The Committee considers the remuneration package as a whole, balancing each of the individual elements to ensure that, overall, the remuneration received by each Executive Director is competitive but not excessive, contains an appropriate balance between fixed and variable (performance-related) remuneration and that each Executive Director will have sufficient long-term incentive to ensure that his interests are aligned with those of shareholders.
The remuneration of the Executive Directors is made up of the following components:
Basic salary and benefits in kind The basic salary and benefits in kind for each Executive Director are determined by the Committee for each financial year and when an individual changes position or responsibility. In determining appropriate levels, the Committee considers the Group as a whole and also the packages received by similar individuals at the Company’s peers in the public transport sector and other companies of comparable market capitalisation. Details of the salaries and benefits in kind received by each of the Executive Directors in the year are shown on page 47.
As a result of a review of then current and forecast inflation rates the Committee decided that an increase in basic salary of 2.5% should be awarded to the Executive Directors at the time of such review on 1 April 2011. This is the same increase as was awarded to employees generally across the Group.
Executive Annual Bonus Plan (‘EABP’)The Group operates a performance-related bonus plan for its senior management under which payment of bonuses is linked to achievement of budgeted annual Group operating profit targets and other objectives (including safety and customer service targets and personal objectives). Where an Executive Director is also directly responsible for one or more operating division(s), payment of a proportion of the bonus is also linked to the profitability of those divisions.
Each year, the Board sets challenging budget targets for the Group as a whole and for each business unit within the Group. The Committee’s policy had been that bonuses should be payable for Group performance against budget of between 96% and 106%, with the level of bonus payable being heavily skewed towards performance in excess of 100% of budget. 70% of any bonus payable was dependent upon Group financial performance and the balance upon the achievement of safety, customer service and personal objectives. The maximum potential bonus which can be awarded to Executive Directors is 100% of basic salary and 120% of basic salary in the case of the Chief Executive.
This report has been prepared in accordance with the Directors’ Remuneration Report Regulations 2002 (the ‘Regulations’). It also meets the requirements of the Listing Rules of the Financial Services Authority and describes how the Board has applied the main supporting principles of the Combined Code on Corporate Governance issued by the Financial Reporting Council in 2008 (the ‘Code’) relating to Directors’ remuneration. The Company complies with all of the provisions of the Code in respect of the Directors’ Remuneration Report. A resolution to approve this report will be proposed at the Company’s Annual General Meeting to be held on 15 July 2011.
The Regulations require the Company’s auditors to report to the Company’s shareholders on the ‘auditable’ part of the Directors’ Remuneration Report and to state whether in their opinion that part of the report has been properly prepared in accordance with the Companies Act 2006. This report has therefore been divided into separate sections for audited and unaudited information.
Unaudited informationRemuneration CommitteeThe Remuneration Committee is chaired by Audrey Baxter. The other current members of the Committee are David Begg, Colin Hood and John Sievwright. The Board considers each of the members of the Committee to be independent in accordance with the Code. None of the members of the Committee has any personal financial interest (other than as a shareholder) in the matters to be decided, conflict of interest arising from cross-directorships or any involvement in the day-to-day running of the business.
The terms of reference of the Committee were updated and adopted in October 2010 and are available on request and are also published on the Company’s website. These terms of reference will be kept under review to take into account changes to the Code and corporate governance practice and the application of the New Code in respect of the accounting period which commenced on 1 April 2011.
The principal purpose of the Committee is to consider matters related to the remuneration of the Executive Directors and senior management below Board level.
The Committee met eight times during the year and all members attended each meeting held whilst they were Directors except for Audrey Baxter and Colin Hood who were each absent from one of these meetings. The Committee was also advised on the structuring of Directors’ remuneration packages by Towers Watson and MCG Consulting, part of the DLA Piper law group.
Remuneration policyAimThe aim of the Committee is to design remuneration packages for the Company’s Executives which attract, retain and motivate the high calibre individuals necessary to maintain the Group’s position as a leader in the public transportation industry. In implementing its policy, the Committee has given full consideration to the Principles of Good Governance of the Code with regard to Directors’ remuneration.
Directors’ remuneration report

FirstGroup Annual Report and Accounts 2011 47
Rep
ort
of
the
Dir
ecto
rs
46 FirstGroup Annual Report and Accounts 2011
Audited informationMarket price of FirstGroup plc sharesThe market price of FirstGroup plc shares at 31 March 2011 was 326.30p and the range during the year was 323p to 412.6p.
Directors’ remunerationDetails of the Directors’ remuneration for the year ended 31 March 2011 are set out above and on the following pages.
Emoluments and compensationThe total salaries, fees and benefits paid to, or received by, those persons who served as a Director of the Company at any time during the year for the period of such directorship are shown in the table above. These include any and all payments for services as a Director of the Company, its subsidiaries or otherwise in connection with the management of the Group.
Total shareholder returnThe graph below shows, for the last five financial years of the Company, the total shareholder return on a holding of shares in the Company as against that of a hypothetical holding of shares made up of shares of the same kinds and number as those by reference to which the FTSE 100 Index, the FTSE 250 Index and the FTSE All Share Travel and Leisure Index are calculated.
This graph is included to meet the relevant legislative requirements and is not directly relevant to the performance criteria used for the Company’s ESOS or the LTIP. Nonetheless, the indices used were selected as the Company believes that they are the most appropriate and representative indices against which to measure the Company’s performance for this purpose.
Directors’ remuneration report continued
Non-Executive DirectorsAll Non-Executive Directors have a letter of appointment and their fees are determined by the Board based on surveys of fees paid to non-executive directors of comparable companies. These letters of appointment are available for inspection at the Company’s registered office during normal business hours and will be made available at the Annual General Meeting.
Details of the fees paid to Non-Executive Directors are set out on page 47.
Following a review of fees payable to the Non-Executive Directors, including advice from external remuneration consultants, the Board has decided that, in order to reflect the responsibility and time commitment of such Directors and fee levels in other listed companies of similar size and complexity, the fees payable to the Non-Executive Directors should be increased with effect from 1 April 2011 as follows: the base annual fee should be increased to £50,000 (with the Group Employee Director’s fee being increased to £37,500) and the Chairman of the Audit and Remuneration Committees receiving a supplemental fee of £10,000. The Chairman’s fee should be increased to £225,000.
Non-Executive Directors, other than the Group Employee Director, cannot participate in any of the Company’s share schemes and are not eligible to join a Company pension scheme. Each of the Non-Executive Directors (other than Audrey Baxter and Colin Hood who receive all of their fees in the form of shares in the Company) has elected to receive 40% of his fees in the form of shares in the Company in order to ensure that their interests are more closely aligned to those of the Company’s shareholders. The shares are purchased on a monthly basis in the market. The appointment of each of the Non-Executive Directors is subject to early termination without compensation if he/she is not re-appointed at a meeting of shareholders where he/she is up for re-election.
Retention Share AwardOn 25 January 2011 the Company granted a conditional award over 214,826 ordinary shares in the capital of the Company in favour of Tim O’Toole, Chief Executive. The principal purpose of the award was the retention of Tim O’Toole as Chief Executive. The award will vest on 1 November 2013 (three years from the date of his appointment as Chief Executive) provided that he has not ceased to be employed by the Company or given notice of his resignation (other than for certain good leaver reasons). No consideration was paid for the grant of the award which was made after consultation with the six largest shareholders of the Company.
Retirement benefitsExecutive Directors are members of a number of defined benefit Group pension schemes. Their dependants are eligible for dependants’ pensions and the payment of a lump sum in the event of death in service. Further details are set out on page 49.
Shareholding guidelinesFollowing the establishment of the LTIP in 2008, shareholding guidelines for Executive Directors were introduced. These provide for Executive Directors to retain at least 50% of the shares, net of tax, vesting under an LTIP award, or any other vesting of an award under any other executive share plan, or otherwise acquire shares in the Company over a period of five years until a shareholding with a market value (calculated by reference to purchase price) equal to 100% of basic salary is achieved. The Remuneration Committee reserves the right to relax or waive the application of such guidelines in certain circumstances, including the impending retirement of any Executive Director.
Service contractsIt is the Company’s policy to restrict notice periods for Executive Directors to a maximum of 12 months. In line with this policy, all of the Executive Directors have service contracts with an undefined term but which provide for a notice period of 12 months.
The contracts contain a provision, exercisable at the discretion of the Company, to pay an amount in lieu of notice on early termination of the contract. Such payments are limited to basic salary plus certain benefits but would not include entitlement to bonus or share awards. There are no contractual provisions governing payment of compensation on early termination of the contracts. If it becomes necessary to consider early termination of a service contract, the Company will have regard to all the circumstances of the case, including mitigation, when determining any compensation to be paid. Details of the Executive Directors’ contracts are set out below:
Director Date of service contract
Sir Moir Lockhead (resigned 1 November 2010) 5 March 2001Sidney Barrie 31 August 2005Nicola Shaw (resigned 8 June 2010) 13 May 2009Jeff Carr 29 June 2009Tim O’Toole 25 January 2011 Where Board approval is given for an Executive Director to accept an outside non-executive directorship, unless the appointment is in connection with Group business, the individual Director is entitled to retain any fees received.
50
100
150
200
31 March 2006
31 March 2007
31 March 2008
31 March 2010
31 March 2011
31 March 2009
Total shareholder return
FirstGroup plc Total shareholder return
FTSE All Share Travel and Leisure Index Total shareholder return
Source: Datastream
FTSE 100 Index Total shareholder return
FTSE 250 Index Total shareholder return
Cash Benefits Salary bonus in kind1 Fees Total Total 2011 2011 2011 2011 2011 2010 £000 £000 £000 £000 £000 £000
Executive DirectorsSidney Barrie 340 111 11 – 462 341Jeff Carr 436 142 1 – 579 547Sir Moir Lockhead3 364 119 20 – 503 643Nicola Shaw2 88 – 3 – 91 327Tim O’Toole3 564 – 18 9 591 39Non-Executive DirectorsMartin Gilbert – – – 191 191 186Audrey Baxter – – – 53 53 50David Begg – – – 45 45 44Colin Hood – – – 45 45 39John Sievwright – – – 53 53 50Martyn Williams – – – 34 34 33
Total 1,792 372 53 430 2,647 2,299
1 The Executive Directors received the following non-cash benefits in the year: Sidney Barrie: £10,000 car allowance and £897 medical insurance for himself and spouse; Jeff Carr: £1,121 medical insurance for himself; Sir Moir Lockhead: £16,217 company car, £3,450 private fuel and £523 medical insurance for himself and spouse; Nicola Shaw: £3,000 car allowance and £87 medical insurance for herself; and Tim O’Toole: £9,598 car allowance, £137,755 accommodation allowance and £8,500 private medical insurance for himself and spouse.
2 Nicola Shaw, formerly Director Bus, UK, Ireland and Germany, resigned on 8 June 2010. In terms of an agreement with her she was entitled to receive her then annual salary and other benefits payable over a period of six months ended on 31 December 2010 (in total £372,420) plus a compensation payment of £64,819. She also received fees of £4,000 per month in terms of a consultancy agreement with the Group for the six month period ended 31 December 2010, relating to assistance with the Competition Commission enquiry into the provision of local bus services in the UK.
3 Sir Moir Lockhead resigned as a Director on 1 November 2010. Tim O’Toole was appointed as Group Chief Operating Officer on 14 June 2010 and as Chief Executive on 1 November 2010.

FirstGroup Annual Report and Accounts 2011 49
Rep
ort
of
the
Dir
ecto
rs
48 FirstGroup Annual Report and Accounts 2011
Directors’ remuneration report continued
Directors’ share awardsThe outstanding share awards under the ESOS, deferred share bonus under the EABP, LTIP and SAYE Scheme granted to each of the serving Directors are set out in the table below. No price was paid for any share award. There have been no changes to the terms and conditions of any share awards granted to Directors.
At beginning Lapsed/ At end of year or Granted Exercised waived of year date of during during during or date of appointment1 the year the year the year retirement2 Exercise Date from (number of (number of (number of (number of (number of price which ExpiryDirector Scheme shares) shares) shares) shares) shares) (pence) exercisable date
Sidney Barrie Deferred share bonus:3 2006 18,657 – – – 18,657 nil 1.4.11 1.4.16 2007 16,983 – – – 16,983 nil 1.4.12 1.4.17 2008 11,632 – – – 11,632 nil 1.4.11 1.4.18 2009 6,605 – – – 6,605 nil 1.4.12 1.4.19 2010 – 6,893 – – 6,893 nil 1.4.13 1.4.20 LTIP:4 2008 86,445 – – – 86,445 nil 1.4.11 1.4.12 2009 115,652 – – – 115,652 nil 1.4.12 1.4.13 2010 – 121,326 – – 121,326 nil 1.4.13 1.4.14
Jeff Carr Deferred share bonus:3 2010 – 4,916 – – 4,916 nil 1.4.13 1.4.20 LTIP:4 2009 162,486 – – – 162,486 nil 1.4.12 1.4.13 2010 – 170,458 – – 170,458 nil 1.4.13 1.4.14
Sir Moir Lockhead ESOS: 2001 130,985 – – – 130,985 346.5 15.8.04 15.8.11 2002 173,784 – – – 173,784 269 21.6.05 21.6.12 2003 166,958 – – – 166,958 287 18.11.06 18.11.13 2004 193,277 – – – 193,277 275.08 10.6.07 10.6.14 Deferred share bonus:3 2004 34,062 – – – 34,062 nil 1.4.07 1.4.14 2005 36,787 – – – 36,787 nil 1.4.08 1.4.15 2006 61,567 – – – 61,567 nil 1.4.11 1.4.16 2007 37,362 – – – 37,362 nil 1.4.12 1.4.17 2008 24,145 – – – 24,145 nil 1.4.11 1.4.18 2009 14,628 – – – 14,628 nil 1.4.12 1.4.19 LTIP:4 2008 174,033 – – – 174,033 nil 1.4.11 1.4.12 2009 232,833 – – – 232,833 nil 1.4.12 1.4.13 2010 – 244,257 – – 244,257 nil 1.4.13 1.4.14
Nicola Shaw Deferred share bonus: 2006 22,803 – – – 22,803 nil 1.4.11 1.4.16 2007 15,096 – – – 15,096 nil 1.4.12 1.4.17 2008 9,617 – – – 9,617 nil 1.4.11 1.4.18 2009 14,276 – – – 14,276 nil 1.4.12 1.4.19 2010 – 3,773 – – 3,773 nil 1.4.13 1.4.20 LTIP: 2008 72,013 – – – 72,013 nil 1.4.11 1.4.12 2009 110,796 – – – 110,796 nil 1.4.12 1.4.13
Tim O’Toole LTIP:4 2010 – 224,996 – – 224,996 nil 1.4.13 1.4.14 Retention share award: 2011 – 214,826 – – 214,826 nil 1.11.13 N/A
Martyn Williams SAYE: 2006/07 3405 – – 340 – 444 1.2.10 31.7.10 2007/08 263 – – – 263 583 1.2.11 31.7.11 2008/09 414 – – – 414 371 1.2.12 31.7.12 2009/10 468 – – – 468 310 1.2.13 31.7.13 2010/11 – 451 – – 451 319.04 1.2.14 31.7.14
1 Tim O’Toole was appointed as Group Chief Operating Officer on 14 June 2010 and as Chief Executive on 1 November 2010.2 Nicola Shaw resigned as a Director on 8 June 2010. Sir Moir Lockhead resigned as a Director on 1 November 2010.3 The figures shown represent the number of nil-cost options, or conditional share awards in respect of Tim O’Toole, which were granted under the deferred share element of the EABP in
respect of the relevant financial year. The cash values of the 2010/11 awards are: Sidney Barrie: £37,000; Jeff Carr: £47,000; Sir Moir Lockhead: £40,000; and Tim O’Toole: £245,000. These awards will take the form of nil-cost options, or in the case of Tim O’Toole in the form of a conditional award, over shares. They will in the case of Sidney Barrie, Jeff Carr and Tim O’Toole subject to satisfaction of the requirements of the plan vest on 1 April 2014. They will, in the case of Sir Moir Lockhead, vest on the date of grant. The number of shares awarded will depend on the market price of shares at the close of business on 11 May 2011.
4 The figures shown represent the number of nil-cost options which were granted under the LTIP in respect of the relevant financial year.5 Lapsed 1 August 2010.
Retirement benefits Details of the retirement benefits for each of the Directors are set out in the table below:
The Group does not have one pension scheme but instead operates a number of different schemes. All of the schemes in which the Executive Directors participate are defined benefit schemes and are not limited in membership to Executive Directors.
Sidney Barrie, Jeff Carr, Nicola Shaw and Tim O’Toole participated in a final salary arrangement restricted through a scheme earnings cap (based on the previous HMRC definition). To reflect the need to provide a competitive pensions package, a Group SIPP arrangement operates, in which these individuals are allowed to participate. Each individual contributes a minimum of 5% of their basic salary in excess of the scheme earnings cap and the Company contributes 20% on the same basis. This amounted to a Company contribution during the financial year of £43,280 in respect of Sidney Barrie, £62,405 in respect of Jeff Carr, £8,672 in respect of Nicola Shaw and £88,543 in respect of Tim O’Toole.
This report was approved by the Board of Directors, on the recommendation of the Remuneration Committee, on 5 May 2011 and signed on its behalf by:
Audrey Baxter Chairman of the Remuneration Committee
Directors’ Transfer value contributions Increase of increase Increase during the year Accrued in accrued in accrued Transfer Transfer in transfer for relevant pension at Increase pension pension and value at value at value less defined benefit 31 March in accrued (net of cash (net of 31 March 31 March Directors’ scheme1 2011 pension inflation)6 inflation) 2010 2011 contributionsDirector £ £ £ £ £ £ £ £
Sidney Barrie 17,067 17,510 3,090 2,362 52,577 329,333 389,818 43,418Jeff Carr 16,686 4,635 3,090 2,897 39,743 19,646 63,581 27,249Sir Moir Lockhead2 44,904 350,3664 25,1535 10,5805 190,227 7,513,0127 7,676,8247 118,908Nicola Shaw3 3,863 11,147 (801) (1,265) (2,403) 110,656 114,087 (432)Tim O’Toole 8,807 1,854 1,854 1,777 32,622 – 34,038 25,231
1 The above Directors, with the exception of Sir Moir Lockhead, participated in salary sacrifice arrangements during the year. The defined benefit contributions in the table above and the Group SIPP Director contributions referred to below have been paid via salary sacrifice by the Directors with an equivalent contribution being paid directly to the pension schemes by the Company.
2 Sir Moir Lockhead resigned as a Director on 1 November 2010 but remained as an employee of the Group until his retirement on 31 March 2011.3 Nicola Shaw resigned as a Director on 8 June 2010.4 Sir Moir Lockhead also has a cash benefit of £978,680 in the Local Government Pension Scheme.5 Increase in cash is £35,164. Increase in cash net of inflation is (£5,544).6 The inflation assumption is 4.34% using the annual change in CPI as at February 2011.7 Transfer values assume immediate retirement at both dates as Sir Moir Lockhead can retire immediately without reduction.

FirstGroup Annual Report and Accounts 2011 51
Rep
ort
of
the
Dir
ecto
rs
50 FirstGroup Annual Report and Accounts 2011
The Directors have pleasure in submitting their Annual Report and Accounts for the year ended 31 March 2011.
Principal activityThe principal activity of the Group is the provision of passenger transport services.
Review of the businessReviews of the business and principal events and likely future developments are given in the Chairman’s statement, Chief Executive’s operating review and in the Finance Director’s review set out on pages 2 to 33. Our review of the principal risks and uncertainties of the business is set out on pages 40 to 42.
Results and dividendsThe results for the year are set out in the consolidated income statement on page 54. The Directors recommend payment of a final dividend of £72.3m (15.0p per share) which, with the interim dividend of £34.2m (7.12p per share) paid on 2 February 2011, gives a total dividend of £106.5m (22.12p per share) for the year. The proposed final dividend, if approved, will be paid on 19 August 2011 to shareholders on the register at the close of business on 15 July 2011.
Share capitalDetails of issued share capital, together with details of the movements in the Company’s issued share capital during the year, are set out in note 28 to the financial statements. The Company has one class of ordinary shares which carry no right to fixed income. As at 11 May 2011, there were 482,067,170 ordinary shares of 5p each in issue including 268,453 ordinary shares held in treasury.
Shareholders who are present at a general meeting and duly appointed proxies present at a general meeting can vote on a show of hands. They will have one vote each. On a poll, every shareholder present in person or by proxy will have one vote for every share he/she holds. The Notice of the 2011 Annual General Meeting accompanying this document specifies the deadlines for exercising voting rights. All proxy votes are counted and the number for, against and withheld in relation to each resolution are announced at the meeting and published on the Company’s website after the meeting.
There are no specific restrictions on the size of a holding nor on the transfer of shares, which are both governed by the general provisions of the articles of association and prevailing legislation. The Directors are not aware of any agreements between holders of the Company’s shares that may result in restrictions on the transfer of securities or on voting rights.
Details of employee share schemes are set out on page 45 and in note 35 to the financial statements.
Kleinwort Benson (Guernsey) Trustees Limited, as trustee of FirstGroup plc Employee Benefit Trust, holds shares in the Company in trust in order to satisfy awards made to participants in the Company’s LTIP, ESOS and EABP and abstain from voting.
Under the rules of the FirstGroup plc Share Incentive Plan (‘BAYE’), employees buy shares and receive free matching shares in the Company. In order to preserve certain tax benefits these shares are held in a trust by Yorkshire Building Society for employees. Whilst these shares are held in trust, the voting rights attached to them are exercised by the trustee but only at the direction of the employees. The trustee does not vote on the shares if no direction is given to it.
No person has any special rights of control over the Company’s share capital and all issued shares are fully paid.
Authority for the company to purchase its own sharesAt the Annual General Meeting of the Company in 2010 authority was granted for the Company to purchase up to 10% of its ordinary shares. During the year, no ordinary shares were purchased. Under the existing authority, the Company may purchase up to 47,800,000 ordinary shares. This authority remains in place until the 2011 Annual General Meeting, when it is intended to seek a further renewal.
DirectorsThe Directors of the Company who served during the year were Martin Gilbert, Sir Moir Lockhead (resigned 1 November 2010), Tim O’Toole, Sidney Barrie, Jeff Carr, Audrey Baxter, David Begg, Nicola Shaw (resigned 8 June 2010), John Sievwright, Colin Hood and Martyn Williams. Biographical details of all the serving Directors are set out on pages 34 and 35.
With regard to the appointment and replacement of Directors, the Company is governed by its articles of association, the Code (the New Code in respect of the accounting period which commenced on 1 April 2011), the Companies Acts and related legislation. The Company shall be managed by the Directors, who may exercise all powers of the Company which are not required to be exercised by the shareholders of the Company by voting in general meeting.
Senior executives of FirstGroup America and its operating units have been provided with executive employment agreements that provide, in part, some compensation for any termination other than a termination for cause. Severance payments range from one to two years in duration. This is customary practice in the US market.
There are no other agreements between the Company and its Directors or employees providing for compensation for loss of office or employment (whether through resignation, purported redundancy or otherwise) that occurs because of a takeover bid.
Details of the fees and remuneration of the Directors and their service contracts or terms of appointment are set out in the Directors’ Remuneration Report on pages 44 to 49.
Directors’ interestsThe Directors who held office at the end of the year had the following interests in the ordinary shares of the Company – see table opposite.
Details of the Directors’ share awards are set out in the Directors’ Remuneration Report on pages 44 to 49.
Between 1 April 2011 and 11 May 2011, the following changes occurred to Directors’ interests:
Directors’ reportOn 21 April 2011, Martin Gilbert acquired 2,011 shares, David Begg acquired 471 shares, Colin Hood acquired 596 shares, John Sievwright acquired 555 shares, Martyn Williams acquired 205 shares and Audrey Baxter acquired 811 shares under the standing arrangements whereby they have elected to receive 40% (except for Audrey Baxter and Colin Hood who have elected to receive 100%) of their monthly fees in the form of shares in the Company. On the same date Tim O’Toole acquired 147 shares under the standing arrangement whereby he has elected to receive the monthly value of the car allowance payable to him under his service contract with the Company in the form of shares in the Company.
No Director is materially interested in any significant contract or agreement with the Group, other than their service contracts.
Significant interestsAt 11 May 2011, the Company had been notified of the following interests in its shares which represent 3% or more of the voting rights in the Company:
Institution Ordinary 5p shares %
Capital Research Management Company 31,300,000 6.50BlackRock, Inc. 24,812,192 5.15AXA S.A. 24,649,680 5.12Lloyds Banking Group plc 23,464,316 4.87Standard Life Investments Limited 23,409,623 4.86JP Morgan Chase & Co 21,423,964 4.45Artemis Investment Management Limited 20,586,417 4.27Legal & General Group Plc 19,264,804 4.00
EmployeesThe Group is committed to employee involvement and uses a variety of methods to inform, consult and involve its employees in the business. These include subsidiary company newsletters and circulars and also First Edition, a Group-wide newsletter, which is sent to all employees across the Group on a biannual basis. Senior managers within each division meet regularly to discuss current issues and employees are encouraged to discuss any issues with management at any time. Each division also operates a confidential hotline which staff can use to report health and safety, employment-related and other issues concerning them.
The Group also has a regular dialogue with employees and representatives from trades unions. Most operating companies have either an elected Company Council or, more typically, an Employee Director on its board. This principle extends to the plc Board where one of the Employee Directors is elected by his or her peers to represent employees across the Group.
Each division has its own information and consultation arrangements and levels of employee involvement in the business differ. However, in the UK, the Group has worked with trades unions to set up a number of joint schemes, including workplace learning, credit unions, new national policies on assaults, drugs and alcohol, the restructuring of Group pension schemes and a joint committee to review staff uniform procedures.
The Group is committed to wide employee share ownership. During the year, employees continued to have the opportunity to participate in the Group’s Save As You Earn and Buy As You Earn schemes, details of which are set out in note 35 to the financial statements.
The Group is committed to equality of opportunity in all its employment practices, policies and procedures. To this end, within the framework of the law, we are committed wherever practicable to achieving and maintaining a workforce which broadly reflects the local catchment area within which we operate. We aim to ensure that no employee or potential employee will receive less favourable treatment due to their race, colour, nationality, ethnic origin, religion, sex, gender reassignment, sexual orientation, marital status, trade union membership, age or disability.
Corporate social responsibilityThe system of internal controls described on pages 39 to 43 covers significant risks associated with social, environmental and health and safety issues. The Group publishes a separate Corporate Social Responsibility Report covering these matters, which is available on our website at www.firstgroup.com.
Charitable and political contributionsThe Group made various donations to UK charities totalling approximately £260,000 during the year (2010: £64,000). No payments were made for political purposes.
Directors’ interests Ordinary 5p shares
At beginning of year or subsequent appointment At end of year
Non- Non- Beneficial beneficial Beneficial beneficial
Sidney Barrie 20,678 – 20,678 –Audrey Baxter 21,246 – 29,557 –David Begg 16,998 – 21,762 –Jeff Carr 15,000 – 15,000 –Martin Gilbert 138,828 – 159,161 –Colin Hood 5,891 – 12,948 –John Sievwright 40,249 – 45,861 –Tim O’Toole 4,060 – 6,226 –Martyn Williams 6,104 – 8,180 –

FirstGroup Annual Report and Accounts 2011 53
Rep
ort
of
the
Dir
ecto
rs
52 FirstGroup Annual Report and Accounts 2011
Directors’ report continued
While any changes in economic activity will impact UK Bus and Rail passenger numbers the potential risk of this is reduced by the availability of revenue support for certain rail franchises and, in UK Bus, by the ability of the Group to modify services giving 56 days’ notice of such modifications. In North America, the First Student business is highly contracted and, whilst Greyhound is more susceptible to the economy, its costs are largely variable.
The Group has a diversified funding structure which is largely represented by medium-term unsecured syndicated committed bank facilities and long-term unsecured bond debt. The Group has US $1,250m of banking facilities of which US $845m was undrawn at the year end. These facilities expire in December 2015 and the Directors believe that there is every likelihood that they will be replaced by similar financing arrangements.
The Group’s management of exposure to financial risk, including liquidity, currency, interest rate and commodity risks, is disclosed in note 25 to the financial statements.
The Directors have carried out a detailed review of the Group’s 2011/12 budget and medium-term plans, with due regard for the risks and uncertainties to which the Group is exposed (which are set out on pages 40 to 42), the uncertain economic climate and the impact that this could have on trading performance.
Based on this review, the Directors believe that the Company and the Group have adequate resources to continue in operational existence for the foreseeable future. Accordingly, the financial statements have been prepared on a going concern basis.
By order of the Board
Sidney Barrie 395 King StreetCompany Secretary Aberdeen11 May 2011 AB24 5RP
CreditorsIt is the Group’s policy to abide by the payment terms agreed with suppliers wherever it is satisfied that the supplier has provided goods and services in accordance with agreed terms and conditions. A number of significant purchases including fuel, tyres and commitments under hire purchase contracts, finance leases and operating leases are paid by direct debit. At 31 March 2011, the Group had the equivalent of 33 days’ (2010: 31 days’) purchases outstanding, based on the ratio of Group trade creditors at the end of the year to the amounts invoiced during the year by trade creditors. The Company does not have any trade creditors in its balance sheet.
Audit information In the case of each of the persons who are Directors of the Company at the date when this report was approved:
so far as each of the Directors is aware, there is no relevant audit information of which the Company’s auditors are unaware; and
each of the Directors has taken all the steps that he/she ought to have taken as a Director to make himself/herself aware of any relevant audit information (as defined) and to establish that the Company’s auditors are aware of that information.
This confirmation is given and should be interpreted in accordance with section 418 of the Companies Act 2006.
Forward-looking statementsWhere the Directors’ Report contains forward-looking statements these are made by the Directors in good faith based upon the information available at the time of their approval of this report. These statements will not be updated or reported upon further. Consequently, such statements should be treated with caution due to the inherent uncertainties, including both economic and business risk factors, underlying such forward-looking statements or information and nothing in this report should be construed as a profit forecast.
Annual General MeetingThe Annual General Meeting will be held at the Aberdeen Exhibition and Conference Centre, Bridge of Don, Aberdeen, Scotland AB23 8BL on Friday, 15 July 2011 at 11.00 am. The Notice of Annual General Meeting is contained in a separate letter from the Chairman accompanying this report.
Going concernThe Directors have acknowledged the guidance on going concern and financial reporting published by the Financial Reporting Council in October 2009.
Whilst the Group is not wholly immune to macroeconomic developments, it has established a strong balanced portfolio of businesses with approximately 50% of Group revenues secured under medium-term contracts with government agencies and other large organisations in the UK and North America.
Directors’ responsibilities statementThe Directors are responsible for preparing the Annual Report and the financial statements in accordance with applicable law and regulations.
Company law requires the Directors to prepare financial statements for each financial year. Under that law the Directors are required to prepare the Group financial statements in accordance with International Financial Reporting Standards (‘IFRSs’) as adopted by the European Union and Article 4 of the IAS Regulation and have chosen to prepare the parent company financial statements in accordance with United Kingdom Generally Accepted Accounting Practice (United Kingdom Accounting Standards and applicable law). Under company law the Directors must not approve the financial statements unless they are satisfied that they give a true and fair view of the state of affairs of the Company and of the profit or loss of the Company for that period.
In preparing the parent company financial statements, the Directors are required to:
select suitable accounting policies and then apply them consistently;
make judgements and accounting estimates that are reasonable and prudent;
state whether applicable UK Accounting Standards have been followed, subject to any material departures disclosed and explained in the financial statements; and
prepare the financial statements on the going concern basis unless it is inappropriate to presume that the Company will continue in business.
In preparing the Group financial statements, International Accounting Standard 1 requires that Directors:
properly select and apply accounting policies;
present information including accounting policies, in a manner that provides relevant, reliable, comparable and understandable information;
provide additional disclosures when compliance with the specific requirements in IFRSs are insufficient to enable users to understand the impact of particular transactions, other events and conditions on the entity’s financial position and financial performance; and
make an assessment of the Company’s ability to continue as a going concern.
The Directors are responsible for keeping adequate accounting records that are sufficient to show and explain the Company’s transactions and disclose with reasonable accuracy at any time the financial position of the Company and enable them to ensure that the financial statements comply with the Companies Act 2006. They are also responsible for safeguarding the assets of the Company and hence for taking reasonable steps for the prevention and detection of fraud and other irregularities.
The Directors are responsible for the maintenance and integrity of the corporate and financial information included on the Company’s website. Legislation in the United Kingdom governing the preparation and dissemination of financial statements may differ from legislation in other jurisdictions.
Responsibility statement We confirm that to the best of our knowledge:
the financial statements, prepared in accordance with the relevant financial reporting framework, give a true and fair view of the assets, liabilities, financial position and profit or loss of the Company and the undertakings included in the consolidation taken as a whole; and
the management report, which is incorporated into the Directors’ Report, includes a fair review of the development and performance of the business and the position of the Company and the undertakings included in the consolidation taken as a whole, together with a description of the principal risks and uncertainties that they face.
By order of the Board
Tim O’Toole Jeff CarrChief Executive Finance Director11 May 2011 11 May 2011

FirstGroup Annual Report and Accounts 2011 54 FirstGroup Annual Report and Accounts 2011 55
Fina
ncia
l sta
tem
ents
Consolidated statement of comprehensive incomeConsolidated income statement
2010 2011 restated1
£m £m
Profit for the year 117.1 147.1 Other comprehensive income
Derivative hedging instrument movements 193.4 339.2 Deferred tax on derivative hedging instrument movements (44.0) (100.4)Exchange differences on translation of foreign operations (143.9) (13.9)Unrealised losses on executive deferred compensation plans (0.1) (0.5)Actuarial losses on defined benefit pension schemes (55.5) (212.0)RPI to CPI change in defined benefit pension schemes 84.9 –Deferred tax on actuarial losses and RPI to CPI change on defined benefit pension schemes (5.9) 56.7
Other comprehensive income for the year 28.9 69.1
Total comprehensive income for the year 146.0 216.2
Attributable to:Equity holders of the parent 132.6 200.9 Non-controlling interests 13.4 15.3
146.0 216.2
1 Restated for foreign exchange movements on foreign currency denominated defined benefit pension schemes as explained in note 2.
2011 2010 Adjusted Adjusted Total results1 Adjustments2 Total results1 Adjustments2 restated3
Notes £m £m £m £m £m £m
Continuing operationsRevenue 3,4 6,429.2 – 6,429.2 6,261.9 – 6,261.9Operating costs before loss on disposal of properties (5,971.8) (143.7) (6,115.5) (5,812.3) (84.3) (5,896.6)
Operating profit before loss on disposal of properties 457.4 (143.7) 313.7 449.6 (84.3) 365.3
Amortisation charges – (42.9) (42.9) – (34.7) (34.7)Non-recurring items – (100.8) (100.8) – (49.6) (49.6)
– (143.7) (143.7) – (84.3) (84.3)
Loss on disposal of properties – (4.4) (4.4) – (1.1) (1.1)
Operating profit 4,6 457.4 (148.1) 309.3 449.6 (85.4) 364.2 Investment income 8 1.9 – 1.9 1.8 – 1.8 Finance costs 8 (184.3) 0.3 (184.0) (191.7) 1.0 (190.7)
Profit before tax 275.0 (147.8) 127.2 259.7 (84.4) 175.3 Tax 9 (60.0) 43.0 (17.0) (57.8) 26.6 (31.2)
Profit for the year from continuing operations 215.0 (104.8) 110.2 201.9 (57.8) 144.1 Discontinued operationsProfit for the year from discontinued operations 10 0.2 6.7 6.9 3.0 – 3.0
Profit for the year 215.2 (98.1) 117.1 204.9 (57.8) 147.1
Attributable to:Equity holders of the parent 198.0 (94.8) 103.2 189.7 (57.6) 132.1 Non-controlling interests 17.2 (3.3) 13.9 15.2 (0.2) 15.0
215.2 (98.1) 117.1 204.9 (57.8) 147.1
Earnings per share Continuing operationsBasic 11 41.2p (19.8)p 21.4p 38.9p (12.0)p 26.9pDiluted 11 40.8p (19.5)p 21.3p 38.6p (11.9)p 26.7pContinuing and discontinued operationsBasic 11 41.2p (19.7)p 21.5p 39.5p (12.0)p 27.5pDiluted 11 40.9p (19.6)p 21.3p 39.3p (12.0)p 27.3p
Dividends of £101.4m (2010: £93.1m) were paid during the year. Dividends of £72.1m (2010: £67.2m) are proposed for approval in respect of the year.
1 Adjusted trading results before items noted in 2 below.2 Amortisation charges, ineffectiveness on financial derivatives, non-recurring items, loss on disposal of properties and profit on disposal of discontinued operations and tax thereon.3 Restated to exclude discontinued operations as explained in note 2.
Year ended 31 March 2011 Year ended 31 March 2011

FirstGroup Annual Report and Accounts 2011 56 FirstGroup Annual Report and Accounts 2011 57
Fina
ncia
l sta
tem
ents
As at 31 March 2011
Consolidated statement of changes in equity
Trans- Non- Share Share Hedging Other Own lation Retained controlling Total capital premium reserve reserves shares reserve earnings Total interests equity £m £m £m £m £m £m £m £m £m £m
Balance at 1 April 2009 as previously reported 24.1 676.4 (352.8) 4.6 (3.4) 337.4 98.5 784.8 19.5 804.3 Prior year adjustment – – – – – (23.2) 23.2 – – –
Balance at 1 April 2009 as restated 24.1 676.4 (352.8) 4.6 (3.4) 314.2 121.7 784.8 19.5 804.3 Total comprehensive income for the year – – 238.8 – – (14.2) (23.7) 200.9 15.3 216.2 Dividends paid – – – – – – (93.1) (93.1) (19.1) (112.2)Movement in EBT and treasury shares – – – – (3.1) – (0.6) (3.7) – (3.7)Share-based payments – – – – – – 5.5 5.5 – 5.5 Deferred tax on share-based payments – – – – – – 0.4 0.4 – 0.4
Balance at 31 March 2010 as restated 24.1 676.4 (114.0) 4.6 (6.5) 300.0 10.2 894.8 15.7 910.5 Total comprehensive income for the year – – 149.4 – – (143.4) 126.6 132.6 13.4 146.0 Dividends paid – – – – – – (101.4) (101.4) (11.8) (113.2)Movement in EBT and treasury shares – – – – 1.5 – (1.7) (0.2) – (0.2)Share-based payments – – – – – – 7.7 7.7 – 7.7 Deferred tax on share-based payments – – – – – – 0.1 0.1 – 0.1
Balance at 31 March 2011 24.1 676.4 35.4 4.6 (5.0) 156.6 41.5 933.6 17.3 950.9
2010 2009 2011 restated1 restated1
Notes £m £m £m
Non-current assetsGoodwill 13 1,608.0 1,754.9 1,820.0 Other intangible assets 14 348.6 415.9 456.7 Property, plant and equipment 15 2,082.9 2,284.1 2,398.1 Deferred tax assets 26 30.0 30.4 50.2 Retirement benefit assets 36 30.7 3.1 111.5 Derivative financial instruments 25 58.1 33.0 24.8 Investments 3.2 4.8 5.1
4,161.5 4,526.2 4,866.4
Current assetsInventories 17 91.4 92.7 110.0 Trade and other receivables 18 555.5 602.5 610.3 Cash and cash equivalents 21 388.0 335.0 322.5 Assets held for sale 19 4.6 3.9 4.2 Derivative financial instruments 25 65.1 32.1 3.1
1,104.6 1,066.2 1,050.1
Total assets 5,266.1 5,592.4 5,916.5
Current liabilitiesTrade and other payables 20 1,129.9 1,120.0 1,124.7 Tax liabilities 49.0 36.1 47.2 Financial liabilities – bank loans 22 93.5 – 210.7 – bonds 22 73.3 73.3 36.0 – obligations under HP contracts and finance leases 23 42.8 34.6 34.3 – loan notes 24 – 0.8 –Derivative financial instruments 25 38.5 85.2 304.5
1,427.0 1,350.0 1,757.4
Net current liabilities 322.4 283.8 707.3
Non-current liabilitiesFinancial liabilities – bank loans 22 554.9 896.0 1,408.1 – bonds 22 1,417.1 1,414.1 870.2 – obligations under HP contracts and finance leases 23 209.1 192.8 194.6 – loan notes 24 9.7 9.7 10.5 Derivative financial instruments 25 29.7 121.1 243.6 Retirement benefit liabilities 36 273.9 333.9 280.2 Deferred tax liabilities 26 93.0 63.9 20.6 Provisions 27 300.8 300.4 327.0
2,888.2 3,331.9 3,354.8
Total liabilities 4,315.2 4,681.9 5,112.2
Net assets 950.9 910.5 804.3
EquityShare capital 28 24.1 24.1 24.1 Share premium 29 676.4 676.4 676.4 Hedging reserve 29 35.4 (114.0) (352.8)Other reserves 29 4.6 4.6 4.6 Own shares (5.0) (6.5) (3.4)Translation reserve 30 156.6 300.0 314.2 Retained earnings 41.5 10.2 121.7
Equity attributable to equity holders of the parent 933.6 894.8 784.8 Non-controlling interests 17.3 15.7 19.5
Total equity 950.9 910.5 804.3
1 Restated for foreign exchange movements on foreign currency denominated defined benefit pension schemes as explained in note 2.
Tim O’Toole Jeff Carr
Consolidated balance sheet

FirstGroup Annual Report and Accounts 2011 58 FirstGroup Annual Report and Accounts 2011 59
Fina
ncia
l sta
tem
ents
Year ended 31 March 2011
Notes to the consolidated financial statements
1 General informationFirstGroup plc is a company incorporated in the United Kingdom under the Companies Act 2006. The address of the registered office is 395 King Street, Aberdeen AB24 5RP. The nature of the Group’s operations and its principal activities are set out in the Chief Executive’s operating review on pages 18 to 27.
These financial statements are presented in pounds Sterling because that is the currency of the primary economic environment in which the Group operates. Foreign operations are included in accordance with the accounting policies set out in note 2.
The parent Company financial statements and notes thereto are shown separately under UK GAAP on pages 107 to 114.
2 Significant accounting policiesBasis of accountingThe financial statements have been prepared in accordance with the recognition and measurement criteria of IFRSs adopted for use in the European Union and therefore comply with Article 4 of the EU IAS Regulation.
The financial statements have been prepared on the historical cost basis, except for the revaluation of certain financial instruments, and on a going concern basis as described in the going concern statement in the Directors’ Report on page 52. The principal accounting policies adopted are set out below.
The figures for the year to 31 March 2011 include the results of the rail businesses for the year to 31 March 2011 and the results of all the other businesses for the 52 weeks ended 26 March 2011.
Restatement of prior years numbersThe income statement and segmental amounts for the year to 31 March 2010 have been restated to show the results of GB Railfreight, which was sold during the year, within discontinued operations. The results of discontinued operations are set out in note 10.
Amounts presented in the consolidated statement of comprehensive income, consolidated balance sheet and consolidated statement of changes in equity for the year to 31 March 2010 and the consolidated balance sheet as at 31 March 2009 have been restated to correctly reclassify foreign exchange movements on foreign currency denominated defined benefit pension schemes from retained earnings to the translation reserve.
The impact was as follows: Consolidated Consolidated statement balance sheet of comprehensive income Year to 31 March 31 March 31 March 2010 2009 2010 £m £m £m
Retained earnings/actuarial losses on defined benefit pension schemesAs previously reported (8.4) 98.5 (204.3)Prior year adjustment 23.2 0.1 –Movement for the financial year (4.6) 23.1 (7.7)
As restated 10.2 121.7 (212.0)
Translation reserve/exchange differences on translation of foreign operationsAs previously reported 318.6 337.4 (18.5)Prior year adjustment (23.2) (0.1) –Movement for the financial year 4.6 (23.1) 4.6
As restated 300.0 314.2 (13.9)
Deferred tax on actuarial losses on defined benefit pension schemesAs previously reported 53.6Movement for the financial year 3.1
As restated 56.7
2011 2010 Note £m £m
Net cash from operating activities 32 555.7 452.3
Investing activitiesInterest received 1.7 1.6 Proceeds from disposal of property, plant and equipment 21.8 35.6 Purchases of property, plant and equipment (210.3) (205.6)Disposal of subsidiary 24.3 0.4 Acquisition of businesses (3.1) (0.1)
Net cash used in investing activities (165.6) (168.1)
Financing activitiesShares purchased by EBT – (6.1)Monies received on exercise of share options 3.1 2.4 Dividends paid (101.4) (93.1)Dividends paid to non-controlling shareholders (11.8) (19.1)Proceeds from bond issues – 550.0 Proceeds from bank facilities 124.1 40.5 Repayment of bank debt (307.7) (707.4)Repayments under HP contracts and finance leases (35.9) (30.0)Repayment of loan notes (0.8) –Fees for bank facility amendments and bond issues (6.3) (5.0)
Net cash flow from financing activities (336.7) (267.8)
Net increase in cash and cash equivalents before foreign exchange movements 53.4 16.4 Cash and cash equivalents at beginning of year 335.0 322.5 Foreign exchange movements (0.4) (3.9)
Cash and cash equivalents at end of year per consolidated balance sheet 388.0 335.0
Cash and cash equivalents are all included within current assets on the consolidated balance sheet.
Note to the consolidated cash flow statement – reconciliation of net cash flow to movement in net debt
2011 2010 £m £m
Net increase in cash and cash equivalents in year 53.4 16.4 Decrease in debt and finance leases 220.3 146.9 Inception of new HP contracts and finance leases (70.2) (32.0)Fees capitalised against bank facilities and bond issues 6.3 5.0
Net cash flow 209.8 136.3 Foreign exchange movements 129.2 90.3 Other non-cash movements in relation to financial instruments (6.9) (4.6)
Movement in net debt in year 332.1 222.0 Net debt at beginning of year (2,281.5) (2,503.5)
Net debt at end of year (1,949.4) (2,281.5)
Net debt includes the value of derivatives in connection with the bonds maturing in 2018, 2019 and 2021 and excludes all accrued interest. These bonds are included in non-current liabilities in the consolidated balance sheet.
Consolidated cash flow statement

FirstGroup Annual Report and Accounts 2011 60 FirstGroup Annual Report and Accounts 2011 61
Fina
ncia
l sta
tem
ents
Notes to the consolidated financial statements continued
2 Significant accounting policies continuedBasis of consolidationThe consolidated financial statements incorporate the financial statements of the Company and entities controlled by the Company (its subsidiaries). Control is achieved where the Company has the power to govern the financial and operating policies of an investee entity so as to obtain benefits from its activities.
Non-controlling interest in the net assets of the consolidated subsidiaries are identified separately from the Group’s equity interest therein. Non-controlling interest consist of those interests at the date of the original business combination and the non-controlling interests share of the changes in equity since the date of the combination. Losses applicable to the non-controlling interest in excess of the non-controlling interest in the subsidiary’s equity are allocated against the interests of the Group except to the extent that the non-controlling interest has a binding obligation, and is able to make an additional investment, to cover the losses.
The results of subsidiaries acquired or disposed of during the year are included in the consolidated income statement from the effective date of acquisition or up to the effective date of disposal, as appropriate.
Where necessary, adjustments are made to the financial statements of subsidiaries to bring the accounting policies used into line with those used by the Group.
All intra-group transactions, balances, income and expenses are eliminated on consolidation.
Business combinationsThe acquisition of subsidiaries is accounted for using the purchase method. The cost of the acquisition is measured at the aggregate of the fair values, at the date of exchange, of assets given, liabilities incurred or assumed, and equity instruments issued by the Group in exchange for control of the acquiree, plus any costs directly attributable to the business combination. The acquiree’s identifiable assets, liabilities and contingent liabilities that meet the conditions for recognition under IFRS 3 Business combinations are recognised at their fair value at the acquisition date, except for non-current assets (or disposal groups) that are classified as held for sale in accordance with IFRS 5 Non-Current Assets Held for Sale and Discontinued Operations, which are recognised and measured at fair value less costs to sell.
Goodwill arising on acquisitions is recognised as an asset and initially measured at cost, being the excess of the cost of the business combination over the Group’s interest in the fair value of the identifiable assets, liabilities and contingent liabilities recognised. If, after reassessment, the Group’s interest in the net fair value of the acquiree’s identifiable assets, liabilities and contingent liabilities exceeds the cost of the business combination, the excess is recognised immediately in the income statement.
The interest of non-controlling shareholders in the acquiree is initially measured at the non-controlling shareholder’s proportion of the net fair value of the assets, liabilities and contingent liabilities recognised.
Investments in associatesAn associate is an entity over which the Group has significant influence and that is neither a subsidiary nor an interest in a joint venture. Significant influence is the power to participate in the financial and operating policy decisions of the investee but is not control or joint control over those policies. As a general rule, significant influence will be presumed to exist when the Group holds, directly or indirectly through subsidiaries, 20% or more of the voting power, of the investee. However, where it is clear that the Group, although holding 20% or more of the voting power does not have significant influence, the investment is not accounted for as an associate. The Group has a 30% holding in DSBFirst but does not have significant influence and therefore the holding is treated as an investment.
The results and assets and liabilities of associates are incorporated in these financial statements using the equity method of accounting, except when the investment is classified as held for sale, in which case it is accounted for in accordance with IFRS 5 Non-current Assets Held for Sale and Discontinued Operations.
Under the equity method, investments in associates are carried in the consolidated balance sheet at cost as adjusted for post-acquisition changes in the Group’s share of the net assets of the associate, less any impairment in the value of individual investments. Losses of an associate in excess of the Group’s interest in that associate (which includes any long-term interests that, in substance, form part of the Group’s net investment in the associate) are recognised only to the extent that the Group has incurred legal or constructive obligations or made payments on behalf of the associate.
Assets held for saleAssets held for sale are measured at the lower of carrying amount and fair value less costs to sell.
Assets are classified as held for sale if their carrying amount will be recovered through a sale transaction rather than through continuing use. This condition is regarded as met only when the sale is highly probable and the asset is available for immediate sale in its present condition. Management must be committed to the sale which should be expected to qualify for recognition as a completed sale within one year of the date of classification.
2 Significant accounting policies continuedGoodwill and intangible assetsGoodwill arising on consolidation represents the excess of the cost of acquisition over the Group’s interest in the fair value of the identifiable assets and liabilities of a subsidiary, associate or jointly controlled entity at the date of acquisition.
Goodwill is initially recognised as an asset at cost and is subsequently measured at cost less any accumulated impairment losses. Goodwill is reviewed for impairment at least annually. Any impairment is recognised immediately in profit or loss and is not subsequently reversed.
For the purpose of impairment testing, goodwill is allocated to each of the Group’s cash generating units (CGUs). CGUs to which goodwill has been allocated are tested for impairment annually, or more frequently where there is an indication that the unit may be impaired. If the recoverable amount of the CGU is less than the carrying amount of the unit, the impairment loss is allocated to the CGU and then to the other assets of the CGU pro rata on the basis of the carrying amount of each asset in the CGU. An impairment loss recognised for goodwill is not reversed in a subsequent period.
On disposal of a subsidiary, associate or jointly controlled entity, the attributable amount of goodwill is included in the determination of the profit or loss on disposal.
Goodwill arising on acquisitions before the date of transition to IFRS has been retained at the previous UK GAAP amounts subject to being tested for impairment at that date. Goodwill written off to reserves under UK GAAP prior to 1998 has not been reinstated and is not included in determining any subsequent profit or loss on disposal.
The existing finite life intangible assets have a residual value of nil and are amortised over their useful economic lives as follows:
Customer contracts over the life of the contract (9 to 20 years)Greyhound brand and trade name over the life of the brand (20 years)Franchise agreements over the term of the franchise (6 to 10 years)
Revenue recognition Revenue principally comprises revenue from train passenger services, road passenger transport, and certain management and maintenance services in the UK and North America. Where appropriate, amounts are shown net of rebates and sales taxes.
Revenue is recognised by reference to the stage of completion of the customers’ travel or services provided under contractual arrangements as the proportion of total services to be provided. Receipts for season tickets and travel cards are deferred within “accruals and deferred income” and recognised in the income statement over the period covered by the relevant ticket.
Revenue in UK Rail includes franchise subsidy receipts from the Department for Transport (DfT) and Transport Scotland and amounts receivable under franchise revenue support arrangements. Franchise premium payments to the DfT for amounts due under the terms of a franchise are included in operating costs. Revenue also includes amounts attributable to the train operating companies (TOCs), predominantly based on models of route usage, by the Railway Settlement Plan in respect of passenger receipts.
UK Bus revenue principally comprises amounts receivable from ticket sales and concessionary fare schemes. Concessionary amounts are recognised in the period in which the service is provided based on a predetermined formula as agreed with the relevant local authority. Greyhound coach revenue mainly comprises of amounts receivable from ticket sales. Other Bus, including North America, and services revenue from contracts with government bodies and similar organisations is recognised as the services are provided.
Interest income is recognised on an accruals basis.
LeasingLeases are classified as finance leases whenever the terms of the lease transfer substantially all the risks and rewards of ownership to the lessee. All other leases are classified as operating leases and the rental charges are charged against income on a straight-line basis over the life of the lease.
Assets held under hire purchase contracts and finance leases are recognised as assets of the Group at their fair value or, if lower, at the present value of the minimum lease payments, each determined at the inception of the lease. The corresponding liability is included in the balance sheet as a finance lease obligation. Lease payments are apportioned between finance charges and reduction of the lease obligation so as to achieve a constant rate of interest on the remaining balance of the liability. Finance charges are charged directly against income, unless they are directly attributable to qualifying assets, in which case they are capitalised in accordance with the Group’s general policy on borrowing costs (see below).
Benefits received and receivable as an incentive to enter into an operating lease are also spread on a straight-line basis over the lease term.

FirstGroup Annual Report and Accounts 2011 62 FirstGroup Annual Report and Accounts 2011 63
Fina
ncia
l sta
tem
ents
Notes to the consolidated financial statements continued
2 Significant accounting policies continuedForeign currencies The individual financial statements of each Group company are presented in the currency of the primary economic environment in which it operates (its functional currency). For the purpose of the consolidated financial statements, the results and financial position of each Group company are expressed in pounds Sterling, which is the functional currency of the Company, and the presentation currency for the consolidated financial statements.
In preparing the financial statements of the individual companies, transactions in currencies other than pounds Sterling are recorded at the rates of exchange prevailing on the dates of the transactions. At each balance sheet date, monetary assets and liabilities that are denominated in foreign currencies are retranslated at the rates prevailing on the balance sheet date. Non-monetary assets and liabilities carried at fair value that are denominated in foreign currencies are translated at the rates prevailing at the date when the fair value was determined. Non-monetary items that are measured in terms of historical cost in a foreign currency are not retranslated.
Exchange differences arising on the settlement of monetary items, and on the retranslation of monetary items, are included in profit or loss for the period. Exchange differences arising on the retranslation of non-monetary items carried at fair value are included in profit or loss for the period except for differences arising on the retranslation of non-monetary items in respect of which gains and losses are recognised directly in equity. For such non-monetary items, any exchange component of that gain or loss is also recognised directly in equity.
In order to hedge its exposure to certain foreign exchange risks, the Group holds currency swaps and borrowings in foreign currencies (see note 25 for details of the Group’s policies in respect of foreign exchange risks).
On consolidation, the assets and liabilities of the Group’s overseas operations are translated at the closing exchange rates on the balance sheet date. Income and expense items are translated at the average exchange rates for the period unless exchange rates fluctuate significantly during that period, in which case the exchange rates at the date of transactions are used. Exchange differences arising from the average or actual exchange rates used and the period end rate, if any, are classified as equity and transferred to the Group’s translation reserve. Such translation differences are recognised as income or as expenses in the period in which the operation is disposed of.
Goodwill and fair value adjustments arising on the acquisition of a foreign entity are treated as assets and liabilities of the foreign entity and translated at the closing rate.
Borrowing costsBorrowing costs directly attributable to the acquisition, construction or production of qualifying assets, which are assets that necessarily take a substantial period of time to get ready for their intended use or sale, are added to the cost of those assets, until such time as the assets are substantially ready for their intended use or sale.
All other borrowing costs are recognised in profit or loss in the period in which they are incurred.
Operating profitOperating profit is stated after amortisation charges and non-recurring items but before investment income and finance costs.
Non-recurring itemsNon-recurring items are material items of income or expenditure which due to their size, nature and/or infrequency, require separate identification on the face of the income statement to allow a better understanding of the financial performance in the year, in comparison to prior years.
Retirement benefit costsThe Group operates or participates in a number of pension schemes, which include both defined benefit schemes and defined contribution schemes.
Payments to defined contribution retirement benefit schemes are charged as an expense as they fall due. There is no legal or constructive obligation to pay additional contributions into a defined contribution scheme if the fund has insufficient assets to pay all employees’ benefits relating to employee service in the current and prior periods.
For defined benefit schemes, the cost of providing benefits is determined using the Projected Unit Credit Method, with actuarial updates being carried out at each balance sheet date. Actuarial gains and losses are recognised in full in the period in which they occur. They are recognised outside the income statement and presented in the consolidated statement of comprehensive income.
Past service cost is recognised immediately to the extent that the benefits are already vested, and otherwise is amortised on a straight-line basis over the average period until the benefits become vested.
The retirement benefit position recognised in the balance sheet represents the present value of the defined benefit obligation as adjusted for unrecognised past service cost, and as reduced by the fair value of scheme assets. Any asset resulting from this calculation is limited to past service cost, plus the present value of available refunds and reductions in future contributions to the scheme.
2 Significant accounting policies continuedVarious TOCs in the UK Rail business participate in the Railways Pension Scheme, which is an industry-wide defined benefit scheme. The Group is obligated to fund the relevant section of the scheme over the period for which the franchise is held. The full liability is recognised on the balance sheet, which is then reduced by a franchise adjustment so that the net liability reflects the Group’s obligations to fund the scheme over the franchise term.
TaxThe tax expense represents the sum of the tax currently payable and deferred tax.
The tax currently payable is based on taxable profit for the year. Taxable profit differs from net profit as reported in the income statement because it excludes items of income or expense that are taxable or deductible in other years and it further excludes items that are never taxable or deductible. The Group’s liability for current tax is calculated using tax rates that have been enacted or substantively enacted by the balance sheet date.
Deferred tax is the tax expected to be payable or recoverable on differences between the carrying amounts of assets and liabilities in the financial statements and the corresponding tax bases used in the computation of taxable profit, and is accounted for using the balance sheet liability method. Deferred tax liabilities are generally recognised for all taxable temporary differences and deferred tax assets are recognised to the extent that it is probable that taxable profits will be available against which deductible temporary differences can be utilised. Such assets and liabilities are not recognised if the temporary difference arises from the initial recognition of goodwill, or from the initial recognition (other than in a business combination) of other assets and liabilities in a transaction that affects neither the tax profit nor the accounting profit.
Deferred tax liabilities are recognised for taxable temporary differences arising on investments in subsidiaries and associates, and interests in joint ventures, except where the Group is able to control the reversal of the temporary difference and it is probable that the temporary difference will not reverse in the foreseeable future.
The carrying amount of deferred tax assets is reviewed at each balance sheet date and reduced to the extent that it is no longer probable that sufficient taxable profits will be available to allow all or part of the asset to be recovered.
Deferred tax is calculated at the tax rates that are expected to apply in the period when the liability is settled or the asset is realised. Deferred tax is charged or credited in the income statement, except when it relates to items charged or credited directly to equity, in which case the deferred tax is also dealt with in equity.
Deferred tax assets and liabilities are offset when there is a legally enforceable right to set off current tax assets against current tax liabilities and when they relate to income taxes levied by the same tax authority and the Group intends to settle its current tax assets and liabilities on a net basis.
Property, plant and equipmentProperties for provision of services or administrative purposes are carried at cost, less any recognised impairment loss. Cost includes professional fees and, for qualifying assets, borrowing costs capitalised in accordance with the Group’s accounting policy. Depreciation of these assets, on the same basis as other property assets, commences when the assets are ready for their intended use.
Passenger carrying vehicles and other plant and equipment are stated at cost less accumulated depreciation and any recognised impairment loss.
Depreciation is charged so as to write off the cost of assets, other than freehold land, the land element of long leasehold properties or on assets in the course of construction, over their estimated useful lives, using the straight-line method, on the following bases:
Freehold buildings 50 years straight lineLong leasehold buildings 50 years straight lineShort leasehold properties period of leasePassenger carrying vehicles 7 to 15 years straight lineOther plant and equipment 3 to 25 years straight line
Assets held under finance leases are depreciated over their expected useful lives on the same basis as owned assets or, where shorter, over the term of the relevant lease.
The gain or loss arising on the disposal or retirement of an asset is determined as the difference between the sales proceeds and the carrying amount of the asset and is recognised in income.
Government grantsGovernment grants relating to property, plant and equipment are treated as deferred income and released to the income statement over the expected useful lives of the assets concerned.
FirstGroup Annual Report and Accounts 2011 64 FirstGroup Annual Report and Accounts 2011 65
Fina
ncia
l sta
tem
ents
Notes to the consolidated financial statements continued
2 Significant accounting policies continuedImpairment of tangible and intangible assets excluding goodwillAt each balance sheet date, the Group reviews the carrying amounts of its tangible and intangible assets to determine whether there is any indication that those assets have suffered an impairment loss. If any such indication exists, the recoverable amount of the asset is estimated in order to determine the extent of the impairment loss (if any). Where the asset does not generate cash flows that are independent from other assets, the Group estimates the recoverable amount of the CGU to which the asset belongs. An intangible asset with an indefinite useful life is tested for impairment annually and whenever there is an indication that the asset may be impaired.
Recoverable amount is the higher of fair value less costs to sell and value in use. In assessing value in use, the estimated future cash flows are discounted to their present value using a pre-tax discount rate that reflects current market assessments of the time value of money and the risks specific to the asset for which the estimates of future cash flows have not been adjusted.
If the recoverable amount of an asset or CGU is estimated to be less than its carrying amount, the carrying amount of the asset or CGU is reduced to its recoverable amount. An impairment loss is recognised as an expense immediately, unless the relevant asset is carried at a revalued amount, in which case the impairment loss is treated as a revaluation decrease.
Where an impairment loss subsequently reverses, the carrying amount of the asset or CGU is increased to the revised estimate of its recoverable amount, but so that the increased carrying amount does not exceed the carrying amount that would have been determined had no impairment loss been recognised for the asset or CGU in prior years. A reversal of an impairment loss is recognised as income immediately except in the case of goodwill, unless the relevant asset is carried at a revalued amount, in which case the reversal of the impairment loss is treated as a revaluation increase.
InventoriesInventories are stated at the lower of cost and net realisable value. Net realisable value represents the estimated selling price less all estimated costs of completion and costs to be incurred in marketing, selling and distribution.
Financial instrumentsFinancial assets and financial liabilities are recognised on the Group’s balance sheet when the Group becomes a party to the contractual provisions of the instrument.
Financial assetsThe Group measures financial assets on initial recognition at fair value, and determines the classification of such assets at initial recognition and on any subsequent reclassification event.
Where there is no active market for a financial asset, fair value is determined using valuation techniques including recent commercial transactions and discounted cash flows. Otherwise financial assets are carried at amortised cost.
Financial assets are classified into one of four primary categories:
Fair value through profit and lossThis covers any financial asset designated on initial recognition to be measured at fair value with fair value changes to go through the profit and loss, and financial assets acquired principally for the purpose of trading in the short term.
Held to maturity investmentsNon-derivative financial assets with fixed or determinable payments and fixed maturity are classified here when the Group has the intention and ability to hold to maturity. These financial assets are held at amortised cost using the effective interest method. Gains and losses are recognised in the income statement when the investments are derecognised or impaired as well as through amortisation.
2 Significant accounting policies continuedLoans and receivables Non-derivative financial assets with fixed or determinable payments that are not quoted in an active market have not been designated as either fair value through profit or loss or available for sale. Such assets are carried at amortised cost. Gains and losses are recognised in the income statement when the loans and receivables are derecognised or impaired as well as through amortisation.
The most significant financial assets under this category are trade receivables and bank deposits.
Trade receivables are measured at fair value, i.e. original invoice amount, less an allowance for uncollectable amounts. Appropriate allowances for estimated irrecoverable amounts are recognised in profit or loss when there is objective evidence that the asset is impaired.
Bank deposits are included within cash and cash equivalents. Cash and cash equivalents as defined for the cash flow statement comprise cash in hand, cash held at bank with immediate access, other short-term investments and bank deposits with maturities of three months or less from the date of inception and bank overdrafts. In the consolidated balance sheet cash and cash equivalents exclude bank overdrafts. Bank overdrafts that have no legal right of set-off against cash and cash equivalents are included within borrowings in current liabilities. All are carried on the balance sheet at cost. Cash and cash equivalents includes ring-fenced cash. The most significant ring-fenced cash balances are held by the Group’s UK Rail subsidiaries. Under the terms of the Rail franchise agreements, cash can only be distributed by the train operating companies up to the lower of the amount of retained profits or the amount determined by prescribed liquidity ratios. The ring-fenced cash represents that which is not available for distribution or the amount required to satisfy the contractual liquidity ratio at the balance sheet date.
Available for sale financial assetsAvailable for sale financial assets are non-derivative financial assets that are designated as such, or that are not classified in any of the other categories. After initial recognition these assets are measured at fair value with gains or losses being recognised as a separate component of equity until the investment is derecognised or the investment is determined to be impaired, at which time the previously reported cumulative gain or loss is included in the income statement.
Financial liabilities and equityFinancial liabilities and equity instruments are classified according to the substance of the contractual arrangements entered into. An equity instrument is any contract that evidences a residual interest in the assets of the Group after deducting all of its liabilities. Equity instruments issued by the Company are recorded at the proceeds received net of direct issue costs.
Financial liabilitiesBank borrowings Interest-bearing bank loans and overdrafts are recorded at the proceeds received, net of direct issue costs.
Sterling bonds and loan notesThese are measured either on an amortised cost basis or at fair value, if adopted.
Trade payablesTrade payables are initially measured at fair value, and are subsequently measured at amortised cost, using the effective interest rate method.
Derivative financial instruments and hedge accountingThe Group uses derivative financial instruments to hedge interest rate risks, foreign currency risks and fuel price risks. Use of such financial instruments is governed by policies and delegated authorities approved by the Board. The Group does not use derivative financial instruments for speculative purposes.
The main derivative financial instruments used by the Group are interest rate swaps, fuel swaps, and cross currency interest rate swaps. Such instruments are initially recognised at fair value and subsequently re-measured to fair value at the reported balance sheet date. The fair values are calculated by reference to market exchange rates, interest rates and fuel prices at the period end, and supported by counter-party confirmations. The interest rate swaps are designated as cash flow hedges for interest rate risk on certain floating rate debt, and fair value hedges for fair value risk relating to the LIBOR element of a fixed rate financial liability. The fuel swaps are designated as cash flow hedges of fuel price risks or otherwise used as economic hedges of such risks. The cross currency swaps are designated as hedges of the foreign exchange risk relating to part of the Group’s net investment in US Dollar assets.
Changes in the fair value of derivative financial instruments that do not qualify for hedge accounting as cash flow hedges or foreign currency hedges of a foreign net investment are recognised in the income statement as they arise.

FirstGroup Annual Report and Accounts 2011 66 FirstGroup Annual Report and Accounts 2011 67
Fina
ncia
l sta
tem
ents
Notes to the consolidated financial statements continued
2 Significant accounting policies continuedHedge accounting is discontinued when the hedging instrument expires or is sold, terminated, or exercised, or no longer qualifies for hedge accounting. At that time, any cumulative gain or loss on the hedging instrument recognised in equity is retained in equity until the forecasted transaction occurs. If a hedged transaction is no longer expected to occur, the net cumulative gain or loss recognised in equity is transferred to the income statement for the period.
Derivatives embedded in other financial instruments or other host contracts are treated as separate derivatives when their risks and characteristics are not closely related to those of host contracts and the host contracts are not carried at fair value with unrealised gains or losses reported in the income statement.
ProvisionsProvisions are recognised when the Group has a present obligation as a result of a past event and it is probable that the Group will be required to settle that obligation. Provisions are measured at the Directors’ best estimate of the expenditure required to settle the obligation at the balance sheet date and are discounted to present value where the effect is material. Amounts due within 12 months of the balance sheet date are considered to be reliably measured and are therefore included within accruals and deferred income.
InsuranceThe Group’s policy is to self-insure high frequency, low value claims within the businesses. To provide protection above these types of losses, cover is obtained through third-party insurance policies. Provision is made under IAS 37 Provisions, Contingent Liabilities and Contingent Assets for the estimated cost of settling uninsured claims for incidents occurring prior to the balance sheet date.
Share-based paymentsThe Group issues equity-settled share-based payments to certain employees. Equity-settled share-based payments are measured at fair value at the date of grant. The fair value is expensed on a straight-line basis over the vesting period, based on the Group’s estimate of shares that will eventually vest and is adjusted for the effects of non-market-based vesting conditions.
Fair value is measured by use of a Black-Scholes model. The expected life used in the model has been adjusted, based on management’s best estimate, for the effects of non-transferability, exercise restrictions and behavioural considerations.
Dividend distributionDividend distribution to the Company’s shareholders is recognised as a liability in the Group’s financial statements in the period in which the dividends are approved by the Company’s shareholders.
New standards and interpretations not appliedThe International Accounting Standards Board and the International Financial Reporting Interpretations Committee (IFRIC) have issued the following standards and interpretations for annual periods beginning on or after the effective dates as noted below:
Effective for accounting IAS/IFRS standards periods starting on or after
Amendments to IFRS 1 Limited Exemption from Comparative IFRS 7 1 July 2010 Disclosures for First-time AdoptersIAS 24 (revised) Related Party Disclosures 1 January 2011Amendments to IFRS 7 Financial Instruments Disclosures 1 July 2011IFRS 9 Financial Instruments 1 January 2013 (not yet endorsed by EU)Improvements to IFRSs 1 January 2011
Effective for accounting Interpretations periods starting on or after
Amendments to IFRIC 14 Prepayments of a Minimum Funding Requirement 1 January 2011IFRIC 19 Extinguishing Financial Liabilities with Equity Instruments 1 July 2010
The Directors do not anticipate that the adoption of these standards will have a material impact on the Group’s accounts in the period of initial application.
2 Significant accounting policies continuedCritical accounting judgements and key sources of estimation uncertaintyIn the process of applying the Group’s accounting policies which are described above, management has made the following judgements and estimates that have the most significant effect on the amounts recognised in the financial statements.
Impairment of intangible assets (including goodwill)Determining whether goodwill is impaired requires an estimation of the value in use of the CGUs to which the goodwill has been allocated. The value in use requires the entity to estimate the future cash flows expected to arise from the CGU and a suitable discount rate in order to calculate present value. The carrying amount of goodwill at the balance sheet date was £1,608.0m (2010: £1,754.9m; 2009: £1,820.0m) as set out in note 13 and the carrying amount of other intangible assets at the balance sheet date was £348.6m (2010: £415.9m; 2009: £456.7m) as set out in note 14. The sensitivities on the key assumptions used in the goodwill impairment testing are also set out in note 13.
Contract and franchise accountingJudgements are made on an ongoing basis with regards to the recoverability of amounts due and the carrying value of related assets and liabilities arising from long-term service contracts and franchises. Regular forecasts are compiled on the outcome of these types of contracts and franchises, which require assessments and judgements relating to the expected level of revenues and costs and, in cases where options exist, the life of the contract or franchise.
Defined benefit pension arrangementsMeasurement of defined benefit pension obligations requires estimation of a suitable discount rate, the expected return on scheme assets, expected rate of inflation of future salary and pension costs along with assumptions about mortality rates. The most significant of these are the discount rate and inflation rate assumptions. A 0.1% movement in the discount rate would impact operating profit and the balance sheet position by approximately £1m and £24m respectively. A 0.1% movement in the inflation rate would impact operating profit and the balance sheet position by approximately £3m and £14m respectively. The net pension deficit as at the balance sheet date was £243.2m (2010: £330.8m; 2009: £168.7m) as set out in note 36.
Self-insuranceProvision is made for all known incidents for which there is self-insurance using management’s best estimate of the likely settlement of these incidents. The estimated settlement is reviewed on a regular basis with independent actuarial advice and the amount provided is adjusted as required. The Group’s total self-insurance provisions, including those classified within accruals and deferred income, as at the balance sheet date were £340.5m (2010: £375.2m; 2009: £403.1m) as set out in note 27.
2011 20103 Revenue £m £m
Continuing operationsServices rendered 5,870.2 5,724.1UK Rail franchise subsidy receipts 390.8 365.0UK Rail revenue support 168.2 172.8
6,429.2 6,261.9Finance income 1.9 1.8
Total revenue from continuing operations as defined by IAS 18 6,431.1 6,263.7
Discontinued operationsServices rendered 9.5 54.6UK Rail franchise subsidy receipts 0.4 2.8
Total revenue from discontinued operations as defined by IAS 18 9.9 57.4
Total revenue as defined by IAS 18 6,441.0 6,321.1

FirstGroup Annual Report and Accounts 2011 68 FirstGroup Annual Report and Accounts 2011 69
Fina
ncia
l sta
tem
ents
Notes to the consolidated financial statements continued
4 Business segments and geographical informationBusiness segmentsDuring the year organisational changes were made in North America, as a result of which First Student and First Transit now report directly to the Chief Executive. To reflect this, the previously reported North America segment has been split into First Student and First Transit. The prior year numbers in the disclosure below have been restated on this basis for comparison.
The Group is therefore now organised into five operating divisions – First Student, First Transit, Greyhound, UK Bus and UK Rail. These divisions are managed separately in line with the differing services that they provide and the geographical markets which they operate in. The principal activities of these divisions are described in the Chief Executive’s operating review.
Segment information about these businesses is set out below.
The segment results for the year to 31 March 2011 are as follows:
First First Group Student Transit Greyhound UK Bus UK Rail items2 Total £m £m £m £m £m £m £m
Revenue 1,594.4 771.5 634.6 1,137.5 2,279.7 21.4 6,439.1Discontinued operations – – – – (9.9) – (9.9)
Revenue continuing operations 1,594.4 771.5 634.6 1,137.5 2,269.8 21.4 6,429.2
EBITDA1 278.1 66.3 68.7 220.5 166.1 (21.5) 778.2Depreciation (149.8) (9.1) (28.5) (71.7) (57.4) (4.3) (320.8)
Segment results1 128.3 57.2 40.2 148.8 108.7 (25.8) 457.4
Amortisation charges (20.4) (4.7) (3.1) – (14.7) – (42.9)Non-recurring items (39.5) (16.6) – (2.4) (41.9) (0.4) (100.8)Loss on disposal of properties (0.1) – (1.2) (3.1) – – (4.4)
Operating profit 68.3 35.9 35.9 143.3 52.1 (26.2) 309.3
Investment income 1.9 Finance costs (184.3)Ineffectiveness on financial derivatives 0.3
Profit before tax 127.2 Tax (17.0)
Profit for the year from continuing operations 110.2 Discontinued operations 6.9
Profit for the year 117.1
First First Group Student Transit Greyhound UK Bus UK Rail items2 TotalOther information £m £m £m £m £m £m £m
Capital additions 134.3 9.0 41.6 15.2 48.1 17.7 265.9
First First Group Elimin- Student Transit Greyhound UK Bus UK Rail items2 ations TotalBalance sheet £m £m £m £m £m £m £m £m
Total assets 2,742.7 503.9 680.1 1,226.9 792.8 3,355.0 (4,065.3) 5,236.1
Unallocated corporate items3 30.0
Total assets 5,266.1
Liabilities 3,427.0 198.2 484.1 1,113.6 728.1 2,336.5 (4,065.3) 4,222.2
Unallocated corporate items3 93.0
Total liabilities 4,315.2
1 Adjusted.2 Group items comprise Tram operations, German Bus, central management and other items.3 Deferred tax.
4 Business segments and geographical information continuedThe segment results for the year to 31 March 2010 are as follows:
First First Group Student Transit Greyhound UK Bus UK Rail items2 Total £m £m £m £m £m £m £m
Revenue 1,605.9 727.8 603.3 1,170.6 2,188.4 23.3 6,319.3 Discontinued operations – – – – (57.4) – (57.4)
Revenue continuing operations 1,605.9 727.8 603.3 1,170.6 2,131.0 23.3 6,261.9
EBITDA1 324.3 62.1 52.6 200.2 141.9 (17.2) 763.9 Depreciation (143.4) (9.1) (28.7) (75.6) (53.6) (3.9) (314.3)
Segment results1 180.9 53.0 23.9 124.6 88.3 (21.1) 449.6
Amortisation charges (19.6) (5.0) (3.0) – (7.1) – (34.7)Non-recurring items (26.8) (1.3) (8.1) (6.8) (2.5) (4.1) (49.6)(Loss)/profit on disposal of properties – – 0.2 (1.3) – – (1.1)
Operating profit 134.5 46.7 13.0 116.5 78.7 (25.2) 364.2
Investment income 1.8 Finance costs (191.7)Ineffectiveness on financial derivatives 1.0
Profit before tax 175.3 Tax (31.2)
Profit for the year from continuing operations 144.1 Discontinued operations 3.0
Profit for the year 147.1
First First Group Student Transit Greyhound UK Bus UK Rail items2 TotalOther information £m £m £m £m £m £m £m
Capital additions 83.3 9.9 33.9 65.4 39.7 19.5 251.7
First First Group Elimin- Student Transit Greyhound UK Bus UK Rail items2 ations TotalBalance sheet £m £m £m £m £m £m £m £m
Total assets 2,683.4 521.5 719.9 1,168.5 780.3 3,151.5 (3,463.1) 5,562.0
Unallocated corporate items3 30.4
Total assets 5,592.4
Liabilities 3,446.1 255.1 366.9 1,109.9 720.5 2,182.6 (3,463.1) 4,618.0
Unallocated corporate items3 63.9
Total liabilities 4,681.9
1 Adjusted.2 Group items comprise Tram operations, German Bus, central management and other items.3 Deferred tax.
Other non-cash items, included within Group items in segment results, include the following charges:
2011 2010 £m £m
Share-based payments 7.7 5.5Loss on disposal of plant and equipment 3.7 0.8
11.4 6.3

FirstGroup Annual Report and Accounts 2011 70 FirstGroup Annual Report and Accounts 2011 71
Fina
ncia
l sta
tem
ents
Notes to the consolidated financial statements continued
4 Business segments and geographical information continuedGeographical informationThe Group’s operations are located predominantly in the United Kingdom, United States of America and Canada. The following table provides an analysis of the Group’s revenue by geographical market:
2011 2010Revenue – continuing operations £m £m
United Kingdom 3,428.7 3,324.9 United States of America 2,508.0 2,505.0 Canada 492.5 432.0
6,429.2 6,261.9
Revenue – discontinued operationsUnited Kingdom 9.9 57.4
Total revenue – continuing and discontinued operations 6,439.1 6,319.3
The following is an analysis of the carrying amount of segment assets, and additions to property, plant and equipment and intangible assets, analysed by the geographical area in which the assets are located:
Additions to property, Carrying amount plant and equipment of segment and intangible assets 2011 2010 2011 2010Total assets £m £m £m £m
United Kingdom 5,374.7 5,100.3 81.0 124.6 United States of America 3,405.4 3,364.0 171.3 112.6 Canada 521.3 560.8 13.6 14.5 Eliminations (4,065.3) (3,463.1) – –Unallocated corporate items 30.0 30.4 – –
5,266.1 5,592.4 265.9 251.7
2011 20105 Non-recurring items and amortisation charges £m £m
UK Rail First Great Western contract provision (59.9) –First Student recovery plan (39.5) –UK Rail claim 22.5 –First Transit goodwill impairment and contract provision (16.6) –UK Rail bid costs (2.7) –UK Rail joint venture provision (1.8) –Competition Commission costs (1.4) (3.8)UK Bus restructuring costs (1.0) (6.8)North American restructuring costs – (15.9)North American integration costs – (15.5)Fuel hedge ineffectiveness – (4.8)UK Rail restructuring costs – (2.5)Other non-recurring items (0.4) (0.3)
Total non-recurring items (100.8) (49.6)Amortisation charges (42.9) (34.7)Loss on disposal of properties (4.4) (1.1)
Operating profit charge (148.1) (85.4)Ineffectiveness on financial derivatives 0.3 1.0
Profit before tax charge (147.8) (84.4)Tax credit 43.0 26.6 Profit on disposal of discontinued operations 6.7 –
Non-recurring items for the year (98.1) (57.8)
5 Non-recurring items and amortisation charges continuedUK Rail First Great Western contract provisionDuring the year a charge of £59.9m (2010: £nil) was made in respect of the First Great Western franchise. Previously we had considered that certain changes to this franchise in relation to the option period could be negotiated with the DfT. However, as a result of the change in Government and subsequent statements on franchise contractual terms this now appears unlikely to happen. We have decided that the best commercial strategy is to put ourselves in a position to rebid for this franchise under new economic conditions including the electrification and new rolling stock projects for a start date of 1 April 2013. We will therefore not exercise our option to extend this franchise for the three years to March 2016 and it will now end in March 2013. The provision reflects our best estimate of the likely losses on the franchise over the two years to 31 March 2013 which arise largely due to the accelerated write off of assets dedicated to this contract due to the earlier than expected end date.
First Student recovery planA charge of £39.5m (2010: £nil) has been made in respect of the First Student business relating to a restructuring and right sizing project which was initiated as a result of the disappointing performance during the year. We anticipate that this will strengthen the business model, streamline the cost base, improve margins in the medium-term and maximise the future growth opportunities. These costs include provision for surplus fleet, loss making contracts, redundancy and associated costs.
UK Rail claimAgreement was reached with NR during the year in settlement of several disputes, the largest of which related to a long running claim from the previous Great Western Trains franchise. The Group recognised £22.5m net in relation to this matter as compensation as a result of certain changes to the previously agreed rail network.
First Transit goodwill impairment and contract provision During the year a charge of £16.6m (2010: £nil) was made in relation to a loss making contract related to the provision of US military base services in Diego Garcia. Included within this charge is a goodwill impairment charge of £5.0m and provision for projected losses of £11.6m until this contract ends in 2017.
UK Rail bid costsCosts of £2.7m (2010: £nil) were incurred during the year principally on our bid for the Intercity West Coast franchise.
UK Rail joint venture provisionA provision of £1.8m (2010: £nil) has been made for the investment in DSBFirst due to operational and financial uncertainties with this joint venture which have only recently come to light. Further details are set out in note 33.
Competition Commission costsCosts of £1.4m (2010: £3.8m) were incurred on the ongoing Competition Commission investigation into the UK Bus market.
UK Bus restructuring costsRestructuring costs of £1.0m (2010: £6.8m) were incurred during the year and principally represent redundancy and related costs in respect of closing and consolidating certain depots.
Amortisation chargesThe charge for the year was £42.9m (2010: £34.7m) with the increase mainly due to the write off of the remaining balance of the First Great Western franchise intangible asset (£7.6m) as a result of projected losses to the end of this franchise in March 2013.
Loss on disposal of propertiesA loss on disposal of properties of £4.4m (2010: £1.1m) was recorded during the year. Principally due to market conditions there were no significant disposals of properties during the year either in the UK or North America.
Ineffectiveness on financial derivativesDue to the ineffective element and undesignated fair value movements on financial derivatives there was a £0.3m (2010: £1.0m) credit to the income statement during the year.
TaxThe tax credit as a result of this non-recurring expenditure was a credit of £41.3m (2010: £26.6m). In addition, there was a one-off deferred tax credit of £1.7m as a result of the reduction in the UK corporation tax rate from 28% to 26%.

FirstGroup Annual Report and Accounts 2011 72 FirstGroup Annual Report and Accounts 2011 73
Fina
ncia
l sta
tem
ents
Notes to the consolidated financial statements continued
6 Operating profitOperating profit has been arrived at after charging: 2011 2010 £m £m
Depreciation of property, plant and equipment (note 15) 321.0 315.7Operating lease charges (note 34) 641.0 639.6Amortisation charges (note 14) 42.9 34.7Cost of inventories recognised as an expense 720.5 829.1Staff costs (note 7) 2,827.1 2,768.5Auditors remuneration for audit services (see below) 1.5 1.5UK Rail franchise payments 406.6 286.0Other operating costs 1,154.9 1,021.5
6,115.5 5,896.6
Amounts payable to Deloitte LLP and their associates by the Company and its subsidiary undertakings in respect of audit and non-audit services are shown below:
2011 2010 £m £m
Fees payable to the Company’s auditors for the audit of the Company’s annual accounts 0.1 0.1Fees payable to the Company’s auditors and their associates for the audit of the Company’s subsidiaries pursuant to legislation 1.4 1.4
Total audit fees 1.5 1.5
Accounting and advisory services 0.3 0.3Tax services 0.2 0.1
Total non-audit fees 0.5 0.4
A description of the work of the Audit Committee is set out in the corporate governance statement on pages 38 and 39 and includes an explanation of how auditor objectivity and independence is safeguarded when non-audit services are provided by the auditors.
7 Staff costsThe average monthly number of employees (including Executive Directors) was: 2011 2010 Number Number
Operational 121,133 126,592Administration 6,486 6,602
127,619 133,194
Their aggregate remuneration (including Executive Directors) comprised: 2011 2010 £m £m
Wages and salaries 2,577.3 2,521.7Social security costs 202.8 200.1Other pension costs (note 36) 47.0 46.7
2,827.1 2,768.5
Wages and salaries include a charge in respect of share-based payments of £7.7m (2010: £5.5m).
Disclosures on Directors’ remuneration, share options, long-term incentive schemes and pension entitlements required by the Companies Act 2006 and those specified for audit by the Financial Services Authority are contained in the tables/notes within the Directors’ remuneration report on pages 44 to 49 and form part of these audited financial statements.
2011 20108 Investment income and finance costs £m £m
Investment incomeBank interest receivable (1.9) (1.8)
Finance costsBonds 91.6 85.2Bank borrowings 64.2 80.3Loan notes 1.0 1.1Finance charges payable in respect of HP contracts and finance leases 7.8 7.6Notional interest on long term provisions 19.7 17.5
Finance costs before non-recurring items 184.3 191.7Hedge ineffectiveness on financial derivatives (0.3) (1.0)
184.0 190.7
Net finance costs 182.1 188.9
Finance costs are stated after charging fee expenses of £4.9m (2010: £4.6m). There was no interest capitalised into qualifying assets in either the year ended 31 March 2010 or 31 March 2011.
2011 20109 Tax on profit on ordinary activities £m £m
Current tax 37.0 4.1Deferred tax (note 26) (20.0) 27.1
Tax on profit from continuing operations 17.0 31.2Current tax – discontinued operations 0.1 1.3
Total tax charge 17.1 32.5
UK corporation tax is calculated at 28% (2010: 28%) of the estimated assessable profit for the year. Tax for other jurisdictions is calculated at the rates prevailing in the respective jurisdictions.
The charge for the year can be reconciled to the profit per the income statement as follows:
2011 2011 2010 2010 £m % £m %
Profit before tax 127.2 100.0 175.3 100.0
Tax at the UK corporation tax rate of 28% (2010:28%) 35.6 28.0 49.1 28.0Tax effect of expenses that are not deductible in determining taxable profit 4.8 3.8 3.4 1.9Reduced tax in subsidiaries operating in other jurisdictions (21.1) (16.6) (17.7) (10.1)Impact of reduction in UK tax rate on current years deferred tax 1.2 0.9 – –Impact of reduction in UK tax rate on prior years deferred tax (1.7) (1.3) – –Adjustments to tax in respect of prior years (1.8) (1.4) (3.6) (2.0)
Tax charge and effective tax rate for the year on continuing operations 17.0 13.4 31.2 17.8
In addition to the amount charged/(credited) to the income statement, deferred tax relating to share-based payments £(0.1)m (2010: £(0.4)m), actuarial gains/(losses) £5.9m (2010: £(53.6)m) and cash flow and net investment hedges £44.0m (2010: £100.4m), amounting to a charge of £49.8m (2010: £46.4m) has been taken directly to equity.

FirstGroup Annual Report and Accounts 2011 74 FirstGroup Annual Report and Accounts 2011 75
Fina
ncia
l sta
tem
ents
Notes to the consolidated financial statements continued
10 Discontinued operationsOn 28 May 2010 FirstGroup plc disposed of GB Railfreight and as a consequence the results of this business have been classified as discontinued operations, as detailed below:
2011 2010 £m £m
Revenue 9.9 57.4Operating costs (9.6) (53.1)
Profit before tax 0.3 4.3Attributable tax expense (0.1) (1.3)
Profit for the period from discontinued operations 0.2 3.0Profit on disposal of discontinued operations 6.7 –
Net profit attributable to discontinued operations 6.9 3.0
There was no attributable tax on the profit on disposal of discontinued operations.
During the year, discontinued operations contributed £1.7m (2010: £9.1m) to the Group’s net operating cash flows, paid £0.2m (2010: £1.2m) in respect of investing activities and paid £nil (2010: £nil) in respect of financing activities.
Details of the profit on disposal of GB Railfreight are set out in note 31.
The effect of discontinued operations on segment results is disclosed in note 4.
11 Earnings per share (EPS)EPS is calculated by dividing the profit attributable to equity shareholders of £103.2m (2010: £132.1m) by the weighted average number of ordinary shares of 480.4m (2010: 480.5m). The numbers of ordinary shares used for the basic and diluted calculations are shown in the table below.
The difference in the number of shares between the basic calculation and the diluted calculation represents the weighted average number of potentially dilutive ordinary share options.
2011 2010 Number Number m m
Weighted average number of shares used in basic calculation 480.4 480.5SAYE share options 0.5 0.2Executive share options 3.7 2.5
484.6 483.2
11 Earnings per share (EPS) continuedThe adjusted basic EPS is intended to highlight the recurring results of the Group before amortisation charges, ineffectiveness on financial derivatives, non-recurring items and loss on disposal of properties. A reconciliation is set out below:
2011 2010 £m EPS (p) £m EPS (p)
Basic profit/EPS from continuing operations 103.0 21.4 129.1 26.9Basic profit/EPS from discontinued operations 0.2 0.1 3.0 0.6
Basic profit/EPS 103.2 21.5 132.1 27.5Amortisation charges1 42.7 8.9 34.5 7.2Ineffectiveness on financial derivatives (0.3) (0.1) (1.0) (0.2)Non-recurring items 100.8 21.0 49.6 10.4Non-controlling interests on non-recurring items (3.1) (0.6) – –Loss on disposal of properties 4.4 0.9 1.1 0.2Business disposals (6.7) (1.4) – – Tax effect of above adjustments (43.0) (9.0) (26.6) (5.6)
Adjusted profit/EPS 198.0 41.2 189.7 39.5Adjusted profit/EPS from discontinued operations (0.2) – (3.0) (0.6)
Adjusted profit/EPS from continuing operations 197.8 41.2 186.7 38.9
2011 2010Diluted EPS pence pence
Continuing operationsBasic 21.3 26.7Adjusted 40.8 38.6Continuing and discontinued operationsBasic 21.3 27.3Adjusted 40.9 39.3
1 Amortisation charges of £42.9m per note 14 less £0.2m (2010: £34.7m less £0.2m) attributable to equity non-controlling interests.
2011 201012 Dividends £m £m
Final dividend per share paid for the year ended 31 March 2010 of 14.0p (2009: 12.7p) 67.2 61.1Interim dividend per share paid for the year ended 31 March 2011 of 7.12p (2010: 6.65p) 34.2 32.0
Amounts recognised as distributions to equity holders in the year 101.4 93.1
Proposed final dividend per share for the year ended 31 March 2011 of 15.0p (2010: 14.0p) 72.1 67.2
The proposed final dividend is subject to approval by shareholders at the Annual General Meeting and has not been included as a liability in these financial statements.

FirstGroup Annual Report and Accounts 2011 76 FirstGroup Annual Report and Accounts 2011 77
Fina
ncia
l sta
tem
ents
Notes to the consolidated financial statements continued
2011 2010 200913 Goodwill £m £m £m
CostAt 1 April 1,754.9 1,820.0 1,310.1Additions 2.3 – 6.5Disposals (14.2) – –Reclassifications to other intangible assets – – (9.1)Foreign exchange movements (130.0) (65.1) 512.5
At 31 March 1,613.0 1,754.9 1,820.0
Accumulated impairment lossesAt 1 April – – –Impairment losses for the year 5.0 – –
At 31 March 5.0 – –
Carrying amount At 31 March 1,608.0 1,754.9 1,820.0
Details of acquisitions in the year are shown in note 31.
Goodwill acquired in a business combination is allocated, at acquisition, to the cash generating units (CGUs) that are expected to benefit from that business combination. The carrying amount of goodwill has been allocated as follows:
2011 2010 2009 £m £m £m
Carrying amountFirst Student 1,027.5 1,117.9 1,161.9First Transit 246.7 271.1 282.0Greyhound 226.9 244.3 254.2UK Bus 95.2 95.5 95.7UK Rail 5.6 19.8 19.8Germany 6.1 6.3 6.4
1,608.0 1,754.9 1,820.0
Impairment testingAt the year end, goodwill was reviewed for impairment in accordance with IAS 36 Impairment of Assets. For the purposes of this impairment review goodwill has been tested for impairment on the basis of discounted future cash flows arising in each relevant CGU.
The Group prepares cash flow forecasts derived from the most recent budget for 2011/12 and Five Year Plan projections for 2012/13 which take account of both past performance and expectations for future market developments. The projections for First Student assume the incremental benefits of the recovery plan together with a moderate economic recovery. As a result, operating profits and margins for the business are projected to recover to historic levels by the end of 2013/14. Cash flows beyond 2012/13 (beyond 2013/14 for First Student) are extrapolated using estimated growth rates of 2.5% (2010: 2.5%) for the United Kingdom and 3.0% (2010: 3.0%) for North America which do not exceed the long-term average growth rate for the Group’s businesses. A risk adjustment is then made using a pre-tax discount rate of 10.0% (2010: 10.0%) to arrive at the value in use for each of the CGUs. The pre-tax discount rates applied are derived from the Group’s weighted average cost of capital. The assumptions used in the calculation of the Group’s weighted average cost of capital are benchmarked to externally available data.
The Directors consider the assumptions to be reasonable based on the historic performance of each CGU and to be realistic in light of economic and industry forecasts.
The calculation of value in use for each CGU is most sensitive to the principal assumptions of discount rate, growth rates and margins achievable. Sensitivity analysis has been performed on the calculations and confirms that no reasonably possible changes in the assumptions would cause the carrying amount of the CGUs to exceed their recoverable amount.
13 Goodwill continuedThe headroom by the principal CGUs and sensitivities thereon, which are shown on a mutually exclusive basis, are as follows:
First First Student Transit Greyhound UK Bus UK Rail £m £m £m £m £m
Carrying value1 1,640 288 361 817 64Headroom 243 295 277 796 477
Value in use 1,883 583 638 1,613 541
Headroom after increasing discount rate by 1.0% 161 269 250 729 445
Headroom after a 1.0% reduction in assumed growth rates 216 282 263 761 468
Headroom after a 1.0% reduction in margin 79 212 216 670 239
1 Net assets including goodwill above but excluding inter-company balances.
The First Student margin would need to fall in excess of 1.5% compared to future projections for there to be an impairment on this business.
Greyhound Rail Customer brand and franchise contracts trade name agreements Total 14 Other intangible assets £m £m £m £m
CostAt 1 April 2009 412.1 65.9 56.3 534.3Foreign exchange movements (4.5) 0.1 – (4.4)
At 31 March 2010 407.6 66.0 56.3 529.9Foreign exchange movements (26.1) (4.1) – (30.2)
At 31 March 2011 381.5 61.9 56.3 499.7
AmortisationAt 1 April 2009 44.6 5.0 28.0 77.6Charge for year 24.6 3.0 7.1 34.7Foreign exchange movements 1.4 0.3 – 1.7
At 31 March 2010 70.6 8.3 35.1 114.0Charge for year 25.1 3.1 14.7 42.9Foreign exchange movements (5.6) (0.2) – (5.8)
At 31 March 2011 90.1 11.2 49.8 151.1
Carrying amountAt 31 March 2011 291.4 50.7 6.5 348.6
At 31 March 2010 337.0 57.7 21.2 415.9
At 31 March 2009 367.5 60.9 28.3 456.7
Intangible assets include customer contracts and the Greyhound brand and trade name which were acquired through the purchases of businesses and subsidiary undertakings. These are being amortised over their useful economic lives as shown in note 2 to the consolidated financial statements.
The rail franchise agreements’ intangible asset represents the part of the economic benefit that is realised as a result of recognising our share of the rail pension deficit on the date of commencement of each respective franchise and is amortised on a straight-line basis over the initial term of each respective franchise. The largest element of the franchise intangible relates to the First ScotRail franchise (carrying amount £4.6m (2010: £5.9m)). During the year the First Great Western franchise agreement intangible was fully written down per note 5 (carrying amount £nil (2010: £11.4m)).

FirstGroup Annual Report and Accounts 2011 78 FirstGroup Annual Report and Accounts 2011 79
Fina
ncia
l sta
tem
ents
Notes to the consolidated financial statements continued
Passenger Other Land and carrying plant and buildings vehicle fleet equipment Total 15 Property, plant and equipment £m £m £m £m
CostAt 1 April 2009 531.5 2,598.1 514.4 3,644.0Additions in the year 24.7 161.6 65.4 251.7Disposals (4.7) (86.4) (23.1) (114.2)Transfers 5.0 (1.5) (3.5) –Reclassified as held for sale – (23.6) – (23.6)Foreign exchange movements (1.3) (3.9) (3.3) (8.5)
At 31 March 2010 555.2 2,644.3 549.9 3,749.4Subsidiary undertakings acquired – 1.0 – 1.0Subsidiary undertakings disposed of (2.8) (2.3) (4.0) (9.1)Additions in the year 27.3 145.8 89.5 262.6Disposals (15.2) (59.5) (30.8) (105.5)Transfers (8.5) – 8.5 –Reclassified as held for sale – (56.1) – (56.1)Foreign exchange movements (19.5) (108.0) (16.4) (143.9)
At 31 March 2011 536.5 2,565.2 596.7 3,698.4
Accumulated depreciation and impairmentAt 1 April 2009 51.6 974.7 219.6 1,245.9Charge for year 13.9 231.5 70.3 315.7Disposals (1.6) (59.2) (20.5) (81.3)Transfers 4.2 (1.4) (2.8) –Reclassified as held for sale – (20.1) – (20.1)Foreign exchange movements 0.4 5.4 (0.7) 5.1
At 31 March 2010 68.5 1,130.9 265.9 1,465.3Subsidiary undertakings disposed of (1.2) (2.3) (1.8) (5.3)Charge for year 14.1 228.4 78.5 321.0Impairment – 13.3 – 13.3Disposals (4.3) (47.7) (27.3) (79.3)Reclassified as held for sale – (46.4) – (46.4)Foreign exchange movements (2.1) (44.6) (6.4) (53.1)
At 31 March 2011 75.0 1,231.6 308.9 1,615.5
Carrying amountAt 31 March 2011 461.5 1,333.6 287.8 2,082.9
At 31 March 2010 486.7 1,513.4 284.0 2,284.1
At 31 March 2009 479.9 1,623.4 294.8 2,398.1
An amount of £13.4m (2010: £34.0m; 2009: £39.2m) in respect of assets under construction is included in the carrying amount of property, plant and equipment.
At 31 March 2011 the Group had entered into contractual capital commitments amounting to £148.8m (2010: £86.8m; 2009: £146.7m), principally representing buses ordered in the United Kingdom and commitments under the First Great Western franchise.
Property, plant and equipment held under HP contracts and finance leases are analysed as follows:
2011 2010 2009 £m £m £m
Passenger carrying vehicle fleet – cost 349.2 305.3 270.1– depreciation (80.9) (72.5) (54.7)
Net passenger carrying vehicle fleet 268.3 232.8 215.4
Other plant and equipment – cost 4.4 4.4 4.4– depreciation (2.5) (2.3) (2.0)
Net other plant and equipment 1.9 2.1 2.4
Total net book value 270.2 234.9 217.8
Assets held under HP contracts and finance leases are pledged as security for the related HP contract or finance lease.
16 SubsidiariesA list of the significant investments in subsidiaries, including the name, country of incorporation and proportion of ownership interest is given in note 4 to the Company’s separate financial statements on page 110.
2011 2010 200917 Inventories £m £m £m
Spare parts and consumables 91.1 91.5 108.0Property development work in progress 0.3 1.2 2.0
91.4 92.7 110.0
In the view of the Directors there is no material difference between the balance sheet value of inventories and their replacement cost. There was no material write down of inventories during the current or prior year. The provision for stock obsolescence at the balance sheet date was £8.2m (2010: £7.7m; 2009: £6.0m).
2011 2010 200918 Trade and other receivables £m £m £m
Amounts due within one yearTrade receivables 408.7 462.2 461.8Provision for doubtful receivables (7.5) (6.5) (8.8)Other receivables 53.4 57.3 67.2Other prepayments and accrued income 100.9 89.5 90.1
555.5 602.5 610.3
Credit riskCredit risk is the risk that financial loss arises from failure by a customer or counterparty to meet its obligations under a contract.
Credit risk exists in relation to the Group’s financial assets, which comprise trade and other receivables of £555.5m (2010: £602.5m; 2009: £610.3m), cash and cash equivalents of £388.0m (2010: £335.0m; 2009: £322.5m) and derivative financial instruments of £123.2m (2010: £65.1m; 2009: £27.9m).
The Group’s maximum exposure to credit risk for all financial assets at the balance sheet date was £1,064.3m (2010: £1,002.6m; 2009: £971.2m). The exposure is spread over a large number of unconnected counterparties and the maximum single concentration with any one counterparty was £53.0m (2010: £50.0m; 2009: £50.0m) at the balance sheet date.
The Group’s credit risk is primarily attributable to its trade receivables. The amounts presented in the balance sheet are net of allowances for doubtful receivables, estimated by the Group’s management based on prior experience and their assessment of the current economic environment. The provision for doubtful receivables at the balance sheet date was £7.5m (2010: £6.5m; 2009: £8.8m).
Most trade receivables are with public or quasi public bodies, principally the UK Department for Transport, Network Rail, Transport for London, Transport Scotland, UK city councils and school bus boards and city municipal authorities in North America. The Group does not consider any of these counterparties to be a significant risk. Each division within the Group has a policy governing credit risk management on trade receivables.
The counterparties for bank balances and derivative financial instruments are mainly represented by large banks with a minimum of ‘A’ credit ratings assigned by international credit rating agencies. These counterparties are subject to approval by the Board. Group Treasury policy limits the maximum deposit amount with any one counterparty to £75m, and limits the maximum term to three months. The term of the bank deposits is typically less than one month.
An analysis of financial assets which are past due but not impaired and movements in the provision for doubtful receivables are set out below:
2011 2010 2009 £m £m £m
Ageing of past due but not impaired trade receivables Less than 30 days 39.4 33.9 32.830 – 90 days 9.9 11.4 12.890 – 180 days 7.5 11.1 2.5180+ days 1.8 4.4 1.6
Total 58.6 60.8 49.7

FirstGroup Annual Report and Accounts 2011 80 FirstGroup Annual Report and Accounts 2011 81
Fina
ncia
l sta
tem
ents
Notes to the consolidated financial statements continued
18 Trade and other receivables continued 2011 2010 2009 £m £m £m
Movement in the provision for doubtful receivablesBalance at the beginning of the year 6.5 8.8 5.0Subsidiary undertakings acquired – – 0.1Amounts written off during the year (2.0) (3.4) (1.9)Amounts recovered during the year (0.2) (0.2) (0.9)Increase in allowance recognised in the income statement 3.4 1.5 5.1Foreign exchange movements (0.2) (0.2) 1.4
Balance at the end of the year 7.5 6.5 8.8
The Directors consider that the carrying amount of trade and other receivables approximates to their fair value.
2011 2010 200919 Assets held for sale £m £m £m
Assets held for sale 4.6 3.9 4.2
These comprise First Student yellow school buses which are surplus to requirements and are being actively marketed on the Internet. Gains or losses arising on the disposal of such assets are included in arriving at operating profit in the income statement. The Group expects to sell such yellow school buses within 12 months of them going onto the ‘for sale’ list. The value at each balance sheet date represents management’s best estimate of their resale value. There are no liabilities associated with these held for sale assets.
2011 2010 200920 Trade and other payables £m £m £m
Amounts falling due within one yearTrade payables 312.2 288.9 314.5Other payables 113.9 145.1 129.2Accruals and deferred income 640.5 627.5 623.0Season ticket deferred income 63.3 58.5 58.0
1,129.9 1,120.0 1,124.7
Trade payables and accruals principally comprise amounts outstanding for trade purchases and ongoing costs. The average credit period taken for trade purchases is 33 days (2010: 31 days; 2009: 30 days). The Group has controls in place to ensure that all payments are paid within the appropriate credit time frame.
The Directors consider that the carrying amount of trade and other payables approximates to their fair value.
2011 2010 200921 Cash and cash equivalents £m £m £m
Cash and cash equivalents 388.0 335.0 322.5
The fair value of cash and cash equivalents approximates to the carrying value. Cash and cash equivalents includes ring-fenced cash of £298.6m (2010: £259.0m; 2009: £212.8m). The most significant ring-fenced cash balances are held by the Group’s UK Rail subsidiaries. Under the terms of the Rail franchise agreements, cash can only be distributed by the TOCs either up to the amount of retained profits or the amount determined by prescribed liquidity ratios. The ring-fenced cash represents that which is not available for distribution or the amount required to satisfy the liquidity ratios at the balance sheet date. Ring-fenced cash balances of £14.8m (2010: £24.8m; 2009: £28.0m) are held outwith the UK Rail subsidiaries.
2011 2010 200922 Financial liabilities – borrowings £m £m £m
Current financial liabilitiesShort-term bank loans 93.5 – 210.7
93.5 – 210.7
Bond 6.875% (repayable 2013) – accrued interest 20.2 20.2 20.2Bond 8.125% (repayable 2018) – accrued interest 12.8 12.8 12.8Bond 6.125% (repayable 2019) – accrued interest 3.0 3.0 3.0Bond 8.75% (repayable 2021) – accrued interest 30.1 30.1 –Bond 6.875% (repayable 2024) – accrued interest 7.2 7.2 –
73.3 73.3 36.0
HP contracts and finance leases (note 23) 42.8 34.6 34.3Loan notes (note 24) – 0.8 –
Total current financial liabilities 209.6 108.7 281.0
Non-current financial liabilitiesSyndicated and bilateral unsecured bank loans 554.9 896.0 1,406.6Other loans – – 1.5
554.9 896.0 1,408.1
Bond 6.875% (repayable 2013) 298.0 297.4 296.9Bond 8.125% (repayable 2018) 296.4 296.2 296.0Bond 6.125% (repayable 2019) 276.7 274.8 277.3Bond 8.75% (repayable 2021) 347.0 346.8 –Bond 6.875% (repayable 2024) 199.0 198.9 –
1,417.1 1,414.1 870.2
HP contracts and finance leases (note 23) 209.1 192.8 194.6Loan notes (note 24) 9.7 9.7 10.5
Total non-current financial liabilities 2,190.8 2,512.6 2,483.4
Total liabilities 2,400.4 2,621.3 2,764.4
Gross borrowings repayment profileWithin one year or on demand 209.6 108.7 281.0Between one and two years 216.0 607.4 44.9Between two and five years 796.1 720.4 1,798.6Over five years 1,178.7 1,184.8 639.9
2,400.4 2,621.3 2,764.4
The non-current bond repayable in 2013 is measured on an amortised cost basis and had a par value of £300.0m. Interest on this bond is payable annually in April and the fair value is £339.2m (2010: £346.9m; 2009: £319.8m). The non-current bond repayable in 2019 is measured on an amortised cost basis, adjusted for certain fair value movements on the bond that are fully and effectively hedged by swaps. This bond had a par value of £250.0m and interest is payable annually in January. The fair value of this bond is £260.5m (2010: £261.1m; 2009: £217.4m). The non-current bond repayable in 2018 is measured on an amortised cost basis and had a par value of £300.0m. Interest is payable annually in September and the fair value of this bond is £361.6m (2010: £365.5m; 2009: £316.3m). The non-current bond repayable in 2021 is measured on an amortised cost basis and has a par value of £350.0m. Interest is payable annually in April. The fair value of this bond is £455.7m (2010: £461.2m; 2009: £nil). The non-current bond repayable in 2024 is measured on an amortised cost basis and has a par value of £200.0m. Interest is payable annually in September. The fair value of this bond is £221.3m (2010: £220.7m; 2009: £nil).
The Group considers that there is no material difference between the fair value of the short-term loans, the syndicated loans and bilateral loans, and their carrying amount in the balance sheet.

FirstGroup Annual Report and Accounts 2011 82 FirstGroup Annual Report and Accounts 2011 83
Fina
ncia
l sta
tem
ents
Notes to the consolidated financial statements continued
22 Financial liabilities – borrowings continuedEffective interest ratesThe effective interest rates at the balance sheet dates were as follows:
2011 2010 2009
Bank overdraft LIBOR + 1% LIBOR + 1% LIBOR + 1%Bank borrowings LIBOR + 0.55% to 1.6% LIBOR + 0.55% to 1.7% LIBOR + 0.5% to 1.75%Bond 2013 7.10% 7.10% 7.10%Bond 2018 8.32% 8.32% 8.32%Bond 2019 6.18% 6.18% 6.18%Bond 2021 8.87% 8.87% –Bond 2024 6.95% 6.95% –
HP contracts and finance leases LIBOR up to average fixed LIBOR up to average fixed LIBOR up to average fixed rate of 8.0% rate of 8.0% rate of 7.89%
Loan notes LIBOR – 0.5% up to total LIBOR – 0.5% up to total LIBOR – 0.5% up to total fixed rate of 11.0% fixed rate of 11.0% fixed rate of 11.0%
2011 2010 2009Carrying value of gross borrowings by currency £m £m £m
Sterling 1,603.1 1,618.9 1,165.0Euros 29.0 93.4 74.4US Dollar 653.1 749.6 1,399.7Canadian Dollar 115.2 159.4 125.3
2,400.4 2,621.3 2,764.4Currency swapsUS Dollar 700.0 700.0 550.0Sterling (700.0) (700.0) (550.0)
2,400.4 2,621.3 2,764.4
2011 Bank Finance Loan debt leases notes Bonds TotalMaturity of non-current financial liabilities £m £m £m £m £m
Due in more than one year but not more than two years 163.1 43.2 9.7 – 216.0Due in more than two years but not more than five years 391.8 106.3 – 298.0 796.1Due in more than five years – 59.6 – 1,119.1 1,178.7
554.9 209.1 9.7 1,417.1 2,190.8
2010 Bank Finance Loan debt leases notes Bonds Total £m £m £m £m £m
Due in more than one year but not more than two years 559.9 37.8 9.7 – 607.4Due in more than two years but not more than five years 336.1 86.9 – 297.4 720.4Due in more than five years – 68.1 – 1,116.7 1,184.8
896.0 192.8 9.7 1,414.1 2,512.6
2009 Bank Finance Loan debt leases notes Bonds Total £m £m £m £m £m
Due in more than one year but not more than two years 1.3 33.1 10.5 – 44.9Due in more than two years but not more than five years 1,406.7 95.0 – 296.9 1,798.6Due in more than five years 0.1 66.5 – 573.3 639.9
1,408.1 194.6 10.5 870.2 2,483.4
22 Financial liabilities – borrowings continuedBorrowing facilitiesThe Group had £526.7m (2010: £1,013.3m; 2009: £583.0m) of undrawn committed borrowing facilities as at 31 March 2011. Total bank borrowing facilities at 31 March 2011 stood at £1,266.0m (2010: £2,110.0m; 2009: £2,401.6m) of which £1,222.9m (2010: £2,066.4m; 2009: £2,328.2m) was committed and £43.1m (2010: £43.6m; 2009: £73.4m) was uncommitted.
23 HP contracts and finance leasesThe Group had the following obligations under HP contracts and finance leases as at the balance sheet dates:
2011 2010 2009 2011 Present 2010 Present 2009 Present Minimum value of Minimum value of Minimum value of payments payments payments payments payments payments £m £m £m £m £m £m
Due in less than one year 48.8 42.8 40.2 34.6 39.0 34.3Due in more than one year but not more than two years 48.3 43.2 42.7 37.8 37.0 33.1Due in more than two years but not more than five years 116.6 106.3 97.2 86.9 103.1 95.0Due in more than five years 62.0 59.6 71.6 68.1 69.0 66.5
275.7 251.9 251.7 227.4 248.1 228.9Less future financing charges (23.8) – (24.3) – (19.2) –
251.9 251.9 227.4 227.4 228.9 228.9
The lease obligations are denominated in Sterling, US Dollars and Canadian Dollars. Sterling fixed rate leases of £15.1m (2010: £1.1m; 2009: £2.3m) have an average remaining life of three years (2010: three years; 2009: three years) and an effective borrowing rate of 3.47% (2010: 6.94%; 2009: 7.87%). US Dollar fixed rate leases of £146.8m (2010: £113.7m; 2009: £95.9m) have an average remaining life of four years (2010: four years; 2009: four years) and an effective borrowing rate of 3.98% (2010: 4.71%; 2009: 4.45%). Canadian Dollar fixed rate leases of £1.7m (2010: £1.9m; 2009: £2.5m) have an average remaining life of one year (2010: two years; 2009: two years) and an effective borrowing rate of 7.39% (2010: 7.07%; 2009: 7.75%). The Group considers there to be no material difference between the fair values of the Sterling and Canadian Dollar finance leases and the carrying amount in the balance sheet. The US Dollar finance leases have a fair value of £151.8m (2010: £117.5m; 2009: £100.1m).
24 Loan notesThe Group had the following loan notes issued as at the balance sheet dates:
2011 2010 2009 £m £m £m
Due in less than one year – 0.8 –Due in more than one year but not more than two years 9.7 9.7 10.5
9.7 10.5 10.5
The loan notes have been classified by reference to the earliest date on which the loan note holder can request redemption. Loan notes of £8.7m (2010: £9.5m; 2009: £9.5m) are supported by unsecured bank guarantees.
The loan notes have an average effective borrowing rate of 10.1% (2010: 9.40%; 2009: 10.14%) and an average remaining term of nine years (2010: 10 years; 2009: 12 years) assuming that holders do not request redemption. The fair value of the loan notes has been determined to be £15.1m (2010: £16.3m; 2009: £16.4m). This has been calculated by discounting future cash flows that will arise under the loan notes.
2011 2010 200925 Derivative financial instruments £m £m £m
Derivatives designated and effective as hedging instruments carried at fair valueNon-current assetsCross currency swaps (net investment hedge) 22.2 13.3 –Coupon swaps (fair value hedge) 21.0 15.7 19.9Fuel derivatives (cash flow hedge) 14.9 4.0 3.1
58.1 33.0 23.0
Current assetsCross currency swaps (net investment hedge) 4.6 3.6 0.9Coupon swaps (fair value hedge) 6.7 10.6 2.1Currency forwards (cash flow hedge) 1.2 – –Fuel derivatives (cash flow hedge) 52.6 15.7 –
65.1 29.9 3.0

FirstGroup Annual Report and Accounts 2011 84 FirstGroup Annual Report and Accounts 2011 85
Fina
ncia
l sta
tem
ents
Notes to the consolidated financial statements continued
25 Derivative financial instruments continued 2011 2010 2009 £m £m £m
Current liabilitiesInterest rate derivatives (cash flow hedge) 15.0 42.9 50.4Cross currency swaps (net investment hedge) 23.3 2.9 2.0Fuel derivatives (cash flow hedge) 0.1 39.4 252.1
38.4 85.2 304.5
Non-current liabilitiesInterest rate derivatives (cash flow hedge) 1.5 10.7 38.1Cross currency swaps (net investment hedge) 28.2 91.9 123.6Fuel derivatives (cash flow hedge) – 18.5 81.9
29.7 121.1 243.6
Derivatives classified as held for tradingNon-current assetsCross currency swaps – – 1.8
Current assetsCross currency swaps – 2.2 0.1
Current liabilitiesInterest rate swaps 0.1 – –
Total non-current assets 58.1 33.0 24.8Total current assets 65.1 32.1 3.1
Total assets 123.2 65.1 27.9
Total current liabilities 38.5 85.2 304.5Total non-current liabilities 29.7 121.1 243.6
Total liabilities 68.2 206.3 548.1
Total cash flow hedges are an asset of £52.1m (2010: liability of £91.8m; 2009: liability of £419.4m). Total fair value hedges are an asset of £27.7m (2010: £26.3m; 2009: £22.0m). Total net investment hedges are a liability of £24.7m (2010: £77.9m; 2009: £124.7m).
During the year £84.7m was credited to the hedging reserve in respect of cash flow hedges (2010: £1.9m credit; 2009: £377.4m debit).
The fair value measurements of the financial derivatives held by the Group have been derived based on observable market inputs (as categorised within Level 2 of the fair value hierarchy under IFRS 7 (2009)).
Losses transferred from equity into profit or loss during the period are included in the following line items on the face of the income statement:
2011 2010 £m £m
Finance cost (35.4) (53.4)Operating costs (20.1) (249.0)
(55.5) (302.4)
The following gains and losses on derivatives designated for hedge accounting have been charged through the income statement in the year:
2011 2010 £m £m
Gains/(losses) on hedging instruments in fair value hedges 1.8 (2.7)(Losses)/gains on hedged item attributable to hedged risk (Bond 2019) in fair value hedges (1.8) 2.7Ineffectiveness arising from cash flow hedges – (2.0)Ineffectiveness arising from net investment hedges (0.8) 4.9
(0.8) 2.9
25 Derivative financial instruments continuedFinancial risk managementThe Group is exposed to financial risks including liquidity risk, credit risk and certain market based risks principally being the effects of changes in foreign exchange rates, interest rates and fuel prices. The Group manages these risks within the context of a set of formal policies established by the Board. Certain risk management responsibilities are formally delegated by the Board, principally to a sub-committee of the Board and to the Group Finance Director.
Liquidity risk Liquidity risk is the risk that the Group may encounter difficulty in meeting obligations associated with financial liabilities. The objective of the Group’s liquidity risk management is to ensure sufficient committed liquidity resources exist. The Group has a diversified debt structure largely represented by medium-term unsecured syndicated and bilateral committed bank facilities and long-term unsecured bond debt. It is a policy requirement that refinancing obligations must be addressed well in advance of their due dates.
Group treasury policy requires a minimum of £175m of committed liquidity headroom at all times within medium-term bank facilities and such facilities must be renewed or replaced well before their expiry dates. At 31 March 2011, the total amount of these facilities stood at £1,222.9m (2010: £2,066.4m; 2009: £2,328.2m), and committed headroom was £526.7m (2010: £1,013.3m; 2009: £583.0m). Of these facilities, the next material contractual expiry is in December 2015. Largely due to the seasonality of the North American school bus business, headroom tends to reduce from March to October and increase again by March.
The average duration of net debt (excluding ring-fenced cash) at 31 March 2011 was 6.1 years (2010: 6.3 years; 2009: 4.6 years).
The following tables detail the Group’s expected maturity for its non-derivative financial liabilities.
2011 On < 1 1-2 2-5 demand year years years > 5 years Total £m £m £m £m £m £m
Bank debt – revolver – – – 204.7 – 204.7– other – 93.5 163.1 187.1 – 443.7
HP contracts and finance leases – 42.8 43.2 106.3 59.6 251.9Loan notes – – 9.7 – – 9.7Bonds – 73.3 – 298.0 1,119.1 1,490.4Trade payables 312.2 – – – – 312.2
312.2 209.6 216.0 796.1 1,178.7 2,712.6
2010 On < 1 1-2 2-5 demand year years years > 5 years Total £m £m £m £m £m £m
Bank debt – revolver – – 341.8 – – 341.8 – other – – 218.1 336.1 – 554.2
HP contracts and finance leases – 34.6 37.8 86.9 68.1 227.4Loan notes – 0.8 9.7 – – 10.5Bonds – 73.3 – 297.4 1,116.7 1,487.4Trade payables 288.9 – – – – 288.9
288.9 108.7 607.4 720.4 1,184.8 2,910.2
2009 On < 1 1-2 2-5 demand year years years > 5 years Total £m £m £m £m £m £m
Bank debt – term – 209.5 – – – 209.5 – revolver – – – 857.8 – 857.8 – other – 1.2 1.3 548.9 0.1 551.5
HP contracts and finance leases – 34.3 33.1 95.0 66.5 228.9Loan notes – – 10.5 – – 10.5Bonds – 36.0 – 296.9 573.3 906.2Trade payables 314.5 – – – – 314.5
314.5 281.0 44.9 1,798.6 639.9 3,078.9

FirstGroup Annual Report and Accounts 2011 86 FirstGroup Annual Report and Accounts 2011 87
Fina
ncia
l sta
tem
ents
Notes to the consolidated financial statements continued
25 Derivative financial instruments continuedThe following tables detail the Group’s expected maturity of payables/(receivables) for its derivative financial instruments. The amounts in these tables are different to the balance sheet as the table is prepared on an undiscounted cash flow basis.
2011 < 1 1-2 2-5 year years years > 5 years Total £m £m £m £m £m
Interest rate derivatives 15.0 6.2 (4.9) – 16.3 Coupon swaps (15.3) (15.3) (45.9) (45.9) (122.4)Coupon swaps 8.5 8.2 35.5 39.8 92.0 Cross currency swaps (83.2) (317.2) (565.9) – (966.3)Cross currency swaps 94.2 318.2 564.2 – 976.6 Currency derivatives (1.2) – – – (1.2)Fuel derivatives (51.6) (14.9) – – (66.5)
(33.6) (14.8) (17.0) (6.1) (71.5)
2010 < 1 1-2 2-5 year years years > 5 years Total £m £m £m £m £m
Interest rate derivatives 42.9 11.0 (0.2) – 53.7 Coupon swaps (15.3) (15.3) (45.9) (61.2) (137.7)Coupon swaps 4.6 6.4 34.1 64.1 109.2 Cross currency swaps (97.5) (301.2) (571.9) – (970.6)Cross currency swaps 94.5 344.3 609.6 – 1,048.4Fuel derivatives 23.7 14.5 – – 38.2
52.9 59.7 25.7 2.9 141.2
2009 < 1 1-2 2-5 year years years > 5 years Total £m £m £m £m £m
Interest rate derivatives 50.6 32.7 6.2 – 89.5 Coupon swaps (15.3) (15.3) (45.9) (76.6) (153.1)Coupon swaps 13.0 7.4 34.5 71.8 126.7Cross currency swaps (38.6) (79.2) (628.1) – (745.9)Cross currency swaps 39.5 78.4 760.2 – 878.1Fuel derivatives 252.1 54.6 24.2 – 330.9
301.3 78.6 151.1 (4.8) 526.2
Total amounts payable per the tables are £1,089.8m (2010: £1,249.5m; 2009: £1,425.2m). Total amounts receivable per the table are £1,161.3m (2010: £1,108.3m; 2009: £899.0m). For all years above the tables include the settlement of principal amounts at the end of the term of the cross currency swaps.
No derivative financial instruments had collateral requirements or were due on demand in any of the years.
Currency riskCurrency risk is the risk of financial loss to foreign currency net assets, earnings and cash flows reported in Sterling due to movements in exchange rates.
The Group’s principal operations outside the UK are in the US and Canada, with the US being the most significant. Consequently the principal currency risk relates to movements in the US Dollar to Sterling.
Group treasury policy requires a minimum of 30% foreign currency denominated net assets to be hedged.
As at 31 March 2011, 62% (2010: 63%; 2009: 81%) of foreign currency denominated net assets were hedged with related foreign currency debt, debt and currency swaps.
Group treasury policy aims to protect EPS from currency movements. US Dollar earnings arising in the US are substantially protected by US Dollar denominated costs incurred in the UK, principally UK fuel costs, US Dollar interest costs and US Dollar tax costs so that exposure to EPS on a year to year basis is not material. Cash flow exposures are not material.
25 Derivative financial instruments continuedIFRS 7 requires the Group to show the impact on profit after tax and hedging reserve on financial instruments from a movement in exchange rates. The following analysis details the Group’s sensitivity to a 10% strengthening in Sterling against the US Dollar. The analysis has been prepared based on the change taking place at the beginning of the financial year and being held constant throughout the reporting period. A positive number indicates an increase in earnings or equity where Sterling strengthens against the US Dollar. In this case the impact on profit after tax relates only to fuel derivatives for the UK businesses.
2011 2010 2009 £m £m £m
Impact on profit after tax 9.9 15.7 11.6Impact on hedging reserve (0.5) 13.1 36.2
Interest rate riskThe Group has variable rate debt and cash and therefore its net income is exposed to the effects of changes to interest rates. The Group treasury policy objective is to maintain fixed interest rates at a minimum average of 75% of on-balance sheet net debt over the medium-term, so that volatility is substantially reduced year on year to EPS. The main floating rate benchmarks on variable rate debt are US Dollar LIBOR and Sterling LIBOR.
The policy objective is achieved through fixed rate debt and cash flow hedge financial instruments, being interest rate swaps. The interest rate swaps cover periods from April 2011 to March 2015.
At 31 March 2011, 87% (2010: 100%; 2009: 94%) of net debt was fixed. This fixed rate protection had an average duration of 6.7 years (2010: 5.5 years; 2009: 3.2 years).
Interest rate risk within operating leases is hedged 100% by agreeing fixed rentals with the lessors prior to inception of the lease contracts.
Fair value changes in the £250.0m Sterling bond relating to the LIBOR element are hedged with coupon swaps. These swaps match the fair value movements in the bond in the income statement and have the same term as the bond. Interest income is received in January and payments made in March and September each year.
The following sensitivity analysis details the Group’s sensitivity to a 100 basis points (1%) increase in interest rates throughout the reporting period with all other variables held constant.
2011 2010 2009 £m £m £m
Impact on profit after tax (0.8) (0.4) (1.4)Impact on hedging reserve 4.6 10.8 19.5
Interest rate hedges The following table details the notional amounts of interest rate swap contracts outstanding at the reporting date. The average interest rate is based on the outstanding balances at the reporting date. The fair value of interest rate swaps is determined by discounting the future cash flows.
The interest rate swaps settle on a monthly, quarterly or semi-annual basis. The differences between the fixed and floating rates are settled on a net basis.
Average fixed rate Notional principal amount Fair value asset/(liability) 2011 2010 2009 2011 2010 2009 2011 2010 2009 % % % £m £m £m £m £m £m
Less than one year 2.51 4.33 4.03 312 1,007 873 (13.1) (42.9) (51.6)One to two years 2.45 2.51 4.33 94 336 1,047 (2.6) (11.3) (31.1)Two to five years 2.71 2.45 – 493 134 – (0.9) 0.6 (5.8)More than five years 6.13 6.13 6.13 250 250 250 27.7 26.3 22.0
The interest rate swaps with a duration of more than five years are fair value hedges of the LIBOR element within the £250.0m bond and the fixed rate represents interest receivable. All other swaps are cash flow hedges of variable rate interest where the fixed rate is interest payable.

FirstGroup Annual Report and Accounts 2011 88 FirstGroup Annual Report and Accounts 2011 89
Fina
ncia
l sta
tem
ents
Notes to the consolidated financial statements continued
25 Derivative financial instruments continuedFuel price riskThe Group purchases diesel fuel on a floating price basis in its UK Bus, UK Rail, US and Canadian bus operations and therefore is exposed to changes in diesel prices, of which the most significant element is crude oil price risk. The Group’s policy objective is to maintain a significant degree of fixed price protection in the short-term with lower levels of protection over the medium-term, so that the businesses affected are protected from any sudden and significant increases and have time to prepare for potentially higher costs, whilst retaining some access for potentially lower costs over the medium-term. The Group primarily uses fixed rate swap instruments to achieve significant fixed price certainty. During the year to 31 March 2011, the Group was hedged 90% on fuel price risk.
The Group has also entered into swaps for periods from April 2011 to March 2013 with the majority of these swaps relating to the year to 31 March 2012. The swaps give rise to monthly cash flow exchanges with counterparties to offset the underlying settlement of floating price costs, except where they have a deferred start date. Gains or losses on fuel derivatives are recycled from equity to the income statement on qualifying hedges to achieve fixed rate fuel costs within operating results.
The following analysis details the Group’s sensitivity on profit after tax and equity if the price of crude oil had been $10 per barrel higher at the year end.
2011 2010 2009 £m £m £m
Impact on profit after tax (1.8) – 2.1Impact on hedging reserve 18.2 23.2 39.5
Volume at risk for the year to 31 March 2012 is 4.3m barrels (2011: 4.2m; 2010: 4.5m) for which 73% is hedged to diesel price risk.
26 Deferred taxThe major deferred tax liabilities/(assets) recognised by the Group and movements thereon during the current and prior reporting periods are as follows:
Accelerated Other tax temporary Tax depreciation differences losses Total £m £m £m £m
At 1 April 2009 359.7 (118.5) (270.8) (29.6)Charge/(credit) to income (39.9) 58.5 8.5 27.1Charge to equity – 46.4 – 46.4Foreign exchange movements (10.0) (2.5) 2.1 (10.4)
At 31 March 2010 309.8 (16.1) (260.2) 33.5(Credit)/charge to income (30.0) (21.7) 31.7 (20.0)Charge to equity – 49.8 – 49.8Disposal of subsidiary – 1.6 – 1.6Foreign exchange movements (14.9) (3.9) 16.9 (1.9)
At 31 March 2011 264.9 9.7 (211.6) 63.0
Certain deferred tax assets and liabilities have been offset. The following is the analysis of the deferred tax balances for financial reporting purposes:
2011 2010 2009 £m £m £m
Deferred tax assets (30.0) (30.4) (50.2)Deferred tax liabilities 93.0 63.9 20.6
Non-current liabilities/(assets) 63.0 33.5 (29.6)
At the balance sheet date, the aggregate amount of temporary differences associated with undistributed earnings of subsidiaries for which deferred tax liabilities have not been recognised was £67.0m (2010: £142.0m; 2009: £325.0m). No liability has been recognised in respect of these differences because the Group is in a position to control the timing of the reversal of the temporary difference and it is probable that such differences will not reverse in the foreseeable future.
No deferred tax asset has been recognised in respect of £5m (2010: £5m; 2009: £5m) of capital losses.
2011 2010 200927 Provisions £m £m £m
Insurance claims 221.0 243.9 262.0Legal and other 26.4 51.4 59.5FGW contract provision 48.7 – –Pensions 4.7 5.1 5.5
Non-current liabilities 300.8 300.4 327.0
FGW Insurance Legal contract claims1 and other2 provision Pensions Total £m £m £m £m £m
At 1 April 2010 243.9 51.4 – 5.1 300.4Provided in the year 95.4 0.6 48.7 – 144.7Utilised in the year3 (121.2) (22.9) – (0.4) (144.5)Notional interest 19.7 – – – 19.7Foreign exchange movements (16.8) (2.7) – – (19.5)
At 31 March 2011 221.0 26.4 48.7 4.7 300.8
1 Insurance claims accruals due within one year at 31 March 2011 amounted to £119.5m (2010: £131.3m; 2009: £141.1m) and are included in ‘accruals and deferred income’ within note 20. The amount included within provisions above represents the estimate of amounts due after more than one year.
2 Legal and other accruals due within one year at 31 March 2011 amounted to £11.2m (2010: £5.4m; 2009: £12.9m) and are included in ‘accruals and deferred income’ within note 20. The amount included within provisions above represents the estimate of amounts due after more than one year.
3 During the year £7.9m (2010: £7.5m) of fair value provisions established on the Laidlaw acquisition, relating principally to legal and environmental matters, were released to the Income Statement as the actual liabilities were settled during the period at a lower level than had been provided for.
The insurance claims provision arises from estimated exposures for incidents occurring prior to balance sheet date. It is anticipated that the majority of such claims will be settled within the next six years.
Legal and other provisions relate to estimated exposures for cases filed or thought highly likely to be filed for incidents that occurred prior to the balance sheet date. It is anticipated that most of these items will be settled within ten years. Also included are provisions in respect of costs anticipated on the exit of surplus properties which are expected to be settled over the remaining terms of the respective leases.
The provision for future losses on the FGW franchise will be utilised over the remaining term of the franchise which ends in March 2013.
The pensions provision relates to un-funded obligations that arose on the acquisition of certain UK Bus companies. It is anticipated that this will be utilised over ten to twenty years.
2011 2010 200928 Share capital £m £m £m
Allotted, called up and fully paid:482.1m Ordinary shares of 5p each 24.1 24.1 24.1
Number m £m
At 31 March 2009, 31 March 2010 and 31 March 2011 482.1 24.1
The Company has one class of ordinary shares which carries no right to fixed income.

FirstGroup Annual Report and Accounts 2011 90 FirstGroup Annual Report and Accounts 2011 91
Fina
ncia
l sta
tem
ents
Notes to the consolidated financial statements continued
29 ReservesThe hedging reserve records the movement on designated hedging items.
The share premium account represents the premium on shares issued since 1999 and arose principally on the rights issue on the Ryder acquisition in 1999, the rights issue in respect of the Laidlaw International, Inc acquisition and the share placings in 2007 and 2008. The reserve is non-distributable.
The own shares reserve represents the cost of shares in FirstGroup plc purchased in the market and either held as treasury shares or held in trust to satisfy the exercise of share options.
Hedging reserveThe movements in the hedging reserve were as follows:
2011 2010 2009 £m £m £m
Balance at 1 April (114.0) (352.8) 49.7Gains/(losses) recognised:Interest rate swaps (5.5) (15.7) (48.6)Currency forwards 1.2 – 29.8Cross currency swaps 53.2 34.9 (153.9)Fuel derivatives 89.0 17.6 (328.7)Charged/(credited) to income statement:Interest rate swaps 35.4 53.4 26.3Currency forwards – – 0.5Fuel derivatives 20.1 249.0 (65.0)Tax on derivative hedging instrument movements (44.0) (100.4) 137.1
Balance at 31 March 35.4 (114.0) (352.8)
Own sharesThe number of own shares held by the Group at the end of the year was 1,279,912 (2010: 1,860,479; 2009: 1,286,546) FirstGroup plc ordinary shares of 5p each. Of these, 978,505 (2010: 851,506; 2009: 981,352) were held by the FirstGroup plc Employee Benefit Trust, 32,520 (2010: 32,520; 2009: 32,520) by the FirstGroup plc Qualifying Employee Share Ownership Trust and 268,887 (2010: 976,453; 2009: 272,674) were held as treasury shares. Both trusts and treasury shares have waived the rights to dividend income from the FirstGroup plc ordinary shares. The market value of the shares at 31 March 2011 was £4.2m (2010: £6.7m; 2009: £3.4m).
Capital redemption Capital Total other reserve reserve reserves Other reserves £m £m £m
At 31 March 2011, 31 March 2010 and 31 March 2009 1.9 2.7 4.6
There have been no movements on the capital redemption reserve or capital reserve during the year ended 31 March 2011. The capital redemption reserve represents the cumulative par value of all shares bought back and cancelled. The reserve is non-distributable. The capital reserve arose on acquisitions in 2000. The reserve is non-distributable.
30 Translation reserve £m
At 1 April 2009 as previously reported 337.4Prior year adjustment (23.2)
Balance at 1 April 2009 as restated 314.2Movement for the financial year (14.2)
At 31 March 2010 as restated 300.0Movement for the financial year (143.4)
At 31 March 2011 156.6
The translation reserve records exchange differences arising from the translation of the balance sheets of foreign currency denominated subsidiaries offset by movements on loans used to hedge the net investment in those foreign subsidiaries.
31 Acquisition and disposal of businesses and subsidiary undertakingsAcquisitions of businesses and subsidiary undertakings 2011 2010 2009 £m £m £m
Provisional fair values of net assets acquired:Property, plant and equipment 1.0 – 2.3Other current assets – – 0.7Other liabilities (0.2) – (1.7)Net debt – – (1.3)
0.8 – –Goodwill (note 13) 2.3 – 6.5
Satisfied by cash paid and payable 3.1 – 6.5
The business acquired during the year contributed £0.3m (2010: £nil; 2009: £2.0m) to the Group’s net operating cash flows and utilised £nil (2010: £nil; 2009: £0.5m) for capital expenditure.
The business acquired during the year contributed £1.1m (2010: £nil; 2009: £7.4m) to Group revenue and £0.3m (2010: £nil; 2009: £0.2m) to Group adjusted operating profit from date of acquisition to 31 March 2011.
If the acquisition of the business acquired during the year had been completed on the first day of the financial year, Group revenue from this acquisition for the period would have been £3.0m (2010: £nil; 2009: £8.6m) and the Group adjusted operating profit from this acquisition attributable to equity holders of the parent would have been £0.5m (2010: £nil; 2009: £0.3m).
The business acquired during the year to 31 March 2011 was:
% voting equity Date instruments acquired acquired
Star Shuttle Company 100 29 October 2010
2011 2010 2009Disposal of businesses and subsidiary undertakings £m £m £m
Fair values of net assets disposed of:Goodwill 14.2 – –Property, plant and equipment 3.8 0.4 –Current assets 12.0 0.9 –Cash and cash equivalents – 0.4 –Deferred tax (1.6) – –Other liabilities (10.8) (0.9) –
17.6 0.8 –Profit on disposal 6.7 – –
Satisfied by cash received and receivable 24.3 0.8 –
Net cash inflow arising on disposal:Cash consideration 24.3 0.8 –Cash and cash equivalents disposed of – (0.4) –
24.3 0.4 –
On 28 May 2010, the Group disposed of its interest in GB Railfreight. The impact of GB Railfreight on the Group’s results in the current and prior periods is disclosed in note 10.
On 9 January 2010, the Group disposed of its interest in FirstInfo Limited at its net book value. The details of this disposal are included in the 2010 figures in the table above. The impact on the Group’s results for year ended 31 March 2010 was immaterial.

FirstGroup Annual Report and Accounts 2011 92 FirstGroup Annual Report and Accounts 2011 93
Fina
ncia
l sta
tem
ents
Notes to the consolidated financial statements continued
2011 201032 Net cash from operating activities £m £m
Operating profit before loss on disposal of properties 313.7 365.3Operating profit of discontinued operations 0.3 4.3Adjustments for:Depreciation charges 321.0 315.7Amortisation charges 42.9 34.7Impairment charges 19.5 –Share-based payments 7.7 5.5Loss on disposal of property, plant and equipment 3.7 0.8
Operating cash flows before working capital 708.8 726.3(Increase)/decrease in inventories (3.2) 14.8Decrease/(increase) in receivables 25.9 (5.4)Increase/(decrease) in payables 55.7 (54.8)Increase/(decrease) in provisions 0.4 (34.1)Defined benefit pension payments in excess of income statement charge (43.5) (42.1)
Cash generated by operations 744.1 604.7Tax paid (25.0) (1.3)Interest paid (155.2) (142.9)Interest element of HP contracts and finance leases (8.2) (8.2)
Net cash from operating activities 555.7 452.3
33 Contingent liabilities and assetsTo support subsidiary undertakings in their normal course of business, the Company and certain subsidiaries have indemnified certain banks and insurance companies who have issued performance bonds for £460.2m (2010: £458.2m; 2009: £569.8m) and letters of credit for £316.7m (2010: £335.1m; 2009: £331.5m). The performance bonds relate to the North American businesses of £260.8m (2010: £260.0m; 2009: £373.3m) and the UK Rail franchise operations of £199.4m (2010: £198.2m; 2009: £196.5m). The letters of credit relate substantially to insurance arrangements in the UK and North America.
The Company has provided unsecured loan facilities of £87.5m (2010: £96.4m; 2009: £103.0m) to First Greater Western Limited, a £46.0m (2010: £46.0m; 2009: £46.0m) unsecured loan facility to First Capital Connect Limited, a £3.2m (2010: £3.2m; 2009: £3.2m) unsecured loan facility to First/Keolis TransPennine Limited, and a £13.6m (2010: £13.6m; 2009: £13.6m) unsecured loan facility to First ScotRail Limited. Under these facilities, £46.5m (2010: £96.4m; 2009: £103.0m) was drawn at 31 March 2011 by First Greater Western Limited and £25.0m (2010: £35.0m; 2009: £25.0m) was drawn at 31 March 2011 by First Capital Connect Limited.
The Company is party to certain unsecured guarantees granted to banks for overdraft and cash management facilities provided to itself and subsidiary undertakings. The Company has given certain unsecured guarantees for the liabilities of its subsidiary undertakings arising under certain loan notes, hire purchase contracts, finance leases, operating leases and certain pension scheme arrangements. It also provides unsecured cross guarantees to certain subsidiary undertakings as required by VAT legislation. UK Bus subsidiaries have provided unsecured guarantees on a joint and several basis to the Trustees of the UK Bus Occupational Pension Scheme.
Certain of the Company’s subsidiaries have issued unsecured guarantees to the Company’s Sterling bondholders, to lenders participating in the Group’s £779.2m (2010: £1,511.8m; 2009: £1,777.0m) syndicated unsecured bank facilities and to lenders of certain bilateral bank facilities for £443.7m (2010: £554.5m; 2009: £551.2m).
In late March 2011 the Group became aware of operational and financial uncertainties in relation to DSBFirst in which the Group holds a 30% stake. The Group has provided for the equity and loan investment in DSBFirst and is currently in discussions with DSB and taking legal advice to fully understand the extent to which any further potential liabilities could arise. On 7 March 2011, the Group exercised its put option to sell its stake in DSBFirst and therefore exit terms are also under discussion. The Group has issued guarantees of £11.0m to Danish and Swedish authorities in relation to DSBFirst.
In its normal course of business UK Rail has ongoing contractual negotiations with governmental and other organisations.
2011 2010 200934 Operating lease arrangements £m £m £m
Minimum lease payments made under operating leases recognised in the income statement for the year:Plant and machinery 22.6 14.8 21.5Track and station access 380.0 388.4 608.5Hire of rolling stock 169.8 163.7 152.3Other assets 68.6 72.7 64.2
641.0 639.6 846.5
At the balance sheet dates, the Group had outstanding commitments for future minimum lease payments under non-cancellable operating leases, which fall due as follows:
2011 2010 2009 £m £m £m
Within one year 631.9 642.4 624.7In the second to fifth years inclusive 1,635.0 1,881.4 2,223.0After five years 107.3 134.7 308.5
2,374.2 2,658.5 3,156.2
Included in the above commitments are contracts held by the UK Rail businesses with Network Rail for access to the railway infrastructure track, stations and depots of £1,533.2m (2010: £1,757.9m; 2009: £2,081.1m). They also have contracts under which they lease rolling stock of £492.0m (2010: £555.9m; 2009: £689.9m).
35 Share-based paymentsEquity-settled share option plansThe Group recognised total expenses of £7.7m (2010: £5.5m; 2009: £6.3m) related to equity-settled share-based payment transactions.
(a) Save as you earn (SAYE)The Group operates an Inland Revenue approved savings related share option scheme. Grants were made as set out below. The scheme is based on eligible employees being granted options and their agreement to opening a sharesave account with a nominated savings carrier and to save weekly or monthly over a specified period. Sharesave accounts are held with Yorkshire Building Society. The right to exercise the option is at the employee’s discretion at the end of the period previously chosen for a period of six months.
SAYE SAYE SAYE SAYE SAYE SAYE April 2006 Dec 2006 Dec 2007 Dec 2008 Dec 2009 Dec 2010 Options Options Options Options Options Options Number Number Number Number Number Number
Outstanding at the beginning of the year 1,265 1,789,363 1,514,616 2,224,615 2,900,694 –Awarded during the year – – – – – 2,999,495Exercised during the year – – (1,595) (2,878) (3,093) –Lapsed during the year (1,265) (1,789,363) (1,389,721) (272,935) (271,508) (33,882)
Outstanding at the end of the year – – 123,300 1,948,802 2,626,093 2,965,613
Exercisable at the end of the year – – 123,300 – – –Weighted average exercise price (pence) 325.0 444.0 583.0 371.0 310.0 319.0Weighted average share price at date of exercise (pence) N/A N/A 376.8 382.1 369.3 N/A
(b) Executive share option scheme (ESOS)Options are exercisable between three and ten years of the date of grant provided that the pre-determined performance criteria are met.
ESOS 2001 ESOS 2002 ESOS 2003 ESOS 2004 Options Options Options Options Number Number Number Number
Outstanding at the beginning of the year 248,911 349,362 456,582 500,976Exercised during the year (200,682) (274,220) (176,957) (225,370)
Outstanding at the end of the year 48,229 75,142 279,625 275,606
Exercisable at the end of the year 48,229 75,142 279,625 275,606Weighted average exercise price (pence) 346.5 269.0 287.0 275.1Weighted average share price at date of exercise (pence) 373.4 365.7 373.1 374.2

FirstGroup Annual Report and Accounts 2011 94 FirstGroup Annual Report and Accounts 2011 95
Fina
ncia
l sta
tem
ents
Notes to the consolidated financial statements continued
35 Share-based payments continued(c) Deferred bonus shares (DBS) DBS 2004 DBS 2005 DBS 2006 DBS 2007 DBS 2008 DBS 2009 DBS 2010 Options Options Options Options Options Options Options Number Number Number Number Number Number Number
Outstanding at the beginning of the year 47,509 95,193 635,317 479,930 397,026 370,667 –Granted during the year – – – – – – 451,373Forfeited during the year – – (19,335) (21,382) (20,380) (22,897) –Exercised during the year (34,829) (43,165) (62,499) (50,480) (58,663) (62,499) (18,797)
Outstanding at the end of the year 12,680 52,028 553,483 408,068 317,983 285,271 432,576
Exercisable at the end of the year 12,680 52,028 – – – – –Weighted average exercise price (pence) Nil Nil Nil Nil Nil Nil NilWeighted average share price at date of exercise (pence) 371.6 374.3 378.9 379.2 384.1 382.7 386.0
(d) Buy As You Earn (BAYE) schemeBAYE enables eligible employees to purchase shares from their gross income. The Company provides two matching shares for every three shares bought by employees, subject to a maximum Company contribution of shares to the value of £20 per employee per month. If the shares are held in trust for five years or more, no income tax and national insurance will be payable. The matching shares will be forfeited if the corresponding partnership shares are removed from trust within three years of award.
At 31 March 2011 there were 7,985 (2010: 7,833; 2009: 7,436) participants in the BAYE scheme who have cumulatively purchased 5,651,985 (2010: 4,583,431; 2009: 3,494,553) shares with the Company contributing 1,689,837 (2010: 1,349,661; 2009: 1,011,049) matching shares on a cumulative basis.
(e) Long Term Incentive Plan (LTIP)Awards under the LTIP scheme vest over the three year periods to 31 March from year of award with 50% of the award being dependent upon EPS performance over the vesting period and the other 50% being dependent upon total shareholder return over the same period compared to the comparator group of 100 companies.
LTIP 2008 LTIP 2009 LTIP 2010 Options Options Options Number Number Number
Outstanding at the beginning of the year 1,532,440 3,493,717 –Granted during the year – – 4,155,216Forfeited during the year (74,042) (112,570) (191,606)
Outstanding at the end of the year 1,458,398 3,381,147 3,963,610
(f) Tim O’Toole retention award
2011 2010 2009 Award price Number Number Number (p)
At the end of the year 214,826 – – nil
These options vest on 1 November 2013 subject to the Executive remaining in office until this date. There are no performance conditions attaching to these options.
35 Share-based payments continuedThe fair values of the options granted during the last two years were measured using a Black-Scholes model. The inputs into the Black-Scholes model were as follows:
2011 2010
Weighted average share price (pence)– DBS 384.0 365.0– SAYE December 2009 – 395.0– SAYE December 2010 387.0 –– LTIP 383.3 392.3– Tim O’Toole retention award 386.3 –Weighted average exercise price (pence)– DBS – –– SAYE December 2009 – 310.0– SAYE December 2010 319.0 –– LTIP – –– Tim O’Toole retention award – –Expected volatility– DBS 35% 35%– SAYE December 2009 – 35%– SAYE December 2010 35% –– LTIP 35% 35%– Tim O’Toole retention award 35% –Expected life (years)– SAYE schemes 3 3– DBS 3 3– LTIP 3 3– Tim O’Toole retention award 2.75 –Rate of interest– DBS 1.8% 2.0%– SAYE December 2009 – 2.0%– SAYE December 2010 1.4% –– LTIP 1.6% 2.0%– Tim O’Toole retention award 1.5% –Expected dividend yield– DBS 5.0% 3.0%– SAYE December 2009 – 4.8%– SAYE December 2010 4.8% –– LTIP 5.0% 4.8%– Tim O’Toole retention award 4.8% –
Expected volatility was determined by calculating the historical volatility of the Group’s share price over the previous five years. The expected life used in the model has been adjusted based on management’s best estimate, for the effects of non-transferability, exercise restrictions, and behavioural considerations.
Allowances have been made for the SAYE schemes for the fact that, amongst a group of recipients some are expected to leave before an entitlement vests. The accounting charge is then adjusted over the vesting period to take account of actual forfeitures, so although the total charge is unaffected by the pre-vesting forfeiture assumption, the timing of the recognition of the expense will be sensitive to it. Fair values for the SAYE include a 10% p.a. pre-vesting leaver assumption whereas the Executive, LTIP and deferred share plans exclude any allowance for pre-vesting forfeitures.
The Group used the inputs noted above to measure the fair value of the new share options.

FirstGroup Annual Report and Accounts 2011 96 FirstGroup Annual Report and Accounts 2011 97
Fina
ncia
l sta
tem
ents
Notes to the consolidated financial statements continued
36 Retirement benefit schemesDefined contribution schemesThe Group operates defined contribution retirement benefit schemes for all qualifying employees. The assets of the schemes are held separately from those of the Group in funds under the control of trustees. Where there are employees who leave the schemes prior to vesting fully in the contributions, the contributions payable by the Group are reduced by the amount of forfeited contributions.
The total cost charged to income of £5.9m (2010: £4.0m; 2009: £6.3m) represents contributions payable to these schemes by the Group at rates specified in the rules of the plans.
Defined benefit schemesThe Group operates or participates in a number of pension schemes which cover the majority of UK employees and certain North American employees. These are principally defined benefit schemes under which benefits provided are based on employees’ number of years of service and either career average or final salary. The scope of benefits varies between schemes. The assets of the schemes are held in separately administered trusts which are managed independently of the Group’s finances by investment managers appointed by the schemes’ trustees.
The various defined benefit schemes include six UK Bus Division schemes where the subsidiary undertaking is a participating employer in a scheme operated by a local authority. These schemes are subject to relevant local government regulations.
First Greater Western Limited, First Capital Connect Limited, First ScotRail Limited and First TransPennine Express have sections in the Railways Pension Scheme (RPS), which is an industry-wide arrangement. Under the terms of the RPS, any fund deficit or surplus is shared by the employer (60%) and the employees (40%). In calculating the Group’s pension obligations in respect of the RPS the Group has calculated the total pension deficits in each of the RPS sections in accordance with IAS 19. These deficits are reduced by a ‘franchise adjustment’ which is that portion of the deficit which is projected to exist at the end of the franchise and for which the Group will not be required to fund. The franchise adjustment, which has been calculated by the Group’s actuaries, is offset against the present value of the RPS liabilities so as to fairly present the financial performance, position and cash flows of the Group’s obligations.
At their last triennial valuations, the defined benefit schemes had funding levels between 61.0% and 122.4% (2010: 74.0% and 122.4%; 2009: 74.0% and 122.4%). The market value of the assets at 31 March 2011 for all defined benefit schemes totalled £3,289m (2010: £3,127m; 2009: £2,465m).
Contributions are paid to all defined benefit schemes in accordance with rates recommended by the schemes’ actuaries. The valuations are made using the Projected Unit Credit Method.
The valuation assumptions used for accounting purposes have been made uniform to Group standards, as appropriate, when each scheme is actuarially valued.
UK UK North UK UK North UK UK North Bus Rail America Bus Rail America Bus Rail America 2011 2011 2011 2010 2010 2010 2009 2009 2009 % % % % % % % % %
Key assumptions used:Discount rate 5.50 5.50 5.25 5.60 5.60 5.65 6.75 6.75 6.15Expected return on scheme assets 7.90 7.90 6.90 7.90 7.90 7.40 7.75 7.75 7.50Expected rate of salary increases 4.2 4.2 – 4.4 4.4 – 4.1 4.1 3.0Inflation – RPI 3.2 3.2 2.25 3.4 3.4 2.0 2.6 2.6 2.0Inflation – CPI 2.4 2.4 – – – – – – –Future pension increases 2.4/3.1 2.4 – 3.4 3.4 – 2.5 2.5 –
During the year the Government announced its intention to change the measure that it uses for cost of living increases to public sector pensions and to change the basis for the statutory revaluation and indexation of occupational pension schemes in the private sector. Increases to pensions in payment and deferred pensions in the Local Government Pension Schemes and the RPS are expected to be linked to the rise in CPI in future rather than the rise in RPI, as are revaluations to deferred pensions in the UK Bus Occupational and Group Schemes. As a result of this pension liabilities are £84.9m lower as at 31 March 2011.
36 Retirement benefit schemes continued(a) Income statementAmounts (charged)/credited to the income statement in respect of these defined benefit schemes are as follows:
UK UK North Bus Rail America TotalYear to 31 March 2011 £m £m £m £m
Current service cost (31.9) (51.5) (4.4) (87.8)Interest cost (87.8) (42.2) (34.1) (164.1)Expected return on scheme assets 121.6 52.4 31.1 205.1Interest on franchise adjustment – 5.7 – 5.7
1.9 (35.6) (7.4) (41.1)
UK UK North Bus Rail America Total Year to 31 March 2010 £m £m £m £m
Current service cost (17.6) (36.7) (2.4) (56.7)Interest cost (83.0) (37.6) (30.3) (150.9)Expected return on scheme assets 98.9 37.3 23.6 159.8Interest on franchise adjustment – 5.1 – 5.1
(1.7) (31.9) (9.1) (42.7)
Actuarial gains and losses have been reported in the consolidated statement of comprehensive income.
The actual return on scheme assets was:
2011 2010 £m £m
UK Bus 98.3 307.5UK Rail 74.1 251.6North America 21.8 122.1
194.2 681.2

FirstGroup Annual Report and Accounts 2011 98 FirstGroup Annual Report and Accounts 2011 99
Fina
ncia
l sta
tem
ents
Notes to the consolidated financial statements continued
36 Retirement benefit schemes continued(b) Balance sheetThe amounts included in the balance sheet arising from the Group’s obligations in respect of its defined benefit pension schemes are as follows:
UK UK North Bus Rail America Total At 31 March 2011 £m £m £m £m
Fair value of schemes’ assets 1,701.6 1,114.3 473.0 3,288.9Present value of defined benefit obligations (1,649.8) (1,333.3) (631.4) (3,614.5)
(Deficit)/surplus before adjustments 51.8 (219.0) (158.4) (325.6)Adjustment for irrecoverable surplus1 (81.9) – – (81.9)UK Rail franchise adjustment (table (e)) (60%) – 76.7 – 76.7Adjustment for employee share of RPS deficits (40%) – 87.6 – 87.6
Deficit in schemes (30.1) (54.7) (158.4) (243.2)
Liability recognised in the balance sheet (30.1) (54.7) (158.4) (243.2)
This amount is presented in the consolidated balance sheet as follows: Non-current assets 30.7 – – 30.7Non-current liabilities (60.8) (54.7) (158.4) (273.9)
(30.1) (54.7) (158.4) (243.2)
1 The irrecoverable surplus represents the amount of the surplus that the Group could not recover through reducing future company contributions to Local Government Pension Schemes.
UK UK North Bus Rail America Total At 31 March 2010 £m £m £m £m
Fair value of schemes’ assets 1,605.9 1,026.3 494.5 3,126.7Present value of defined benefit obligations (1,734.9) (1,388.9) (651.8) (3,775.6)
Deficit before adjustments (129.0) (362.6) (157.3) (648.9)UK Rail franchise adjustment (table (e)) (60%) – 173.0 – 173.0Adjustment for employee share of RPS deficits (40%) – 145.1 – 145.1
Deficit in schemes (129.0) (44.5) (157.3) (330.8)
Liability recognised in the balance sheet (129.0) (44.5) (157.3) (330.8)
This amount is presented in the consolidated balance sheet as follows:Non-current assets 3.1 – – 3.1Non-current liabilities (132.1) (44.5) (157.3) (333.9)
(129.0) (44.5) (157.3) (330.8)
UK UK North Bus Rail America Total At 31 March 2009 £m £m £m £m
Fair value of schemes’ assets 1,296.8 744.1 424.0 2,464.9Present value of defined benefit obligations (1,257.8) (944.3) (587.5) (2,789.6)
(Deficit)/surplus before adjustments 39.0 (200.2) (163.5) (324.7)UK Rail franchise adjustment (table (e)) (60%) – 75.9 – 75.9Adjustment for employee share of RPS deficits (40%) – 80.1 – 80.1
(Deficit)/surplus in schemes 39.0 (44.2) (163.5) (168.7)
(Liability)/asset recognised in the balance sheet 39.0 (44.2) (163.5) (168.7)
This amount is presented in the consolidated balance sheet as follows: Non-current assets 91.2 – 20.3 111.5Non-current liabilities (52.2) (44.2) (183.8) (280.2)
39.0 (44.2) (163.5) (168.7)
36 Retirement benefit schemes continued(c) Defined benefit obligations (DBO)Movements in the present value of DBO were as follows:
UK UK North Bus Rail America Total £m £m £m £m
At 1 April 2010 1,734.9 1,388.9 651.8 3,775.6Current service cost 31.9 51.5 4.4 87.8Interest cost 87.8 42.2 34.1 164.1Employee share of change in DBO (not attributable to franchise adjustment) 28.6 (1.6) 1.6 28.6Actuarial (gain)/loss (167.6) (93.0) 34.0 (226.6)Benefit payments (65.8) (30.7) (56.2) (152.7)Settlement payment – (24.0) – (24.0)Currency gain – – (38.3) (38.3)
At 31 March 2011 1,649.8 1,333.3 631.4 3,614.5
UK UK North Bus Rail America Total £m £m £m £m
At 1 April 2009 1,257.8 944.3 587.5 2,789.6Current service cost 17.6 36.7 2.4 56.7Interest cost 83.0 37.6 30.3 150.9Employee contributions 25.4 22.7 1.2 49.3Employee share of change in DBO (not attributable to franchise adjustment) – 165.6 – 165.6Actuarial loss 405.9 214.2 89.3 709.4Benefit payments (54.8) (32.2) (66.6) (153.6)Currency loss – – 7.7 7.7
At 31 March 2010 1,734.9 1,388.9 651.8 3,775.6
UK UK North Bus Rail America Total £m £m £m £m
At 1 April 2008 1,276.1 1,003.8 508.4 2,788.3Acquisitions 20.6 44.8 4.7 70.1Current service cost – – (3.0) (3.0)Past service cost 85.6 40.7 32.3 158.6Interest cost 23.6 22.2 1.6 47.4Employee share of change in DBO (not attributable to franchise adjustment) – (38.4) – (38.4)Actuarial gain (94.4) (104.1) (50.7) (249.2)Benefit payments (53.7) (24.7) (58.2) (136.6)Settlements – – (3.2) (3.2)Currency loss – – 155.6 155.6
At 31 March 2009 1,257.8 944.3 587.5 2,789.6

FirstGroup Annual Report and Accounts 2011 100 FirstGroup Annual Report and Accounts 2011 101
Fina
ncia
l sta
tem
ents
Notes to the consolidated financial statements continued
36 Retirement benefit schemes continued(d) Fair value of schemes’ assetsMovements in the fair value of schemes’ assets were as follows:
UK UK North Bus Rail America Total £m £m £m £m
At 1 April 2010 1,605.9 1,026.3 494.5 3,126.7Expected return on assets 121.6 52.4 31.1 205.1Company contributions 34.7 38.6 11.3 84.6Employee contributions 28.5 23.5 1.7 53.7Employee share of return on assets – 29.6 – 29.6Actuarial (loss)/gain on assets (23.3) (8.0) 18.0 (13.3)Benefits paid from schemes (65.8) (30.7) (56.2) (152.7)Settlement payment – (17.4) – (17.4)Currency loss – – (27.4) (27.4)
At 31 March 2011 1,701.6 1,114.3 473.0 3,288.9
UK UK North Bus Rail America Total £m £m £m £m
At 1 April 2009 1,296.8 744.1 424.0 2,464.9Expected return on assets 98.9 37.3 23.6 159.8Company contributions 31.0 40.1 13.7 84.8Employee contributions 25.4 22.7 1.2 49.3Employee share of return on assets – 100.6 – 100.6Actuarial gain on assets 208.6 113.7 83.2 405.5Benefits paid from schemes (54.8) (32.2) (66.6) (153.6)Currency gain – – 15.4 15.4
At 31 March 2010 1,605.9 1,026.3 494.5 3,126.7
UK UK North Bus Rail America Total £m £m £m £m
At 1 April 2008 1,477.1 977.7 456.6 2,911.4Expected return on assets 110.2 50.0 36.0 196.2Company contributions 27.7 38.9 14.4 81.0Employee contributions 23.6 22.2 1.6 47.4Employee share of return on assets – (108.0) – (108.0)Actuarial loss on assets (288.1) (212.0) (140.4) (640.5)Benefits paid from schemes (53.7) (24.7) (58.2) (136.6)Settlements – – (3.2) (3.2)Currency gain – – 117.2 117.2
At 31 March 2009 1,296.8 744.1 424.0 2,464.9
36 Retirement benefit schemes continued(e) UK Rail franchise adjustmentMovements in the total UK Rail franchise adjustment were as follows:
2011 2010 2009 £m £m £m
At 1 April 288.3 126.5 (23.0)Interest on franchise adjustment 5.7 5.1 (0.8)Employee share of change in franchise adjustment (64.2) 64.7 59.6Actuarial (loss)/gain on franchise adjustment (102.0) 92.0 90.7
At 31 March 127.8 288.3 126.5
Under the terms of the RPS cost sharing this franchise adjustment is split 60:40 between the employer and the employees. This is reflected in table (b) which shows the Group’s 60% share of the franchise adjustment.
(f) Asset allocation and expected return on assetsThe analysis of the schemes’ assets at the balance sheet dates and the expected rates of return on assets were as follows:
2011 2011 2011 2011 UK Bus UK Rail North America Total % £m % £m % £m £m
Equities 8.85 720.9 8.85 – 9.0 233.6 954.5Bonds 5.2 535.4 5.2 52.8 4.65 203.0 791.2Property 6.85 107.4 6.85 – 7.5 12.3 119.7Cash 4.3 39.4 4.3 3.8 4.0 5.6 48.8Infrastructure 8.0 – 8.0 58.4 8.0 – 58.4Cash plus 8.85 219.0 8.85 869.8 6.0 18.5 1,107.3Private equity 9.0 68.8 9.0 129.5 – – 198.3Other 1.0 10.7 1.0 – 1.0 – 10.7
1,701.6 1,114.3 473.0 3,288.9
2010 2010 2010 2010 UK Bus UK Rail North America Total % £m % £m % £m £m
Equities 9.05 773.4 9.05 682.7 9.0 246.9 1,703.0Bonds 5.3 449.6 5.3 100.8 4.6 181.0 731.4Property 7.6 103.5 7.6 87.9 7.5 11.9 203.3Cash 4.4 105.9 4.4 1.0 3.5 10.9 117.8Infrastructure 8.0 – 8.0 60.9 8.0 – 60.9Cash plus 9.05 169.0 9.05 93.0 9.0 43.8 305.8Other 1.0 4.5 1.0 – 1.0 – 4.5
1,605.9 1,026.3 494.5 3,126.7
2009 2009 2009 2009 UK Bus UK Rail North America Total % £m % £m % £m £m
Equities 8.65 564.7 8.65 451.2 9.0 206.3 1,222.2Bonds 6.5 447.8 6.5 75.0 5.5 175.6 698.4Property 6.8 90.1 6.8 74.1 7.5 12.7 176.9Cash 4.0 35.6 4.0 2.4 4.0 5.2 43.2Infrastructure 8.0 – 8.0 61.2 8.0 – 61.2Cash plus 8.65 133.7 8.65 80.2 9.0 24.2 238.1Other 1.0 24.9 1.0 – 1.0 – 24.9
1,296.8 744.1 424.0 2,464.9
The expected rates of return on assets at all balance sheet dates were determined by looking at the individual asset classes and applying a model developed by an independent firm of actuaries.

FirstGroup Annual Report and Accounts 2011 102 FirstGroup Annual Report and Accounts 2011 103
Fina
ncia
l sta
tem
ents
36 Retirement benefit schemes continued(g) History of experience adjustmentsThe history of experience adjustments is as follows:
2011 2010 2009 2008 2007UK Bus £m £m £m £m £m
Fair value of schemes’ assets 1,701.6 1,605.9 1,296.8 1,477.1 1,485.7Present value of defined benefit obligations (1,649.8) (1,734.9) (1,257.8) (1,276.1) (1,438.4)Irrecoverable surplus (81.9) – – (30.7) (6.8)
(Deficit)/surplus in the schemes (30.1) (129.0) 39.0 170.3 40.5
Experience gain on scheme assets – Amount (£m) 23.3 208.6 (288.1) (151.8) (1.7)
– Percentage of scheme assets (%) 1.4 13.0 (22.2) (10.3) (0.1)
Experience gain on scheme liabilities – Amount (£m) (96.3) 38.3 (30.2) 33.7 27.8
– Percentage of scheme liabilities (%) (5.8) 2.2 (2.4) 2.6 1.9
2011 2010 2009 2008 2007UK Rail £m £m £m £m £m
Fair value of schemes’ assets 1,114.3 1,026.3 744.1 977.7 998.6Present value of defined benefit obligations (1,333.3) (1,388.9) (944.3) (1,003.8) (1,024.1)Rail franchise adjustment (60%) 76.7 173.0 75.9 (13.8) 2.2Adjustment for employee share of RPS deficits (40%) 87.6 145.1 80.1 10.4 10.2
Deficit in the schemes (54.7) (44.5) (44.2) (29.5) (13.1)
Experience gain on scheme assets– Amount (£m) 8.0 113.7 (212.0) (66.7) 16.7
– Percentage of scheme assets (%) 1.2 18.5 (47.5) (11.4) 2.8
Experience gain on scheme liabilities– Amount (£m) 8.6 25.4 74.3 (12.3) (15.4)
– Percentage of scheme liabilities (%) 1.1 3.0 13.1 (2.0) (2.5)
Experience gain (including gain on franchise adjustment) on scheme liabilities – Amount (£m) 110.7 117.3 164.9 (28.4) (13.6)
– Percentage of scheme liabilities (%) 13.8 14.1 29.1 (4.7) (2.2)
The calculations of percentages of UK Rail scheme assets and liabilities, above, use 60% of the assets and 60% of the liabilities as the denominator.
2011 2010 2009 2008 2007North America £m £m £m £m £m
Fair value of schemes’ assets 473.0 494.5 424.0 456.6 22.4Present value of defined benefit obligations (631.4) (651.8) (587.5) (508.4) (26.0)
Deficit in the schemes (158.4) (157.3) (163.5) (51.8) (3.6)
Experience gain on scheme assets– Amount (£m) (18.0) 83.2 (140.4) (37.7) 0.8
– Percentage of scheme assets (%) (3.8) 16.8 (33.1) (8.3) 3.6
Experience gain on scheme liabilities– Amount (£m) 13.1 (20.4) (6.1) – –
– Percentage of scheme liabilities (%) 2.1 (3.1) (1.0) – –
36 Retirement benefit schemes continued 2011 2010 2009 2008 2007Total Group £m £m £m £m £m
Fair value of schemes’ assets 3,288.9 3,126.7 2,464.9 2,911.4 2,506.7Present value of defined benefit obligations (3,614.5) (3,775.6) (2,789.6) (2,788.3) (2,488.5)Irrecoverable surplus (81.9) – – (30.7) (6.8)Rail franchise adjustment (60%) 76.7 173.0 75.9 (13.8) 2.2Adjustment for employee share of RPS deficits (40%) 87.6 145.1 80.1 10.4 10.2
(Deficit)/surplus in the schemes (243.2) (330.8) (168.7) 89.0 23.8
Experience gain on scheme assets– Amount (£m) 13.2 405.5 (640.5) (256.2) 15.8
– Percentage of scheme assets (%) 0.5 14.9 (29.6) (10.1) 0.7
Experience gain on scheme liabilities– Amount (£m) (74.5) 43.3 38.0 21.4 12.4
– Percentage of scheme liabilities (%) (2.4) 1.3 1.6 0.9 0.6
Experience gain (including gain on franchise adjustment) on scheme liabilities– Amount (£m) 27.5 135.2 128.6 5.2 14.2
– Percentage of scheme liabilities (%) 0.9 4.2 5.3 0.2 0.7
The calculations of percentages of Total Group scheme assets above, use 100% of UK Bus and North America assets and 60% of UK Rail assets as the denominator. The calculations of percentages of Total Group scheme liabilities above use 100% of UK Bus and North America liabilities and 60% of UK Rail liabilities as the denominator.
The estimated amounts of contributions expected to be paid to the schemes during the financial year to 31 March 2012 is £113.1m (year to 31 March 2011: £86.2m).
(h) Accounting for UK Rail pension arrangementsHad the Group accounted for UK Rail pensions as if the respective franchises had an indefinite duration, the impact on the financial statements would have been as follows:
2011 2010 2009 £m £m £m
Balance sheetPension deficit (76.7) (173.0) (75.9)Intangible assets (6.5) (21.2) (28.3)Deferred tax 21.6 54.4 29.2
Impact on net assets (61.6) (139.8) (75.0)
Income statementUnwinding of discount on franchise adjustment (5.7) (5.1) 0.8 Intangible asset amortisation 14.7 7.1 7.1Deferred tax (2.3) (0.6) (2.2)
Impact on profit for the year from continuing operations 6.7 1.4 5.7
Consolidated statement of comprehensive incomeActuarial losses/(gains) on franchise adjustment 102.0 (92.0) (90.7)Deferred tax on actuarial losses/(gains) (26.5) 25.8 25.4
75.5 (66.2) (65.3)
Notes to the consolidated financial statements continued

FirstGroup Annual Report and Accounts 2011 104 FirstGroup Annual Report and Accounts 2011 105
Fina
ncia
l sta
tem
ents
36 Retirement benefit schemes continued(i) Consolidated statement of comprehensive incomeAmounts presented in the consolidated statement of comprehensive income comprise:
2011 2010 £m £m
Actuarial gain/(loss) on DBO 226.6 (709.4)Actuarial (loss)/gain on assets (13.3) 405.5Actuarial (loss)/gain on franchise adjustment (102.0) 92.0Adjustment for irrecoverable surplus (81.9) –
29.4 (211.9)
Disclosed as:Actuarial losses on defined benefit pension schemes (55.5) (211.9)RPI to CPI change in defined benefit pension arrangements 84.9 –
29.4 (211.9)
37 Related party transactionsTransactions between the Company and its subsidiaries, which are related parties, have been eliminated on consolidation and are not disclosed in this note.
Remuneration of key management personnelThe remuneration of the Directors, which comprise the plc Board who are the key management personnel of the Group, is set out below in aggregate for each of the categories specified in IAS 24 Related Party Disclosures. Further information about the remuneration of individual Directors is provided in the Directors’ Remuneration Report on pages 44 to 49.
Year to Year to 31 March 31 March 2011 2010 £m £m
Basic salaries 2.1 1.8Performance related bonuses 0.5 0.1Compensatory bonuses – 0.6Benefits in kind 0.1 0.1Fees 0.4 0.5Termination benefits 0.4 –Pension contributions 0.4 0.4Share-based payment 0.5 0.1
4.4 3.6
We have audited the Group financial statements of FirstGroup plc for the year ended 31 March 2011 which comprise the consolidated income statement, the consolidated statement of comprehensive income, the consolidated balance sheet, the consolidated statement of changes in equity and the consolidated cash flow statement, and the related notes 1 to 37. The financial reporting framework that has been applied in their preparation is applicable law and International Financial Reporting Standards (IFRSs) as adopted by the European Union.
This report is made solely to the Company’s members, as a body, in accordance with Chapter 3 of Part 16 of the Companies Act 2006. Our audit work has been undertaken so that we might state to the Company’s members those matters we are required to state to them in an auditors’ report and for no other purpose. To the fullest extent permitted by law, we do not accept or assume responsibility to anyone other than the Company and the Company’s members as a body, for our audit work, for this report, or for the opinions we have formed.
Respective responsibilities of Directors and auditorsAs explained more fully in the Directors’ Responsibilities Statement, the Directors are responsible for the preparation of the Group financial statements and for being satisfied that they give a true and fair view. Our responsibility is to audit the Group financial statements in accordance with applicable law and International Standards on Auditing (UK and Ireland). Those standards require us to comply with the Auditing Practices Board’s (APB’s) Ethical Standards for Auditors.
Scope of the audit of the financial statementsAn audit involves obtaining evidence about the amounts and disclosures in the financial statements sufficient to give reasonable assurance that the financial statements are free from material misstatement, whether caused by fraud or error. This includes an assessment of: whether the accounting policies are appropriate to the Group’s circumstances and have been consistently applied and adequately disclosed; the reasonableness of significant accounting estimates made by the Directors; and the overall presentation of the financial statements. In addition, we read all the financial and non-financial information in the annual report to identify material inconsistencies with the audited financial statements. If we become aware of any apparent material misstatements or inconsistencies we consider the implications for our report.
Opinion on financial statementsIn our opinion the Group financial statements: give a true and fair view of the state of the Group’s affairs as at 31 March 2011 and of its profit for the year then ended;
have been properly prepared in accordance with IFRSs as adopted by the European Union; and
have been prepared in accordance with the requirements of the Companies Act 2006 and Article 4 of the IAS Regulation.
Opinion on other matter prescribed by the Companies Act 2006In our opinion the information given in the Directors’ Report for the financial year for which the financial statements are prepared is consistent with the Group Financial Statements.
Matters on which we are required to report by exceptionWe have nothing to report in respect of the following:
Under the Companies Act 2006 we are required to report to you if, in our opinion: certain disclosures of Directors’ remuneration specified by law are not made; or
we have not received all the information and explanations we require for our audit.
Under the Listing Rules we are required to review: the Directors’ statement contained within the Corporate Governance Report in relation to going concern;
the part of the Corporate Governance Statement relating to the Company’s compliance with the nine provisions of the June 2008 Combined Code specified for our review; and
certain elements of the report to shareholders by the Board on Directors’ remuneration.
Other matterWe have reported separately on the parent company financial statements of FirstGroup plc for the year ended 31 March 2011 and on the information in the Directors’ Remuneration Report that is described as having been audited.
Graham Richardson (Senior Statutory Auditor) for and on behalf of Deloitte LLPChartered Accountants and Statutory Auditors London, United Kingdom 11 May 2011
Independent auditors’ report to the members of FirstGroup plcNotes to the consolidated financial statements continued

FirstGroup Annual Report and Accounts 2011 106 FirstGroup Annual Report and Accounts 2011 107
Fina
ncia
l sta
tem
ents
Year ended 31 March 2011
Continuing Continuing 2011 2010 2009 2008 2007Consolidated income statement £m £m £m £m £m
Group revenue 6,429.2 6,261.9 6,187.3 4,707.6 3,708.8Operating profit before amortisation charges, non-recurring bid costs and other non-recurring items 457.4 449.6 497.5 360.1 259.2Amortisation charges (42.9) (34.7) (33.1) (18.9) (10.3)Non-recurring bid costs (3.1) (0.3) (3.5) (7.2) (19.3)Other non-recurring items (97.7) (49.3) (115.5) (72.3) (22.3)
Operating profit before (loss)/profit on disposal of properties 313.7 365.3 345.4 261.7 207.3
Operating profit 309.3 364.2 371.1 267.5 203.6Net finance cost (182.4) (189.9) (171.1) (111.1) (63.4)Non-recurring finance items 0.3 1.0 – (4.5) –
Profit before tax 127.2 175.3 200.0 151.9 140.2Tax (17.0) (31.2) (43.0) (18.6) (38.1)
Profit for the year from continuing operations 110.2 144.1 157.0 133.3 102.1
Profit for the year from discontinued operations 6.9 3.0 – – –
Profit for the year 117.1 147.1 157.0 133.3 102.1
EBITDA 778.2 763.9 772.2 560.8 398.9
Earnings per share pence pence pence pence pence
Adjusted basic 41.2 38.9 48.6 40.9 33.7Basic 21.4 26.9 30.2 27.7 23.1
Consolidated balance sheet £m £m £m £m £m
Non-current assets 4,161.5 4,526.2 4,866.4 3,833.0 1,681.6Net current (liabilities)/assets (322.4) (283.8) (707.3) (202.6) 70.0Non-current liabilities (2,494.4) (2,967.6) (3,007.2) (2,497.3) (968.4)Provisions (393.8) (364.3) (347.6) (428.3) (175.9)
Net assets 950.9 910.5 804.3 704.8 607.3
Share data Number of shares in issue (excluding treasury shares and shares in trusts) million million million million million
At year end 480.8 480.2 480.8 436.6 434.0Average 480.4 480.5 474.8 434.8 397.9
Share price pence pence pence pence pence
At year end 326 359 268 564 665High 413 442 635 815 668Low 323 288 198 497 381
Market capitalisation £m £m £m £m £m
At year end 1,572 1,724 1,292 2,462 2,886
2011 2010 Notes £m £m
Fixed assetsInvestments 4 1,699.0 1,709.2
Current assetsCash and cash equivalents 11.4 0.8Derivative financial instruments – due within one year 5 57.3 31.6 – due after more than one year 5 54.3 31.4Debtors – due within one year 6 2,717.7 2,991.6 – due after more than one year 6 – 11.0
2,840.7 3,066.4
Current liabilitiesCreditors: amounts falling due within one year 8 (867.3) (643.1)Financial liabilities – current bond liability (73.3) (73.3)Derivative financial instruments 5 (38.5) (82.8)
(979.1) (799.2)
Net current assets 1,861.6 2,267.2
Total assets less current liabilities 3,560.6 3,976.4Creditors: amounts falling due after more than one year 8 (1,951.4) (2,285.4)Derivative financial instruments 5 (29.7) (121.0)
Net assets 1,579.5 1,570.0
Capital and reservesCalled up share capital 9 24.1 24.1Share premium 10 676.4 676.4Other reserves 10 251.8 176.9Own shares 10 (5.0) (6.5)Profit and loss account 10 632.2 699.1
Shareholders’ funds 1,579.5 1,570.0
Group financial summary Company balance sheetAs at 31 March 2011

FirstGroup Annual Report and Accounts 2011 108 FirstGroup Annual Report and Accounts 2011 109
Fina
ncia
l sta
tem
ents
1 Significant accounting policiesBasis of accountingThe financial statements have been prepared on a historical cost basis, except for the revaluation of certain financial instruments and on a going concern basis as described in the going concern statement in the Directors’ Report on page 52.
The following accounting policies have been used consistently throughout the year and the preceding year in accordance with UK GAAP.
Cash flow statementThe Company has taken the advantage of the exemption under FRS 1 (revised) not to disclose a cash flow statement.
InvestmentsFixed asset investments in subsidiaries and associates are shown at cost less provision for impairment.
For investments in subsidiaries acquired for consideration, including the issue of shares qualifying for merger relief, cost is measured by reference to the nominal value only of the shares issued. Any premium is ignored.
Foreign currenciesTransactions in currencies other than Sterling are recorded at the rate of exchange on the date of the transaction. At each balance sheet date, monetary assets and liabilities that are denominated in foreign currencies are retranslated at the rates prevailing at the relevant balance sheet date. Exchange differences arising on the settlement of monetary items, and on the retranslation of non-monetary items at each balance sheet date are included in the profit or loss for the accounting period.
TaxThe charge for tax is based on the profit or loss for the year and takes into account tax deferred because of timing differences between the treatment of certain items for tax and accounting purposes. Provision is made for deferred tax on all timing differences except those arising from the revaluation of fixed assets for which there is no binding agreement to sell on property gains if it is anticipated that rollover relief will be available and on the undistributed profits of overseas subsidiaries, associates and joint ventures. Deferred tax is calculated at the rates at which it is estimated the tax will arise. Deferred tax assets are recognised to the extent that it is regarded as more likely than not that they will be recovered. The deferred tax provision is not discounted to net present value.
Financial instrumentsDerivative financial instruments are initially recorded at fair value and then for reporting purposes are remeasured to fair value at each subsequent balance sheet date.
Derivative financial instruments and hedge accountingThe Company uses derivative financial instruments to hedge interest rate risks, foreign currency risks and fuel price risks. Use of such financial instruments is governed by policies and delegated authorities approved by the Board. The Company does not use derivative financial instruments for speculative purposes. In relation to fuel price risks, the Company’s profit and loss account is affected by transactions with affiliated companies that give rise to cash flow volatility associated with fuel price risk.
The main derivative financial instruments used by the Company are interest rate swaps and collars, fuel swaps and collars, and cross currency interest rate swaps. Such instruments are initially recognised at fair value and subsequently remeasured to fair value at the reported balance sheet date. The fair values are calculated by reference to market exchange rates, interest rates and fuel prices at the period end, and supported by counterparty confirmations.
Changes in the fair value of derivative financial instruments that do not qualify for hedge accounting as cash flow hedges or foreign currency hedges of a foreign net investment are recognised in the profit and loss account as they arise.
Hedge accounting is discontinued when the hedging instrument expires or is sold, terminated, or exercised, or no longer qualifies for hedge accounting. At that time, any cumulative gain or loss on the hedging instrument recognised in equity is retained in equity until the forecasted transaction occurs. If a hedged transaction is no longer expected to occur, the net cumulative gain or loss recognised in equity is transferred to the profit and loss account for the period.
Derivatives embedded in other financial instruments or other host contracts are treated as separate derivatives when their risks and characteristics are not closely related to those of host contracts and the host contracts are not carried at fair value with unrealised gains or losses reported in the income statement.
1 Significant accounting policies continued Related party transactionsAs permitted under FRS 8, Related party transactions, the Company has taken advantage of the exemption not to disclose transactions between Group companies.
DebtDebt is initially stated at the amount of the net proceeds after the deduction of issue costs. The carrying amount is increased by the amortisation of debt issuance fees in respect of the accounting period and reduced by repayments made in the period.
Dividend distributionDividend distribution to the Company’s shareholders is recognised as a liability in the Company’s financial statements in the period in which the dividends are approved by the Company’s shareholders.
2 Profit for the yearAs permitted by section 408 of the Companies Act 2006 the Company has elected not to present its own profit and loss account for the year. FirstGroup plc reported a profit for the financial year ended 31 March 2011 of £27.8m (2010: £206.2m).
Fees payable to the Company’s auditors for the audit of the Company’s annual financial statements was £0.1m (2010: £0.1m).
The Company had no employees in the current or preceding financial year.
3 DividendsAmounts recognised as distributions to equity holders in the year:
2011 2010 £m £m
Final dividend per share paid for the year ended 31 March 2010 of 14.0p (2009: 12.7p) 67.2 61.1Interim dividend per share paid for the year ended 31 March 2011 of 7.12p (2010: 6.65p) 34.2 32.0
101.4 93.1
Proposed final dividend per share for the year ended 31 March 2011 of 15.0p (2010: 14.0p) 72.1 67.2
The proposed final dividend is subject to approval by shareholders at the Annual General Meeting and has not been included as a liability in these financial statements.
Unlisted subsidiary Other undertakings investments Total 4 Fixed asset investments £m £m £m
CostAt 1 April 2010 1,714.6 8.1 1,722.7Additions 7.7 – 7.7Disposals (17.9) – (17.9)
At 31 March 2011 1,704.4 8.1 1,712.5
ProvisionsAt 1 April 2010 and 31 March 2011 (5.4) (8.1) (13.5)
Net book valueAt 31 March 2011 1,699.0 – 1,699.0
At 31 March 2010 1,709.2 – 1,709.2
Notes to the company financial statements
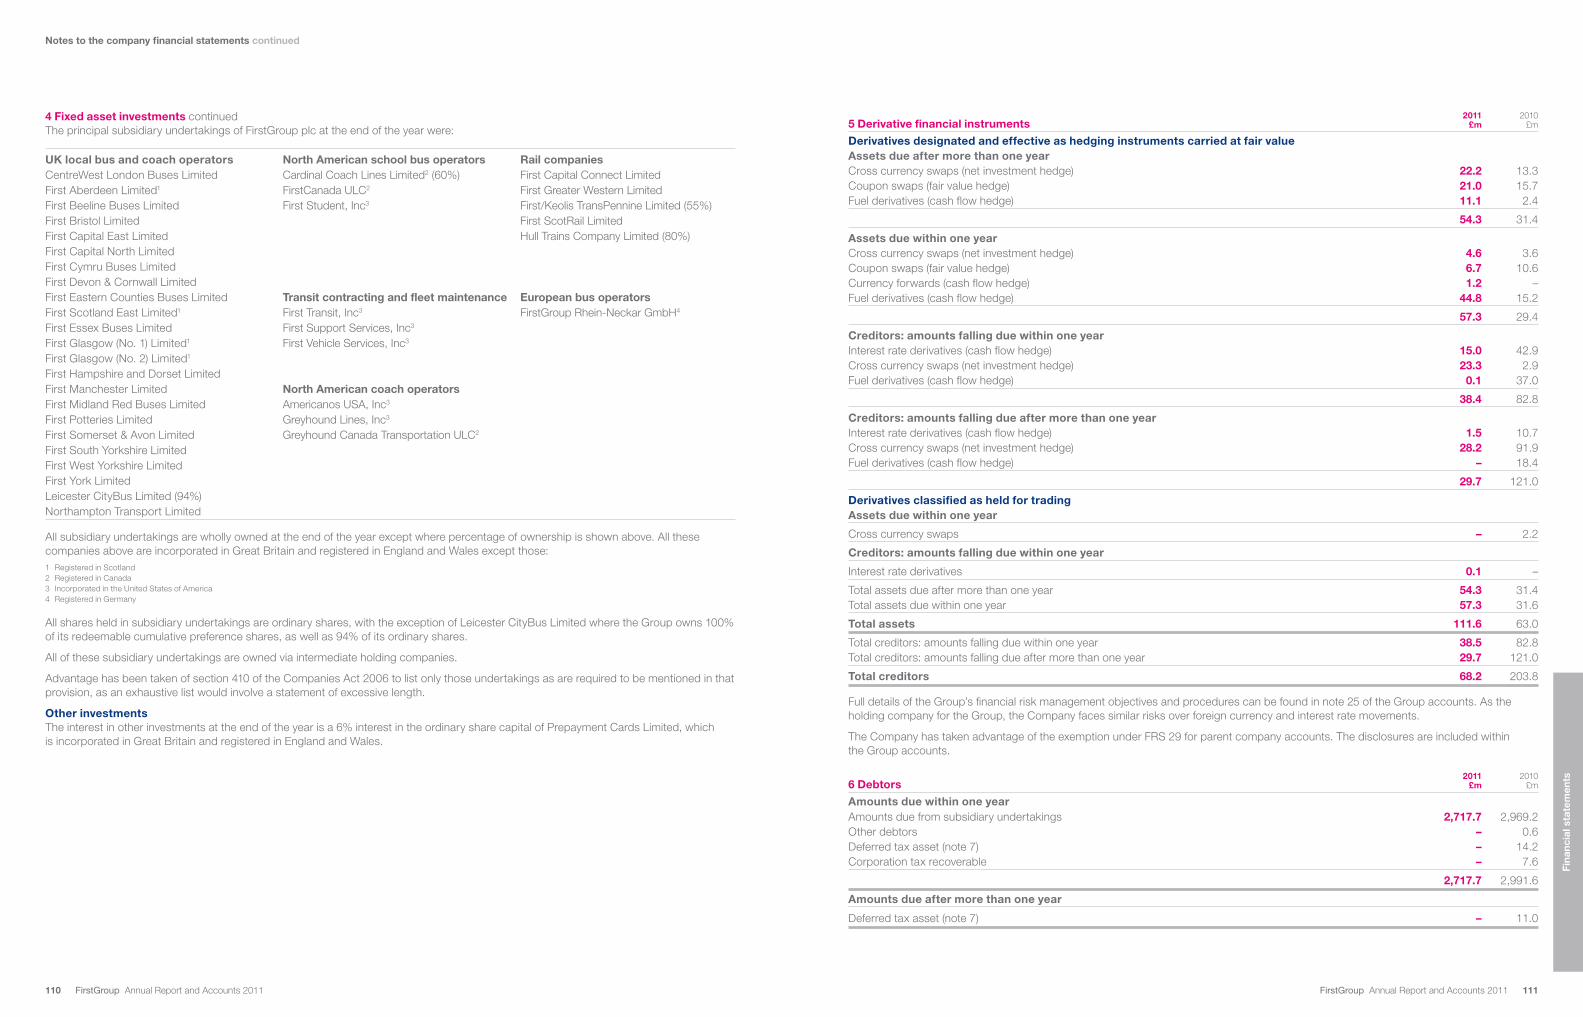
FirstGroup Annual Report and Accounts 2011 110 FirstGroup Annual Report and Accounts 2011 111
Fina
ncia
l sta
tem
ents
4 Fixed asset investments continued The principal subsidiary undertakings of FirstGroup plc at the end of the year were:
UK local bus and coach operators North American school bus operators Rail companiesCentreWest London Buses Limited Cardinal Coach Lines Limited2 (60%) First Capital Connect LimitedFirst Aberdeen Limited1 FirstCanada ULC2 First Greater Western LimitedFirst Beeline Buses Limited First Student, Inc3 First/Keolis TransPennine Limited (55%)First Bristol Limited First ScotRail LimitedFirst Capital East Limited Hull Trains Company Limited (80%)First Capital North Limited First Cymru Buses Limited First Devon & Cornwall Limited First Eastern Counties Buses Limited Transit contracting and fleet maintenance European bus operatorsFirst Scotland East Limited1 First Transit, Inc3 FirstGroup Rhein-Neckar GmbH4
First Essex Buses Limited First Support Services, Inc3 First Glasgow (No. 1) Limited1 First Vehicle Services, Inc3 First Glasgow (No. 2) Limited1 First Hampshire and Dorset Limited First Manchester Limited North American coach operators First Midland Red Buses Limited Americanos USA, Inc3 First Potteries Limited Greyhound Lines, Inc3 First Somerset & Avon Limited Greyhound Canada Transportation ULC2 First South Yorkshire Limited First West Yorkshire Limited First York Limited Leicester CityBus Limited (94%) Northampton Transport Limited
All subsidiary undertakings are wholly owned at the end of the year except where percentage of ownership is shown above. All these companies above are incorporated in Great Britain and registered in England and Wales except those:1 Registered in Scotland2 Registered in Canada3 Incorporated in the United States of America4 Registered in Germany
All shares held in subsidiary undertakings are ordinary shares, with the exception of Leicester CityBus Limited where the Group owns 100% of its redeemable cumulative preference shares, as well as 94% of its ordinary shares.
All of these subsidiary undertakings are owned via intermediate holding companies.
Advantage has been taken of section 410 of the Companies Act 2006 to list only those undertakings as are required to be mentioned in that provision, as an exhaustive list would involve a statement of excessive length.
Other investmentsThe interest in other investments at the end of the year is a 6% interest in the ordinary share capital of Prepayment Cards Limited, which is incorporated in Great Britain and registered in England and Wales.
2011 20105 Derivative financial instruments £m £m
Derivatives designated and effective as hedging instruments carried at fair valueAssets due after more than one yearCross currency swaps (net investment hedge) 22.2 13.3Coupon swaps (fair value hedge) 21.0 15.7Fuel derivatives (cash flow hedge) 11.1 2.4
54.3 31.4
Assets due within one yearCross currency swaps (net investment hedge) 4.6 3.6Coupon swaps (fair value hedge) 6.7 10.6Currency forwards (cash flow hedge) 1.2 –Fuel derivatives (cash flow hedge) 44.8 15.2
57.3 29.4
Creditors: amounts falling due within one yearInterest rate derivatives (cash flow hedge) 15.0 42.9Cross currency swaps (net investment hedge) 23.3 2.9Fuel derivatives (cash flow hedge) 0.1 37.0
38.4 82.8
Creditors: amounts falling due after more than one yearInterest rate derivatives (cash flow hedge) 1.5 10.7Cross currency swaps (net investment hedge) 28.2 91.9Fuel derivatives (cash flow hedge) – 18.4
29.7 121.0
Derivatives classified as held for tradingAssets due within one year
Cross currency swaps – 2.2
Creditors: amounts falling due within one year
Interest rate derivatives 0.1 –
Total assets due after more than one year 54.3 31.4Total assets due within one year 57.3 31.6
Total assets 111.6 63.0
Total creditors: amounts falling due within one year 38.5 82.8Total creditors: amounts falling due after more than one year 29.7 121.0
Total creditors 68.2 203.8
Full details of the Group’s financial risk management objectives and procedures can be found in note 25 of the Group accounts. As the holding company for the Group, the Company faces similar risks over foreign currency and interest rate movements.
The Company has taken advantage of the exemption under FRS 29 for parent company accounts. The disclosures are included within the Group accounts.
2011 20106 Debtors £m £m
Amounts due within one yearAmounts due from subsidiary undertakings 2,717.7 2,969.2Other debtors – 0.6Deferred tax asset (note 7) – 14.2Corporation tax recoverable – 7.6
2,717.7 2,991.6
Amounts due after more than one year
Deferred tax asset (note 7) – 11.0
Notes to the company financial statements continued

FirstGroup Annual Report and Accounts 2011 112 FirstGroup Annual Report and Accounts 2011 113
Fina
ncia
l sta
tem
ents
7 Deferred taxThe major deferred tax liabilities and (assets) recognised by the Company and the movements thereon during the current and prior reporting periods are as follows: Other temporary differences
At 1 April 2010 (25.2)Charge to income 26.1 Charge to equity 8.4
At 31 March 2011 9.3
The following is the analysis of the deferred tax balances for financial reporting purposes: 2011 2010 £m £m
Deferred tax asset due within one year – (14.2)Deferred tax asset due after more than one year – (11.0)Deferred tax liability due within one year 6.8 –Deferred tax liability due after more than one year 2.5 –
9.3 (25.2)
2011 20108 Creditors £m £m
Amounts due within one yearBank loans and overdrafts 623.7 403.5Other creditors 2.2 –Deferred tax liability (note 7) 6.8 –Corporation tax payable 0.9 –Amounts due to subsidiary undertakings 220.8 223.0Accruals and deferred income 12.9 16.6
867.3 643.1
Amounts falling due after more than one yearDeferred tax liability (note 7) 2.5 –Bank loans– Due in more than two years but not more than five years 531.8 871.3£300.0m Sterling bond – 6.875% 2013 298.0 297.4£250.0m Sterling bond – 6.125% 2019 296.4 296.2£300.0m Sterling bond – 8.125% 2018 276.7 274.8£350.0m Sterling bond – 8.750% 2021 347.0 346.8£200.0m Sterling bond – 6.875% 2024 199.0 198.9
1,951.4 2,285.4
Borrowing facilitiesThe maturity profile of the Company’s undrawn committed borrowing facilities is as follows: 2011 2010 £m £m
Facilities maturing:– Due in more than one year but less than two years – 1,013.0– Due in more than two years 527.0 –
527.0 1,013.0
2011 20109 Called up share capital £m £m
Allotted, called up and fully paidOrdinary shares of 5p each 24.1 24.1
The Company had 482.1m (2010: 482.1m) shares in issue at 31 March 2011 including 268,887 (2010: 976,453) shares held as treasury shares at this date.
Profit Share Own and loss premium shares account 10 Reserves £m £m £m
At 1 April 2010 676.4 (6.5) 699.1Retained profit for the year – – 27.8 Share-based payment provision – – 7.7 Dividends paid – – (101.4)Movement in EBT and treasury shares during the year – 1.5 (1.0)
At 31 March 2011 676.4 (5.0) 632.2
Own shares The number of own shares held by the Company at the end of the year was 1,279,912 (2010: 1,860,479) FirstGroup plc ordinary shares of 5p each. Of these, 978,505 (2010: 851,506) were held by the FirstGroup plc Employee Benefit Trust, 32,520 (2010: 32,520) by the FirstGroup plc Qualifying Employee Share Ownership Trust and 268,887 (2010: 976,453) were held as treasury shares. Both trusts and treasury shares have waived the rights to dividend income from the FirstGroup plc shares. The market value of the shares at 31 March 2011 was £4.2m (2010: £6.7m).
Capital Total Hedging redemption Capital Merger other reserve reserve reserve reserve reserves Other reserves £m £m £m £m £m
At 1 April 2010 (85.2) 1.9 93.8 166.4 176.9 Derivative hedging instrument movement 74.9 – – – 74.9
At 31 March 2011 (10.3) 1.9 93.8 166.4 251.8
2011 201011 Reconciliation of movement in shareholders’ funds £m £m
Profit for the financial year 27.8 206.2Share-based payments provision 7.7 5.4Dividends (101.4) (93.1)
(65.9) 118.5 Movement in EBT and treasury shares during the year 0.5 (3.1)Derivative hedging instrument movement 74.9 61.8
Net addition to shareholders’ funds 9.5 177.2 Shareholders’ funds at beginning of year 1,570.0 1,392.8
Shareholders’ funds at end of year 1,579.5 1,570.0
12 Contingent liabilities and assetsTo support subsidiary undertakings in their normal course of business, the Company and certain subsidiaries have indemnified certain banks and insurance companies who have issued performance bonds for £460.2m (2010: £458.2m) and letters of credit for £316.7m (2010: £335.1m). The performance bonds relate to the North American businesses of £260.8m (2010: £260.0m) and the UK Rail franchise operations of £199.4m (2010: £198.2m). The letters of credit relate substantially to insurance arrangements in the UK and North America.
The Company has provided unsecured loan facilities of £87.5m (2010: £96.4m) to First Greater Western Limited, a £46.0m (2010: £46.0m) unsecured loan facility to First Capital Connect Limited, a £3.2m (2010: £3.2m) unsecured loan facility to First/Keolis TransPennine Limited, and a £13.6m (2010: £13.6m) unsecured loan facility to First ScotRail Limited. Under these facilities, £46.5m (2010: £96.4m) was drawn at 31 March 2011 by First Greater Western Limited and £25.0m (2010: £35.0m) was drawn at 31 March 2011 by First Capital Connect Limited.
The Company is party to certain unsecured guarantees granted to banks for overdraft and cash management facilities provided to itself and subsidiary undertakings. The Company has given certain unsecured guarantees for the liabilities of its subsidiary undertakings arising under certain loan notes, hire purchase contracts, finance leases, operating leases, supply contracts and certain pension scheme arrangements. It also provides unsecured cross guarantees to certain subsidiary undertakings as required by VAT legislation. UK Bus subsidiaries have provided unsecured guarantees on a joint and several basis to the Trustees of the UK Bus Occupational Pension Scheme.
Certain of the Company’s subsidiaries have issued unsecured guarantees to the Company’s Sterling bondholders and to lenders participating in the Group’s £779.2m (2010: £1,511.8m) syndicated unsecured bank facilities and to lenders of certain bilateral bank facilities for £443.7m (2010: £554.5m).
In its normal course of business UK Rail has ongoing contractual negotiations with governmental and other organisations.
Notes to the company financial statements continued

FirstGroup Annual Report and Accounts 2011 114 FirstGroup Annual Report and Accounts 2011 115
Fina
ncia
l sta
tem
ents
We have audited the parent company financial statements of FirstGroup plc for the year ended 31 March 2011 which comprise the balance sheet, and the related notes 1 to 12. The financial reporting framework that has been applied in their preparation is applicable law and United Kingdom Accounting Standards (United Kingdom Generally Accepted Accounting Practice).
This report is made solely to the Company’s members, as a body, in accordance with Chapter 3 of Part 16 of the Companies Act 2006. Our audit work has been undertaken so that we might state to the company’s members those matters we are required to state to them in an auditors’ report and for no other purpose. To the fullest extent permitted by law, we do not accept or assume responsibility to anyone other than the Company and the Company’s members as a body, for our audit work, for this report, or for the opinions we have formed.
Respective responsibilities of Directors and auditorsAs explained more fully in the Directors’ Responsibilities Statement, the Directors are responsible for the preparation of the parent company financial statements and for being satisfied that they give a true and fair view. Our responsibility is to audit the parent company financial statements in accordance with applicable law and International Standards on Auditing (UK and Ireland). Those standards require us to comply with the Auditing Practices Board’s (APB’s) Ethical Standards for Auditors.
Scope of the audit of the financial statementsAn audit involves obtaining evidence about the amounts and disclosures in the financial statements sufficient to give reasonable assurance that the financial statements are free from material misstatement, whether caused by fraud or error. This includes an assessment of: whether the accounting policies are appropriate to the parent company’s circumstances and have been consistently applied and adequately disclosed; the reasonableness of significant accounting estimates made by the Directors; and the overall presentation of the financial statements. In addition we read all the financial and non-financial information in the annual report to identify material inconsistencies with the audited financial statements. If we become aware of any apparent misstatements or inconsistencies we consider the implications for our report.
Opinion on financial statementsIn our opinion the parent company financial statements: give a true and fair view of the state of the parent company’s affairs as at 31 March 2011;
have been properly prepared in accordance with United Kingdom Generally Accepted Accounting Practice; and
have been prepared in accordance with the requirements of the Companies Act 2006.
Opinion on other matters prescribed by the Companies Act 2006In our opinion the part of the Directors’ Remuneration Report to be audited has been properly prepared in accordance with the Companies Act 2006; and
the information given in the Directors’ Report for the financial year for which the financial statements are prepared is consistent with the parent company financial statements.
Matters on which we are required to report by exceptionWe have nothing to report in respect of the following matters where the Companies Act 2006 requires us to report to you if, in our opinion: adequate accounting records have not been kept by the parent company, or returns adequate for our audit have not been received from branches not visited by us; or
the parent company financial statements and the part of the Directors’ Remuneration Report to be audited are not in agreement with the accounting records and returns; or
certain disclosures of Directors’ remuneration specified by law are not made; or
we have not received all the information and explanations we require for our audit.
Other matterWe have reported separately on the Group financial statements of FirstGroup plc for the year ended 31 March 2011.
Graham Richardson (Senior Statutory Auditor) for and on behalf of Deloitte LLPChartered Accountants and Statutory Auditors London, United Kingdom 11 May 2011
Independent auditors’ report to the members of FirstGroup plc
Set out below is a guide to commonly used financial, industry and Company related terms in the Annual Report and Accounts. These are not precise definitions and are included to provide readers with a guide to the general meaning of these terms.
Glossary
AGMAnnual General Meeting
BAYEBuy As You Earn
BITCBusiness in the Community is a membership organisation of over 800 of the UK’s leading companies committed to improving their CSR impact on society
The BoardThe Board of Directors of the Company
Combined CodeThe Combined Code on Corporate Governance as published by the Financial Reporting Council
CompanyFirstGroup plc, a company registered in Scotland with number SC157176 whose registered office is at 395 King Street, Aberdeen AB24 5RP
CSRCorporate Social Responsibility refers to the way we manage the economic, social and environmental impacts of our activities
DfTDepartment for Transport
DividendAmount payable per ordinary share on an interim and final basis
Dow Jones Sustainability Indexes Tracker of the financial performance of the world’s leading corporate sustainability-driven companies
EABPExecutive Annual Bonus Plan
EBTEmployee benefit trust
EBITDAEarnings before interest, tax, depreciation and amortisation
EPSEarnings per share
ESOSExecutive Share Option Scheme
FTSE4Good Index SeriesDesigned to measure the performance of companies that meet globally recognised corporate responsibility standards
GPSGlobal positioning system
GroupFirstGroup plc and its subsidiaries
HSTHigh Speed Train
IASInternational Accounting Standards
IFRSInternational Financial Reporting Standards
KPIKey performance indicators are financial and non-financial metrics used to define and measure progress towards our objectives
Local authorityLocal government organisations including unitary, Metropolitan, district and county councils
LTIsLost Time Injuries refer to any injury at work that has resulted in a staff member being unable to work for more than one day
LTIPLong Term Incentive Plan
Network RailOwner and operator of Britain’s rail infrastructure
Ordinary sharesFirstGroup plc ordinary shares of 5p each
PIPPunctuality Improvement Partnership between a bus operator and a local authority to improve the punctuality of bus services
PPMPublic Performance Measure combines the punctuality and reliability of a Train Operating Company into a single performance measure
PTEPassenger Transport Executives were established in the six Metropolitan areas of England to ‘secure or promote the provision of a system of public transport which meets the needs of the area’
SAYESave As You Earn
TfLTransport for London was created in 2000 as the integrated body responsible for the capital’s transport system
TOCTrain Operating Company
TSRTotal shareholder return is the growth in value of a shareholding over a specified period assuming that dividends are reinvested to purchase additional shares
UK GAAPUK Generally Accepted Accounting Principles
Voluntary quality partnershipAgreement between a bus operator and a local authority to improve the quality of bus services

FirstGroup Annual Report and Accounts 2011 116 FirstGroup Annual Report and Accounts 2011 117
Fina
ncia
l sta
tem
ents
The Annual Report and Accounts, share price information, Company presentations, contact details and other shareholder information are available on the website at www.firstgroup.com
Shareholder information
Contact information
FirstGroup plc officesRegistered office London officeFirstGroup plc FirstGroup plc395 King Street 50 Eastbourne Terrace Aberdeen AB24 5RP London W2 6LG T. +44 (0)1224 650100 T. +44 (0)20 7291 0505 F. +44 (0)1224 650140 F. +44 (0)20 7436 3337
Shareholder enquiriesThe Company’s share register is maintained on our behalf by Equiniti, who are responsible for making dividend payments and updating the register, including details of changes to shareholders’ addresses and purchases and sales of the Company’s shares.
If you have any questions about your shareholding in the Company or need to notify any changes to your personal details you should contact:
EquinitiAspect House Spencer Road Lancing West Sussex BN99 6DA T. 0871 384 2046* (or from overseas on T. +44 (0)121 415 7050)
Employee share schemesEmployees with queries about shares held in the Company’s employee share schemes should contact:
Yorkshire Building Society Yorkshire Building Society Share Plans 1 Filey Street Bradford BD1 5AT T. 0845 1200 300 (or from overseas on T. +44 (0)1274 705758)
Duplicate shareholder accountsIf you receive more than one copy of Company mailings this may indicate that more than one account is held in your name on the Register. This happens when the registration details of separate transactions differ slightly. If you believe more than one account exists in your name you may contact the Registrar to request that the accounts are combined. There is no charge for this service.
Unsolicited mailAs the Company’s share register is, by law, open to public inspection, shareholders may receive unsolicited mail from organisations that use it as a mailing list. To limit the amount of unsolicited mail you receive, write to the Mailing Preference Service, DMA House, 70 Margaret Street, London W1W 8SS or register online at www.mpsonline.org.uk.
Direct dividend paymentsIf you would like your dividend to be paid directly into your bank or building society account, you should contact the Registrar or complete the dividend mandate attached to your dividend cheque. Mandating your dividends has a number of advantages:
1. The dividend will go into your account on the payment date – there is no chance of it being delayed in the post and you do not have to wait for a cheque to clear.
2. The payment method is more secure than receiving a cheque through the post.
3. You still receive tax information about the dividend, which is sent directly to you at your registered address.
Dividend Reinvestment Plan (‘DRIP’)The Company offers shareholders the option to participate in a DRIP. This enables shareholders to reinvest their cash dividends in FirstGroup plc shares. For more information please contact:
The Share Dividend Team EquinitiAspect House Spencer Road Lancing West Sussex BN99 6DA T. 0871 384 2268* (or from overseas on T. +44 (0)121 415 7173)
Online informationThe Registrar also provides an online service enabling you to access details of your shareholding. To view your details, complete certain amendments instantly and access a range of general information about holding shares, visit www.shareview.co.uk.* Calls to this number are charged at 8p per minute from a BT landline; other telephone providers’ costs may vary. Telephone lines are open from 8.30 am to 5.30 pm, Monday to Friday.
Electronic communicationThe Company’s articles of association permit the Company to use electronic communication when sending information to its shareholders. Using electronic communications helps us reduce the environmental impact of our business by limiting the amount of paper we use and it assists us in managing our costs. We periodically consult with shareholders to check how they wish to receive information from us and a shareholder is taken to have agreed to website communications if a response has not been received.
Any document or information required to be sent to shareholders is made available on the Company’s website and a notification of availability is sent. Shareholders who receive such a notification are entitled to request a hard copy of the document at any time and may also change the way they receive communications at any time by contacting Equiniti.
FirstGroup plc’s policy on discounts for shareholdersShareholders are reminded that it is not Group policy to offer travel or other discounts to shareholders, as they may be used only by a small number of individuals. The Group would rather maximise dividends, which are of benefit to all shareholders.
Number of shareholders % Shares held %
By categoryIndividuals 38,251 94.5 46,254,668 9.6Banks and nominees 1,248 3.1 401,239,488 83.2Insurance and assurance 1 – 300 –Other companies 866 2.1 28,259,418 5.9Other institutions 104 0.3 6,313,296 1.3
40,470 100.0 482,067,170 100.0
By size of holding1-1,000 31,119 76.9 8,187,046 1.71,001-5,000 7,140 17.6 15,661,642 3.35,001-10,000 1,072 2.7 7,440,893 1.510,001-100,000 787 1.9 21,840,538 4.5Over 100,000 352 0.9 428,937,051 89.0
40,470 100.0 482,067,170 100.0
Shareholder profileAt 11 May 2011
Financial calendar
Shares trade ex dividend 13 July 2011
Annual General Meeting 15 July 2011
Record date for final dividend* 15 July 2011
Final dividend payment 19 August 2011
Half-yearly results announcement November 2011
Interim dividend paid February 2012
Preliminary announcement of full year results May 2012
* Shareholders recorded on the register at this date will receive the final dividend.
Find out more about First in our CSR report and on our website www.firstgroup.com

Principal and registered officeFirstGroup plc395 King Street Aberdeen AB24 5RP T. +44 (0)1224 650100 F. +44 (0)1224 650140
Registered in Scotland number SC157176
London officeFirstGroup plc50 Eastbourne Terrace Paddington London W2 6LG T. +44 (0)20 7291 0505 F. +44 (0)20 7436 3337
www.firstgroup.com
Printed in the UK by Royle Print, a Carbon Neutral printing company, on material made from 100% post consumer waste; the printer and paper manufacturing mill are both accredited with ISO 14001. Environmental Management systems standard and both are Forestry Stewardship Council certified. When you have finished with this report, please dispose of it in your recycled waste stream.