kingspan group plc half-yearly financial report for …
TRANSCRIPT

KINGSPAN GROUP PLC
HALF-YEARLY FINANCIAL REPORT
for the period ended 30 June 2021
KINGSPAN GROUP PLC
RESULTS FOR THE HALF YEAR 30 JUNE 2021 Kingspan, the global leader in high performance insulation and building envelope solutions, issues its half-yearly financial report for the six-month period ended 30 June 2021.
Financial Highlights: • Revenue up 41% to €2.9bn, (pre-currency and acquisitions, up 36%). • Trading profit up 64% to €329m, (pre-currency and acquisitions, up 60%). • Group trading margin of 11.3%, an increase of 160bps versus the same period in 2020. • Acquisitions contributed 8% to sales growth and 7% to trading profit growth in the period. • Net debt of €601.7m (H1 2020: €437.9m). Net debt to EBITDA of 0.83x (H1 2020: 0.79x). • Basic EPS up 65.9 % to 132.4 cent (H1 2020: 79.8 cent). • Interim dividend 19.9 cent (H1 2020: nil) in line with policy guidance. • Continued growth in ROCE at 18.9 % (H1 2020: 16.9%). Operational Highlights: • Unprecedented and ongoing raw material inflation with the price recovery effort on track. • Strong underlying volume growth of 30% and 27% in Insulated Panels and Insulation
Boards. • Insulated Panels sales increase of 44% driven by strong momentum generally in
construction activity, raw material led price growth further enhanced by strong demand in high growth sectors. Order backlog strongly ahead of the same point in 2020.
• Insulation Boards sales increase of 36% reflecting strong demand in key markets and inflation recovery on pricing. Acquisition of Logstor, a leading global supplier of technical insulation solutions, completed before the period end.
• Light & Air sales growth of 39% reflecting the acquisition of Colt Group in Q2 2020 and the acquisition of Skydome in the period.
• Water & Energy sales increase of 36% reflecting a strong performance across all key markets, with the exception of Australasia, and further acquisition activity.
• Data & Flooring sales growth of 22% reflecting strong datacentre activity and ongoing development of the European operations.
• Invested a total of €496m in acquisitions, capex and financial investments during the period.
Summary Financials: H1 ’21
H1 ’20
Change
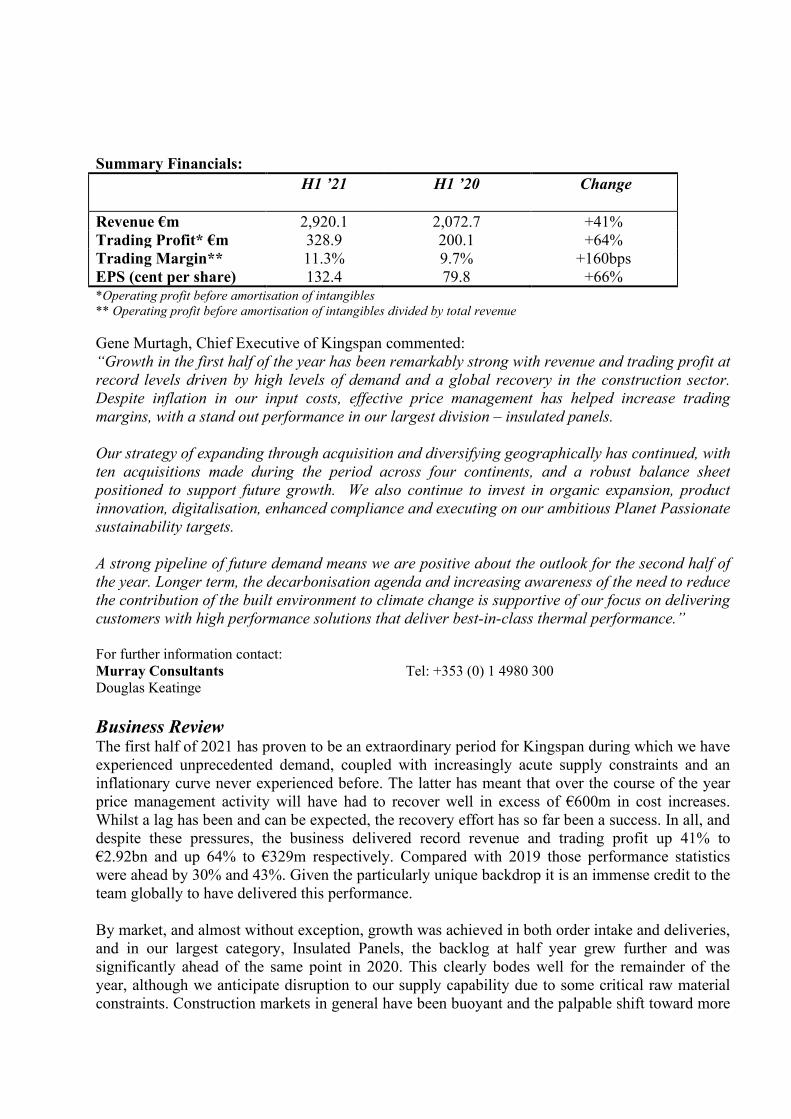
Revenue €m 2,920.1 2,072.7 +41% Trading Profit* €m 328.9 200.1 +64% Trading Margin** 11.3% 9.7% +160bps EPS (cent per share) 132.4 79.8 +66% *Operating profit before amortisation of intangibles ** Operating profit before amortisation of intangibles divided by total revenue Gene Murtagh, Chief Executive of Kingspan commented: “Growth in the first half of the year has been remarkably strong with revenue and trading profit at record levels driven by high levels of demand and a global recovery in the construction sector. Despite inflation in our input costs, effective price management has helped increase trading margins, with a stand out performance in our largest division – insulated panels. Our strategy of expanding through acquisition and diversifying geographically has continued, with ten acquisitions made during the period across four continents, and a robust balance sheet positioned to support future growth. We also continue to invest in organic expansion, product innovation, digitalisation, enhanced compliance and executing on our ambitious Planet Passionate sustainability targets. A strong pipeline of future demand means we are positive about the outlook for the second half of the year. Longer term, the decarbonisation agenda and increasing awareness of the need to reduce the contribution of the built environment to climate change is supportive of our focus on delivering customers with high performance solutions that deliver best-in-class thermal performance.” For further information contact: Murray Consultants Douglas Keatinge
Tel: +353 (0) 1 4980 300
Business Review The first half of 2021 has proven to be an extraordinary period for Kingspan during which we have experienced unprecedented demand, coupled with increasingly acute supply constraints and an inflationary curve never experienced before. The latter has meant that over the course of the year price management activity will have had to recover well in excess of €600m in cost increases. Whilst a lag has been and can be expected, the recovery effort has so far been a success. In all, and despite these pressures, the business delivered record revenue and trading profit up 41% to €2.92bn and up 64% to €329m respectively. Compared with 2019 those performance statistics were ahead by 30% and 43%. Given the particularly unique backdrop it is an immense credit to the team globally to have delivered this performance. By market, and almost without exception, growth was achieved in both order intake and deliveries, and in our largest category, Insulated Panels, the backlog at half year grew further and was significantly ahead of the same point in 2020. This clearly bodes well for the remainder of the year, although we anticipate disruption to our supply capability due to some critical raw material constraints. Construction markets in general have been buoyant and the palpable shift toward more

energy efficient building for both new builds and renovations has been, and will remain, a positive driver of growth at Kingspan. In addition, our increasing exposure to high growth end-markets including online retail, data warehousing and electric vehicle production, are likely to be key strands of the future development of the Group. Planet Passionate Building upon the 2020 achievement of Net Zero Energy across the Group, over a year ago we launched our Planet Passionate agenda, a mission critical and distinctively ambitious programme across the four pillars of Energy, Carbon, Circularity and Water. We have set targets across twelve sub-categories in all of our businesses with annual goals across the next ten years. Significant progress has already been made in the first year of the programme, as detailed in our inaugural Planet Passionate report published in April. Further advancement is underway in 2021, even in the face of very significant growth in manufacturing output. Kingspan has recently announced ambitious new targets aligned with its Planet Passionate programme for reducing its Scope 1, 2 and 3 CHG emissions. The Group has now committed to reducing absolute Scope 1 and 2 CHG emissions by 90% by 2030 from a 2020 base year. It has also pledged to reduce absolute Scope 3 CHG emissions by 42% within the same timeframe. The ambitious new targets are in line with the scale of reductions required to keep global warming below 1.5C from pre-industrial levels.
Planet Passionate Targets Target Year
2020 (A)
2021 (F)
Energy
Net Zero Energy (%) 2020 100% 100%
60% direct renewable energy use (%) 2030 28% 30% 20% on-site renewable energy generation (%) 2030 4.7% 5% Solar PV systems on all wholly owned facilities (%) 2030 21% 29%
Carbon
Net Zero Carbon Manufacturing (% yoy reduction in scope 1 & 2 GHG emissions) 2030 5.2% 4%
Zero Emission company funded cars (% annual conversion) 2025 11% 25%
50% reduction in product CO2e intensity from our primary supply partners (% reduction) 2030 0% 0%
Circularity
Zero Company waste to landfill (tonnes) 2030 18,450 17,000 Recycle 1 billion PET bottles into our manufacturing processes (bottles) 2025 573m 800m
QuadCore™ products utilising recycled PET (% of sites) 2025 5% 5%
Water Harvest 100 million litres of rainwater (litres) 2030 21.1m 24m 5 Active Ocean Clean-Up projects (No. of initiatives) 2025 1 2
Expansion During the period we invested a total of €496m in acquisitions, capex and financial investments. Of note, the €242m purchase of Denmark headquartered Logstor completed in June, and the Romanian based TeraSteel also completed in the period. We also entered the Uruguayan insulated panel market through Bromyros and bolstered our insulation channel in New Zealand and Australia with the onboarding of Thermakraft, since the period end. Additionally, we became a founding investor in H2 Green Steel, a start up in Sweden that aims to become the world’s first zero carbon steel plant. Over a year ago we signed an agreement to acquire Trimo in Slovenia and we remain fully engaged in, and committed to, what has already been a lengthy regulatory process. These and other investments, including our broadening organic footprint, will all serve to increase our exposure to the growing global drive to dramatically decrease building related emissions in the future. Currently, the construction and operation of buildings accounts for approximately 40% of all greenhouse gases. Innovation Continuing the trajectory of QuadCore™ as an industry-leading solution particularly in the areas of thermal-efficiency and fire performance, development of QuadCore™ 2.0 has continued with the aim of launching in Britain and Ireland initially. We expect to commence the extensive certification process before year end. The production process for PowerPanel® is now fully commissioned and the first trial project is underway with the replacement of the existing roof at our Kingscourt facility in Ireland. Comprehensive product testing and certification is in progress and we plan a formal market launch during quarter four of this year. Significant progress has been made in developing an A-Class fibre free AlphaCore® insulation solution from a materials perspective, and tests are currently underway to determine the optimal thermal performance and installation methods. A separate development project is currently underway with the objective of achieving an A-Class fire performance for our Optim-R® product, the highest thermal performance insulation in our offering. Our aim is still to have a product ready for market by late 2022. Separately, over the next two years, we plan to have a B-Class fire performance available as a standard offering across much of the Kooltherm® range. Kingspan Digital The Kingspan Digitalisation Programme sets out to transform the business across its value chain. We are now developing an entire digitally integrated ecosystem that links products, services and operational capabilities. We aim, over time, to reach a new bar in seamless, flexible and accurate digital solutions for our customers. Product Integrity A number of enhancements were made early in the year to bolster the Group’s product compliance processes. ISO37301 is the leading standard for establishing, developing and maintaining compliance management systems. In July, we achieved this standard for Kingspan Group’s Compliance function and at one of our manufacturing sites, which is among the first production sites in the world of any type to achieve it. This system will be embedded throughout our organisation and in each of our current 182 manufacturing locations, with 20 sites expected to have received the accreditation by H1 2022.
During the period, in excess of 250 third party external product and system audits took place across the Group. In addition, 50 manufacturing sites have been internally audited under the process validated by the Audit and Compliance Committee. Insulated Panels H1 ’21 H1 ’20 Change
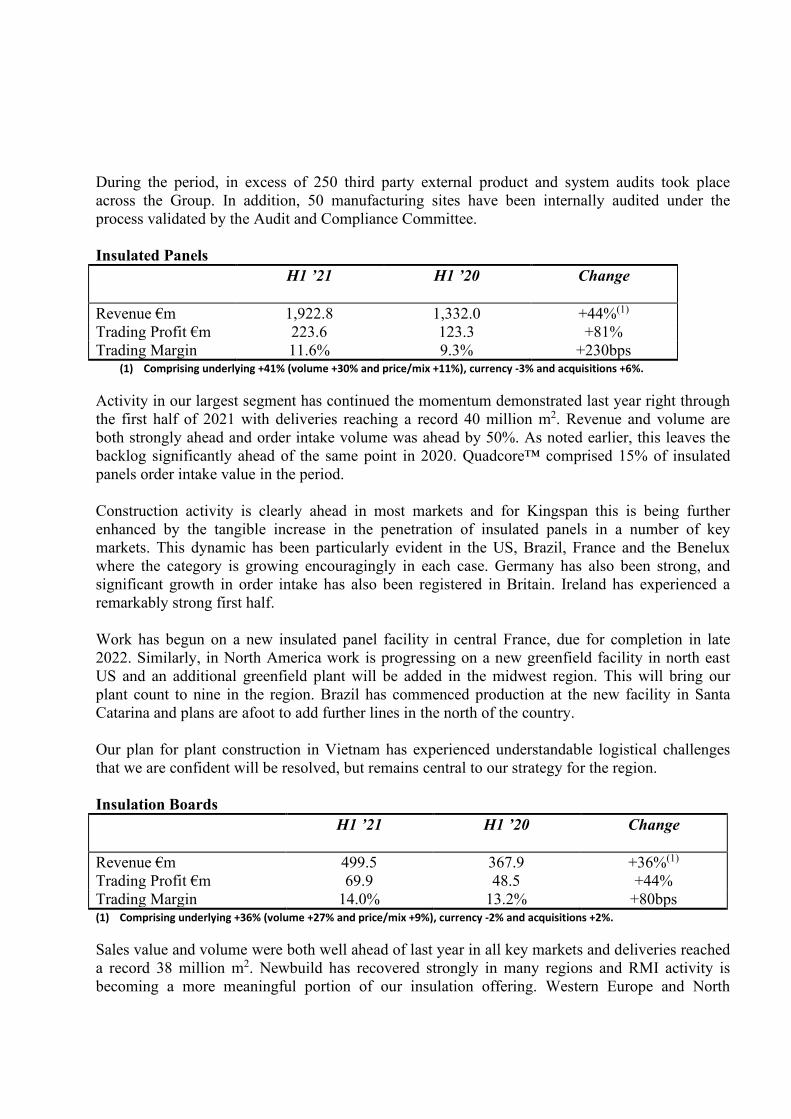
Revenue €m 1,922.8 1,332.0 +44%(1) Trading Profit €m 223.6 123.3 +81% Trading Margin 11.6% 9.3% +230bps
(1) Comprising underlying +41% (volume +30% and price/mix +11%), currency -3% and acquisitions +6%.
Activity in our largest segment has continued the momentum demonstrated last year right through the first half of 2021 with deliveries reaching a record 40 million m2. Revenue and volume are both strongly ahead and order intake volume was ahead by 50%. As noted earlier, this leaves the backlog significantly ahead of the same point in 2020. Quadcore™ comprised 15% of insulated panels order intake value in the period. Construction activity is clearly ahead in most markets and for Kingspan this is being further enhanced by the tangible increase in the penetration of insulated panels in a number of key markets. This dynamic has been particularly evident in the US, Brazil, France and the Benelux where the category is growing encouragingly in each case. Germany has also been strong, and significant growth in order intake has also been registered in Britain. Ireland has experienced a remarkably strong first half. Work has begun on a new insulated panel facility in central France, due for completion in late 2022. Similarly, in North America work is progressing on a new greenfield facility in north east US and an additional greenfield plant will be added in the midwest region. This will bring our plant count to nine in the region. Brazil has commenced production at the new facility in Santa Catarina and plans are afoot to add further lines in the north of the country. Our plan for plant construction in Vietnam has experienced understandable logistical challenges that we are confident will be resolved, but remains central to our strategy for the region. Insulation Boards H1 ’21
H1 ’20
Change
Revenue €m 499.5 367.9 +36%(1) Trading Profit €m 69.9 48.5 +44% Trading Margin 14.0% 13.2% +80bps (1) Comprising underlying +36% (volume +27% and price/mix +9%), currency -2% and acquisitions +2%.
Sales value and volume were both well ahead of last year in all key markets and deliveries reached a record 38 million m2. Newbuild has recovered strongly in many regions and RMI activity is becoming a more meaningful portion of our insulation offering. Western Europe and North
America in particular posted significant volume increases and momentum in Australasia has improved substantially. Volume growth in Britain was comfortably in excess of 20%. Production commenced in our new Kooltherm® facility in Sweden. The new manufacturing plant is powered by 100% renewable electricity, of which 20% is produced on-site, and it will support the growing drive towards modern high performance insulation in that region. During the period a number of attractive insulation acquisitions were either completed or signed. Key amongst these was Logstor, a global leader in medium and large core insulated pipes for multiple applications but predominately for the district heating sector. We anticipate this end market will grow as Europe focuses increasingly on deep improvements to achieve energy efficient infrastructure of cities in particular. Separately we signed an agreement to acquire Thermakraft, based in New Zealand, which will significantly enhance our insulation presence in Australasia. Finally, in the US, we acquired Dyplast based in Florida in the industrial insulation sphere. Light & Air H1 ’21
H1 ’20
Change
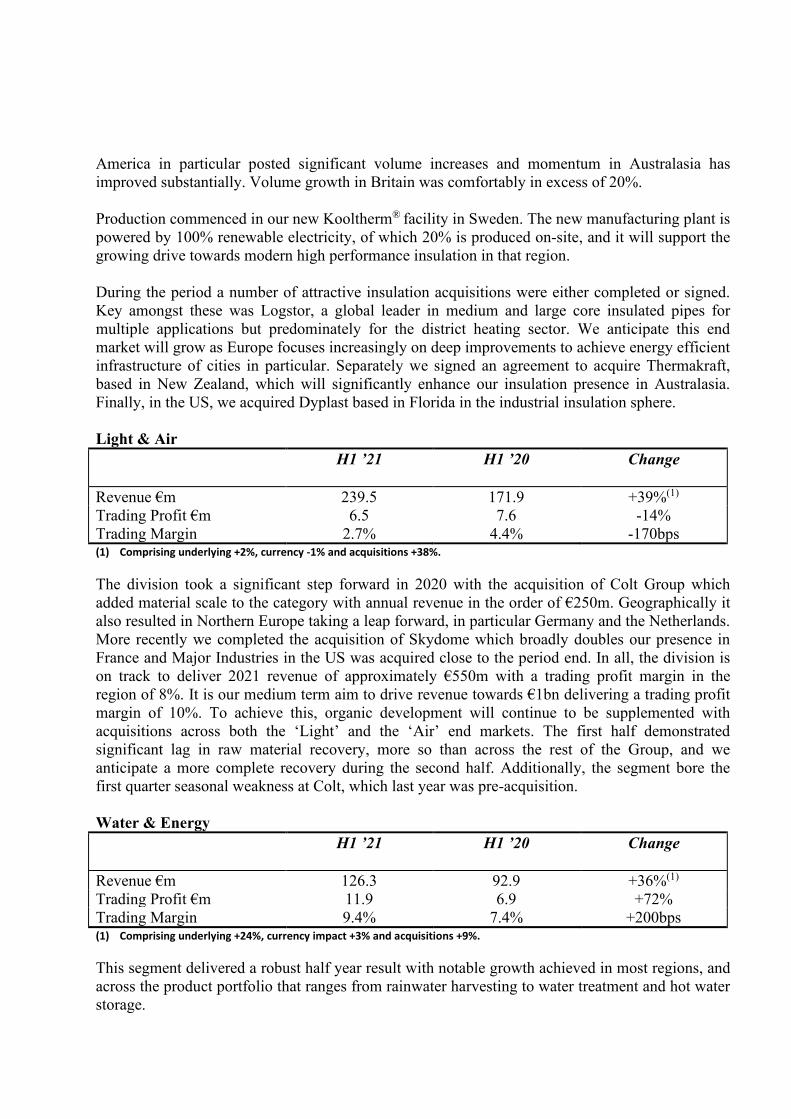
Revenue €m 239.5 171.9 +39%(1) Trading Profit €m 6.5 7.6 -14% Trading Margin 2.7% 4.4% -170bps (1) Comprising underlying +2%, currency -1% and acquisitions +38%.
The division took a significant step forward in 2020 with the acquisition of Colt Group which added material scale to the category with annual revenue in the order of €250m. Geographically it also resulted in Northern Europe taking a leap forward, in particular Germany and the Netherlands. More recently we completed the acquisition of Skydome which broadly doubles our presence in France and Major Industries in the US was acquired close to the period end. In all, the division is on track to deliver 2021 revenue of approximately €550m with a trading profit margin in the region of 8%. It is our medium term aim to drive revenue towards €1bn delivering a trading profit margin of 10%. To achieve this, organic development will continue to be supplemented with acquisitions across both the ‘Light’ and the ‘Air’ end markets. The first half demonstrated significant lag in raw material recovery, more so than across the rest of the Group, and we anticipate a more complete recovery during the second half. Additionally, the segment bore the first quarter seasonal weakness at Colt, which last year was pre-acquisition. Water & Energy H1 ’21
H1 ’20
Change
Revenue €m 126.3 92.9 +36%(1) Trading Profit €m 11.9 6.9 +72% Trading Margin 9.4% 7.4% +200bps (1) Comprising underlying +24%, currency impact +3% and acquisitions +9%.
This segment delivered a robust half year result with notable growth achieved in most regions, and across the product portfolio that ranges from rainwater harvesting to water treatment and hot water storage.
Of note, activity in Britain and Poland performed well across water treatment and fuel storage, and encouraging progress is being made in France in the waste water category. In the Nordics activity has recovered well and, in contrast to this, the rainwater harvesting business in Australia was more challenged as the pandemic restrictions have continued to hamper activity. Product range expansion and innovation are key to this division’s future growth and, as an example, work is well underway on the design of hydrogen tanks for the transportation sector. Data & Flooring H1 ’21
H1 ’20
Change
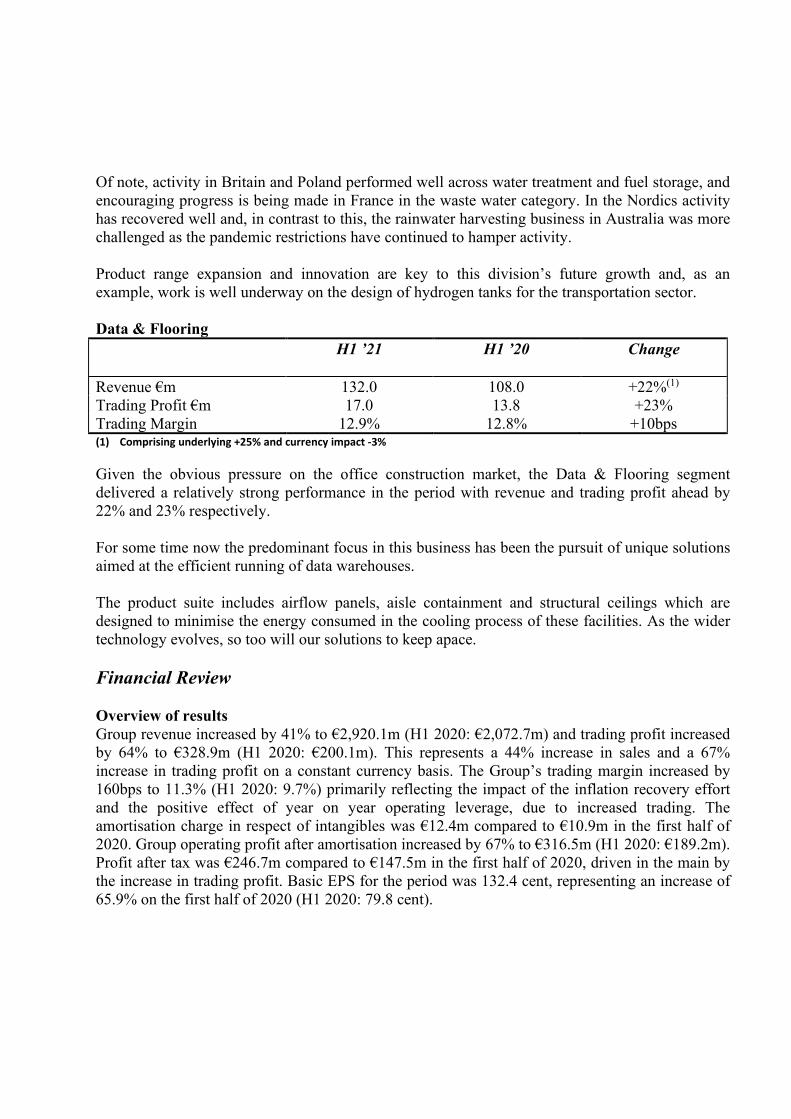
Revenue €m 132.0 108.0 +22%(1) Trading Profit €m 17.0 13.8 +23% Trading Margin 12.9% 12.8% +10bps (1) Comprising underlying +25% and currency impact -3%
Given the obvious pressure on the office construction market, the Data & Flooring segment delivered a relatively strong performance in the period with revenue and trading profit ahead by 22% and 23% respectively. For some time now the predominant focus in this business has been the pursuit of unique solutions aimed at the efficient running of data warehouses. The product suite includes airflow panels, aisle containment and structural ceilings which are designed to minimise the energy consumed in the cooling process of these facilities. As the wider technology evolves, so too will our solutions to keep apace. Financial Review Overview of results Group revenue increased by 41% to €2,920.1m (H1 2020: €2,072.7m) and trading profit increased by 64% to €328.9m (H1 2020: €200.1m). This represents a 44% increase in sales and a 67% increase in trading profit on a constant currency basis. The Group’s trading margin increased by 160bps to 11.3% (H1 2020: 9.7%) primarily reflecting the impact of the inflation recovery effort and the positive effect of year on year operating leverage, due to increased trading. The amortisation charge in respect of intangibles was €12.4m compared to €10.9m in the first half of 2020. Group operating profit after amortisation increased by 67% to €316.5m (H1 2020: €189.2m). Profit after tax was €246.7m compared to €147.5m in the first half of 2020, driven in the main by the increase in trading profit. Basic EPS for the period was 132.4 cent, representing an increase of 65.9% on the first half of 2020 (H1 2020: 79.8 cent).
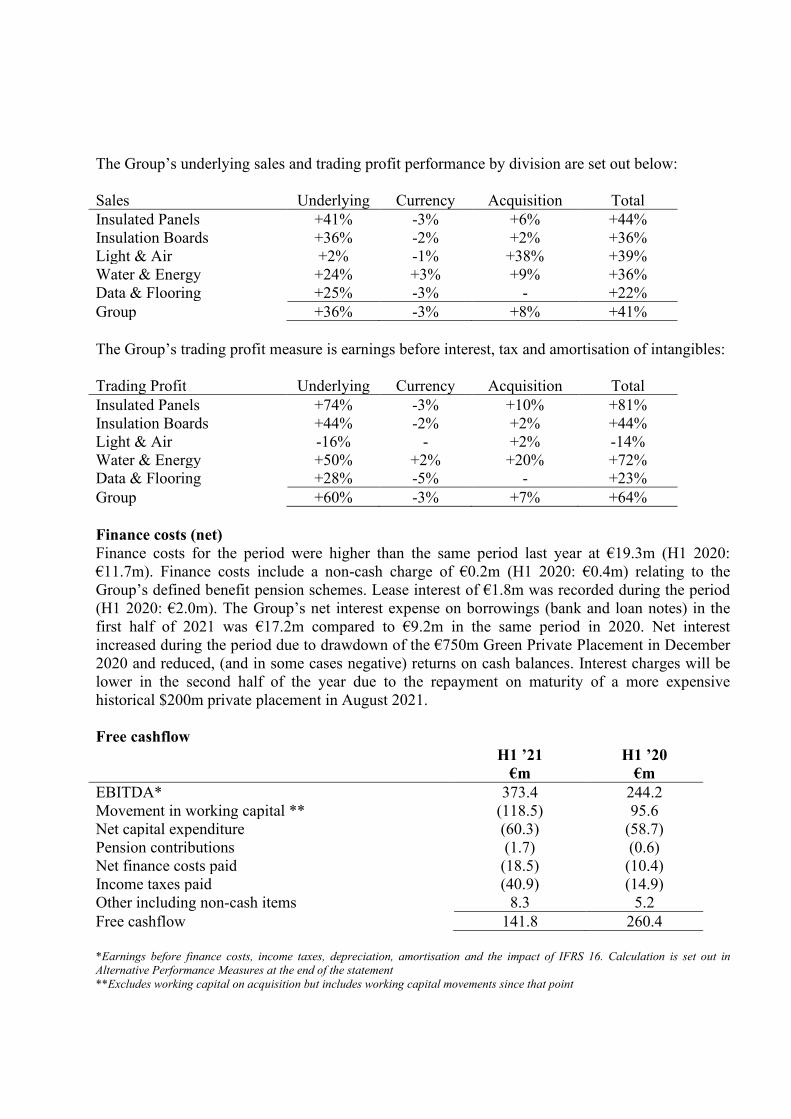
The Group’s underlying sales and trading profit performance by division are set out below: Sales Underlying Currency Acquisition Total Insulated Panels +41% -3% +6% +44% Insulation Boards +36% -2% +2% +36% Light & Air +2% -1% +38% +39% Water & Energy +24% +3% +9% +36% Data & Flooring +25% -3% - +22% Group +36% -3% +8% +41% The Group’s trading profit measure is earnings before interest, tax and amortisation of intangibles: Trading Profit Underlying Currency Acquisition Total Insulated Panels +74% -3% +10% +81% Insulation Boards +44% -2% +2% +44% Light & Air -16% - +2% -14% Water & Energy +50% +2% +20% +72% Data & Flooring +28% -5% - +23% Group +60% -3% +7% +64% Finance costs (net) Finance costs for the period were higher than the same period last year at €19.3m (H1 2020: €11.7m). Finance costs include a non-cash charge of €0.2m (H1 2020: €0.4m) relating to the Group’s defined benefit pension schemes. Lease interest of €1.8m was recorded during the period (H1 2020: €2.0m). The Group’s net interest expense on borrowings (bank and loan notes) in the first half of 2021 was €17.2m compared to €9.2m in the same period in 2020. Net interest increased during the period due to drawdown of the €750m Green Private Placement in December 2020 and reduced, (and in some cases negative) returns on cash balances. Interest charges will be lower in the second half of the year due to the repayment on maturity of a more expensive historical $200m private placement in August 2021. Free cashflow H1 ’21 H1 ’20 €m €m EBITDA* 373.4 244.2 Movement in working capital ** (118.5) 95.6 Net capital expenditure (60.3) (58.7) Pension contributions (1.7) (0.6) Net finance costs paid (18.5) (10.4) Income taxes paid (40.9) (14.9) Other including non-cash items 8.3 5.2 Free cashflow 141.8 260.4 *Earnings before finance costs, income taxes, depreciation, amortisation and the impact of IFRS 16. Calculation is set out in Alternative Performance Measures at the end of the statement **Excludes working capital on acquisition but includes working capital movements since that point
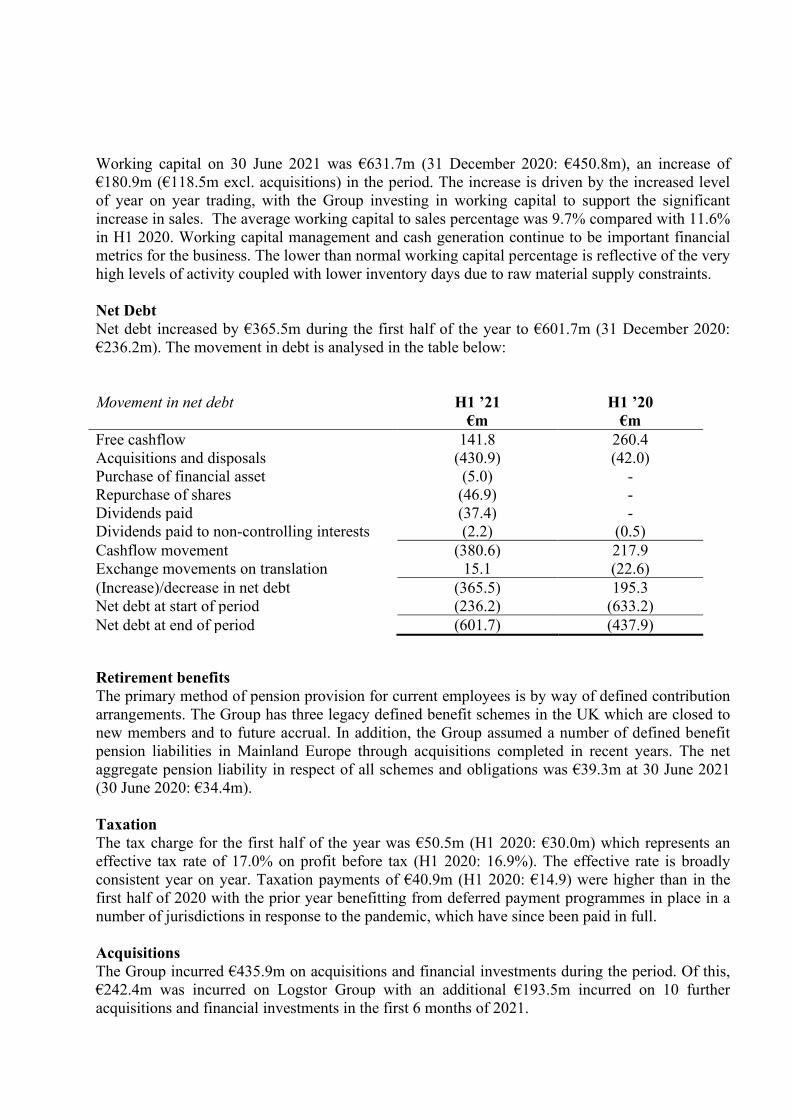
Working capital on 30 June 2021 was €631.7m (31 December 2020: €450.8m), an increase of €180.9m (€118.5m excl. acquisitions) in the period. The increase is driven by the increased level of year on year trading, with the Group investing in working capital to support the significant increase in sales. The average working capital to sales percentage was 9.7% compared with 11.6% in H1 2020. Working capital management and cash generation continue to be important financial metrics for the business. The lower than normal working capital percentage is reflective of the very high levels of activity coupled with lower inventory days due to raw material supply constraints. Net Debt Net debt increased by €365.5m during the first half of the year to €601.7m (31 December 2020: €236.2m). The movement in debt is analysed in the table below: Movement in net debt H1 ’21 H1 ’20 €m €m Free cashflow 141.8 260.4 Acquisitions and disposals (430.9) (42.0) Purchase of financial asset (5.0) - Repurchase of shares (46.9) - Dividends paid (37.4) - Dividends paid to non-controlling interests (2.2) (0.5) Cashflow movement (380.6) 217.9 Exchange movements on translation 15.1 (22.6) (Increase)/decrease in net debt (365.5) 195.3 Net debt at start of period (236.2) (633.2) Net debt at end of period (601.7) (437.9) Retirement benefits The primary method of pension provision for current employees is by way of defined contribution arrangements. The Group has three legacy defined benefit schemes in the UK which are closed to new members and to future accrual. In addition, the Group assumed a number of defined benefit pension liabilities in Mainland Europe through acquisitions completed in recent years. The net aggregate pension liability in respect of all schemes and obligations was €39.3m at 30 June 2021 (30 June 2020: €34.4m). Taxation The tax charge for the first half of the year was €50.5m (H1 2020: €30.0m) which represents an effective tax rate of 17.0% on profit before tax (H1 2020: 16.9%). The effective rate is broadly consistent year on year. Taxation payments of €40.9m (H1 2020: €14.9) were higher than in the first half of 2020 with the prior year benefitting from deferred payment programmes in place in a number of jurisdictions in response to the pandemic, which have since been paid in full. Acquisitions The Group incurred €435.9m on acquisitions and financial investments during the period. Of this, €242.4m was incurred on Logstor Group with an additional €193.5m incurred on 10 further acquisitions and financial investments in the first 6 months of 2021.
Dividend & repurchase of shares The Board has declared an interim dividend of 19.9 cent (H1 2020: nil) payable on 8 October 2021 to shareholders on the register on the record date of 10 September 2021. This is in line with the previously announced revised shareholder returns policy. During the period the Group bought back 600,000 shares at a weighted average price of €78.16. This is consistent with an objective of maintaining a broadly constant share count over time. Capital structure and Group financing The Group funds itself through a combination of equity and debt. Debt is funded through a combination of syndicated bank facilities and private placement loan notes. The principal syndicated facility is a green revolving credit facility of €700m entered into in May 2021 with a committed term to May 2026. There were no drawings on this facility at period end. This new facility was used to substantially replace the outgoing revolving credit facility of €461m and acquisition facility of €300m. In addition, as part of the Group’s longer-term capital structure, the Group has total private placement loan notes of €1,538m (H1 2020: €842m) which have a weighted average maturity of 6.2 years (H1 2020: 4 years). The weighted average maturity of all debt facilities is 5.8 years (H1 2020: 3.8 years). As well as ongoing free cashflow generation, the Group has significant available undrawn facilities and cash which provide appropriate headroom for operational requirements and development funding. Total available headroom was €1,631m at 30 June 2021 (H1 2020: €1,182m). Related party transactions There were no changes in related party transactions from the 2020 Annual Report that could have a material effect on the financial position or performance of the Group in the first half of the year. Eugene Murtagh retired as Chairman and non-executive director on 30 April 2021 and is no longer considered a related party. Principal risks & uncertainties Details of the principal risks and uncertainties facing the Group can be found in the 2020 Annual Report. These risks, namely volatility in the macro environment, failure to innovate, product failure, business interruption (including IT continuity and climate change), credit risks and credit control, employee development and retention, fraud and cybercrime, acquisition and integration of new businesses, health & safety, and laws & regulations remain the most likely to affect the Group in the second half of the current year. The Group actively manages these and all other risks through its control and risk management processes. We will continue to actively assess changes in the external environment on events which could change our risk assessment and profile.
Looking Ahead The Group has had a very positive first half with a strong order backlog on entering the second half of the year. A prevailing and ongoing theme in the year to date has been the extent of raw material inflation and constrained availability. This backdrop will persist through the remaining part of 2021, and likely into 2022. Construction industry activity has been lively in most key markets with outperformance by Kingspan given the robustness of our global supply chain. This dynamic may change in time when raw material availability issues subside. 2021 is an abnormally buoyant year in an unparalleled environment. Whatever way the market evolves, Kingspan is well placed for the years ahead given the combined strength of our high performance product suite, the global decarbonisation agenda, our diversified end markets and strong balance sheet.
2021 Statement of Directors Responsibilities for the 6 month period ended 30 June 2021 The Directors are responsible for preparing the half-yearly financial report in accordance with the Transparency (Directive 2004/109/EC) Regulations 2007, as amended, (the “Transparency Regulations”) and the Transparency Rules of the Central Bank of Ireland. Each of the Directors confirm that to the best of their knowledge:
1) the condensed set of consolidated financial statements included within the half-yearly financial report of Kingspan Group Plc for the six months ended 30 June 2021 (the “interim financial information”) which comprises the Condensed Consolidated Income Statement, the Condensed Consolidated Statement of Comprehensive Income, the Condensed Consolidated Statement of Financial Position, the Condensed Consolidated Statement of Changes in Equity, the Condensed Consolidated Statement of Cash Flows and the related explanatory notes, have been presented and prepared in accordance with IAS 34, Interim Financial Reporting, as adopted by the EU, the Transparency Directive and Transparency Rules of the Central Bank of Ireland;
2) the interim financial information presented, as required by the Transparency Regulations, includes: a. a fair review of the important events that have occurred during the first 6 months of
the financial year, and their impact on the condensed set of consolidated financial statements;
b. a description of the principal risks and uncertainties for the remaining 6 months of the financial year;
c. a fair review of related parties’ transactions that have taken place in the first 6 months of the current financial year and that have materially affected the financial position or the performance of the enterprise during that period; and
d. any changes in the related parties’ transactions described in the last annual report that could have a material effect on the financial position or performance of the enterprise in the first 6 months of the current financial year.
The directors of Kingspan Group plc, and their functions, are listed in the 2020 Annual Report, with the exception of the following changes during the period:
• Eugene Murtagh retired as Chairman and a non-executive director on 30 April 2021, and Jost Massenberg was appointed Non-Executive Chairman on that date;
• Éimear Moloney and Paul Murtagh were appointed as non-executive directors on 30 April 2021.
On behalf of the Board Gene M Murtagh Geoff Doherty Chief Executive Officer Chief Financial Officer
20 August 2021 20 August 2021
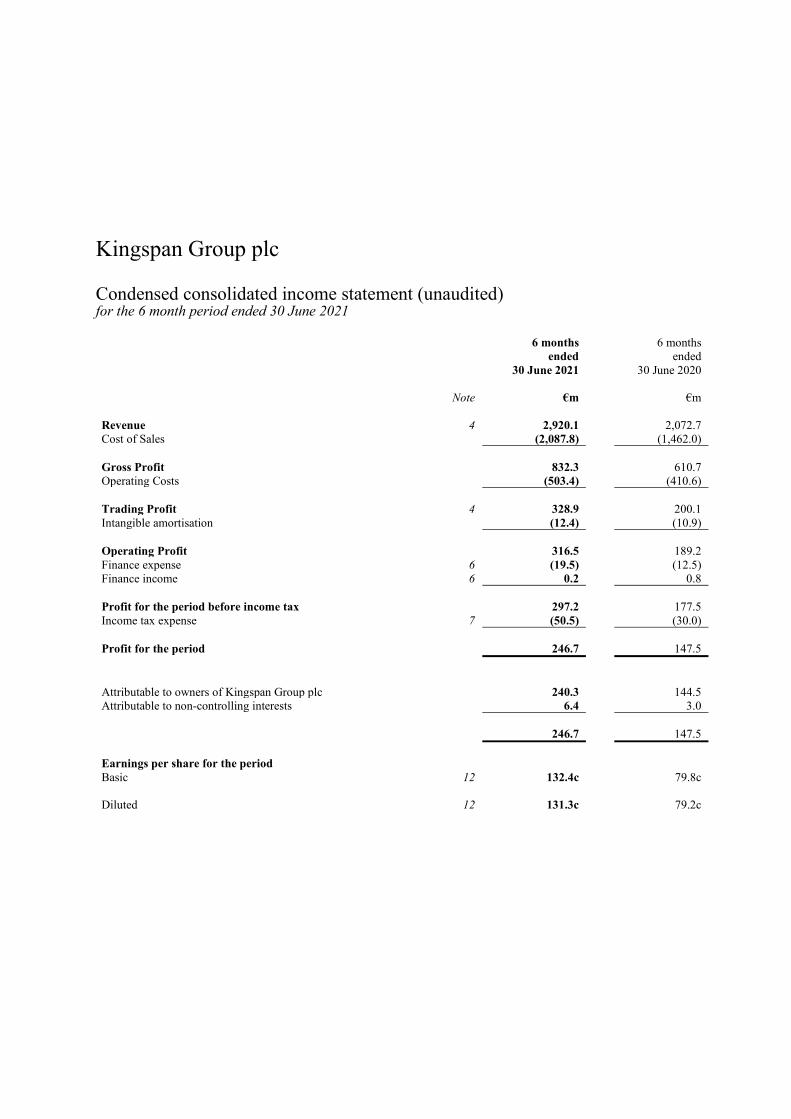
Kingspan Group plc Condensed consolidated income statement (unaudited) for the 6 month period ended 30 June 2021 6 months 6 months ended ended 30 June 2021 30 June 2020 Note €m €m Revenue 4 2,920.1 2,072.7 Cost of Sales (2,087.8) (1,462.0) Gross Profit
832.3
610.7
Operating Costs (503.4) (410.6) Trading Profit
4
328.9
200.1
Intangible amortisation (12.4) (10.9) Operating Profit 316.5 189.2 Finance expense 6 (19.5) (12.5) Finance income 6 0.2 0.8 Profit for the period before income tax 297.2 177.5 Income tax expense 7 (50.5) (30.0) Profit for the period 246.7 147.5 Attributable to owners of Kingspan Group plc
240.3
144.5
Attributable to non-controlling interests 6.4 3.0
246.7
147.5 Earnings per share for the period
Basic 12 132.4c 79.8c Diluted
12
131.3c
79.2c
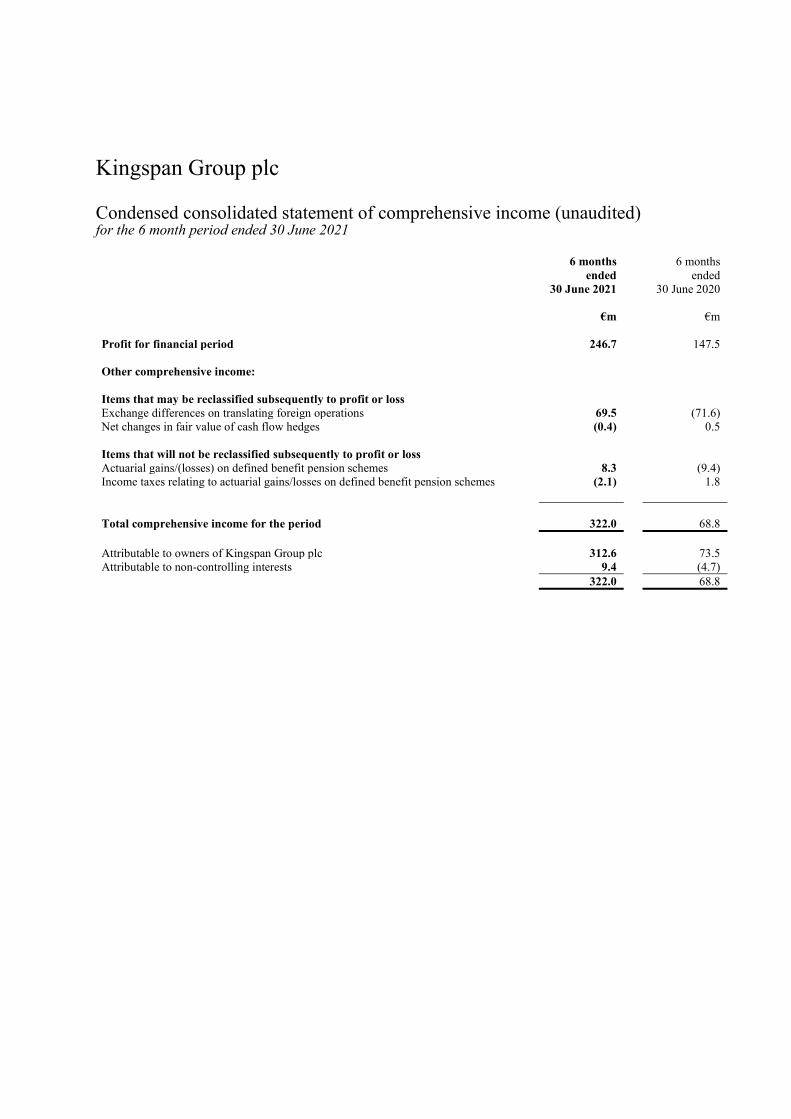
Kingspan Group plc Condensed consolidated statement of comprehensive income (unaudited) for the 6 month period ended 30 June 2021 6 months 6 months ended ended 30 June 2021 30 June 2020 €m €m Profit for financial period 246.7 147.5 Other comprehensive income:
Items that may be reclassified subsequently to profit or loss
Exchange differences on translating foreign operations 69.5 (71.6) Net changes in fair value of cash flow hedges (0.4) 0.5 Items that will not be reclassified subsequently to profit or loss Actuarial gains/(losses) on defined benefit pension schemes 8.3 (9.4) Income taxes relating to actuarial gains/losses on defined benefit pension schemes (2.1) 1.8 Total comprehensive income for the period
322.0
68.8
Attributable to owners of Kingspan Group plc 312.6 73.5 Attributable to non-controlling interests 9.4 (4.7) 322.0 68.8
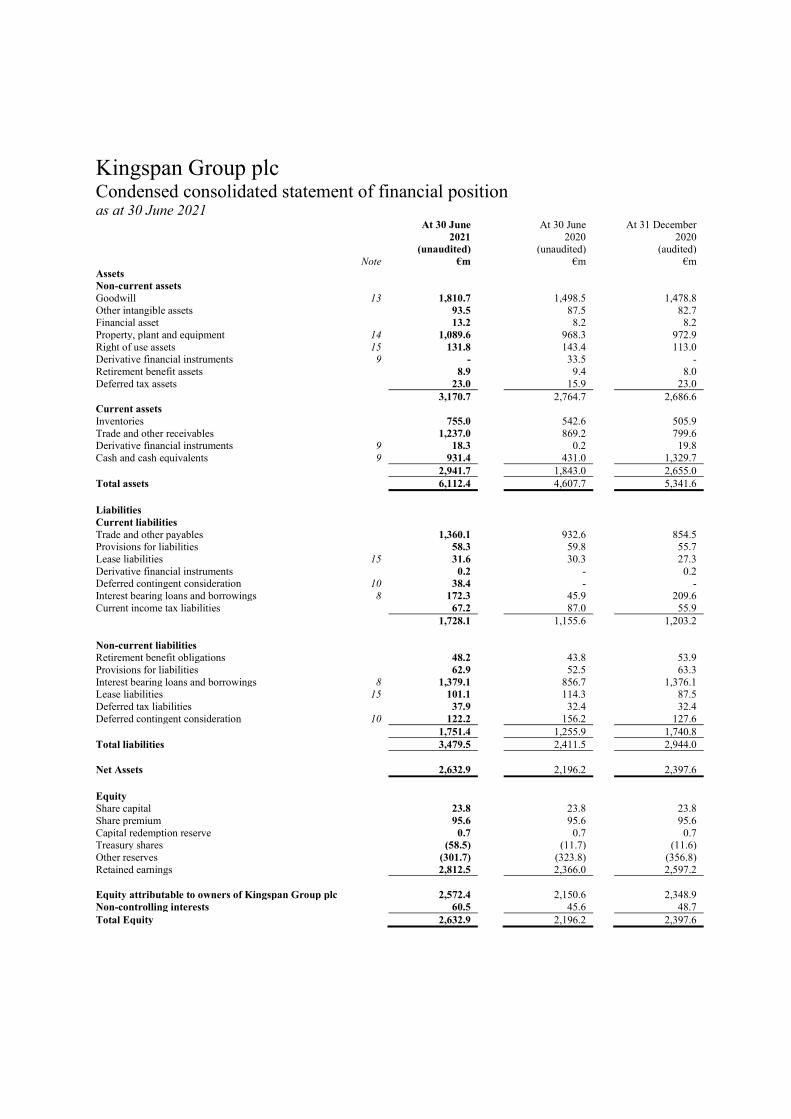
Kingspan Group plc Condensed consolidated statement of financial position as at 30 June 2021 At 30 June At 30 June At 31 December 2021
(unaudited) 2020
(unaudited) 2020
(audited) Note €m €m €m Assets Non-current assets Goodwill 13 1,810.7 1,498.5 1,478.8 Other intangible assets 93.5 87.5 82.7 Financial asset 13.2 8.2 8.2 Property, plant and equipment 14 1,089.6 968.3 972.9 Right of use assets 15 131.8 143.4 113.0 Derivative financial instruments 9 - 33.5 - Retirement benefit assets 8.9 9.4 8.0 Deferred tax assets 23.0 15.9 23.0 3,170.7 2,764.7 2,686.6 Current assets Inventories 755.0 542.6 505.9 Trade and other receivables 1,237.0 869.2 799.6 Derivative financial instruments 9 18.3 0.2 19.8 Cash and cash equivalents 9 931.4 431.0 1,329.7 2,941.7 1,843.0 2,655.0 Total assets 6,112.4 4,607.7 5,341.6 Liabilities Current liabilities Trade and other payables 1,360.1 932.6 854.5 Provisions for liabilities 58.3 59.8 55.7 Lease liabilities 15 31.6 30.3 27.3 Derivative financial instruments 0.2 - 0.2 Deferred contingent consideration 10 38.4 - - Interest bearing loans and borrowings 8 172.3 45.9 209.6 Current income tax liabilities 67.2 87.0 55.9 1,728.1 1,155.6 1,203.2 Non-current liabilities Retirement benefit obligations 48.2 43.8 53.9 Provisions for liabilities 62.9 52.5 63.3 Interest bearing loans and borrowings 8 1,379.1 856.7 1,376.1 Lease liabilities 15 101.1 114.3 87.5 Deferred tax liabilities 37.9 32.4 32.4 Deferred contingent consideration 10 122.2 156.2 127.6 1,751.4 1,255.9 1,740.8 Total liabilities 3,479.5 2,411.5 2,944.0 Net Assets
2,632.9
2,196.2
2,397.6
Equity
Share capital 23.8 23.8 23.8 Share premium 95.6 95.6 95.6 Capital redemption reserve 0.7 0.7 0.7 Treasury shares (58.5) (11.7) (11.6) Other reserves (301.7) (323.8) (356.8) Retained earnings 2,812.5 2,366.0 2,597.2 Equity attributable to owners of Kingspan Group plc 2,572.4 2,150.6 2,348.9 Non-controlling interests 60.5 45.6 48.7 Total Equity 2,632.9 2,196.2 2,397.6
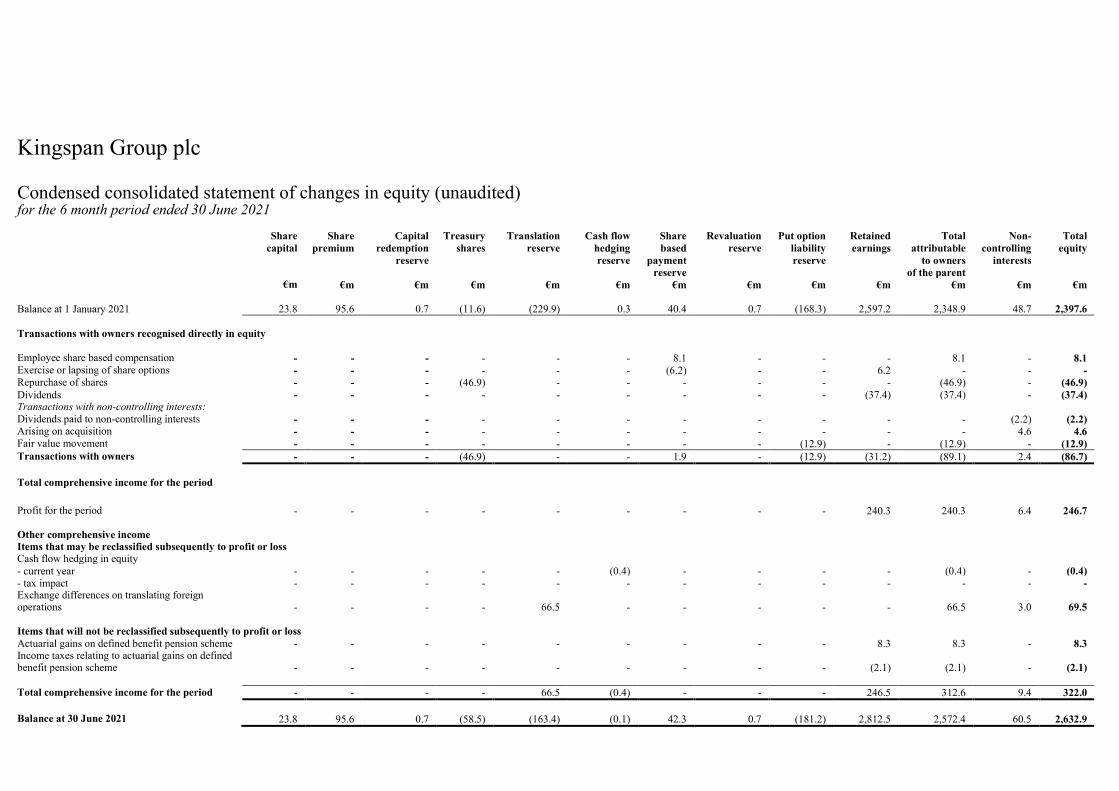
Kingspan Group plc Condensed consolidated statement of changes in equity (unaudited) for the 6 month period ended 30 June 2021
Share capital
Share premium
Capital redemption
reserve
Treasury shares
Translation reserve
Cash flow hedging reserve
Share based
payment reserve
Revaluation reserve
Put option liability reserve
Retained earnings
Total attributable
to owners of the parent
Non- controlling
interests
Total equity
€m €m €m €m €m €m €m €m €m €m €m €m €m Balance at 1 January 2021 23.8 95.6 0.7 (11.6) (229.9) 0.3 40.4 0.7 (168.3) 2,597.2 2,348.9 48.7 2,397.6 Transactions with owners recognised directly in equity Employee share based compensation - - - - - - 8.1 - - - 8.1 - 8.1 Exercise or lapsing of share options - - - - - - (6.2) - - 6.2 - - - Repurchase of shares - - - (46.9) - - - - - - (46.9) - (46.9) Dividends - - - - - - - - - (37.4) (37.4) - (37.4) Transactions with non-controlling interests: Dividends paid to non-controlling interests - - - - - - - - - - - (2.2) (2.2) Arising on acquisition - - - - - - - - - - - 4.6 4.6 Fair value movement - - - - - - - - (12.9) - (12.9) - (12.9) Transactions with owners - - - (46.9) - - 1.9 - (12.9) (31.2) (89.1) 2.4 (86.7) Total comprehensive income for the period
Profit for the period - - - - - - - - - 240.3 240.3 6.4 246.7
Other comprehensive income Items that may be reclassified subsequently to profit or loss Cash flow hedging in equity - current year - - - - - (0.4) - - - - (0.4) - (0.4) - tax impact - - - - - - - - - - - - - Exchange differences on translating foreign operations - - - - 66.5 - - - - - 66.5 3.0 69.5 Items that will not be reclassified subsequently to profit or loss Actuarial gains on defined benefit pension scheme - - - - - - - - - 8.3 8.3 - 8.3 Income taxes relating to actuarial gains on defined benefit pension scheme - - - - - - - - - (2.1) (2.1) - (2.1) Total comprehensive income for the period - - - - 66.5 (0.4) - - - 246.5 312.6 9.4 322.0 Balance at 30 June 2021
23.8
95.6
0.7
(58.5)
(163.4)
(0.1)
42.3
0.7
(181.2)
2,812.5
2,572.4
60.5
2,632.9
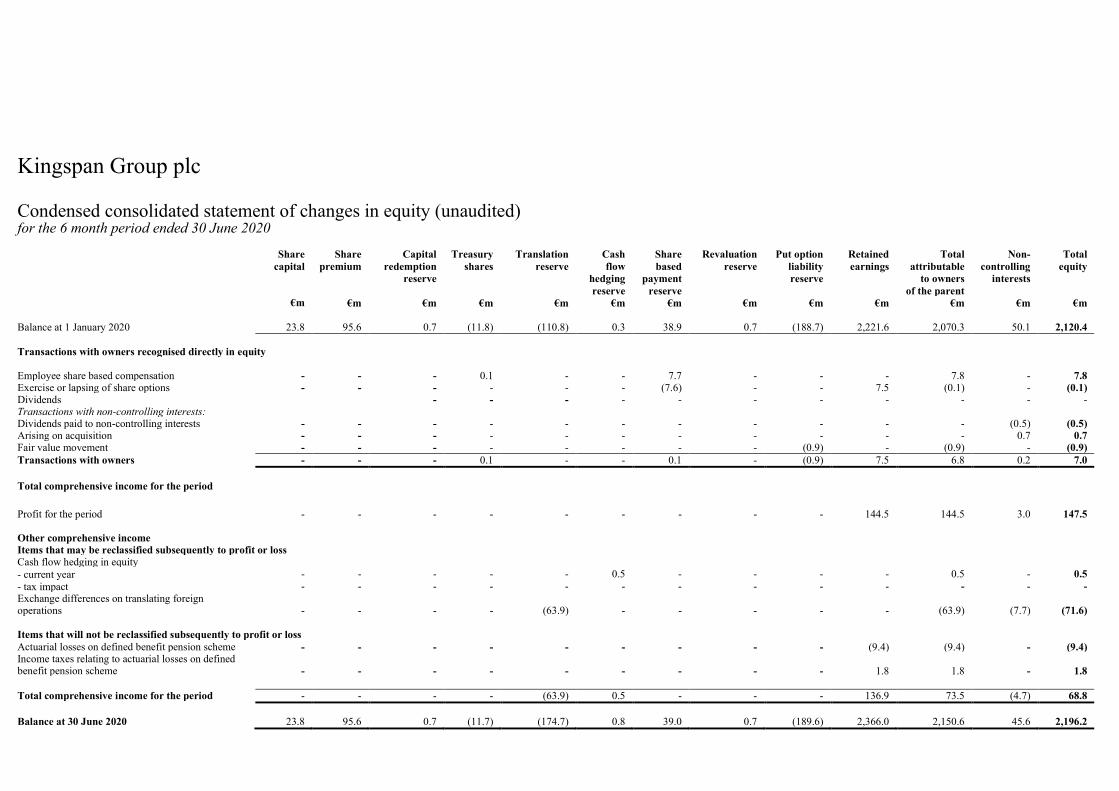
Kingspan Group plc Condensed consolidated statement of changes in equity (unaudited) for the 6 month period ended 30 June 2020
Share capital
Share premium
Capital redemption
reserve
Treasury shares
Translation reserve
Cash flow
hedging reserve
Share based
payment reserve
Revaluation reserve
Put option liability reserve
Retained earnings
Total attributable
to owners of the parent
Non- controlling
interests
Total equity
€m €m €m €m €m €m €m €m €m €m €m €m €m Balance at 1 January 2020 23.8 95.6 0.7 (11.8) (110.8) 0.3 38.9 0.7 (188.7) 2,221.6 2,070.3 50.1 2,120.4 Transactions with owners recognised directly in equity
Employee share based compensation - - - 0.1 - - 7.7 - - - 7.8 - 7.8 Exercise or lapsing of share options - - - - - - (7.6) - - 7.5 (0.1) - (0.1) Dividends - - - - - - - - - - - Transactions with non-controlling interests: Dividends paid to non-controlling interests - - - - - - - - - - - (0.5) (0.5) Arising on acquisition - - - - - - - - - - - 0.7 0.7 Fair value movement - - - - - - - - (0.9) - (0.9) - (0.9) Transactions with owners - - - 0.1 - - 0.1 - (0.9) 7.5 6.8 0.2 7.0 Total comprehensive income for the period
Profit for the period - - - - - - - - - 144.5 144.5 3.0 147.5
Other comprehensive income Items that may be reclassified subsequently to profit or loss Cash flow hedging in equity - current year - - - - - 0.5 - - - - 0.5 - 0.5 - tax impact - - - - - - - - - - - - - Exchange differences on translating foreign operations
-
-
-
- (63.9) - - - - - (63.9) (7.7) (71.6)
Items that will not be reclassified subsequently to profit or loss Actuarial losses on defined benefit pension scheme - - - - - - - - - (9.4) (9.4) - (9.4) Income taxes relating to actuarial losses on defined benefit pension scheme - - - - - - - - - 1.8 1.8 - 1.8 Total comprehensive income for the period - - - - (63.9) 0.5 - - - 136.9 73.5 (4.7) 68.8 Balance at 30 June 2020
23.8
95.6
0.7
(11.7)
(174.7)
0.8
39.0
0.7
(189.6)
2,366.0
2,150.6
45.6
2,196.2
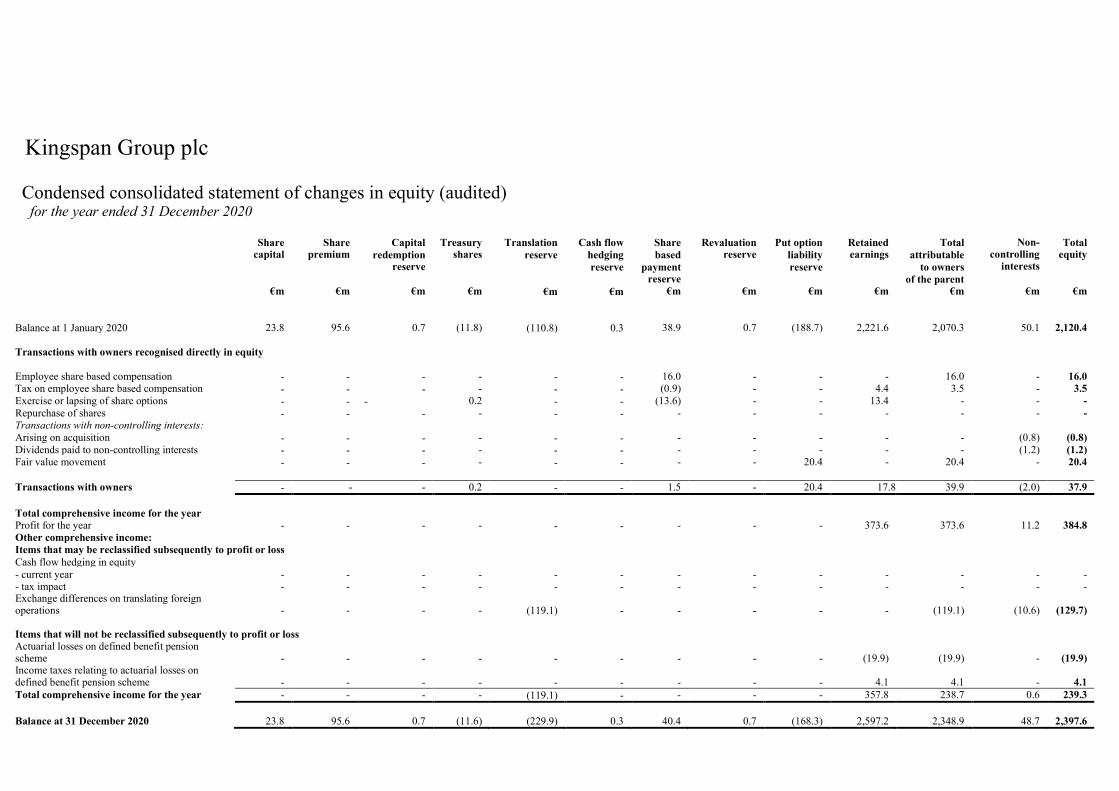
Kingspan Group plc Condensed consolidated statement of changes in equity (audited) for the year ended 31 December 2020
Share capital
Share premium
Capital redemption
reserve
Treasury shares
Translation reserve
Cash flow hedging reserve
Share based
payment reserve
Revaluation reserve
Put option liability reserve
Retained earnings
Total attributable
to owners of the parent
Non- controlling
interests
Total equity
€m €m €m €m €m €m €m €m €m €m €m €m €m
Balance at 1 January 2020
23.8
95.6
0.7
(11.8)
(110.8)
0.3
38.9
0.7
(188.7)
2,221.6
2,070.3
50.1
2,120.4
Transactions with owners recognised directly in equity Employee share based compensation - - - - - - 16.0 - - - 16.0 - 16.0 Tax on employee share based compensation - - - - - - (0.9) - - 4.4 3.5 - 3.5 Exercise or lapsing of share options - - - 0.2 - - (13.6) - - 13.4 - - - Repurchase of shares - - - - - - - - - - - - - Transactions with non-controlling interests: Arising on acquisition - - - - - - - - - - - (0.8) (0.8) Dividends paid to non-controlling interests - - - - - - - - - - - (1.2) (1.2) Fair value movement - - - - - - - - 20.4 - 20.4 - 20.4 Transactions with owners - - - 0.2 - - 1.5 - 20.4 17.8 39.9 (2.0) 37.9 Total comprehensive income for the year
Profit for the year - - - - - - - - - 373.6 373.6 11.2 384.8 Other comprehensive income: Items that may be reclassified subsequently to profit or loss Cash flow hedging in equity - current year - - - - - - - - - - - - - - tax impact - - - - - - - - - - - - - Exchange differences on translating foreign operations - - - - (119.1) - - - - - (119.1) (10.6) (129.7) Items that will not be reclassified subsequently to profit or loss Actuarial losses on defined benefit pension scheme - - - - - - - - - (19.9) (19.9) - (19.9) Income taxes relating to actuarial losses on defined benefit pension scheme - - - - - - - - - 4.1 4.1 - 4.1 Total comprehensive income for the year - - - - (119.1) - - - - 357.8 238.7 0.6 239.3 Balance at 31 December 2020
23.8
95.6
0.7
(11.6)
(229.9)
0.3
40.4
0.7
(168.3)
2,597.2
2,348.9
48.7
2,397.6
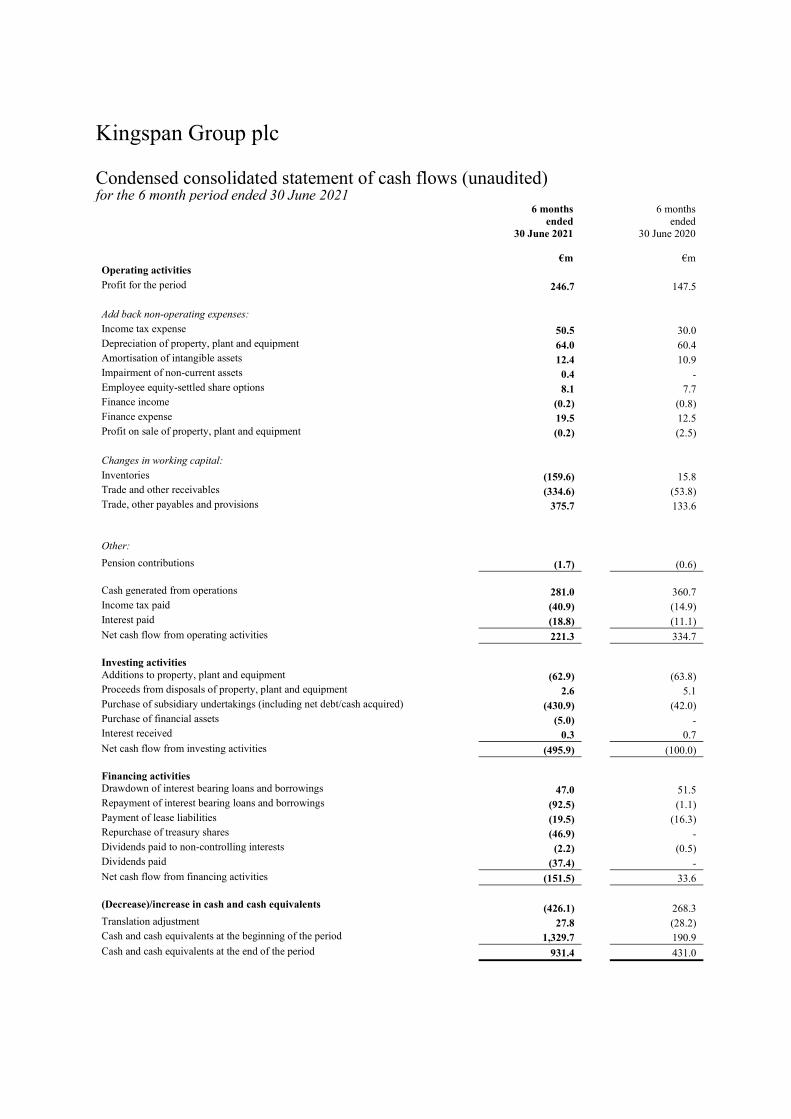
Operating activities Profit for the period 246.7 147.5 Add back non-operating expenses: Income tax expense 50.5 30.0 Depreciation of property, plant and equipment 64.0 60.4 Amortisation of intangible assets 12.4 10.9 Impairment of non-current assets 0.4 - Employee equity-settled share options 8.1 7.7 Finance income (0.2) (0.8) Finance expense 19.5 12.5 Profit on sale of property, plant and equipment (0.2) (2.5) Changes in working capital: Inventories (159.6) 15.8 Trade and other receivables (334.6) (53.8) Trade, other payables and provisions 375.7 133.6 Other:
Pension contributions (1.7) (0.6) Cash generated from operations 281.0 360.7 Income tax paid (40.9) (14.9) Interest paid (18.8) (11.1) Net cash flow from operating activities 221.3 334.7 Investing activities
Additions to property, plant and equipment (62.9) (63.8) Proceeds from disposals of property, plant and equipment 2.6 5.1 Purchase of subsidiary undertakings (including net debt/cash acquired) (430.9) (42.0) Purchase of financial assets (5.0) - Interest received 0.3 0.7 Net cash flow from investing activities (495.9) (100.0) Financing activities
Drawdown of interest bearing loans and borrowings 47.0 51.5 Repayment of interest bearing loans and borrowings (92.5) (1.1) Payment of lease liabilities (19.5) (16.3) Repurchase of treasury shares (46.9) - Dividends paid to non-controlling interests (2.2) (0.5) Dividends paid (37.4) - Net cash flow from financing activities (151.5) 33.6 (Decrease)/increase in cash and cash equivalents
(426.1)
268.3
Translation adjustment 27.8 (28.2) Cash and cash equivalents at the beginning of the period 1,329.7 190.9 Cash and cash equivalents at the end of the period 931.4 431.0
Kingspan Group plc Condensed consolidated statement of cash flows (unaudited) for the 6 month period ended 30 June 2021 6 months
ended 30 June 2021
€m
6 months ended
30 June 2020
€m
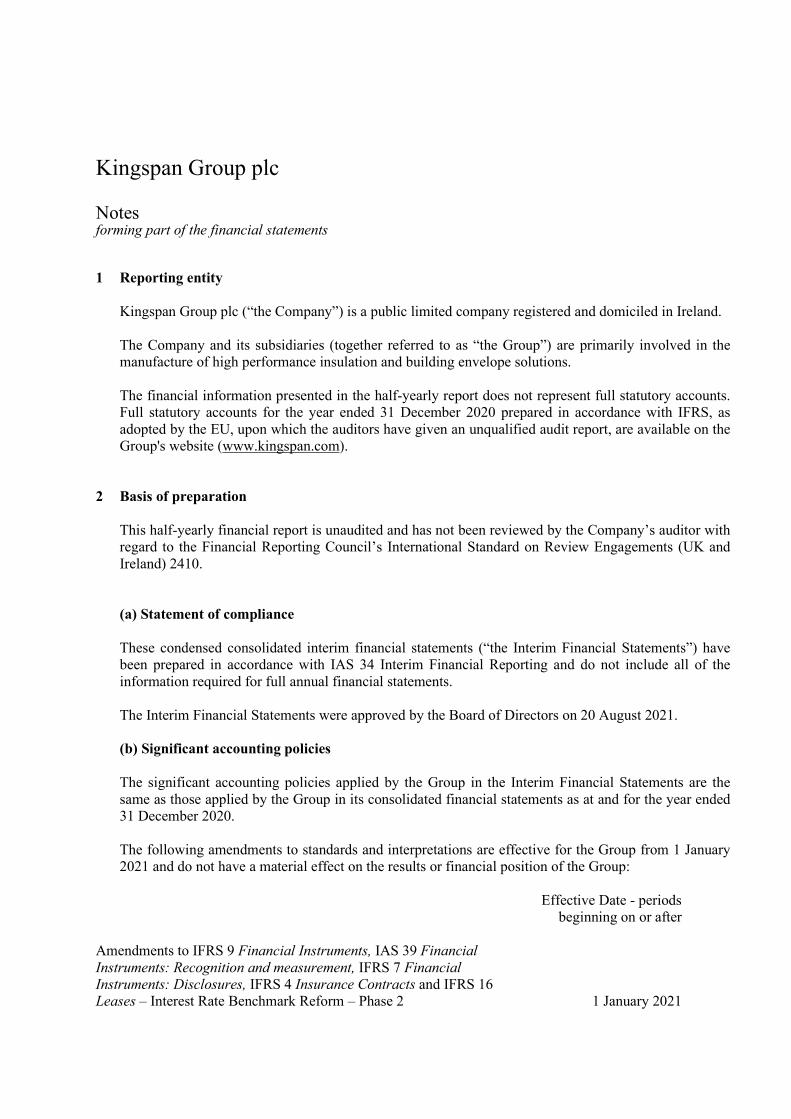
Kingspan Group plc Notes forming part of the financial statements 1 Reporting entity
Kingspan Group plc (“the Company”) is a public limited company registered and domiciled in Ireland. The Company and its subsidiaries (together referred to as “the Group”) are primarily involved in the manufacture of high performance insulation and building envelope solutions. The financial information presented in the half-yearly report does not represent full statutory accounts. Full statutory accounts for the year ended 31 December 2020 prepared in accordance with IFRS, as adopted by the EU, upon which the auditors have given an unqualified audit report, are available on the Group's website (www.kingspan.com).
2 Basis of preparation This half-yearly financial report is unaudited and has not been reviewed by the Company’s auditor with regard to the Financial Reporting Council’s International Standard on Review Engagements (UK and Ireland) 2410. (a) Statement of compliance These condensed consolidated interim financial statements (“the Interim Financial Statements”) have been prepared in accordance with IAS 34 Interim Financial Reporting and do not include all of the information required for full annual financial statements. The Interim Financial Statements were approved by the Board of Directors on 20 August 2021. (b) Significant accounting policies The significant accounting policies applied by the Group in the Interim Financial Statements are the same as those applied by the Group in its consolidated financial statements as at and for the year ended 31 December 2020. The following amendments to standards and interpretations are effective for the Group from 1 January 2021 and do not have a material effect on the results or financial position of the Group:
Effective Date - periods
beginning on or after Amendments to IFRS 9 Financial Instruments, IAS 39 Financial Instruments: Recognition and measurement, IFRS 7 Financial Instruments: Disclosures, IFRS 4 Insurance Contracts and IFRS 16 Leases – Interest Rate Benchmark Reform – Phase 2
1 January 2021
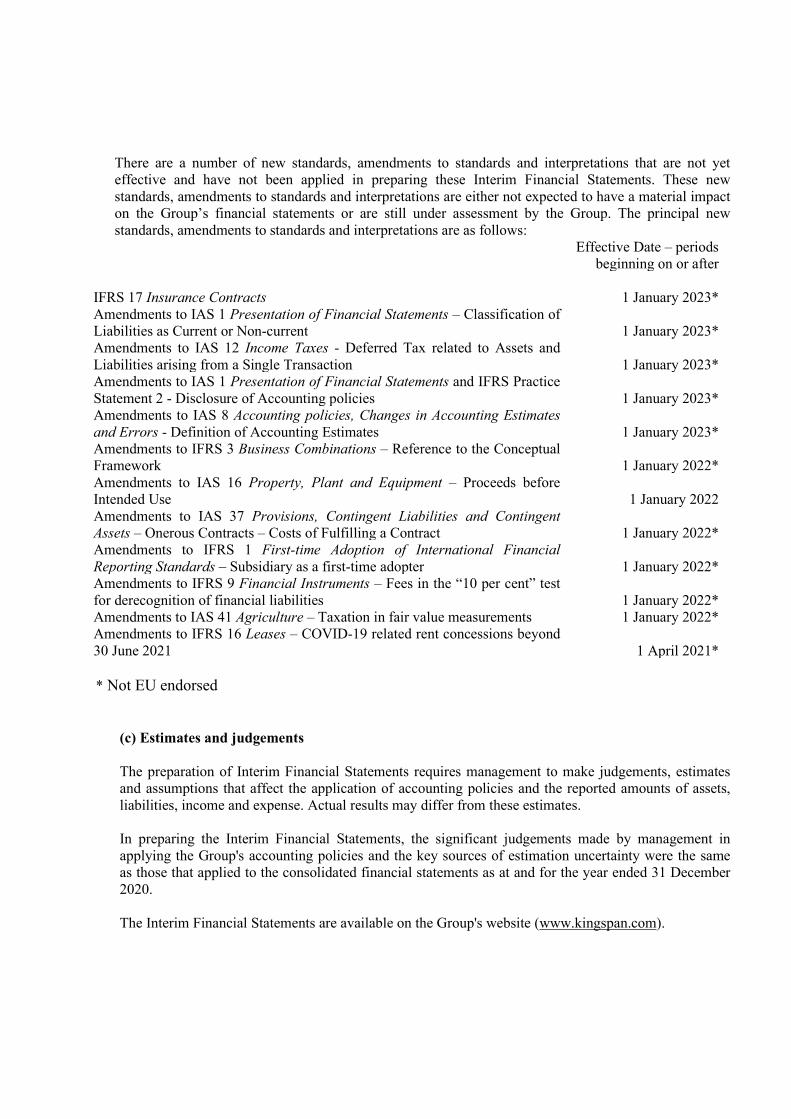
There are a number of new standards, amendments to standards and interpretations that are not yet effective and have not been applied in preparing these Interim Financial Statements. These new standards, amendments to standards and interpretations are either not expected to have a material impact on the Group’s financial statements or are still under assessment by the Group. The principal new standards, amendments to standards and interpretations are as follows:
Effective Date – periods beginning on or after
IFRS 17 Insurance Contracts 1 January 2023* Amendments to IAS 1 Presentation of Financial Statements – Classification of Liabilities as Current or Non-current
1 January 2023*
Amendments to IAS 12 Income Taxes - Deferred Tax related to Assets and Liabilities arising from a Single Transaction
1 January 2023*
Amendments to IAS 1 Presentation of Financial Statements and IFRS Practice Statement 2 - Disclosure of Accounting policies
1 January 2023*
Amendments to IAS 8 Accounting policies, Changes in Accounting Estimates and Errors - Definition of Accounting Estimates
1 January 2023*
Amendments to IFRS 3 Business Combinations – Reference to the Conceptual Framework
1 January 2022*
Amendments to IAS 16 Property, Plant and Equipment – Proceeds before Intended Use
1 January 2022
Amendments to IAS 37 Provisions, Contingent Liabilities and Contingent Assets – Onerous Contracts – Costs of Fulfilling a Contract
1 January 2022*
Amendments to IFRS 1 First-time Adoption of International Financial Reporting Standards – Subsidiary as a first-time adopter
1 January 2022*
Amendments to IFRS 9 Financial Instruments – Fees in the “10 per cent” test for derecognition of financial liabilities
1 January 2022*
Amendments to IAS 41 Agriculture – Taxation in fair value measurements 1 January 2022* Amendments to IFRS 16 Leases – COVID-19 related rent concessions beyond 30 June 2021
1 April 2021*
* Not EU endorsed
(c) Estimates and judgements The preparation of Interim Financial Statements requires management to make judgements, estimates and assumptions that affect the application of accounting policies and the reported amounts of assets, liabilities, income and expense. Actual results may differ from these estimates. In preparing the Interim Financial Statements, the significant judgements made by management in applying the Group's accounting policies and the key sources of estimation uncertainty were the same as those that applied to the consolidated financial statements as at and for the year ended 31 December 2020.
The Interim Financial Statements are available on the Group's website (www.kingspan.com).
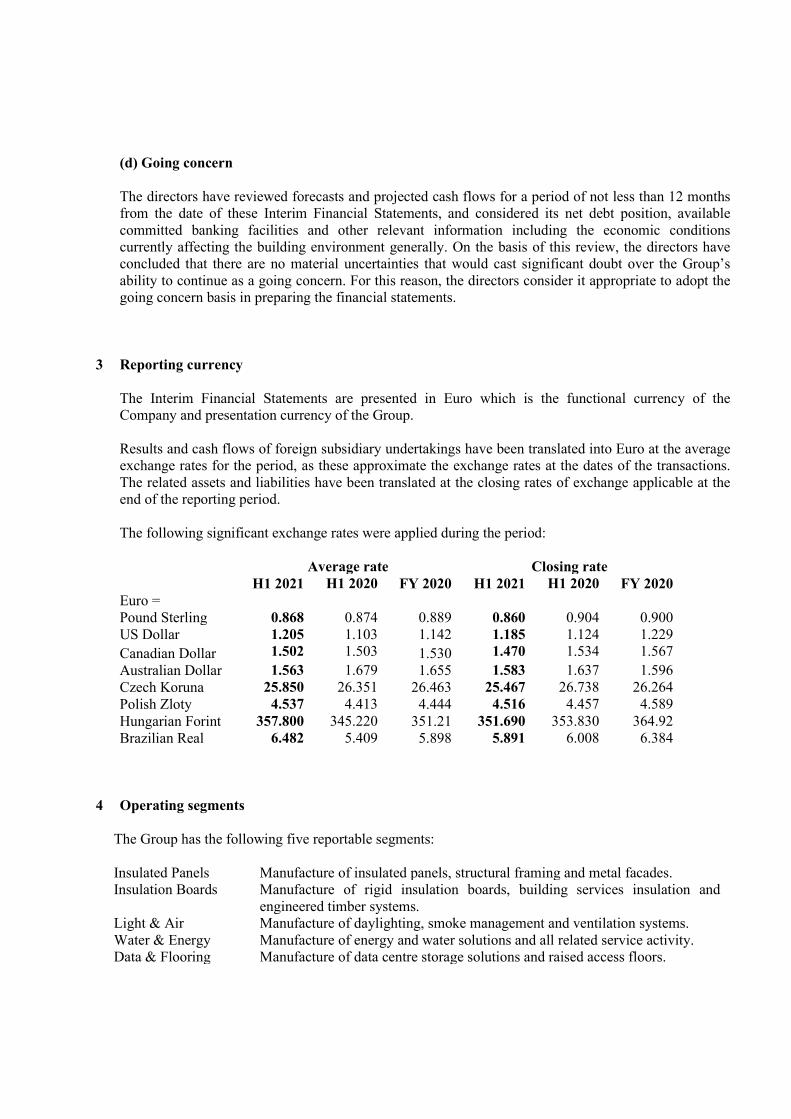
(d) Going concern The directors have reviewed forecasts and projected cash flows for a period of not less than 12 months from the date of these Interim Financial Statements, and considered its net debt position, available committed banking facilities and other relevant information including the economic conditions currently affecting the building environment generally. On the basis of this review, the directors have concluded that there are no material uncertainties that would cast significant doubt over the Group’s ability to continue as a going concern. For this reason, the directors consider it appropriate to adopt the going concern basis in preparing the financial statements.
3 Reporting currency The Interim Financial Statements are presented in Euro which is the functional currency of the Company and presentation currency of the Group. Results and cash flows of foreign subsidiary undertakings have been translated into Euro at the average exchange rates for the period, as these approximate the exchange rates at the dates of the transactions. The related assets and liabilities have been translated at the closing rates of exchange applicable at the end of the reporting period. The following significant exchange rates were applied during the period: Average rate Closing rate H1 2021 H1 2020 FY 2020 H1 2021 H1 2020 FY 2020 Euro = Pound Sterling 0.868 0.874 0.889 0.860 0.904 0.900 US Dollar 1.205 1.103 1.142 1.185 1.124 1.229 Canadian Dollar 1.502 1.503 1.530 1.470 1.534 1.567 Australian Dollar 1.563 1.679 1.655 1.583 1.637 1.596 Czech Koruna 25.850 26.351 26.463 25.467 26.738 26.264 Polish Zloty 4.537 4.413 4.444 4.516 4.457 4.589 Hungarian Forint 357.800 345.220 351.21 351.690 353.830 364.92 Brazilian Real 6.482 5.409 5.898 5.891 6.008 6.384
4 Operating segments
The Group has the following five reportable segments: Insulated Panels Manufacture of insulated panels, structural framing and metal facades. Insulation Boards Manufacture of rigid insulation boards, building services insulation and
engineered timber systems. Light & Air Manufacture of daylighting, smoke management and ventilation systems. Water & Energy Manufacture of energy and water solutions and all related service activity. Data & Flooring Manufacture of data centre storage solutions and raised access floors.
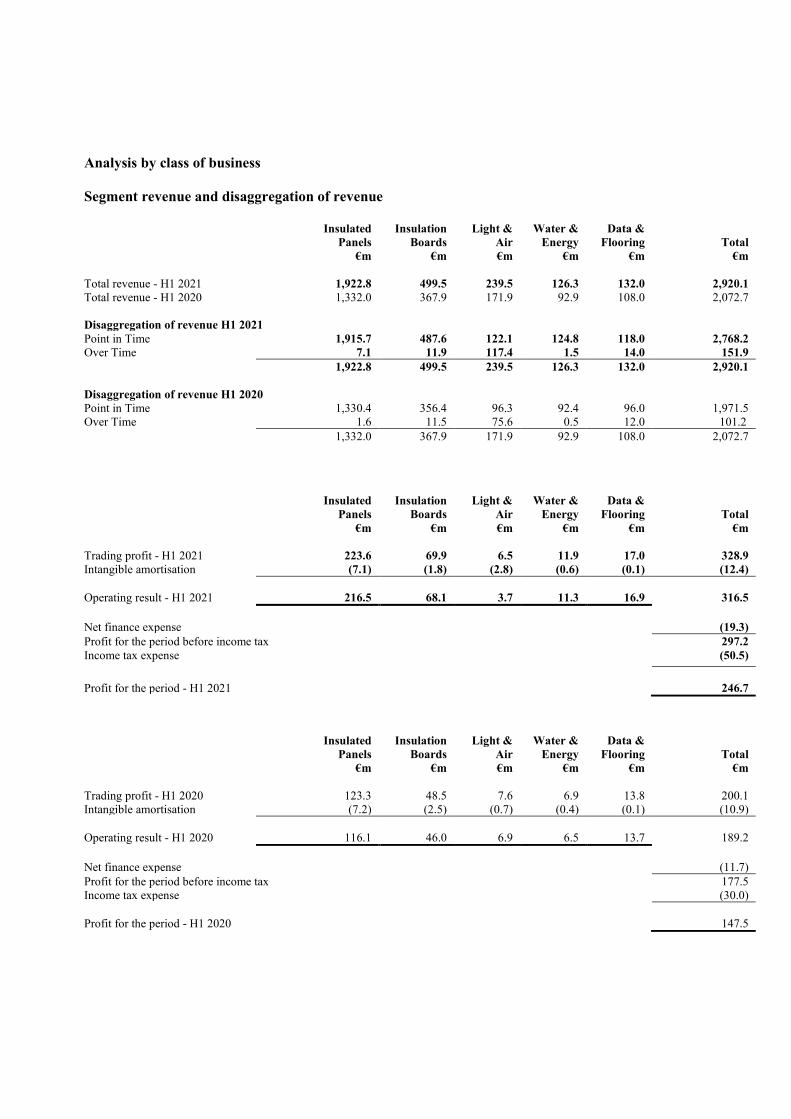
Analysis by class of business
Segment revenue and disaggregation of revenue Insulated
Panels €m
Insulation Boards
€m
Light & Air €m
Water & Energy
€m
Data & Flooring
€m Total
€m Total revenue - H1 2021
1,922.8
499.5
239.5
126.3
132.0
2,920.1
Total revenue - H1 2020 1,332.0 367.9 171.9 92.9 108.0 2,072.7 Disaggregation of revenue H1 2021 Point in Time 1,915.7 487.6 122.1 124.8 118.0 2,768.2 Over Time 7.1 11.9 117.4 1.5 14.0 151.9 1,922.8 499.5 239.5 126.3 132.0 2,920.1 Disaggregation of revenue H1 2020 Point in Time 1,330.4 356.4 96.3 92.4 96.0 1,971.5 Over Time 1.6 11.5 75.6 0.5 12.0 101.2 1,332.0 367.9 171.9 92.9 108.0 2,072.7
Insulated Panels
€m
Insulation Boards
€m
Light & Air €m
Water & Energy
€m
Data & Flooring
€m Total
€m Trading profit - H1 2021
223.6
69.9
6.5
11.9
17.0
328.9
Intangible amortisation (7.1) (1.8) (2.8) (0.6) (0.1) (12.4) Operating result - H1 2021
216.5
68.1
3.7
11.3
16.9
316.5
Net finance expense
(19.3)
Profit for the period before income tax 297.2 Income tax expense (50.5) Profit for the period - H1 2021
246.7
Insulated Panels
€m
Insulation Boards
€m
Light & Air €m
Water & Energy
€m
Data & Flooring
€m Total
€m Trading profit - H1 2020
123.3
48.5
7.6
6.9
13.8
200.1
Intangible amortisation (7.2) (2.5) (0.7) (0.4) (0.1) (10.9) Operating result - H1 2020
116.1
46.0
6.9
6.5
13.7
189.2
Net finance expense
(11.7)
Profit for the period before income tax 177.5 Income tax expense (30.0) Profit for the period - H1 2020
147.5
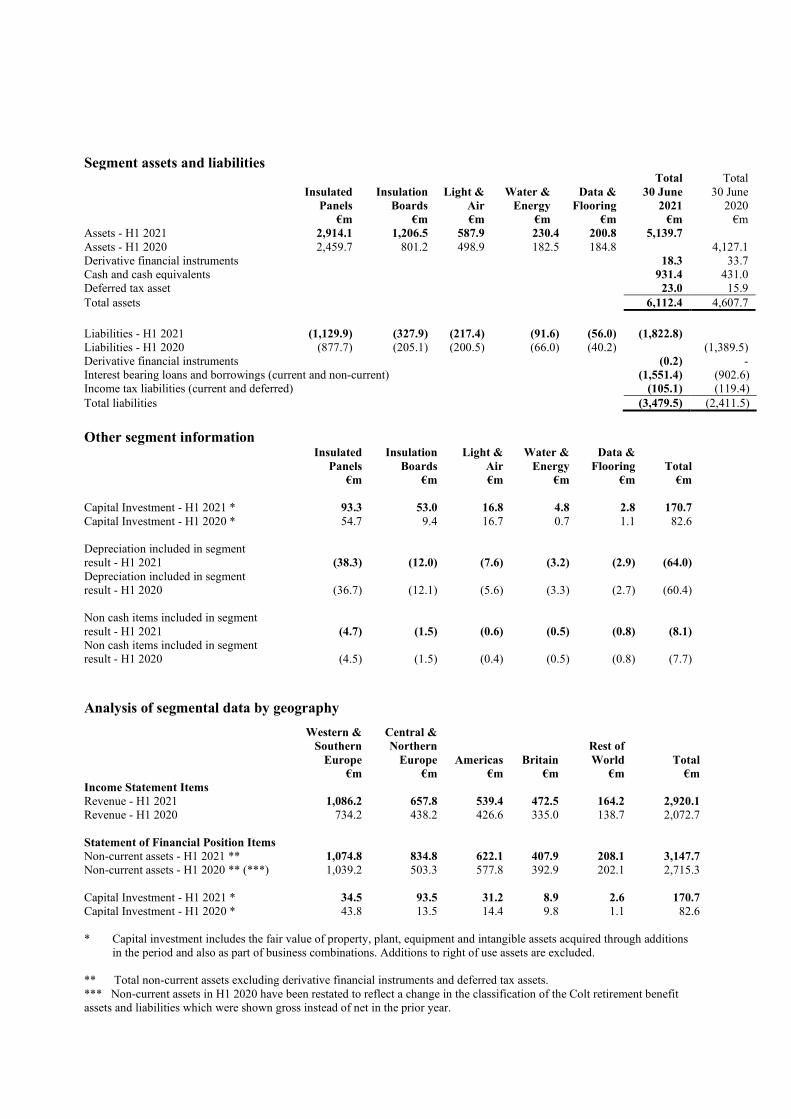
Segment assets and liabilities
Insulated Panels
€m
Insulation Boards
€m
Light & Air €m
Water & Energy
€m
Data & Flooring
€m
Total 30 June
2021 €m
Total 30 June
2020 €m
Assets - H1 2021 2,914.1 1,206.5 587.9 230.4 200.8 5,139.7 Assets - H1 2020 2,459.7 801.2 498.9 182.5 184.8 4,127.1 Derivative financial instruments 18.3 33.7 Cash and cash equivalents 931.4 431.0 Deferred tax asset 23.0 15.9 Total assets 6,112.4 4,607.7 Liabilities - H1 2021 (1,129.9) (327.9) (217.4) (91.6) (56.0) (1,822.8) Liabilities - H1 2020 (877.7) (205.1) (200.5) (66.0) (40.2) (1,389.5) Derivative financial instruments (0.2) - Interest bearing loans and borrowings (current and non-current) (1,551.4) (902.6) Income tax liabilities (current and deferred) (105.1) (119.4) Total liabilities (3,479.5) (2,411.5)
Other segment information Insulated
Panels €m
Insulation Boards
€m
Light & Air €m
Water & Energy
€m
Data & Flooring
€m Total
€m Capital Investment - H1 2021 * 93.3 53.0 16.8 4.8 2.8 170.7 Capital Investment - H1 2020 * 54.7 9.4 16.7 0.7 1.1 82.6 Depreciation included in segment result - H1 2021 (38.3) (12.0) (7.6) (3.2) (2.9) (64.0) Depreciation included in segment result - H1 2020 (36.7) (12.1) (5.6) (3.3) (2.7) (60.4) Non cash items included in segment result - H1 2021 (4.7) (1.5) (0.6) (0.5) (0.8) (8.1) Non cash items included in segment result - H1 2020 (4.5) (1.5) (0.4) (0.5) (0.8) (7.7)
Analysis of segmental data by geography Western &
Southern Europe
€m
Central & Northern
Europe €m
Americas €m
Britain €m
Rest of World
€m
Total €m
Income Statement Items Revenue - H1 2021 1,086.2 657.8 539.4 472.5 164.2 2,920.1 Revenue - H1 2020 734.2 438.2 426.6 335.0 138.7 2,072.7 Statement of Financial Position Items Non-current assets - H1 2021 ** 1,074.8 834.8 622.1 407.9 208.1 3,147.7 Non-current assets - H1 2020 ** (***) 1,039.2 503.3 577.8 392.9 202.1 2,715.3 Capital Investment - H1 2021 * 34.5 93.5 31.2 8.9 2.6 170.7 Capital Investment - H1 2020 * 43.8 13.5 14.4 9.8 1.1 82.6 * Capital investment includes the fair value of property, plant, equipment and intangible assets acquired through additions
in the period and also as part of business combinations. Additions to right of use assets are excluded. ** Total non-current assets excluding derivative financial instruments and deferred tax assets. *** Non-current assets in H1 2020 have been restated to reflect a change in the classification of the Colt retirement benefit assets and liabilities which were shown gross instead of net in the prior year.
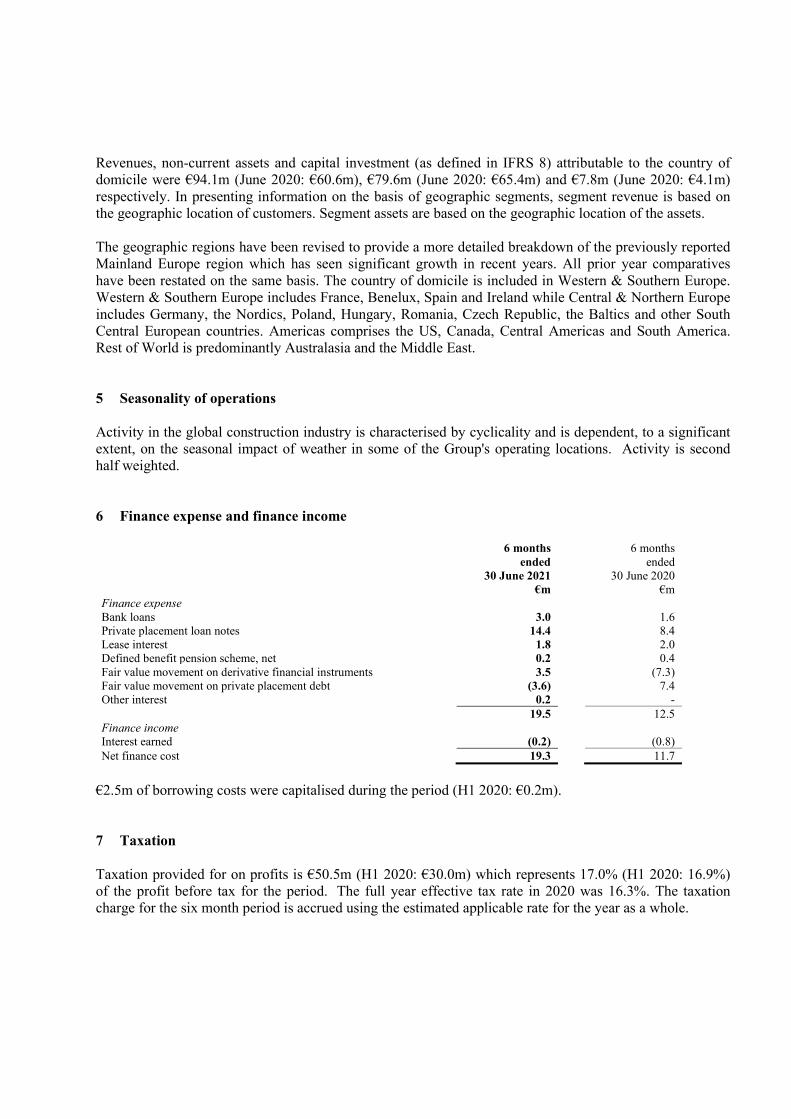
Revenues, non-current assets and capital investment (as defined in IFRS 8) attributable to the country of domicile were €94.1m (June 2020: €60.6m), €79.6m (June 2020: €65.4m) and €7.8m (June 2020: €4.1m) respectively. In presenting information on the basis of geographic segments, segment revenue is based on the geographic location of customers. Segment assets are based on the geographic location of the assets. The geographic regions have been revised to provide a more detailed breakdown of the previously reported Mainland Europe region which has seen significant growth in recent years. All prior year comparatives have been restated on the same basis. The country of domicile is included in Western & Southern Europe. Western & Southern Europe includes France, Benelux, Spain and Ireland while Central & Northern Europe includes Germany, the Nordics, Poland, Hungary, Romania, Czech Republic, the Baltics and other South Central European countries. Americas comprises the US, Canada, Central Americas and South America. Rest of World is predominantly Australasia and the Middle East. 5 Seasonality of operations Activity in the global construction industry is characterised by cyclicality and is dependent, to a significant extent, on the seasonal impact of weather in some of the Group's operating locations. Activity is second half weighted. 6 Finance expense and finance income 6 months
ended 30 June 2021
€m
6 months ended
30 June 2020 €m
Finance expense Bank loans 3.0 1.6 Private placement loan notes 14.4 8.4 Lease interest 1.8 2.0 Defined benefit pension scheme, net 0.2 0.4 Fair value movement on derivative financial instruments 3.5 (7.3) Fair value movement on private placement debt Other interest
(3.6) 0.2
7.4 -
19.5 12.5 Finance income Interest earned (0.2) (0.8) Net finance cost 19.3 11.7
€2.5m of borrowing costs were capitalised during the period (H1 2020: €0.2m). 7 Taxation
Taxation provided for on profits is €50.5m (H1 2020: €30.0m) which represents 17.0% (H1 2020: 16.9%) of the profit before tax for the period. The full year effective tax rate in 2020 was 16.3%. The taxation charge for the six month period is accrued using the estimated applicable rate for the year as a whole.
8 Analysis of net debt
At 30 June 2021
€m
At
30 June 2020 €m
At 31 December
2020 €m
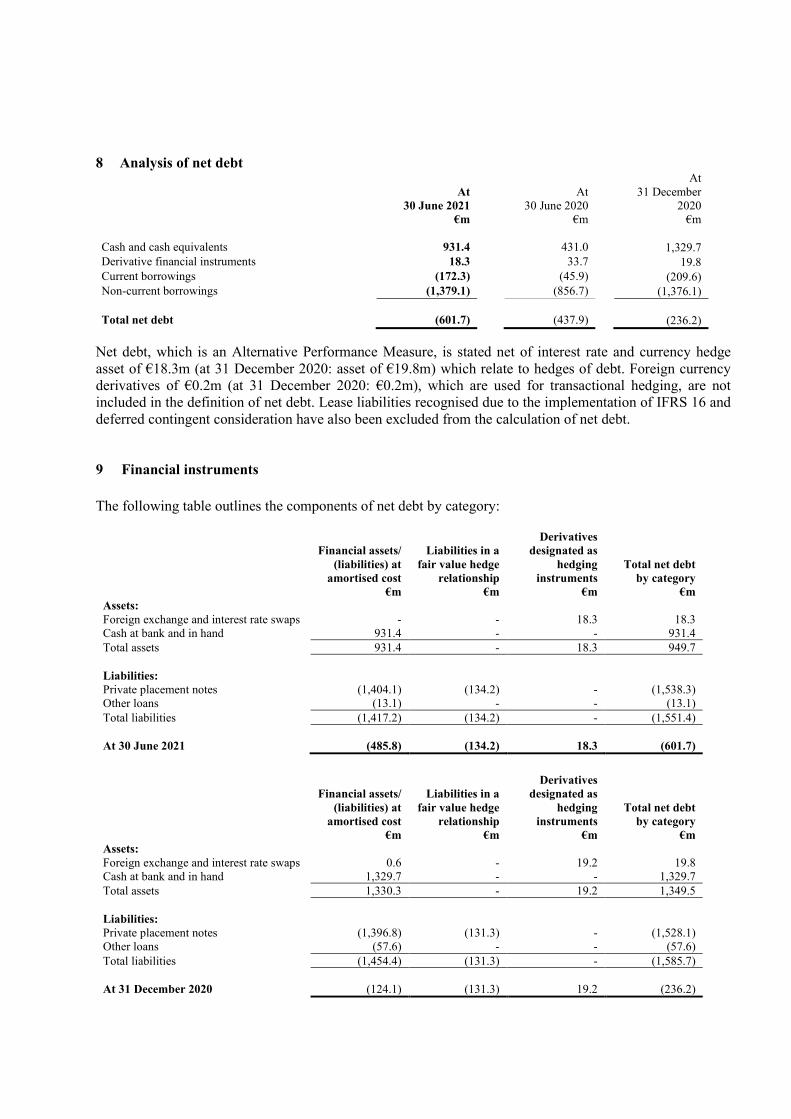
Cash and cash equivalents 931.4 431.0 1,329.7 Derivative financial instruments 18.3 33.7 19.8 Current borrowings (172.3) (45.9) (209.6) Non-current borrowings (1,379.1) (856.7) (1,376.1) Total net debt
(601.7)
(437.9)
(236.2)
Net debt, which is an Alternative Performance Measure, is stated net of interest rate and currency hedge asset of €18.3m (at 31 December 2020: asset of €19.8m) which relate to hedges of debt. Foreign currency derivatives of €0.2m (at 31 December 2020: €0.2m), which are used for transactional hedging, are not included in the definition of net debt. Lease liabilities recognised due to the implementation of IFRS 16 and deferred contingent consideration have also been excluded from the calculation of net debt. 9 Financial instruments The following table outlines the components of net debt by category:
Financial assets/
(liabilities) at amortised cost
€m
Liabilities in a
fair value hedge relationship
€m
Derivatives designated as
hedging instruments
€m
Total net debt by category
€m Assets: Foreign exchange and interest rate swaps - - 18.3 18.3 Cash at bank and in hand 931.4 - - 931.4 Total assets 931.4 - 18.3 949.7 Liabilities:
Private placement notes (1,404.1) (134.2) - (1,538.3) Other loans (13.1) - - (13.1) Total liabilities (1,417.2) (134.2) - (1,551.4) At 30 June 2021
(485.8)
(134.2)
18.3
(601.7)
Financial assets/
(liabilities) at amortised cost
€m
Liabilities in a
fair value hedge relationship
€m
Derivatives designated as
hedging instruments
€m
Total net debt by category
€m Assets: Foreign exchange and interest rate swaps 0.6 - 19.2 19.8 Cash at bank and in hand 1,329.7 - - 1,329.7 Total assets 1,330.3 - 19.2 1,349.5 Liabilities:
Private placement notes (1,396.8) (131.3) - (1,528.1) Other loans (57.6) - - (57.6) Total liabilities (1,454.4) (131.3) - (1,585.7) At 31 December 2020 (124.1) (131.3) 19.2 (236.2)

Financial assets/
(liabilities) at amortised cost
€m
Liabilities in a
fair value hedge relationship
€m
Derivatives
designated as hedging
instruments €m
Total net debt by category
€m Assets: Foreign exchange and interest rate swaps - - 33.7 33.7 Cash at bank and in hand 431.0 - - 431.0 Total assets 431.0 - 33.7 464.7 Liabilities:
Private placement notes (699.3) (142.8) - (842.1) Other loans (60.5) - - (60.5) Total liabilities (759.8) (142.8) - (902.6) At 30 June 2020
(328.8)
(142.8)
33.7
(437.9)
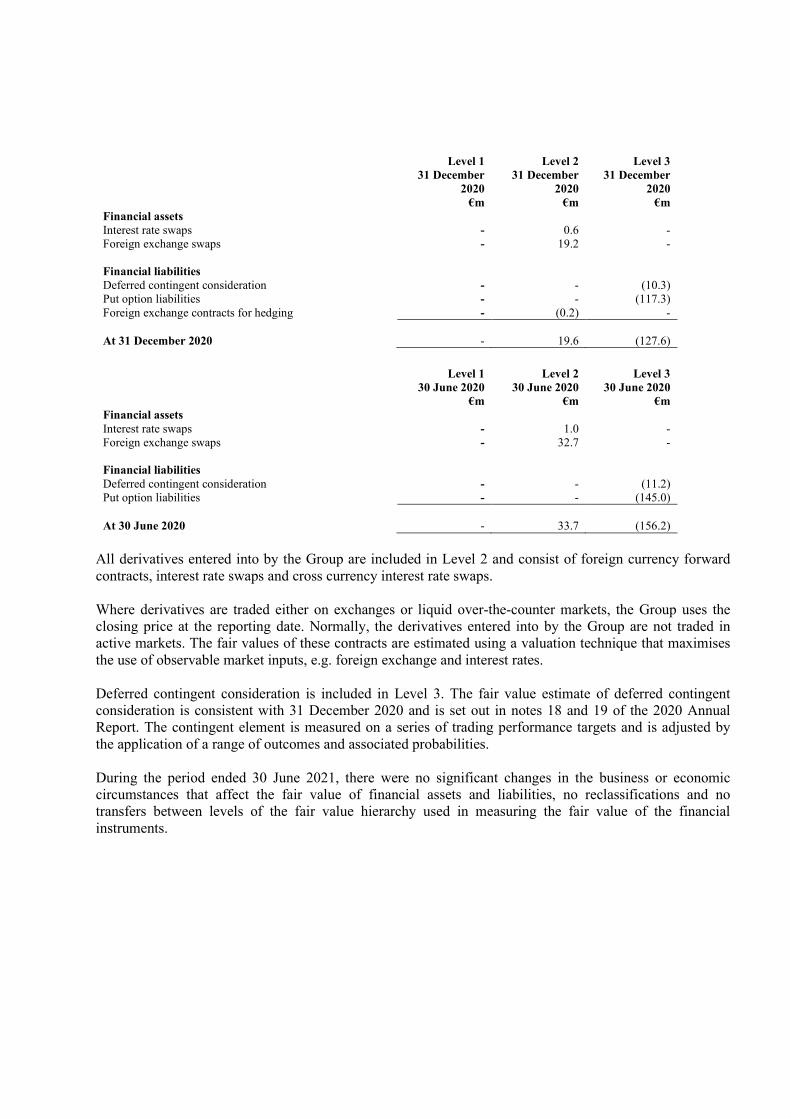
The Group’s private placement loan notes of €1,538.3m (at 31 December 2020: €1,528.1m) have a weighted average maturity of 6.2 years (at 31 December 2020: 6.1 years). Included in cash at bank and in hand are overdrawn positions of €1,433.6m (June 2020: €1,141.7m). These balances form part of a notional cash pool arrangement and are netted against cash balances of €1,518.4m (June 2020: €1,257.8m). There is legal right of offset between these balances and the balances are physically settled on a regular basis. Fair value of financial instruments carried at fair value Financial instruments recognised at fair value are analysed between those based on quoted prices in active markets for identical assets or liabilities (Level 1), those involving inputs other than quoted prices that are observable for the assets or liabilities, either directly or indirectly (Level 2), and those involving inputs for the assets or liabilities that are not based on observable market data (Level 3). The following table sets out the fair value of all financial instruments whose carrying value is measured at fair value:
Level 1 30 June 2021
€m
Level 2 30 June 2021
€m
Level 3 30 June 2021
€m Financial assets Interest rate swaps Foreign exchange swaps Financial liabilities Deferred contingent consideration Put option liabilities Foreign exchange contracts for hedging
- -
- - -
0.1
18.2
- -
(0.2)
- -
(23.7) (136.9)
- At 30 June 2021
-
18.1
(160.6)
Level 1 31 December
2020 €m
Level 2 31 December
2020 €m
Level 3 31 December
2020 €m
Financial assets Interest rate swaps Foreign exchange swaps Financial liabilities Deferred contingent consideration Put option liabilities Foreign exchange contracts for hedging
- -
- - -
0.6
19.2
- -
(0.2)
- -
(10.3) (117.3)
- At 31 December 2020
-
19.6
(127.6)
Level 1 30 June 2020
€m
Level 2 30 June 2020
€m
Level 3 30 June 2020
€m Financial assets Interest rate swaps Foreign exchange swaps Financial liabilities Deferred contingent consideration Put option liabilities
- -
- -
1.0
32.7
- -
- -
(11.2) (145.0)
At 30 June 2020
-
33.7
(156.2)
All derivatives entered into by the Group are included in Level 2 and consist of foreign currency forward contracts, interest rate swaps and cross currency interest rate swaps. Where derivatives are traded either on exchanges or liquid over-the-counter markets, the Group uses the closing price at the reporting date. Normally, the derivatives entered into by the Group are not traded in active markets. The fair values of these contracts are estimated using a valuation technique that maximises the use of observable market inputs, e.g. foreign exchange and interest rates. Deferred contingent consideration is included in Level 3. The fair value estimate of deferred contingent consideration is consistent with 31 December 2020 and is set out in notes 18 and 19 of the 2020 Annual Report. The contingent element is measured on a series of trading performance targets and is adjusted by the application of a range of outcomes and associated probabilities. During the period ended 30 June 2021, there were no significant changes in the business or economic circumstances that affect the fair value of financial assets and liabilities, no reclassifications and no transfers between levels of the fair value hierarchy used in measuring the fair value of the financial instruments.
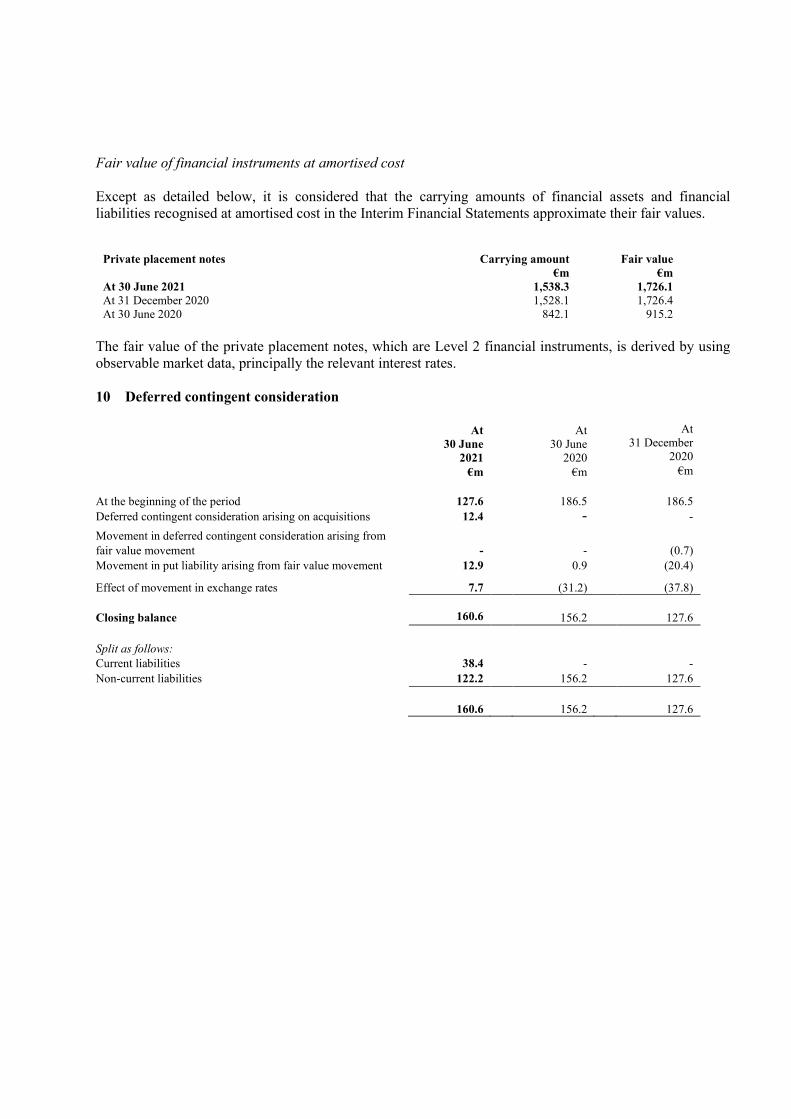
Fair value of financial instruments at amortised cost Except as detailed below, it is considered that the carrying amounts of financial assets and financial liabilities recognised at amortised cost in the Interim Financial Statements approximate their fair values.
Private placement notes
Carrying amount €m
Fair value €m
At 30 June 2021 1,538.3 1,726.1 At 31 December 2020 1,528.1 1,726.4 At 30 June 2020 842.1 915.2
The fair value of the private placement notes, which are Level 2 financial instruments, is derived by using observable market data, principally the relevant interest rates. 10 Deferred contingent consideration At
30 June 2021
€m
At 30 June
2020 €m
At 31 December
2020 €m
At the beginning of the period
127.6
186.5
186.5
Deferred contingent consideration arising on acquisitions 12.4 - - Movement in deferred contingent consideration arising from fair value movement
-
-
(0.7)
Movement in put liability arising from fair value movement 12.9 0.9 (20.4)
Effect of movement in exchange rates 7.7 (31.2) (37.8) Closing balance
160.6
156.2
127.6
Split as follows: Current liabilities 38.4 - - Non-current liabilities 122.2 156.2 127.6
160.6
156.2
127.6
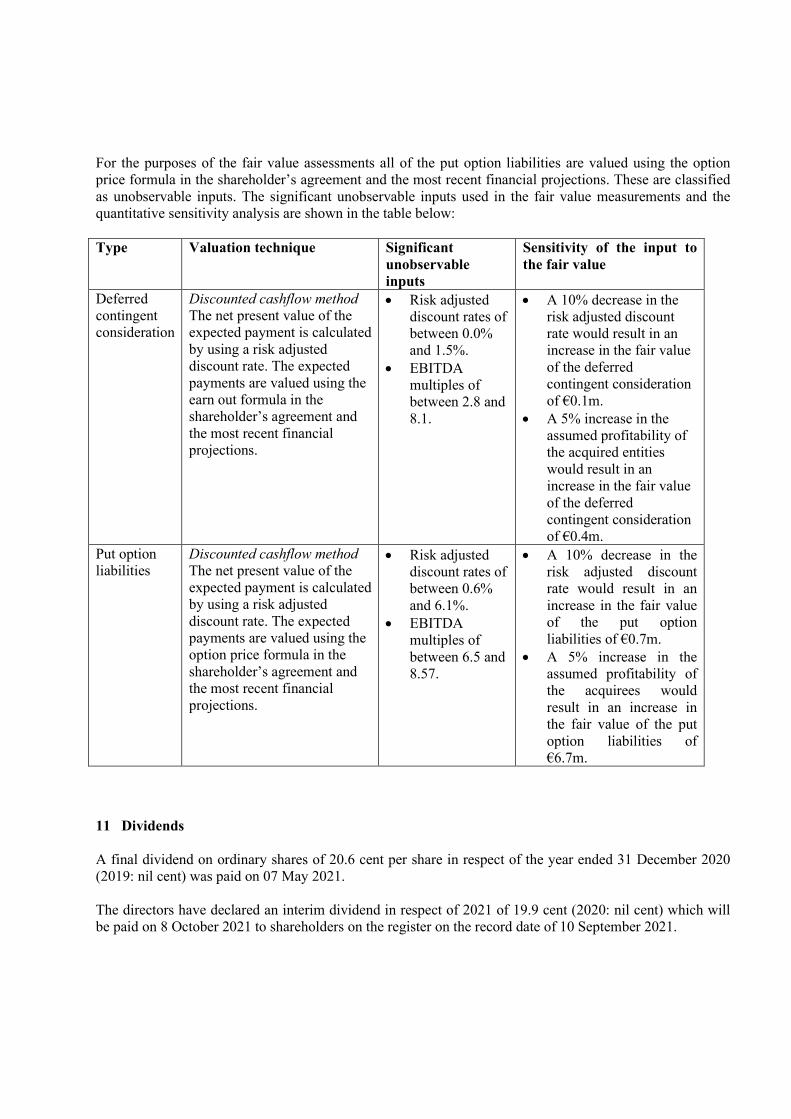
For the purposes of the fair value assessments all of the put option liabilities are valued using the option price formula in the shareholder’s agreement and the most recent financial projections. These are classified as unobservable inputs. The significant unobservable inputs used in the fair value measurements and the quantitative sensitivity analysis are shown in the table below: Type Valuation technique Significant
unobservable inputs
Sensitivity of the input to the fair value
Deferred contingent consideration
Discounted cashflow method The net present value of the expected payment is calculated by using a risk adjusted discount rate. The expected payments are valued using the earn out formula in the shareholder’s agreement and the most recent financial projections.
• Risk adjusted discount rates of between 0.0% and 1.5%.
• EBITDA multiples of between 2.8 and 8.1.
• A 10% decrease in the risk adjusted discount rate would result in an increase in the fair value of the deferred contingent consideration of €0.1m.
• A 5% increase in the assumed profitability of the acquired entities would result in an increase in the fair value of the deferred contingent consideration of €0.4m.
Put option liabilities
Discounted cashflow method The net present value of the expected payment is calculated by using a risk adjusted discount rate. The expected payments are valued using the option price formula in the shareholder’s agreement and the most recent financial projections.
• Risk adjusted discount rates of between 0.6% and 6.1%.
• EBITDA multiples of between 6.5 and 8.57.
• A 10% decrease in the risk adjusted discount rate would result in an increase in the fair value of the put option liabilities of €0.7m.
• A 5% increase in the assumed profitability of the acquirees would result in an increase in the fair value of the put option liabilities of €6.7m.
11 Dividends
A final dividend on ordinary shares of 20.6 cent per share in respect of the year ended 31 December 2020 (2019: nil cent) was paid on 07 May 2021. The directors have declared an interim dividend in respect of 2021 of 19.9 cent (2020: nil cent) which will be paid on 8 October 2021 to shareholders on the register on the record date of 10 September 2021.
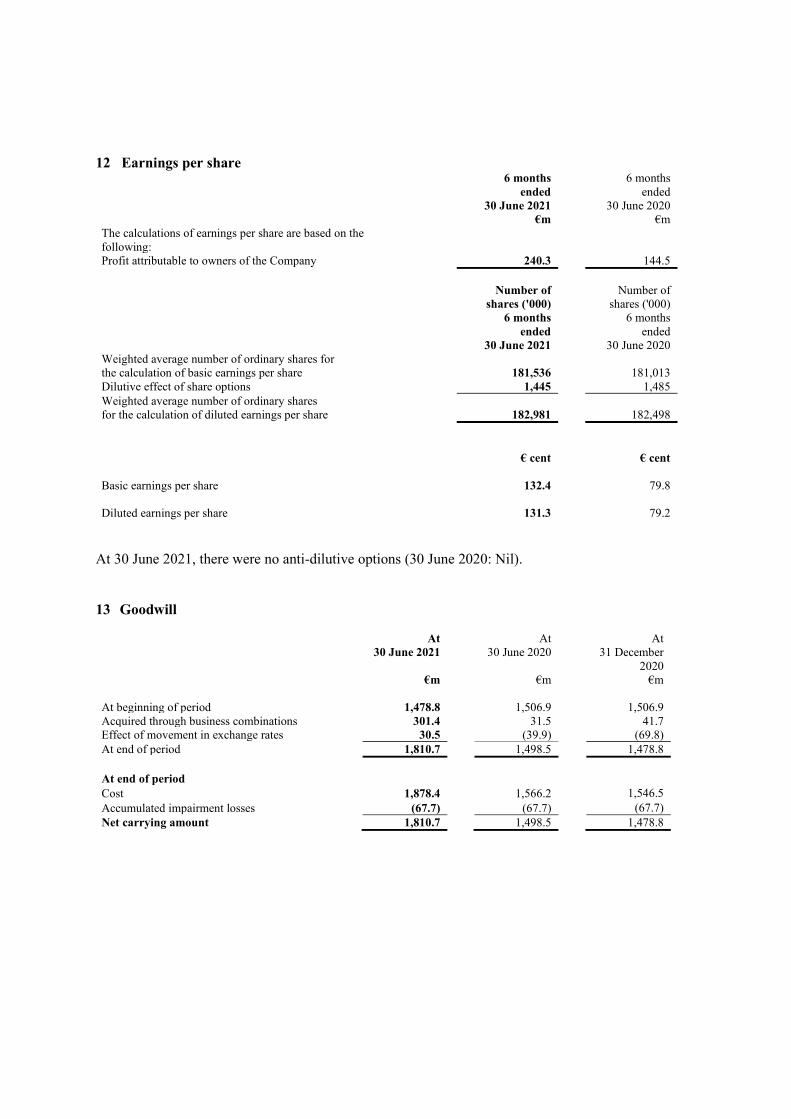
12 Earnings per share
6 months ended
30 June 2021 €m
6 months ended
30 June 2020 €m
The calculations of earnings per share are based on the following:
Profit attributable to owners of the Company 240.3 144.5 Number of
shares ('000) 6 months
ended 30 June 2021
Number of shares ('000)
6 months ended
30 June 2020 Weighted average number of ordinary shares for the calculation of basic earnings per share
181,536
181,013
Dilutive effect of share options 1,445 1,485 Weighted average number of ordinary shares for the calculation of diluted earnings per share
182,981
182,498
€ cent
€ cent
Basic earnings per share
132.4
79.8
Diluted earnings per share
131.3
79.2
At 30 June 2021, there were no anti-dilutive options (30 June 2020: Nil). 13 Goodwill
At 30 June 2021
€m
At
30 June 2020
€m
At
31 December 2020
€m At beginning of period 1,478.8 1,506.9 1,506.9 Acquired through business combinations 301.4 31.5 41.7 Effect of movement in exchange rates 30.5 (39.9) (69.8) At end of period 1,810.7 1,498.5 1,478.8 At end of period Cost 1,878.4 1,566.2 1,546.5 Accumulated impairment losses (67.7) (67.7) (67.7) Net carrying amount 1,810.7 1,498.5 1,478.8
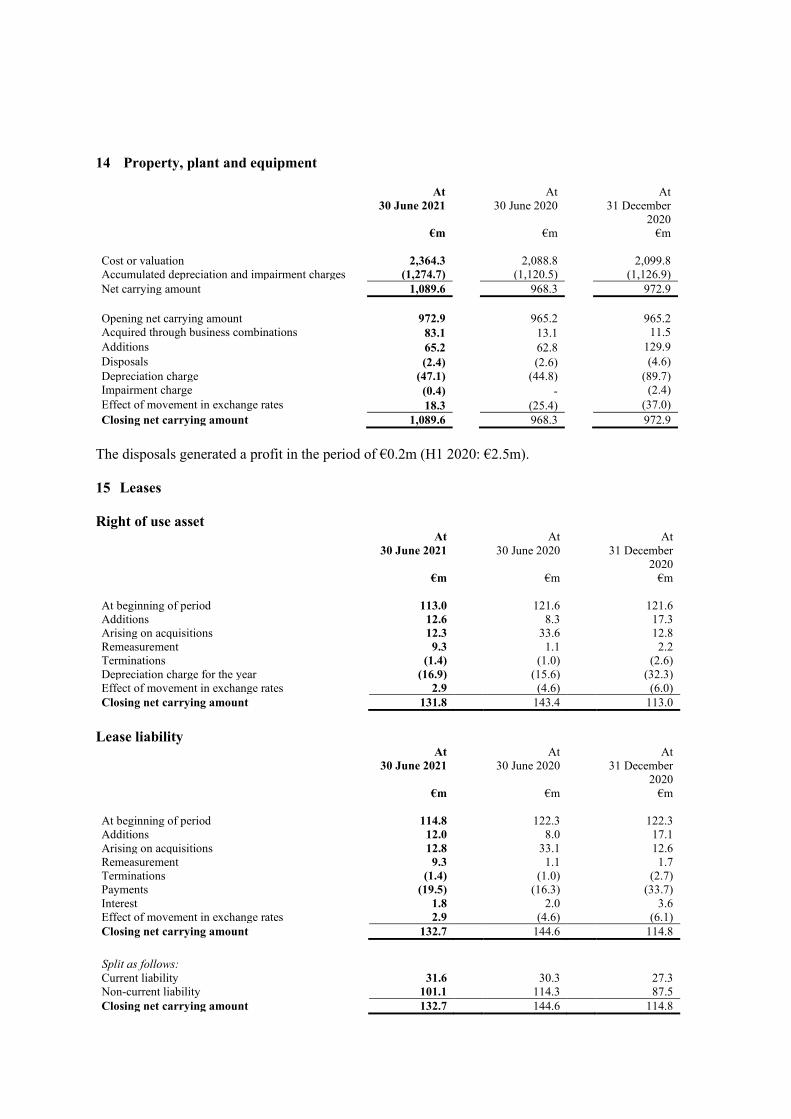
14 Property, plant and equipment
At 30 June 2021
€m
At
30 June 2020
€m
At
31 December 2020
€m Cost or valuation 2,364.3
2,088.8
2,099.8
Accumulated depreciation and impairment charges (1,274.7) (1,120.5) (1,126.9) Net carrying amount 1,089.6 968.3 972.9 Opening net carrying amount 972.9 965.2 965.2 Acquired through business combinations 83.1 13.1 11.5 Additions 65.2 62.8 129.9 Disposals (2.4) (2.6) (4.6) Depreciation charge (47.1) (44.8) (89.7) Impairment charge (0.4) - (2.4) Effect of movement in exchange rates 18.3 (25.4) (37.0) Closing net carrying amount 1,089.6 968.3 972.9
The disposals generated a profit in the period of €0.2m (H1 2020: €2.5m). 15 Leases Right of use asset At
30 June 2021
€m
At 30 June 2020
€m
At 31 December
2020 €m
At beginning of period 113.0 121.6 121.6 Additions 12.6 8.3 17.3 Arising on acquisitions 12.3 33.6 12.8 Remeasurement 9.3 1.1 2.2 Terminations (1.4) (1.0) (2.6) Depreciation charge for the year (16.9) (15.6) (32.3) Effect of movement in exchange rates 2.9 (4.6) (6.0) Closing net carrying amount 131.8 143.4 113.0
Lease liability At
30 June 2021
€m
At 30 June 2020
€m
At 31 December
2020 €m
At beginning of period 114.8 122.3 122.3 Additions 12.0 8.0 17.1 Arising on acquisitions 12.8 33.1 12.6 Remeasurement 9.3 1.1 1.7 Terminations (1.4) (1.0) (2.7) Payments (19.5) (16.3) (33.7) Interest 1.8 2.0 3.6 Effect of movement in exchange rates 2.9 (4.6) (6.1) Closing net carrying amount 132.7 144.6 114.8
Split as follows: Current liability 31.6 30.3 27.3 Non-current liability 101.1 114.3 87.5 Closing net carrying amount 132.7 144.6 114.8
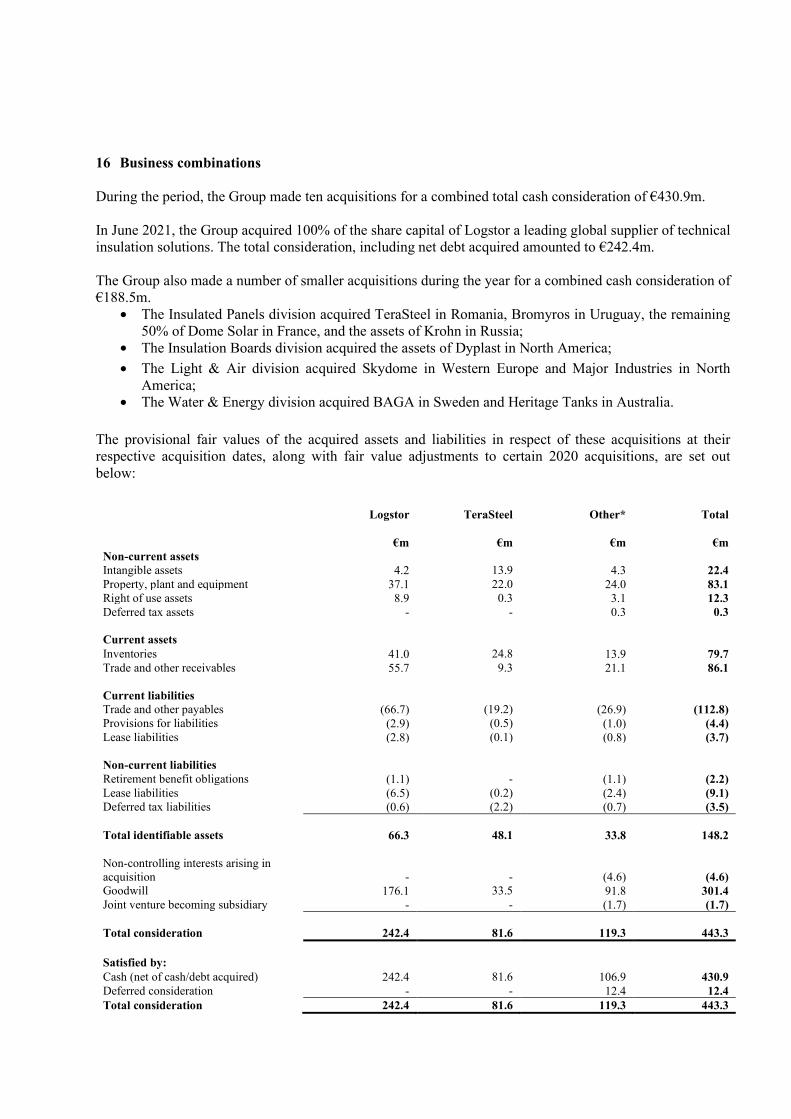
16 Business combinations During the period, the Group made ten acquisitions for a combined total cash consideration of €430.9m. In June 2021, the Group acquired 100% of the share capital of Logstor a leading global supplier of technical insulation solutions. The total consideration, including net debt acquired amounted to €242.4m. The Group also made a number of smaller acquisitions during the year for a combined cash consideration of €188.5m.
• The Insulated Panels division acquired TeraSteel in Romania, Bromyros in Uruguay, the remaining 50% of Dome Solar in France, and the assets of Krohn in Russia;
• The Insulation Boards division acquired the assets of Dyplast in North America; • The Light & Air division acquired Skydome in Western Europe and Major Industries in North
America; • The Water & Energy division acquired BAGA in Sweden and Heritage Tanks in Australia.
The provisional fair values of the acquired assets and liabilities in respect of these acquisitions at their respective acquisition dates, along with fair value adjustments to certain 2020 acquisitions, are set out below:
Logstor TeraSteel Other* Total
€m €m €m €m Non-current assets Intangible assets 4.2 13.9 4.3 22.4 Property, plant and equipment 37.1 22.0 24.0 83.1 Right of use assets 8.9 0.3 3.1 12.3 Deferred tax assets - - 0.3 0.3 Current assets
Inventories 41.0 24.8 13.9 79.7 Trade and other receivables 55.7 9.3 21.1 86.1 Current liabilities
Trade and other payables (66.7) (19.2) (26.9) (112.8) Provisions for liabilities (2.9) (0.5) (1.0) (4.4) Lease liabilities (2.8) (0.1) (0.8) (3.7) Non-current liabilities Retirement benefit obligations (1.1) - (1.1) (2.2) Lease liabilities (6.5) (0.2) (2.4) (9.1) Deferred tax liabilities (0.6) (2.2) (0.7) (3.5) Total identifiable assets 66.3 48.1 33.8 148.2 Non-controlling interests arising in acquisition -
- (4.6) (4.6)
Goodwill 176.1 33.5 91.8 301.4 Joint venture becoming subsidiary - - (1.7) (1.7) Total consideration 242.4
81.6 119.3 443.3
Satisfied by:
Cash (net of cash/debt acquired) 242.4 81.6 106.9 430.9 Deferred consideration - - 12.4 12.4 Total consideration 242.4 81.6 119.3 443.3
*Other includes the remaining acquisitions completed during the period together with certain immaterial remeasurements of prior year accounting estimates. The goodwill is attributable principally to the profit generating potential of the businesses, together with a strong workforce, new geographies and synergies expected to be achieved from integrating the businesses into Kingspan’s existing structure.
In the post-acquisition period to 30 June 2021, the businesses acquired in the current period contributed total revenue of €113.3m and trading profit of €15.6m to the Group’s results. The valuation of the fair value of the assets and liabilities recently acquired is still in progress due to the relative size of the acquisitions and the timing of the transactions. The initial assignment of fair values to identifiable net assets acquired has therefore been performed on a provisional basis.
17 Capital and reserves
189,444 ordinary shares (H1 2020: 368,873) were issued as a result of the exercise of vested options arising from the Group’s share option schemes (see the 2020 Annual Report for full details of the Group’s share option schemes). Options were exercised at an average price of €0.13 per option. During the period the Group bought back 600,000 shares at a weighted average price of €78.16 on dates between 19 May 2021 and 10 June 2021.
18 Significant events and transactions
Other than the acquisitions referenced in note 16, there were no individually significant events or transactions in the period which contributed to material changes in the Statement of Financial Position.
19 Related party transactions
There were no changes in related party transactions from the 2020 Annual Report that could have a material effect on the financial position or performance of the Group in the first half of the year. Eugene Murtagh retired as Chairman and non-executive director on 30 April 2021 and is no longer considered a related party. 20 Subsequent events There have been no further material events subsequent to 30 June 2021 which would require disclosure in this report.
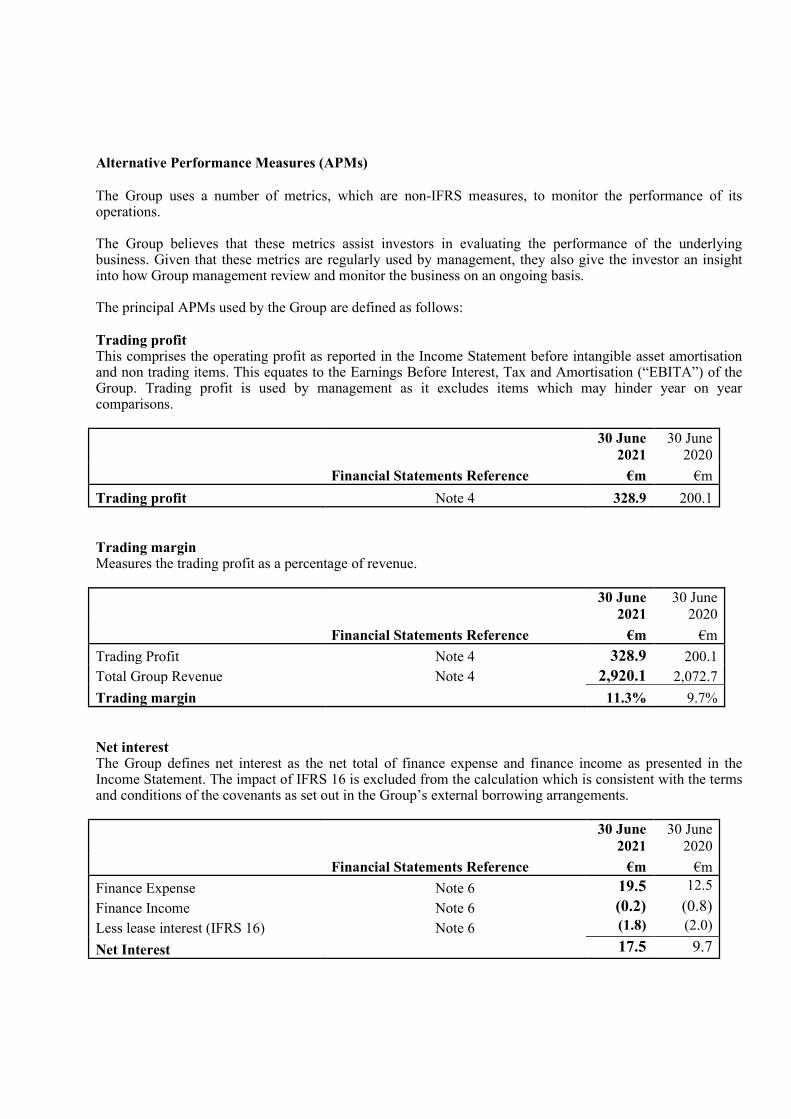
Alternative Performance Measures (APMs) The Group uses a number of metrics, which are non-IFRS measures, to monitor the performance of its operations. The Group believes that these metrics assist investors in evaluating the performance of the underlying business. Given that these metrics are regularly used by management, they also give the investor an insight into how Group management review and monitor the business on an ongoing basis. The principal APMs used by the Group are defined as follows: Trading profit This comprises the operating profit as reported in the Income Statement before intangible asset amortisation and non trading items. This equates to the Earnings Before Interest, Tax and Amortisation (“EBITA”) of the Group. Trading profit is used by management as it excludes items which may hinder year on year comparisons.
30 June
2021 30 June
2020 Financial Statements Reference €m €m Trading profit Note 4 328.9 200.1 Trading margin Measures the trading profit as a percentage of revenue.
30 June
2021 30 June
2020 Financial Statements Reference €m €m Trading Profit Note 4 328.9 200.1 Total Group Revenue Note 4 2,920.1 2,072.7 Trading margin 11.3% 9.7% Net interest The Group defines net interest as the net total of finance expense and finance income as presented in the Income Statement. The impact of IFRS 16 is excluded from the calculation which is consistent with the terms and conditions of the covenants as set out in the Group’s external borrowing arrangements.
30 June
2021 30 June
2020 Financial Statements Reference €m €m Finance Expense Note 6 19.5 12.5 Finance Income Note 6 (0.2) (0.8) Less lease interest (IFRS 16) Note 6 (1.8) (2.0)
Net Interest 17.5 9.7
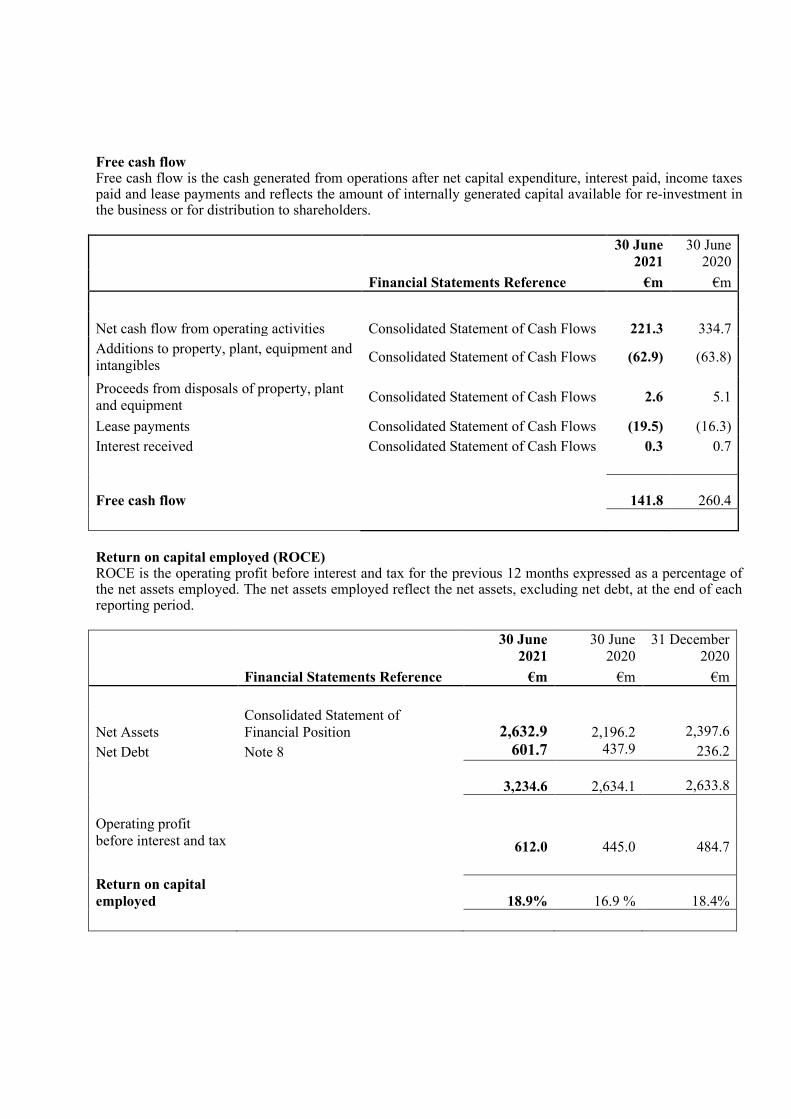
Free cash flow Free cash flow is the cash generated from operations after net capital expenditure, interest paid, income taxes paid and lease payments and reflects the amount of internally generated capital available for re-investment in the business or for distribution to shareholders.
30 June
2021 30 June
2020 Financial Statements Reference €m €m
Net cash flow from operating activities Consolidated Statement of Cash Flows 221.3 334.7 Additions to property, plant, equipment and intangibles Consolidated Statement of Cash Flows (62.9) (63.8)
Proceeds from disposals of property, plant and equipment Consolidated Statement of Cash Flows 2.6 5.1
Lease payments Consolidated Statement of Cash Flows (19.5) (16.3) Interest received Consolidated Statement of Cash Flows 0.3 0.7
Free cash flow
141.8
260.4 Return on capital employed (ROCE) ROCE is the operating profit before interest and tax for the previous 12 months expressed as a percentage of the net assets employed. The net assets employed reflect the net assets, excluding net debt, at the end of each reporting period.
30 June
2021 30 June
2020 31 December
2020 Financial Statements Reference €m €m €m
Net Assets Consolidated Statement of Financial Position 2,632.9 2,196.2 2,397.6
Net Debt Note 8 601.7 437.9 236.2
3,234.6 2,634.1 2,633.8 Operating profit before interest and tax 612.0 445.0 484.7 Return on capital employed 18.9% 16.9 % 18.4%
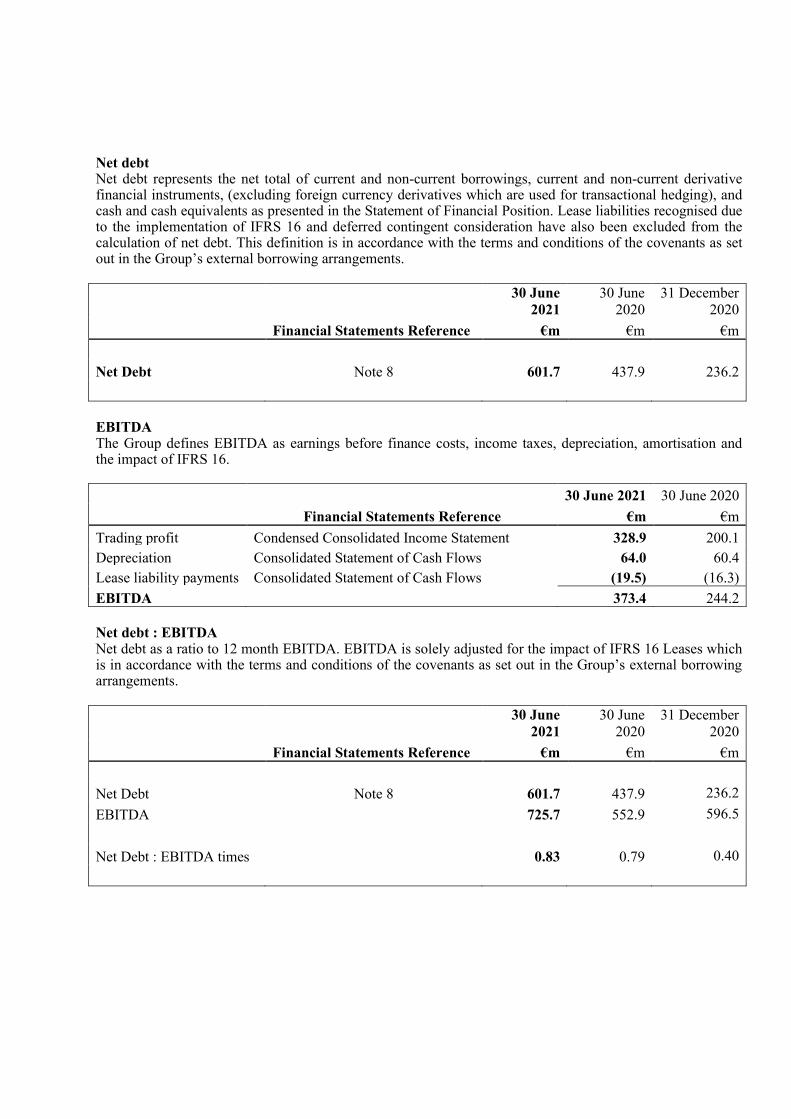
Net debt Net debt represents the net total of current and non-current borrowings, current and non-current derivative financial instruments, (excluding foreign currency derivatives which are used for transactional hedging), and cash and cash equivalents as presented in the Statement of Financial Position. Lease liabilities recognised due to the implementation of IFRS 16 and deferred contingent consideration have also been excluded from the calculation of net debt. This definition is in accordance with the terms and conditions of the covenants as set out in the Group’s external borrowing arrangements.
30 June
2021 30 June
2020 31 December
2020 Financial Statements Reference €m €m €m Net Debt Note 8 601.7 437.9 236.2 EBITDA The Group defines EBITDA as earnings before finance costs, income taxes, depreciation, amortisation and the impact of IFRS 16. 30 June 2021 30 June 2020 Financial Statements Reference €m €m Trading profit Condensed Consolidated Income Statement 328.9 200.1 Depreciation Consolidated Statement of Cash Flows 64.0 60.4 Lease liability payments Consolidated Statement of Cash Flows (19.5) (16.3) EBITDA 373.4 244.2 Net debt : EBITDA Net debt as a ratio to 12 month EBITDA. EBITDA is solely adjusted for the impact of IFRS 16 Leases which is in accordance with the terms and conditions of the covenants as set out in the Group’s external borrowing arrangements.
30 June
2021 30 June
2020 31 December
2020 Financial Statements Reference €m €m €m Net Debt Note 8 601.7 437.9 236.2 EBITDA 725.7 552.9 596.5 Net Debt : EBITDA times 0.83 0.79 0.40
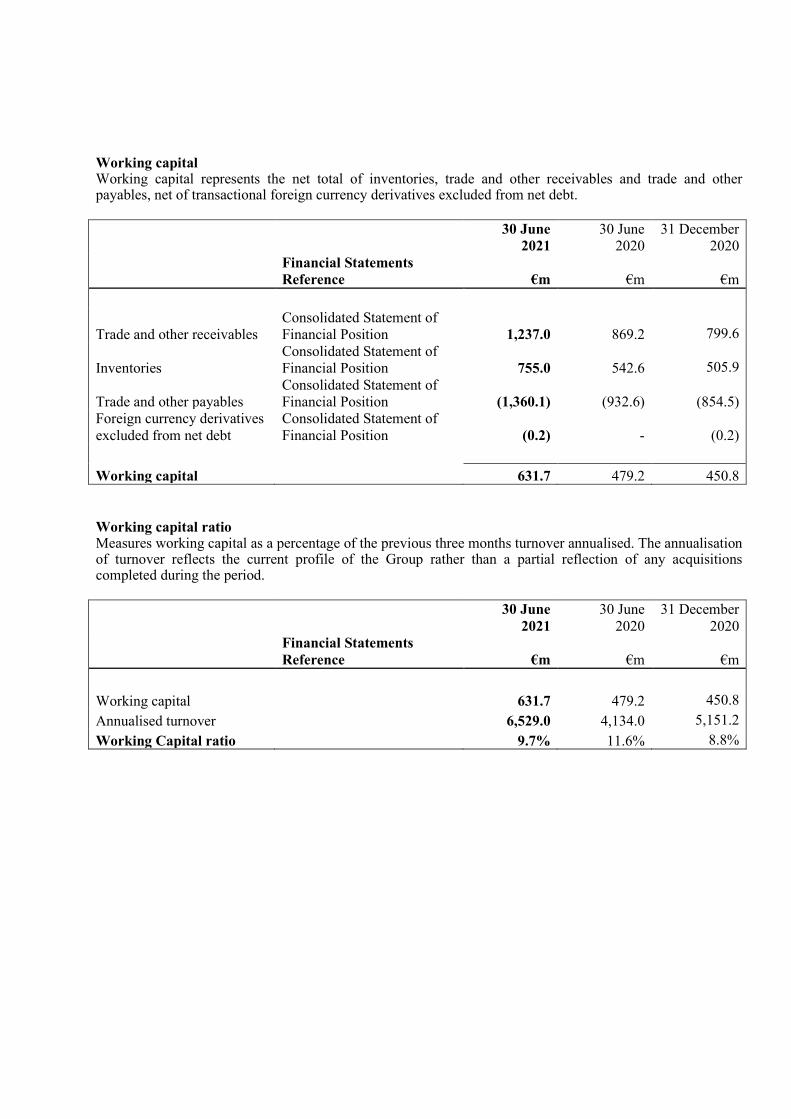
Working capital Working capital represents the net total of inventories, trade and other receivables and trade and other payables, net of transactional foreign currency derivatives excluded from net debt.
30 June
2021 30 June
2020 31 December
2020
Financial Statements Reference €m €m
€m
Trade and other receivables Consolidated Statement of Financial Position 1,237.0 869.2 799.6
Inventories Consolidated Statement of Financial Position 755.0 542.6 505.9
Trade and other payables Consolidated Statement of Financial Position (1,360.1) (932.6) (854.5)
Foreign currency derivatives excluded from net debt
Consolidated Statement of Financial Position (0.2) - (0.2)
Working capital 631.7 479.2 450.8 Working capital ratio Measures working capital as a percentage of the previous three months turnover annualised. The annualisation of turnover reflects the current profile of the Group rather than a partial reflection of any acquisitions completed during the period.
30 June
2021 30 June
2020 31 December
2020
Financial Statements Reference €m €m
€m
Working capital 631.7 479.2 450.8 Annualised turnover 6,529.0 4,134.0 5,151.2 Working Capital ratio 9.7% 11.6% 8.8%