firstgroup plc/media/files/f/firstgroup-plc/agm/2018/... · 2017: 12.4p net debt3 £1,070.3m...
TRANSCRIPT
FirstGroup plcAnnual Report and Accounts 2018
FirstGroup
plc A
nnual Rep
ort and A
ccounts 2018
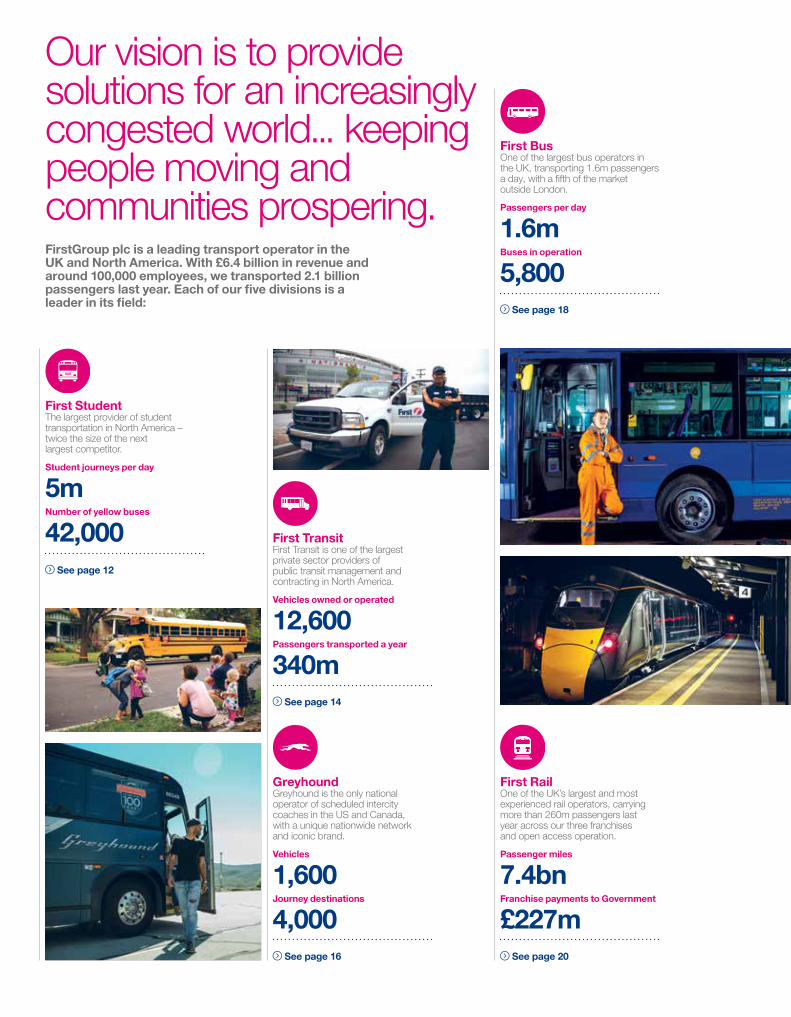
Our vision is to provide solutions for an increasingly congested world... keeping people moving and communities prospering.FirstGroup plc is a leading transport operator in the UK and North America. With £6.4 billion in revenue and around 100,000 employees, we transported 2.1 billion passengers last year. Each of our five divisions is a leader in its field:
First StudentThe largest provider of student transportation in North America – twice the size of the next largest competitor.
Student journeys per day
5mNumber of yellow buses
42,000 See page 12
First TransitFirst Transit is one of the largest private sector providers of public transit management and contracting in North America.
Vehicles owned or operated
12,600Passengers transported a year
340m See page 14
First BusOne of the largest bus operators in the UK, transporting 1.6m passengers a day, with a fifth of the market outside London.
Passengers per day
1.6mBuses in operation
5,800 See page 18
First RailOne of the UK’s largest and most experienced rail operators, carrying more than 260m passengers last year across our three franchises and open access operation.
Passenger miles
7.4bnFranchise payments to Government
£227m See page 20
GreyhoundGreyhound is the only national operator of scheduled intercity coaches in the US and Canada, with a unique nationwide network and iconic brand.
Vehicles
1,600Journey destinations
4,000 See page 16
Strategic reportChairman’s statement 04
Chief Executive’s report 06
Our markets 08
Our strategy and business model 10
Business review 12
Corporate responsibility 23
Key performance indicators 30
Principal risks and uncertainties 34
Financial review 40
GovernanceBoard of Directors 46
About the Board 48
Governance framework 49
Corporate governance report 50
Directors’ remuneration report 68
Directors’ report and additional disclosures 95
Directors’ responsibility statement 98
Financial statementsConsolidated income statement 100
Consolidated statement of comprehensive income 101
Consolidated balance sheet 102
Consolidated statement of changes in equity 103
Consolidated cash flow statement 104
Notes to the consolidated financial statements 105
Independent auditor’s report 157
Group financial summary 167
Company balance sheet 168
Statement of changes in equity 169
Notes to the Company financial statements 170
Shareholder information 174
Financial calendar 175
Glossary 176
Contents
Puerto Rico
Alaska
Puerto Rico
Alaska
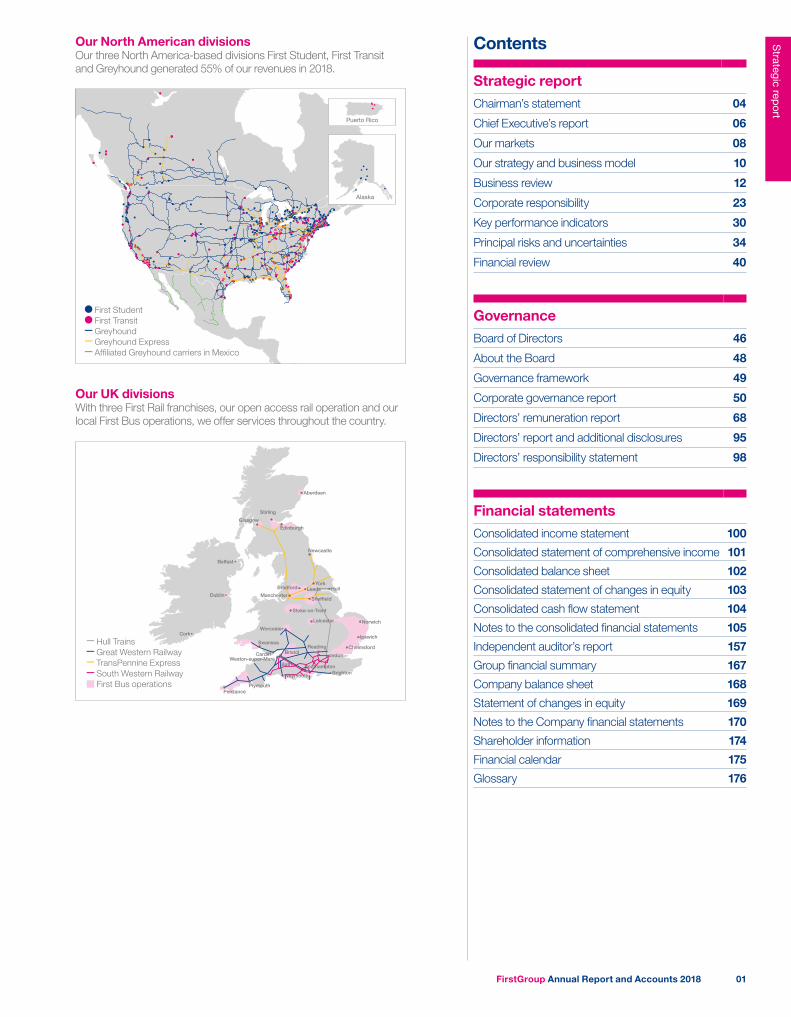
First Student First Transit Greyhound Greyhound Express Affiliated Greyhound carriers in Mexico
Our North American divisionsOur three North America-based divisions First Student, First Transit and Greyhound generated 55% of our revenues in 2018.
Our UK divisionsWith three First Rail franchises, our open access rail operation and our local First Bus operations, we offer services throughout the country.
Aberdeen
Edinburgh
Newcastle
Stirling
YorkLeeds
Sheffield
Leicester
Ipswich
ReadingLondon
Brighton
Glasgow
Cork
Belfast
Bristol
ManchesterBradford
Stoke-on-Trent
Worcester
Penzance
Dublin
Weymouth
Cardiff
Hull
Weston-super-Mare
Swansea
Plymouth
Bath Southampton
Norwich
Chelmsford Hull Trains Great Western Railway TransPennine Express South Western Railway First Bus operations
FirstGroup Annual Report and Accounts 2018 01
Strategic report
Financial summary of the year
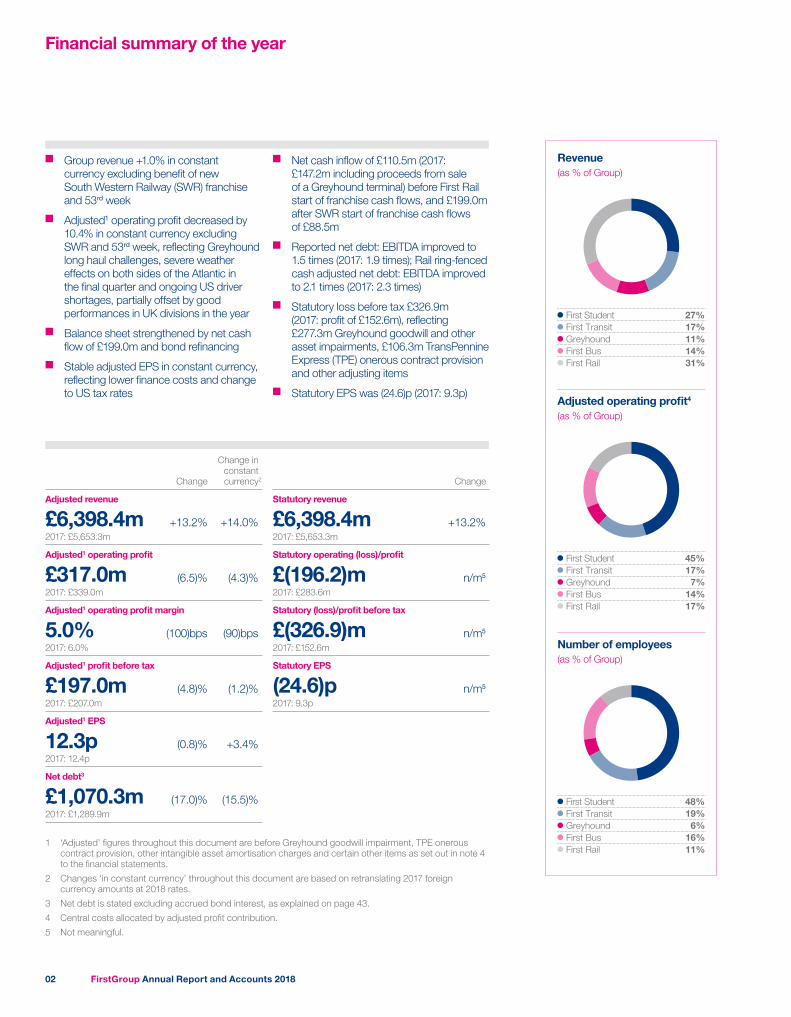
■■ Group revenue +1.0% in constant currency excluding benefit of new South Western Railway (SWR) franchise and 53rd week
■■ Adjusted1 operating profit decreased by 10.4% in constant currency excluding SWR and 53rd week, reflecting Greyhound long haul challenges, severe weather effects on both sides of the Atlantic in the final quarter and ongoing US driver shortages, partially offset by good performances in UK divisions in the year
■■ Balance sheet strengthened by net cash flow of £199.0m and bond refinancing
■■ Stable adjusted EPS in constant currency, reflecting lower finance costs and change to US tax rates
■■ Net cash inflow of £110.5m (2017: £147.2m including proceeds from sale of a Greyhound terminal) before First Rail start of franchise cash flows, and £199.0m after SWR start of franchise cash flows of £88.5m
■■ Reported net debt: EBITDA improved to 1.5 times (2017: 1.9 times); Rail ring-fenced cash adjusted net debt: EBITDA improved to 2.1 times (2017: 2.3 times)
■■ Statutory loss before tax £326.9m (2017: profit of £152.6m), reflecting £277.3m Greyhound goodwill and other asset impairments, £106.3m TransPennine Express (TPE) onerous contract provision and other adjusting items
■■ Statutory EPS was (24.6)p (2017: 9.3p)
Change
Change in constant currency2
Adjusted revenue
£6,398.4m +13.2% +14.0%2017: £5,653.3m
Adjusted1 operating profit
£317.0m (6.5)% (4.3)%2017: £339.0m
Adjusted1 operating profit margin
5.0% (100)bps (90)bps2017: 6.0%
Adjusted1 profit before tax
£197.0m (4.8)% (1.2)%2017: £207.0m
Adjusted1 EPS
12.3p (0.8)% +3.4%2017: 12.4p
Net debt3
£1,070.3m (17.0)% (15.5)%2017: £1,289.9m
Change
Statutory revenue
£6,398.4m +13.2%2017: £5,653.3m
Statutory operating (loss)/profit
£(196.2)m n/m5
2017: £283.6m
Statutory (loss)/profit before tax
£(326.9)m n/m5
2017: £152.6m
Statutory EPS
(24.6)p n/m5
2017: 9.3p
1 ‘Adjusted’ figures throughout this document are before Greyhound goodwill impairment, TPE onerous contract provision, other intangible asset amortisation charges and certain other items as set out in note 4 to the financial statements.
2 Changes ‘in constant currency’ throughout this document are based on retranslating 2017 foreign currency amounts at 2018 rates.
3 Net debt is stated excluding accrued bond interest, as explained on page 43.
4 Central costs allocated by adjusted profit contribution.
5 Not meaningful.
First Student 27%First Transit 17%Greyhound 11%First Bus 14%First Rail 31%
Revenue(as % of Group)
First Student 45%First Transit 17%Greyhound 7%First Bus 14%First Rail 17%
Adjusted operating profit4
(as % of Group)
First Student 48%First Transit 19%Greyhound 6%First Bus 16%First Rail 11%
Number of employees(as % of Group)
FirstGroup Annual Report and Accounts 201802
Strategic report
Strategic reportChairman’s statement 04
Chief Executive’s report 06
Our markets 08
Our strategy and business model 10
Business review 12
Corporate responsibility 23
Key performance indicators 30
Principal risks and uncertainties 34
Financial review 40
In this section, we review our performance in the year and our strategy and prospects going forward. We summarise our business model, the markets in which we operate, and how we performed against our key performance indicators. We also set out the key risks that may affect our business and strategy.
FirstGroup Annual Report and Accounts 2018 03
Strategic report
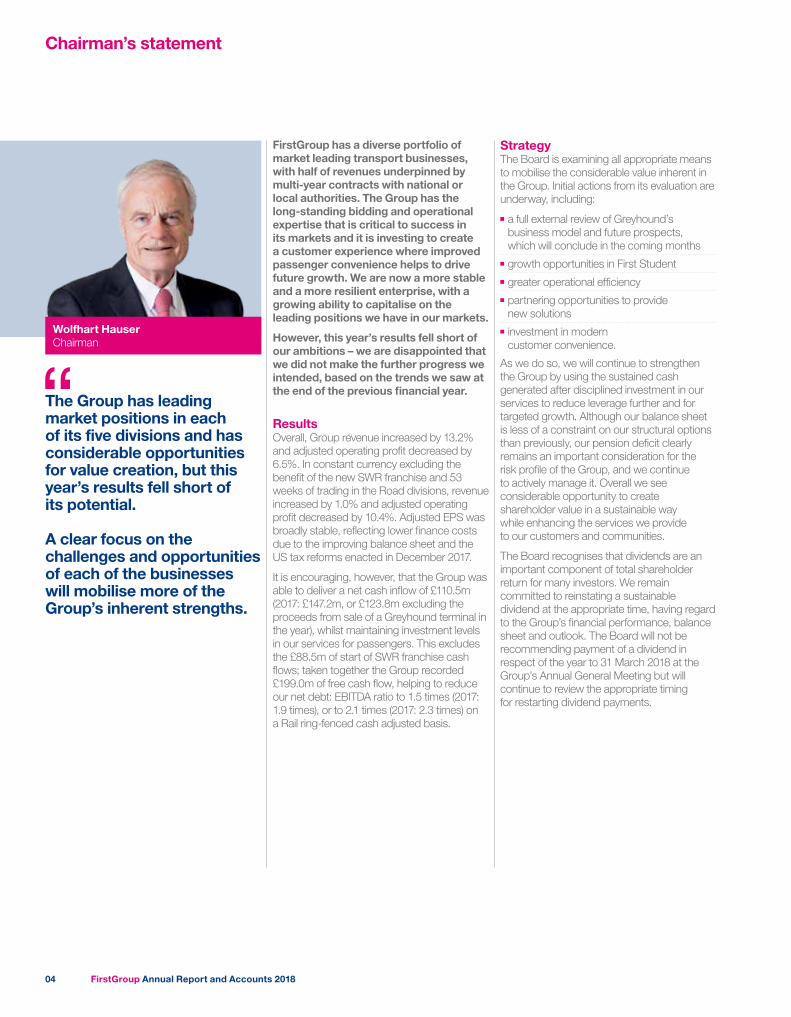
Chairman’s statement
StrategyThe Board is examining all appropriate means to mobilise the considerable value inherent in the Group. Initial actions from its evaluation are underway, including:
■■ a full external review of Greyhound’s business model and future prospects, which will conclude in the coming months
■■ growth opportunities in First Student■■ greater operational efficiency■■ partnering opportunities to provide new solutions
■■ investment in modern customer convenience.
As we do so, we will continue to strengthen the Group by using the sustained cash generated after disciplined investment in our services to reduce leverage further and for targeted growth. Although our balance sheet is less of a constraint on our structural options than previously, our pension deficit clearly remains an important consideration for the risk profile of the Group, and we continue to actively manage it. Overall we see considerable opportunity to create shareholder value in a sustainable way while enhancing the services we provide to our customers and communities.
The Board recognises that dividends are an important component of total shareholder return for many investors. We remain committed to reinstating a sustainable dividend at the appropriate time, having regard to the Group’s financial performance, balance sheet and outlook. The Board will not be recommending payment of a dividend in respect of the year to 31 March 2018 at the Group’s Annual General Meeting but will continue to review the appropriate timing for restarting dividend payments.
Wolfhart HauserChairman
FirstGroup has a diverse portfolio of market leading transport businesses, with half of revenues underpinned by multi-year contracts with national or local authorities. The Group has the long-standing bidding and operational expertise that is critical to success in its markets and it is investing to create a customer experience where improved passenger convenience helps to drive future growth. We are now a more stable and a more resilient enterprise, with a growing ability to capitalise on the leading positions we have in our markets.
However, this year’s results fell short of our ambitions – we are disappointed that we did not make the further progress we intended, based on the trends we saw at the end of the previous financial year.
ResultsOverall, Group revenue increased by 13.2% and adjusted operating profit decreased by 6.5%. In constant currency excluding the benefit of the new SWR franchise and 53 weeks of trading in the Road divisions, revenue increased by 1.0% and adjusted operating profit decreased by 10.4%. Adjusted EPS was broadly stable, reflecting lower finance costs due to the improving balance sheet and the US tax reforms enacted in December 2017.
It is encouraging, however, that the Group was able to deliver a net cash inflow of £110.5m (2017: £147.2m, or £123.8m excluding the proceeds from sale of a Greyhound terminal in the year), whilst maintaining investment levels in our services for passengers. This excludes the £88.5m of start of SWR franchise cash flows; taken together the Group recorded £199.0m of free cash flow, helping to reduce our net debt: EBITDA ratio to 1.5 times (2017: 1.9 times), or to 2.1 times (2017: 2.3 times) on a Rail ring-fenced cash adjusted basis.
The Group has leading market positions in each of its five divisions and has considerable opportunities for value creation, but this year’s results fell short of its potential.
A clear focus on the challenges and opportunities of each of the businesses will mobilise more of the Group’s inherent strengths.
FirstGroup Annual Report and Accounts 201804
The BoardWith effect from the date of this report, the Group announced that Tim O’Toole had stepped down from the Board and his role as Chief Executive. The process to select a new Chief Executive is underway. Until such time as a successor is appointed, the Board has asked me to perform the role of Executive Chairman. Matthew Gregory has been appointed Interim Chief Operating Officer and will also continue his responsibilities as Chief Financial Officer.
On behalf of the Board I would like to thank Tim for his distinguished leadership of the company since 2010. During that time the Group has reinvested in its businesses, restored free cash generation and substantially strengthened its balance sheet.
In February 2018 we welcomed David Robbie to the Board as an independent Non-Executive Director and Chair of the Audit Committee. The Board is already benefiting from his extensive experience.
Corporate governanceSound corporate governance is a vital facet of meeting our responsibilities to all our stakeholders, and in the year the Board has focused on further development of the Board’s understanding and approach to risk appetite, delivery of the transformation plans, mobilisation of SWR, development of the Group’s strategy and business objectives, and reviewing the Board performance in light of the Board evaluation exercise.
Our peopleOur frontline employees are key to the success of the Group. Across the businesses this year our employees have had to contend with extreme challenges such as hurricanes, wildfires and severe winter weather which tested their resilience to the limit. In August we welcomed thousands of SWR employees to the Group while they were in the midst of doing an outstanding job helping passengers through the London Waterloo station upgrade programme, which caused major disruption across the network. I am very proud of the way colleagues throughout the Group have put customers first despite these significant challenges and I am inspired by their extraordinary dedication to serving our customers and communities.
On behalf of the Board I would like to extend my sincere gratitude to our 100,000 employees for their continued commitment and hard work this year.
Overall, despite the issues this year, I am clear that the Group has significant potential to improve services for our customers while creating value for shareholders and other stakeholders, and that it is making progress toward that goal.
The Board’s focus is firmly on taking the actions necessary to accelerate and cement that progress, so as to secure substantially increased shareholder value going forwards.
Wolfhart HauserChairman 31 May 2018
FirstGroup Annual Report and Accounts 2018 05
Strategic report
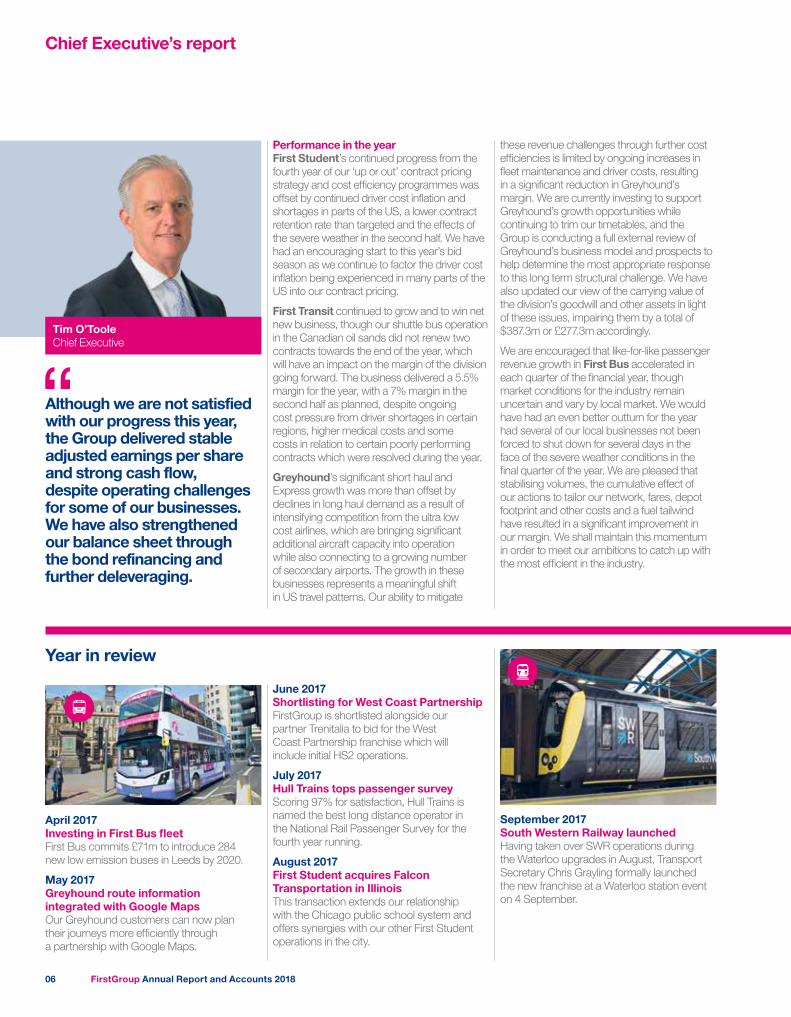
Chief Executive’s report
Performance in the yearFirst Student’s continued progress from the fourth year of our ‘up or out’ contract pricing strategy and cost efficiency programmes was offset by continued driver cost inflation and shortages in parts of the US, a lower contract retention rate than targeted and the effects of the severe weather in the second half. We have had an encouraging start to this year’s bid season as we continue to factor the driver cost inflation being experienced in many parts of the US into our contract pricing.
First Transit continued to grow and to win net new business, though our shuttle bus operation in the Canadian oil sands did not renew two contracts towards the end of the year, which will have an impact on the margin of the division going forward. The business delivered a 5.5% margin for the year, with a 7% margin in the second half as planned, despite ongoing cost pressure from driver shortages in certain regions, higher medical costs and some costs in relation to certain poorly performing contracts which were resolved during the year.
Greyhound’s significant short haul and Express growth was more than offset by declines in long haul demand as a result of intensifying competition from the ultra low cost airlines, which are bringing significant additional aircraft capacity into operation while also connecting to a growing number of secondary airports. The growth in these businesses represents a meaningful shift in US travel patterns. Our ability to mitigate
these revenue challenges through further cost efficiencies is limited by ongoing increases in fleet maintenance and driver costs, resulting in a significant reduction in Greyhound’s margin. We are currently investing to support Greyhound’s growth opportunities while continuing to trim our timetables, and the Group is conducting a full external review of Greyhound’s business model and prospects to help determine the most appropriate response to this long term structural challenge. We have also updated our view of the carrying value of the division’s goodwill and other assets in light of these issues, impairing them by a total of $387.3m or £277.3m accordingly.
We are encouraged that like-for-like passenger revenue growth in First Bus accelerated in each quarter of the financial year, though market conditions for the industry remain uncertain and vary by local market. We would have had an even better outturn for the year had several of our local businesses not been forced to shut down for several days in the face of the severe weather conditions in the final quarter of the year. We are pleased that stabilising volumes, the cumulative effect of our actions to tailor our network, fares, depot footprint and other costs and a fuel tailwind have resulted in a significant improvement in our margin. We shall maintain this momentum in order to meet our ambitions to catch up with the most efficient in the industry.
Tim O’TooleChief Executive
Although we are not satisfied with our progress this year, the Group delivered stable adjusted earnings per share and strong cash flow, despite operating challenges for some of our businesses. We have also strengthened our balance sheet through the bond refinancing and further deleveraging.
Year in review
June 2017Shortlisting for West Coast PartnershipFirstGroup is shortlisted alongside our partner Trenitalia to bid for the West Coast Partnership franchise which will include initial HS2 operations.
July 2017Hull Trains tops passenger surveyScoring 97% for satisfaction, Hull Trains is named the best long distance operator in the National Rail Passenger Survey for the fourth year running.
August 2017First Student acquires Falcon Transportation in IllinoisThis transaction extends our relationship with the Chicago public school system and offers synergies with our other First Student operations in the city.
September 2017South Western Railway launchedHaving taken over SWR operations during the Waterloo upgrades in August, Transport Secretary Chris Grayling formally launched the new franchise at a Waterloo station event on 4 September.
April 2017Investing in First Bus fleetFirst Bus commits £71m to introduce 284 new low emission buses in Leeds by 2020.
May 2017Greyhound route information integrated with Google Maps Our Greyhound customers can now plan their journeys more efficiently through a partnership with Google Maps.
FirstGroup Annual Report and Accounts 201806
Although First Rail’s like-for-like passenger revenue growth accelerated over the course of the year, we must acknowledge the slower rate of overall industry growth that currently prevails. The overall financial result from our Rail division was solid in the year, with contributions from Great Western Railway (GWR) and SWR (which we began operating in August 2017). However TPE’s like-for-like passenger revenue growth, though very substantial at 10.0%, is lower than our projections at the time of the bid, resulting in an operating loss of £6.5m for the year to March 2018. Our plans to increase capacity by more than 80% and create a true intercity railway for the North over the remainder of the franchise are the right ones for our passengers and communities, and we are confident that they will drive a considerable acceleration in TPE’s annual patronage and revenue growth over time. However our assessment is that this growth will be short of our bid assumptions due to current market conditions, and we have therefore taken the decision to provide for forecast losses of up to £106.3m over the remaining life of the TPE contract.
Overall the mixed performance in our divisions resulted in 1.0% Group revenue growth and a reduction in adjusted operating profit of 10.4% in constant currency (before SWR and the 53rd week in the Road divisions), with lower finance and tax charges resulting in an increase in adjusted EPS of 3.4% in constant currency. Principally as a result
of the Greyhound goodwill and other asset impairments and the TPE onerous contract provision, the Group reported a statutory loss before tax of £326.9m (2017: profit of £152.6m) and EPS of (24.6)p (2017: 9.3p).
We are however encouraged that we were able to sustain a strong cash flow performance of £110.5m (2017: £147.2m including proceeds from sale of a Greyhound terminal). This excludes the £88.5m of start of SWR franchise cash flows; taken together we generated £199.0m of free cash flow, helping to reduce our net debt: EBITDA ratio from 1.9 times to 1.5 times in the year, or from 2.3 times to 2.1 times on a Rail ring-fenced cash adjusted basis.
Balance sheet In the year we reached an important milestone with our long-dated bond portfolio beginning to mature, allowing us to significantly reduce our future interest burden by starting to refinance and rebalance the Group’s debt. We are pleased by the support shown in the credit market for our improved resilience and financial profile. We raised $275m in February 2018 at a weighted average cost of 4.25%, and in March we used the proceeds and other monies to redeem the £300m 8.125% coupon bond due September 2018. This action will generate interest savings of an estimated £14m per year from the next financial year.
Investing in our passengers’ needsWe have continued to invest in passenger convenience including initiatives to promote contactless payment, online and mobile ticketing and travel information improvements and other technology to streamline and enhance our operations and responsiveness to customers and other stakeholders. Meanwhile our commitment to the safety of our passengers, our employees and all third parties interacting with our businesses remains unwavering. Our approach to safety is a combination of innovative technology, external assurance and our behavioural change programme, Be Safe, all of which have made further progress in the year towards ensuring we are always operating to the highest standards. With increasing focus on local air quality and emissions we are constantly striving to improve the performance of our vehicles and introduce even cleaner engines.
Group outlookOverall, we expect Group earnings in constant currency to be broadly stable in the year ahead. The Group is expecting an overall improvement in the Road divisions’ margins and returns, underpinned by the momentum in the First Bus turnaround and First Student’s growth plans in the year ahead. We expect First Transit’s continuing growth to be tempered by the loss of high margin Canadian oil sands business, and that sustaining Greyhound’s earnings will be challenging given the changes in the long haul competitive environment. The overall progress of the Road divisions is, however, expected to be offset by a smaller contribution from our First Rail portfolio in the year ahead, reflecting the slower rate of industry growth and the rebasing of our margins under new contract terms. We also expect higher free cash generation from the Road divisions after the disciplined investment required to support our passengers’ needs, offset by a lower contribution from Rail in the year ahead.
Tim O’TooleChief Executive 31 May 2018
October 2017Intercity Express Trains enter serviceGWR’s new Intercity Express Trains carried passengers for the first time, marking the next stage in the biggest fleet upgrade for a generation.
November 2017GWR franchise extended announcedThe Department for Transport (DfT) announced its intention to exercise a 12 month extension option of our GWR franchise to run to the end of March 2020.
January 2018Autonomous vehicle trials First Transit tests autonomous vehicles in winter conditions in Minneapolis, while FirstGroup announces the first trial of such vehicles on UK roads.
February 2018Charity partnership beats targetOur donations to our charity partner Prostate Cancer UK reach £1.5m in value, easily surpassing our original target. A new partnership with Action for Children began in April 2018.
FirstGroup Annual Report and Accounts 2018 07
Strategic report
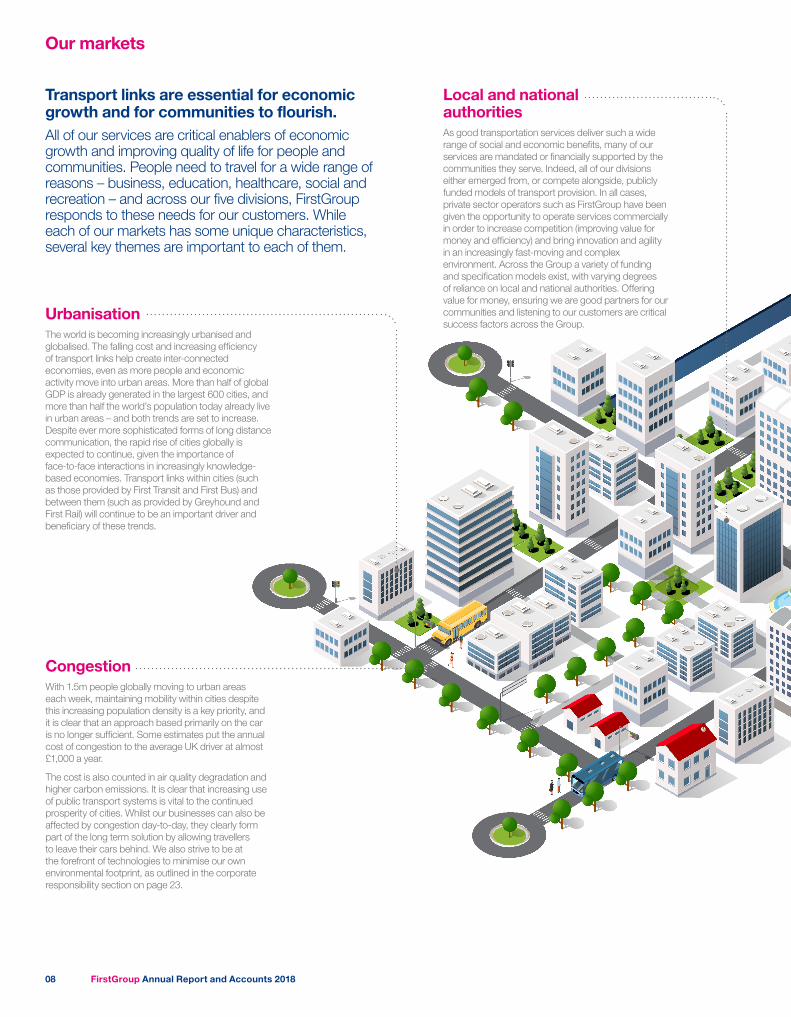
Transport links are essential for economic growth and for communities to flourish.All of our services are critical enablers of economic growth and improving quality of life for people and communities. People need to travel for a wide range of reasons – business, education, healthcare, social and recreation – and across our five divisions, FirstGroup responds to these needs for our customers. While each of our markets has some unique characteristics, several key themes are important to each of them.
Our markets
UrbanisationThe world is becoming increasingly urbanised and globalised. The falling cost and increasing efficiency of transport links help create inter-connected economies, even as more people and economic activity move into urban areas. More than half of global GDP is already generated in the largest 600 cities, and more than half the world’s population today already live in urban areas – and both trends are set to increase. Despite ever more sophisticated forms of long distance communication, the rapid rise of cities globally is expected to continue, given the importance of face-to-face interactions in increasingly knowledge-based economies. Transport links within cities (such as those provided by First Transit and First Bus) and between them (such as provided by Greyhound and First Rail) will continue to be an important driver and beneficiary of these trends.
CongestionWith 1.5m people globally moving to urban areas each week, maintaining mobility within cities despite this increasing population density is a key priority, and it is clear that an approach based primarily on the car is no longer sufficient. Some estimates put the annual cost of congestion to the average UK driver at almost £1,000 a year.
The cost is also counted in air quality degradation and higher carbon emissions. It is clear that increasing use of public transport systems is vital to the continued prosperity of cities. Whilst our businesses can also be affected by congestion day-to-day, they clearly form part of the long term solution by allowing travellers to leave their cars behind. We also strive to be at the forefront of technologies to minimise our own environmental footprint, as outlined in the corporate responsibility section on page 23.
Local and national authoritiesAs good transportation services deliver such a wide range of social and economic benefits, many of our services are mandated or financially supported by the communities they serve. Indeed, all of our divisions either emerged from, or compete alongside, publicly funded models of transport provision. In all cases, private sector operators such as FirstGroup have been given the opportunity to operate services commercially in order to increase competition (improving value for money and efficiency) and bring innovation and agility in an increasingly fast-moving and complex environment. Across the Group a variety of funding and specification models exist, with varying degrees of reliance on local and national authorities. Offering value for money, ensuring we are good partners for our communities and listening to our customers are critical success factors across the Group.
FirstGroup Annual Report and Accounts 201808

Geographic marketsOur core markets in the UK and North America share several demographic, social and political characteristics which make them attractive for transport operators. Both are heavily and increasingly urbanised – just over 80% of the population in the UK and North America live in urban areas today, increasing to nearly 90% by 2050. High and increasing proportions of both populations are either in education or retirement age, demographic bands where use of our services is proportionately higher. Although car ownership is relatively high in both markets, national and local authorities actively seek to encourage greater use of alternatives.
Both markets also have long histories of deregulating and outsourcing transport solutions, with mature business models and regulatory frameworks that encourage partnering with the private sector for transport infrastructure and services. In the longer term, we believe there is significant opportunity globally for the services we provide, and we are actively monitoring a range of markets for opportunities.
For more information on the market environment for each of our divisions please go to the business review section starting on page 12.
Service standardsCustomers’ requirements for safety, comfort and convenience continue to increase. The multiplication of potential transport modes and competition between operators continues to drive up quality and performance standards throughout the industry.
Our customers’ requirements are complex and constantly evolving, and responding to their needs is critical. Interconnectivity between different transport modes is increasingly important, as is the provision of the real-time information necessary to make best use of them. In all of our divisions we are rolling out more convenient services through smarter and more flexible ticketing, improved onboard amenities (such as Wi-Fi) and getting to know our customers’ needs better through customer relationship management techniques.
Meanwhile the growth of ‘transport as a service’ models, such as ridesharing, represents both an opportunity for our businesses as well as a source of potential competition.
Demographic changeTransport solutions also need to take account of demographic changes. Many segments of our communities – such as those in education, retired or unable to drive themselves – have always been more reliant on mass transportation. With a rapidly aging population in many parts of the world, this proportion is set to increase. Increasing numbers of (particularly young) urban dwellers are also choosing not to drive at all, given the costs of buying and maintaining a car and the issues of parking and sustainability. There is a growing demographic which is open to using our services provided we meet its needs, and we are specifically targeting these customers – particularly in Greyhound and First Bus.
FirstGroup Annual Report and Accounts 2018 09
Strategic report

Our strategy and business model
As a market leader in five segments of the passenger transport industry, our unique scale and diversity is our competitive advantage. Our overall strategy is to leverage this scale and the breadth of our global expertise for the benefit of our local markets, in support of our vision to provide solutions for an increasingly congested world… keeping people moving and communities prospering.
Our people
A stable financial platform
Reputation for safe and reliable services
Relationships with key local authority and national government stakeholders
International experience and expertise
Vehicle fleets, depots, stations and terminals
Key inputs Market leading transport solutions
Underpinned by our Values
Committed to our customers We keep our customers at the heart of everything we do.
Dedicated to safety Always front of mind, safety is our way of life.
Supportive of each other We trust each other to deliver and work to help one another succeed.
Accountable for performance Every decision matters, we do the right thing to achieve our goals.
Setting the highest standards We want to be the best, continually seeking a better way to do things.
We provide transport solutions across our five market leading divisions
First Student First Bus
First Transit
First Rail
Greyhound
Our business model
How we manage the businessLeadership and governanceEach of our five divisions is run in a decentralised way so as to be responsive to the needs of our local customers. All, however, are managed in compliance with the Group’s overall vision and values, and with regard to the strategic direction set by the Group central functions. Our lean corporate centre focuses on fostering a high performance culture, sets the strategic direction, raises and allocates capital, develops and manages our talent, establishes key targets and standards, monitors performance and provides challenge. All of our businesses own and manage the risks they face with appropriate assistance from the Group functions as necessary.
For more information on the overall governance of the Group see pages 49-59.
* Metrics which form part of the performance measures used to assess executive compensation.
Key performance indicators (KPIs)The Group focuses on financial and non-financial KPIs which align to our strategic objectives. Financial KPIs are Group revenue*, adjusted operating profit*, adjusted EPS, and ROCE*, which together drive our cash flow and value creation. Non-financial KPIs include contract retention, like-for-like revenue growth, punctuality, safety*, employee engagement, average fleet age, customer and passenger satisfaction*, community investment and greenhouse gas emissions.
See pages 30-33 for more information on our KPIs.
Principal risksWe take a holistic approach to risk management, first building a picture of the principal risks at divisional level, then consolidating those principal risks alongside Group risks into a Group view. All of our businesses are responsible for identifying, assessing and managing the risks they face with appropriate assistance, review and challenge from the Group functions as necessary. In 2018 we will implement a new risk management system across the business as we seek to improve the quality of risk management information generated by our businesses.
See pages 34-39 for more information on our principal risks and uncertainties.
Remuneration policy A key principle underpinning the executive remuneration policy is to ensure it is aligned with the strategy of the Group. In addition, it provides a strong and demonstrable link between incentives and performance delivery in a consistent and responsible way, enables senior management to share in the long term success of the Group without delivering over-generous benefits or encouraging short term measures or excessive risk taking, and is competitive, simple and transparent.
See pages 68-94 for our remuneration report.
FirstGroup Annual Report and Accounts 201810
Delivering our strategic objectives Creating value for...
PassengersSafe, convenient and reliable travel for 2.1bn passengers each year
Communities and governmentStronger economies and more vibrant local communities whilst providing a deliverable response to congestion and air quality concerns
EmployeesRewarding long term professional careers with opportunities to develop and grow
ShareholdersSustainable cash generation and value creation for shareholders
We aim to deliver our vision and execute our strategy in our markets by focusing our experience and energy at key points in the transport service value chain, which we recognise in our five strategic objectives:
1 Focused and disciplined bidding in our contract businessesAlmost half of our revenue is derived from around 1,400 contracts competitively procured on behalf of passengers by government bodies and other parties. Formulating innovative and attractive bids with appropriate levels of risk and managing the delivery of our commitments in a range of constantly changing circumstances is a core strength of the Group.
2 Driving growth through attractive commercial propositions in our passenger revenue businessesOur other main source of revenue is derived from direct ticket sales to passengers, who represent a broad demographic mix and use our services for a variety of business, commuting, social and recreational reasons. Understanding and responding to the changing needs of our local customers is therefore critical to our success. A key part of our strategy is to innovate through technology for our passengers in the areas of ticketing, real time information and to enhance our ability to offer value for money.
3 Continuous improvement in operating and financial performanceOur goal is to operate reliable, convenient and safe transport services on comfortable vehicles staffed by helpful and qualified employees, every day, in all weathers, and despite sharing increasingly congested road and rail infrastructure with other users. To do so we must constantly reinforce the highest standards and seek out best practice from across the Group and beyond. We aim to bring the same focus on discipline and continuous improvement to our financial performance, managing employee productivity, asset and fuel efficiency, procurement, overheads, insurance and other costs to ensure efficient use of our resources and best value for our customers.
4 Prudent investment in our fleets, systems and peopleTo continue to deliver over the longer term it is vital that we use the considerable cash generated from operating activities to reinvest appropriately in our key assets. Our most important assets are our people – we invest substantial sums in recruiting, retaining and developing our employees.
The almost 50,000 vehicles we own across the Group are our most significant capital assets, which we must invest in to offer the reliability and comfort our passengers want. We also invest in our business systems and back office processes to support our other strategic objectives.
5 Maintain responsible partnerships with our customers and communitiesBy its nature, the transport industry involves the risk of injury to passengers, employees and third parties, which is why it is central to our culture to keep safety front of mind. We have reinforced this in recent years with our Be Safe behaviour change programme. We aim to build long term, responsible partnerships with our customers and communities. This includes managing our impact on the environment. Ultimately the sustainability of our business is tightly intertwined with the aspirations, opportunities and success of our customers and communities.
FirstGroup Annual Report and Accounts 2018 11
Strategic report
Business reviewFirst Student
Dennis MaplePresident, First Student
Year to 31 March 2018 2017
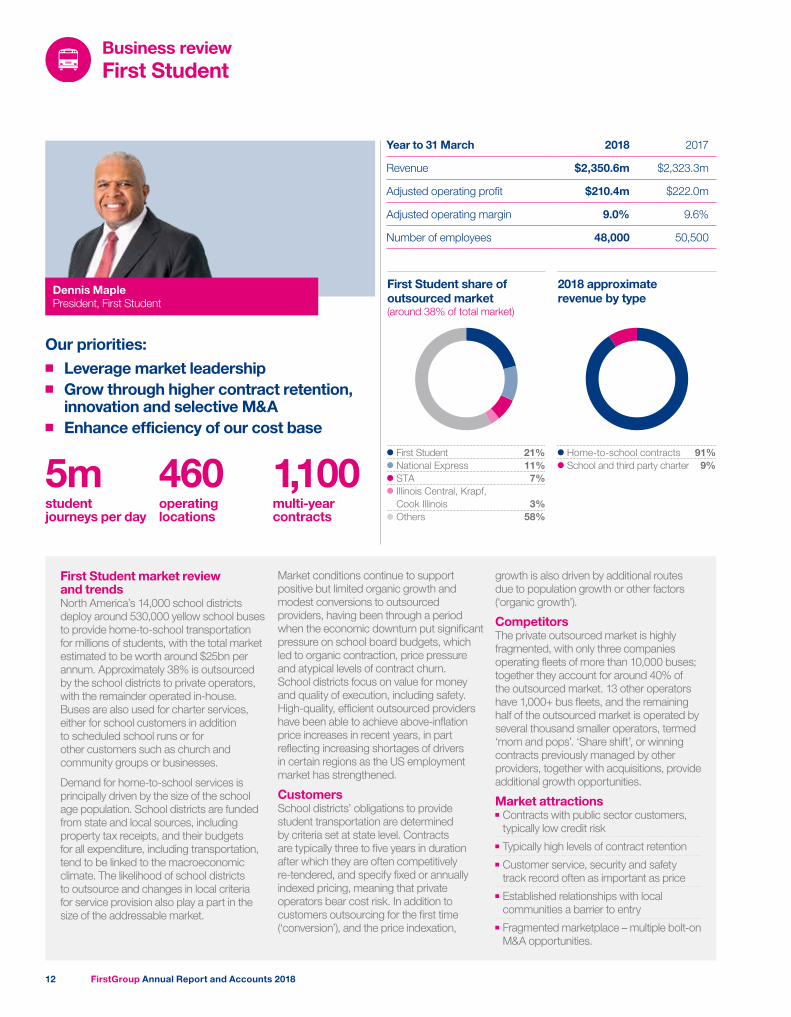
Revenue $2,350.6m $2,323.3m
Adjusted operating profit $210.4m $222.0m
Adjusted operating margin 9.0% 9.6%
Number of employees 48,000 50,500
Our priorities:■■ Leverage market leadership ■■ Grow through higher contract retention,
innovation and selective M&A■■ Enhance efficiency of our cost base
First Student market review and trends North America’s 14,000 school districts deploy around 530,000 yellow school buses to provide home-to-school transportation for millions of students, with the total market estimated to be worth around $25bn per annum. Approximately 38% is outsourced by the school districts to private operators, with the remainder operated in-house. Buses are also used for charter services, either for school customers in addition to scheduled school runs or for other customers such as church and community groups or businesses.
Demand for home-to-school services is principally driven by the size of the school age population. School districts are funded from state and local sources, including property tax receipts, and their budgets for all expenditure, including transportation, tend to be linked to the macroeconomic climate. The likelihood of school districts to outsource and changes in local criteria for service provision also play a part in the size of the addressable market.
Market conditions continue to support positive but limited organic growth and modest conversions to outsourced providers, having been through a period when the economic downturn put significant pressure on school board budgets, which led to organic contraction, price pressure and atypical levels of contract churn. School districts focus on value for money and quality of execution, including safety. High-quality, efficient outsourced providers have been able to achieve above-inflation price increases in recent years, in part reflecting increasing shortages of drivers in certain regions as the US employment market has strengthened.
Customers School districts’ obligations to provide student transportation are determined by criteria set at state level. Contracts are typically three to five years in duration after which they are often competitively re-tendered, and specify fixed or annually indexed pricing, meaning that private operators bear cost risk. In addition to customers outsourcing for the first time (‘conversion’), and the price indexation,
growth is also driven by additional routes due to population growth or other factors (‘organic growth’).
Competitors The private outsourced market is highly fragmented, with only three companies operating fleets of more than 10,000 buses; together they account for around 40% of the outsourced market. 13 other operators have 1,000+ bus fleets, and the remaining half of the outsourced market is operated by several thousand smaller operators, termed ‘mom and pops’. ‘Share shift’, or winning contracts previously managed by other providers, together with acquisitions, provide additional growth opportunities.
Market attractions■■ Contracts with public sector customers, typically low credit risk
■■ Typically high levels of contract retention■■ Customer service, security and safety track record often as important as price
■■ Established relationships with local communities a barrier to entry
■■ Fragmented marketplace – multiple bolt-on M&A opportunities.
First Student 21%National Express 11%STA 7%Illinois Central, Krapf, Cook Illinois 3%Others 58%
First Student share of outsourced market (around 38% of total market)
Home-to-school contracts 91%School and third party charter 9%
2018 approximate revenue by type
5m 460 1,100student journeys per day
operatinglocations
multi-year contracts
FirstGroup Annual Report and Accounts 201812
We maintained our safety track record during the year and are investing to improve our performance further. We also maintained our already high customer service scores and increased our likelihood to recommend scores. We have also begun a partnership with the US School Superintendents’ Association to support the National Superintendent of the Year Program as part of our commitment to support our communities.
Our priorities and outlookIn the year ahead our focus is increasingly on profitable growth. We have had an encouraging start to the bid season with improved retention rates and some major new contracts already secured. In addition to improving contract retention and our ongoing pricing strategy, we intend to strengthen our charter proposition, increase promotion of our nascent managed services offering to school boards who provide home-to-school services in-house, and will more actively consider inorganic sources of growth such as small bolt-on acquisitions. We will continue to improve our cost efficiency through initiatives such as enhanced on-board technology that will enhance daily operations and driver management, the full roll out of an employee smartphone app which is transforming our ability to communicate with our workforce and is specifically aimed at helping boost driver retention, and the ongoing integration of our maintenance organisation and practices with First Transit.
First Student’s revenue was $2,350.6m (2017: $2,323.3m), with increases from the fourth year of our contract pricing strategy, some organic growth and indexation on existing contracts offset by contracts not renewed. The business operated for a similar number of days overall in the year, with the additional operating days in the 53rd week offset by the timing of Easter. In constant currency and excluding the 53rd week, revenue decreased by 1.1%. Reported revenue was £1,771.1m (2017: £1,780.3m).
Adjusted operating profit decreased by 5.3% to $210.4m (2017: $222.0m) in constant currency, an adjusted operating margin of 9.0% (2017: 9.6%). Contract portfolio pricing improvements and cost efficiency savings were offset by ongoing driver shortage costs and other inflation, lower contract retention rates than we had targeted for and the impact of the severe weather experienced in the second half. The net impact from bad weather was made up of a relatively high number of weather make up days in the first half (reflecting the severe winter in 2017), largely offset by an unusually high number of days lost to bad weather in the last quarter, some of which we expect to get back in the 2018/19 financial year as schools add them to the end of their academic calendar. In reported currency, adjusted operating profit decreased 8.5% to £156.5m (2017: £171.1m) and the division reported a statutory profit of £88.4m (2017: £119.0m).
Focused and disciplined bidding During the summer 2017 bid season we continued to focus our bidding strategy on only retaining or bidding for contracts at prices that reflect an appropriate return on the capital we invest. With a substantial proportion of the portfolio already benefiting from this strategy in previous years, the moderating 5.3% average price increase on ‘at risk’ business was largely as expected, as was the higher ‘at risk’ retention rate of 83% compared with the prior year (equivalent to 94% of the entire fleet). Combined with a modest level of organic growth and some conversions from in-house to private provision, we are operating a bus fleet of approximately 42,000 vehicles for the balance of this school year.
Continuous improvement in operating and financial performance First Student delivered further cost efficiencies, including from changes to our engineering practices using the expertise of First Transit’s vehicle maintenance services segment, and from our ongoing focus on best practice sharing and standardised processes within the division. These initiatives have delivered recurring cost savings of approximately
$13m in the year. These initiatives have been delivered despite the ongoing challenge of finding and retaining drivers in some locations due to the strong US employment market. We continue to invest in our recruitment marketing, onboarding and retention programmes to contain the resulting driver cost inflation. Despite driver shortages, our non-school charter bus offering, which benefits our asset utilisation rates, grew revenues by 7.1% on a per bus basis.
Prudent investment in our key assetsWe have sustained our investment in systems and processes that differentiate our offering and enhance our customer service levels and safety performance. Our FirstView smartphone app, which provides real-time bus location tracking for parents and school boards, now covers 140,000 students with 22,000 registered users to date; additional functionality for school districts has recently been added to the system. We have sustained our investment in the fleet and continue to improve our approach to cascading buses around our operations, which is a significant competitive advantage of our scale. Our average fleet age reduced slightly to 7.1 years.
During the year we completed a small acquisition in the Chicago area, which is performing in line with our plans, and we are building up our pipeline of potential bolt-on acquisition targets for the future.
Responsible partnerships with our customers and communitiesWe are entrusted with the safety and security of millions of children every day, and we take that responsibility extremely seriously.
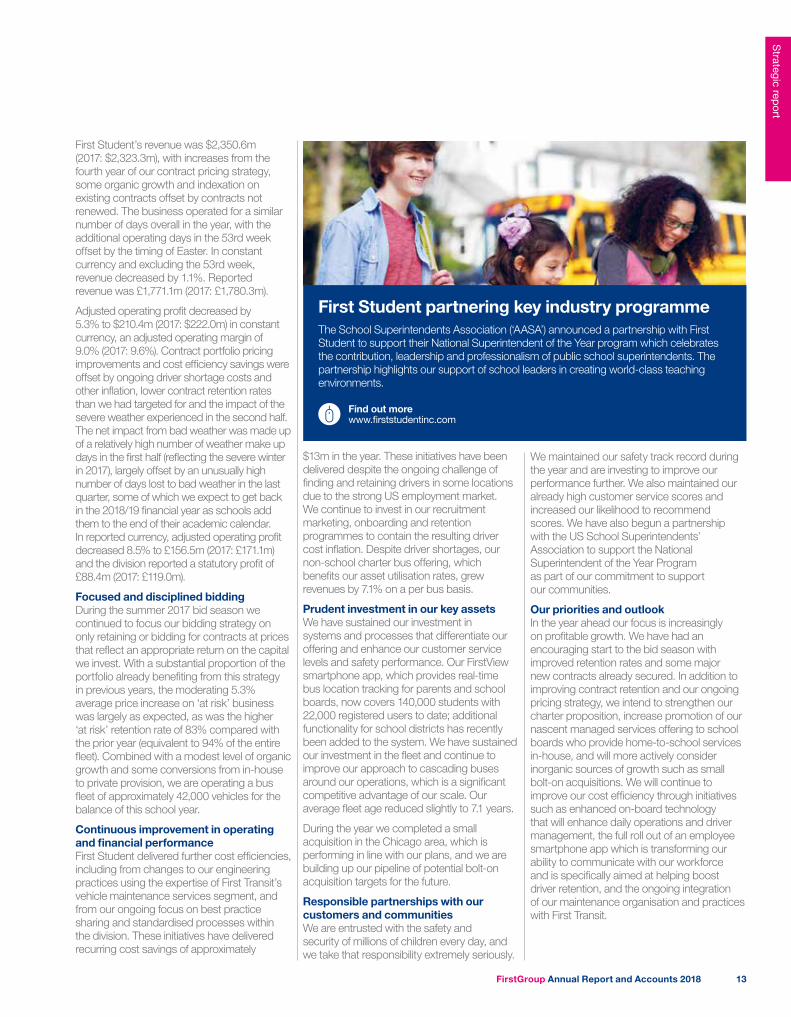
First Student partnering key industry programmeThe School Superintendents Association (‘AASA’) announced a partnership with First Student to support their National Superintendent of the Year program which celebrates the contribution, leadership and professionalism of public school superintendents. The partnership highlights our support of school leaders in creating world-class teaching environments.
Find out more www.firststudentinc.com
FirstGroup Annual Report and Accounts 2018 13
Strategic report
Business reviewFirst Transit
Brad ThomasPresident, First Transit
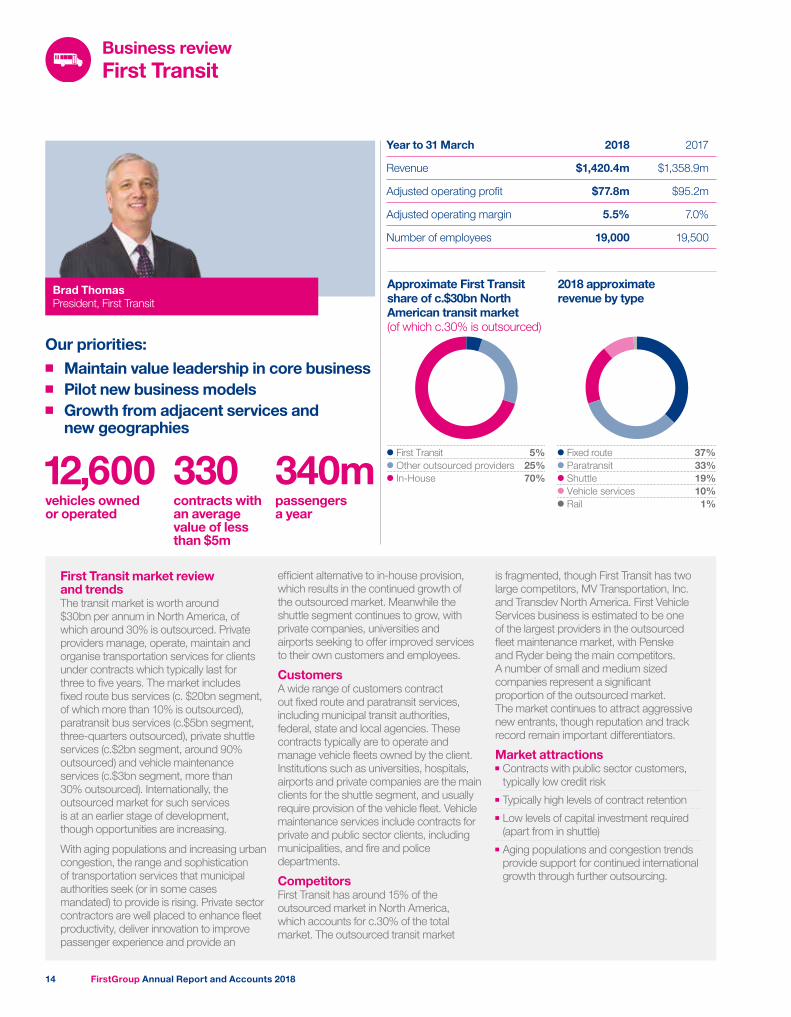
First Transit 5%Other outsourced providers 25%In-House 70%
Approximate First Transit share of c.$30bn North American transit market (of which c.30% is outsourced)
Fixed route 37%Paratransit 33%Shuttle 19%Vehicle services 10%Rail 1%
2018 approximate revenue by type
Year to 31 March 2018 2017
Revenue $1,420.4m $1,358.9m
Adjusted operating profit $77.8m $95.2m
Adjusted operating margin 5.5% 7.0%
Number of employees 19,000 19,500
Our priorities:■■ Maintain value leadership in core business ■■ Pilot new business models ■■ Growth from adjacent services and
new geographies
First Transit market review and trends The transit market is worth around $30bn per annum in North America, of which around 30% is outsourced. Private providers manage, operate, maintain and organise transportation services for clients under contracts which typically last for three to five years. The market includes fixed route bus services (c. $20bn segment, of which more than 10% is outsourced), paratransit bus services (c.$5bn segment, three-quarters outsourced), private shuttle services (c.$2bn segment, around 90% outsourced) and vehicle maintenance services (c.$3bn segment, more than 30% outsourced). Internationally, the outsourced market for such services is at an earlier stage of development, though opportunities are increasing.
With aging populations and increasing urban congestion, the range and sophistication of transportation services that municipal authorities seek (or in some cases mandated) to provide is rising. Private sector contractors are well placed to enhance fleet productivity, deliver innovation to improve passenger experience and provide an
efficient alternative to in-house provision, which results in the continued growth of the outsourced market. Meanwhile the shuttle segment continues to grow, with private companies, universities and airports seeking to offer improved services to their own customers and employees.
Customers A wide range of customers contract out fixed route and paratransit services, including municipal transit authorities, federal, state and local agencies. These contracts typically are to operate and manage vehicle fleets owned by the client. Institutions such as universities, hospitals, airports and private companies are the main clients for the shuttle segment, and usually require provision of the vehicle fleet. Vehicle maintenance services include contracts for private and public sector clients, including municipalities, and fire and police departments.
Competitors First Transit has around 15% of the outsourced market in North America, which accounts for c.30% of the total market. The outsourced transit market
is fragmented, though First Transit has two large competitors, MV Transportation, Inc. and Transdev North America. First Vehicle Services business is estimated to be one of the largest providers in the outsourced fleet maintenance market, with Penske and Ryder being the main competitors. A number of small and medium sized companies represent a significant proportion of the outsourced market. The market continues to attract aggressive new entrants, though reputation and track record remain important differentiators.
Market attractions■■ Contracts with public sector customers, typically low credit risk
■■ Typically high levels of contract retention■■ Low levels of capital investment required (apart from in shuttle)
■■ Aging populations and congestion trends provide support for continued international growth through further outsourcing.
12,600 330 340mvehicles owned or operated
contracts with an average value of less than $5m
passengers a year
FirstGroup Annual Report and Accounts 201814
Prudent investment in our key assetsIn the majority of our contracts we operate or manage services on behalf of our clients rather than providing vehicles. We have maintained our investment in the latest driver management, predictive analytics and routing technology. We are also investing in autonomous vehicle (AV) technology, and now have six AV operational partnerships underway, including our first vehicle on public streets scheduled to start in June 2018. Additionally we have established teaming agreements with several leading AV manufacturers to provide new growth opportunities in this market.
Responsible partnerships with our customers and communities We remain committed to offering the best value package to our customers and the communities we serve, which means our professionalism, technical and operational expertise and safety standards are as important as our cost effectiveness in winning or retaining business. We have completed the roll out of our safety behavioural change programme, which has had a positive impact on our safety performance, and we were pleased to have further increased our already strong customer satisfaction score during the year.
Our priorities and outlookFirst Transit continues to develop our diversified platform of sector expertise and exceptional management strength in North American transit markets through continuous investment in our people and technology. We see opportunities for further growth in our core markets, particularly in shuttle and in vehicle services, increasingly for corporate as well as public clients. We also expect to have opportunities in adjacent markets where we have now established our credentials – such as light rail, commuter rail and bus rapid transit (BRT) – to become increasingly significant for our business. We continue to develop partnerships with ridesharing companies to provide Americans with Disabilities Act-compliant transportation.
We remain confident that our services are a compelling option for both local authorities and private customers to outsource their transportation management needs. We will therefore keep bidding for contracts offering good margins with modest capital investment, while seeking to replenish and grow our portfolio of contracts both within our core markets and by piloting new business models.
First Transit’s revenue was $1,420.4m (2017: $1,358.9m), an increase of 2.4% in constant currency and excluding the 53rd week. As expected, contract awards and organic growth in the rest of the division was partially offset by lower shuttle bus activity in the Canadian oil sands region compared with the prior year. Reported revenue increased to £1,072.7m (2017: £1,042.0m).
Adjusted operating profit was $77.8m (2017: $95.2m), representing an adjusted operating margin of 5.5% (2017: 7.0%). A disappointing first half margin principally reflected higher costs in relation to certain poorly performing contracts; First Transit succeeded in improving its second half margin as forecasted, reflecting the reversal of a provision against receivables made in light of the hurricanes which devastated Puerto Rico in the first half and despite higher medical costs and continued cost pressure from driver shortages in certain regions. In reported currency, adjusted operating profit decreased by 20.6% to £58.2m (2017: £73.3m) and statutory profit was £34.3m (2017: £71.3m).
Focused and disciplined bidding Our shuttle business successfully renewed several university campus and airport contracts in the year; however, two of our contracts in the Canadian oil sands region were not, resulting in a £5.4m restructuring charge in the year; the loss of these high margin contracts will have an impact on the division’s margin going forward.
In addition to the oil sands contracts, we also completed work on the two relatively large poorly performing contracts discussed at the half year stage, where we had bid significantly
higher prices and lost, resulting in our retention rate on ‘at risk’ contracts of 82% during the year. First Transit did however have a good year for new business, with 33 new contracts including major paratransit and fixed route wins from the Vancouver and Los Angeles authorities, respectively. We were pleased to retain or extend a number of significant pieces of business during the year, such as our Greater Richmond paratransit contract where we initially fulfilled a short term emergency contract that we have now extended into a multi-year relationship, and our City of Phoenix fixed route contract which we have operated for over a decade. We are taking a measured approach to applying our expertise to new geographies and services to secure additional sources of growth. In the year, we extended our successful Panama contract by an additional two-and-a-half years, participated in significant North American commuter rail and light rail competitions, and are working to establish a solid footprint in the Indian market.
Continuous improvement in operating and financial performance We continue to develop our technology infrastructure, management expertise and national service platform to help to sustain First Transit’s performance in highly competitive markets. We also upgraded our recruitment, retention and training systems and processes to ensure we maintain the necessary capability in what remains a tight US employment market. In the year we had some success initiating a programme to recruit unemployed Puerto Rican drivers to take on roles on the mainland in response to the driver shortages we are experiencing in some areas.
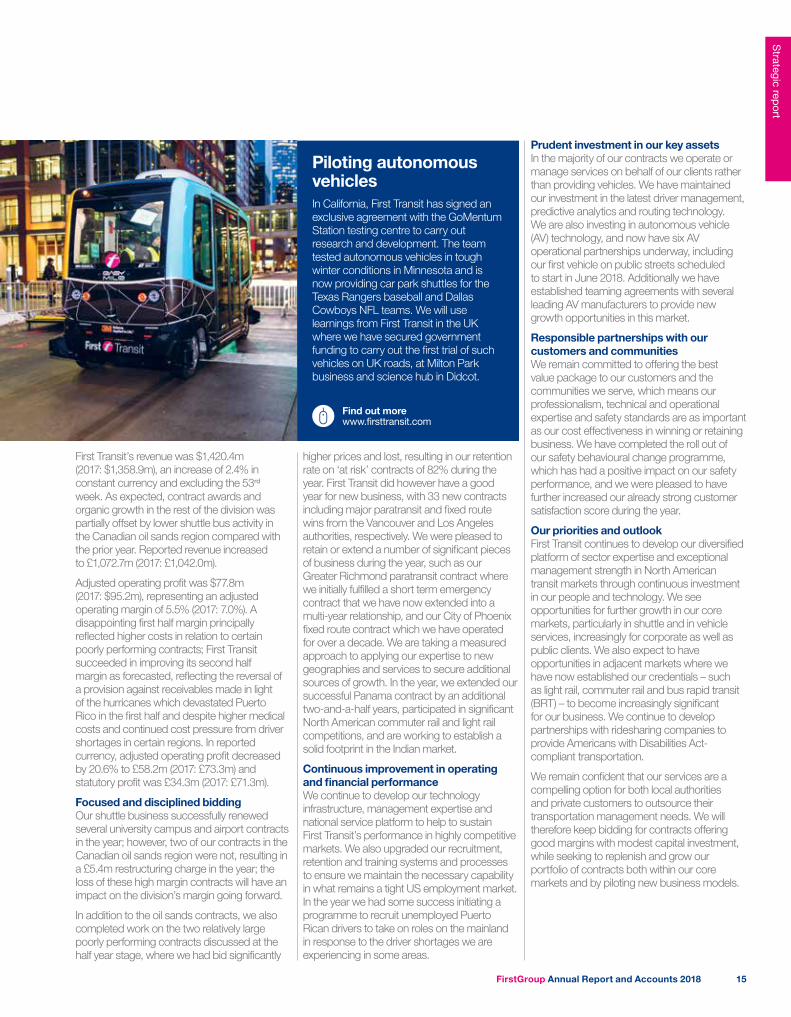
Piloting autonomous vehiclesIn California, First Transit has signed an exclusive agreement with the GoMentum Station testing centre to carry out research and development. The team tested autonomous vehicles in tough winter conditions in Minnesota and is now providing car park shuttles for the Texas Rangers baseball and Dallas Cowboys NFL teams. We will use learnings from First Transit in the UK where we have secured government funding to carry out the first trial of such vehicles on UK roads, at Milton Park business and science hub in Didcot.
Find out more www.firsttransit.com
FirstGroup Annual Report and Accounts 2018 15
Strategic report
Business reviewGreyhound
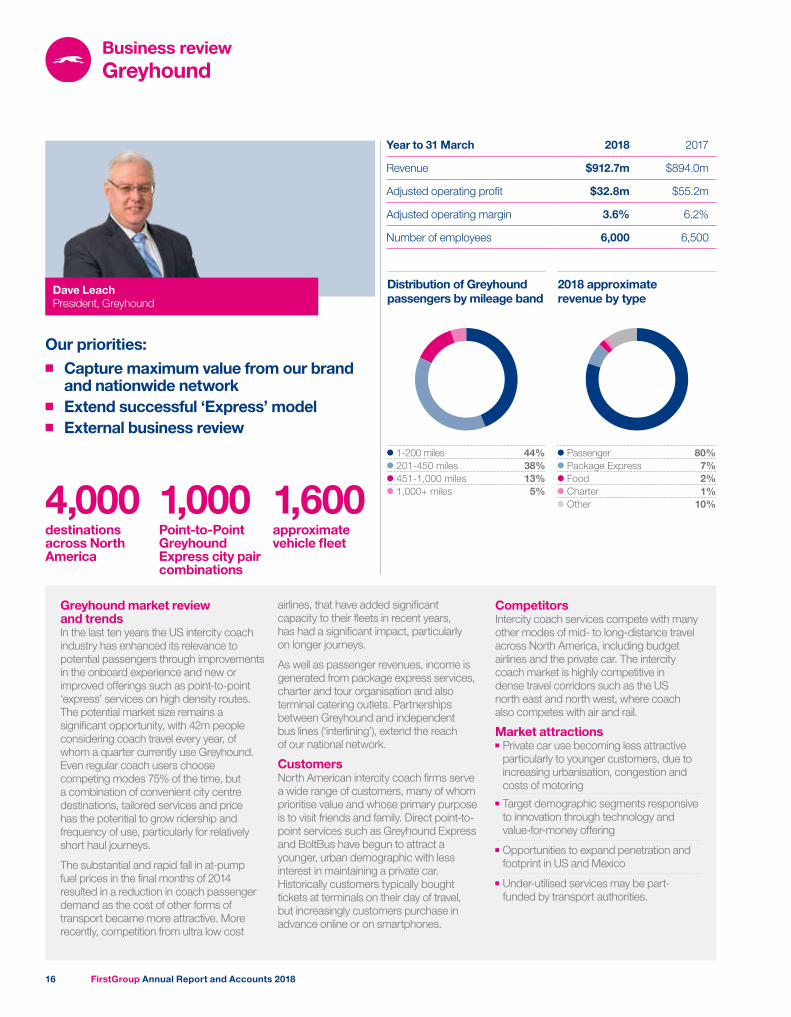
Dave LeachPresident, Greyhound
1-200 miles 44%201-450 miles 38%451-1,000 miles 13%1,000+ miles 5%
Distribution of Greyhound passengers by mileage band
Passenger 80%Package Express 7%Food 2%Charter 1%Other 10%
2018 approximate revenue by type
Year to 31 March 2018 2017
Revenue $912.7m $894.0m
Adjusted operating profit $32.8m $55.2m
Adjusted operating margin 3.6% 6.2%
Number of employees 6,000 6,500
Our priorities:■■ Capture maximum value from our brand
and nationwide network■■ Extend successful ‘Express’ model ■■ External business review
Greyhound market review and trends In the last ten years the US intercity coach industry has enhanced its relevance to potential passengers through improvements in the onboard experience and new or improved offerings such as point-to-point ‘express’ services on high density routes. The potential market size remains a significant opportunity, with 42m people considering coach travel every year, of whom a quarter currently use Greyhound. Even regular coach users choose competing modes 75% of the time, but a combination of convenient city centre destinations, tailored services and price has the potential to grow ridership and frequency of use, particularly for relatively short haul journeys.
The substantial and rapid fall in at-pump fuel prices in the final months of 2014 resulted in a reduction in coach passenger demand as the cost of other forms of transport became more attractive. More recently, competition from ultra low cost
airlines, that have added significant capacity to their fleets in recent years, has had a significant impact, particularly on longer journeys.
As well as passenger revenues, income is generated from package express services, charter and tour organisation and also terminal catering outlets. Partnerships between Greyhound and independent bus lines (‘interlining’), extend the reach of our national network.
Customers North American intercity coach firms serve a wide range of customers, many of whom prioritise value and whose primary purpose is to visit friends and family. Direct point-to-point services such as Greyhound Express and BoltBus have begun to attract a younger, urban demographic with less interest in maintaining a private car. Historically customers typically bought tickets at terminals on their day of travel, but increasingly customers purchase in advance online or on smartphones.
Competitors Intercity coach services compete with many other modes of mid- to long-distance travel across North America, including budget airlines and the private car. The intercity coach market is highly competitive in dense travel corridors such as the US north east and north west, where coach also competes with air and rail.
Market attractions■■ Private car use becoming less attractive particularly to younger customers, due to increasing urbanisation, congestion and costs of motoring
■■ Target demographic segments responsive to innovation through technology and value-for-money offering
■■ Opportunities to expand penetration and footprint in US and Mexico
■■ Under-utilised services may be part-funded by transport authorities.
4,000 1,000 1,600destinations across North America
Point-to-Point Greyhound Express city pair combinations
approximate vehicle fleet
FirstGroup Annual Report and Accounts 201816
Greyhound’s revenue was $912.7m (2017: $894.0m), with like-for-like revenue decreasing by 0.7%. This reflects short haul growth including 7.7% like-for-like growth achieved by Greyhound Express being more than offset by declines in long haul demand, where competition from ultra low cost airlines in particular is intensifying. These competitors are bringing significant additional aircraft capacity into operation while also connecting to a growing number of secondary airports. We have also experienced reductions in traffic in the southern border regions due to tighter immigration and law enforcement. Including the 53rd week and reflecting stronger translation rates into pounds Sterling, reported revenue increased by 0.8% to £690.2m (2017: £684.7m).
Adjusted operating profit was $32.8m (2017: $55.2m), representing an adjusted operating margin of 3.6% (2017: 6.2%), with our ability to mitigate the revenue challenges noted above through further cost efficiencies limited by the ongoing increases in fleet maintenance and driver costs previously highlighted. Greyhound was also affected by this year’s difficult weather conditions in some of the busiest parts of our network. Recognising the difficult trading conditions in the year and the outlook, we have impaired the carrying value of the division’s goodwill and other assets by $387.3m or £277.3m. Adjusted operating profit in reported currency decreased 40.1% to £25.5m (2017: £42.6m) and the division reported a statutory loss of £266.3m (2017: £53.7m profit).
Driving growth through attractive commercial propositionsGreyhound is a unique business thanks to its iconic brand and access to by far the largest intercity coach network in North America. Over recent years we have taken major steps to transform all areas of the customer experience throughout the business. With the trends in different parts of our business diverging, we are adapting our business in response. Our point-to-point Greyhound Express and BoltBus brands, which offer higher density timetables between popular city pair destinations, have successfully grown since their introduction and we aim to convert more of the traditional network to run similar schedules. These have been strong beneficiaries of the transformation in Greyhound’s business systems in recent years; and since February our entire network is now benefiting from real-time pricing and yield management. We are further developing our relationship management systems to offer benefits for customers and deployed modest marketing spend during the year to promote awareness of these changes through targeted online advertising. We are continuing to
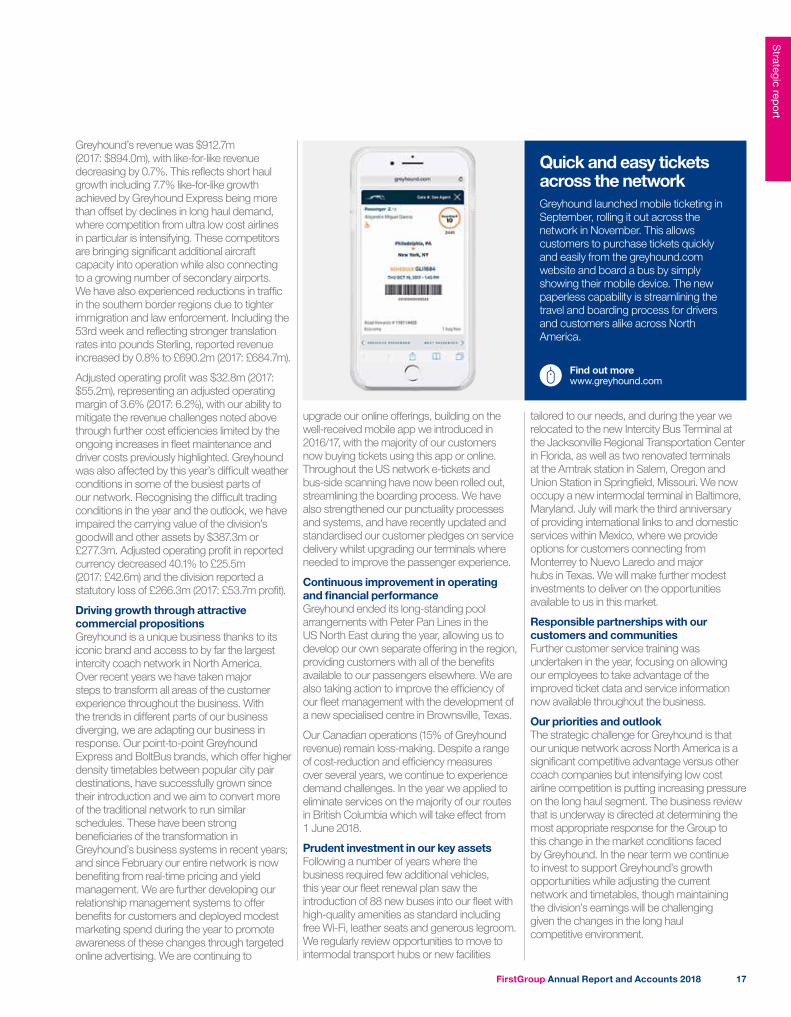
Quick and easy tickets across the networkGreyhound launched mobile ticketing in September, rolling it out across the network in November. This allows customers to purchase tickets quickly and easily from the greyhound.com website and board a bus by simply showing their mobile device. The new paperless capability is streamlining the travel and boarding process for drivers and customers alike across North America.
Find out more www.greyhound.com
upgrade our online offerings, building on the well-received mobile app we introduced in 2016/17, with the majority of our customers now buying tickets using this app or online. Throughout the US network e-tickets and bus-side scanning have now been rolled out, streamlining the boarding process. We have also strengthened our punctuality processes and systems, and have recently updated and standardised our customer pledges on service delivery whilst upgrading our terminals where needed to improve the passenger experience.
Continuous improvement in operating and financial performanceGreyhound ended its long-standing pool arrangements with Peter Pan Lines in the US North East during the year, allowing us to develop our own separate offering in the region, providing customers with all of the benefits available to our passengers elsewhere. We are also taking action to improve the efficiency of our fleet management with the development of a new specialised centre in Brownsville, Texas.
Our Canadian operations (15% of Greyhound revenue) remain loss-making. Despite a range of cost-reduction and efficiency measures over several years, we continue to experience demand challenges. In the year we applied to eliminate services on the majority of our routes in British Columbia which will take effect from 1 June 2018.
Prudent investment in our key assetsFollowing a number of years where the business required few additional vehicles, this year our fleet renewal plan saw the introduction of 88 new buses into our fleet with high-quality amenities as standard including free Wi-Fi, leather seats and generous legroom. We regularly review opportunities to move to intermodal transport hubs or new facilities
tailored to our needs, and during the year we relocated to the new Intercity Bus Terminal at the Jacksonville Regional Transportation Center in Florida, as well as two renovated terminals at the Amtrak station in Salem, Oregon and Union Station in Springfield, Missouri. We now occupy a new intermodal terminal in Baltimore, Maryland. July will mark the third anniversary of providing international links to and domestic services within Mexico, where we provide options for customers connecting from Monterrey to Nuevo Laredo and major hubs in Texas. We will make further modest investments to deliver on the opportunities available to us in this market.
Responsible partnerships with our customers and communitiesFurther customer service training was undertaken in the year, focusing on allowing our employees to take advantage of the improved ticket data and service information now available throughout the business.
Our priorities and outlookThe strategic challenge for Greyhound is that our unique network across North America is a significant competitive advantage versus other coach companies but intensifying low cost airline competition is putting increasing pressure on the long haul segment. The business review that is underway is directed at determining the most appropriate response for the Group to this change in the market conditions faced by Greyhound. In the near term we continue to invest to support Greyhound’s growth opportunities while adjusting the current network and timetables, though maintaining the division’s earnings will be challenging given the changes in the long haul competitive environment.
FirstGroup Annual Report and Accounts 2018 17
Strategic report
Business reviewFirst Bus
Giles FearnleyManaging Director, First Bus
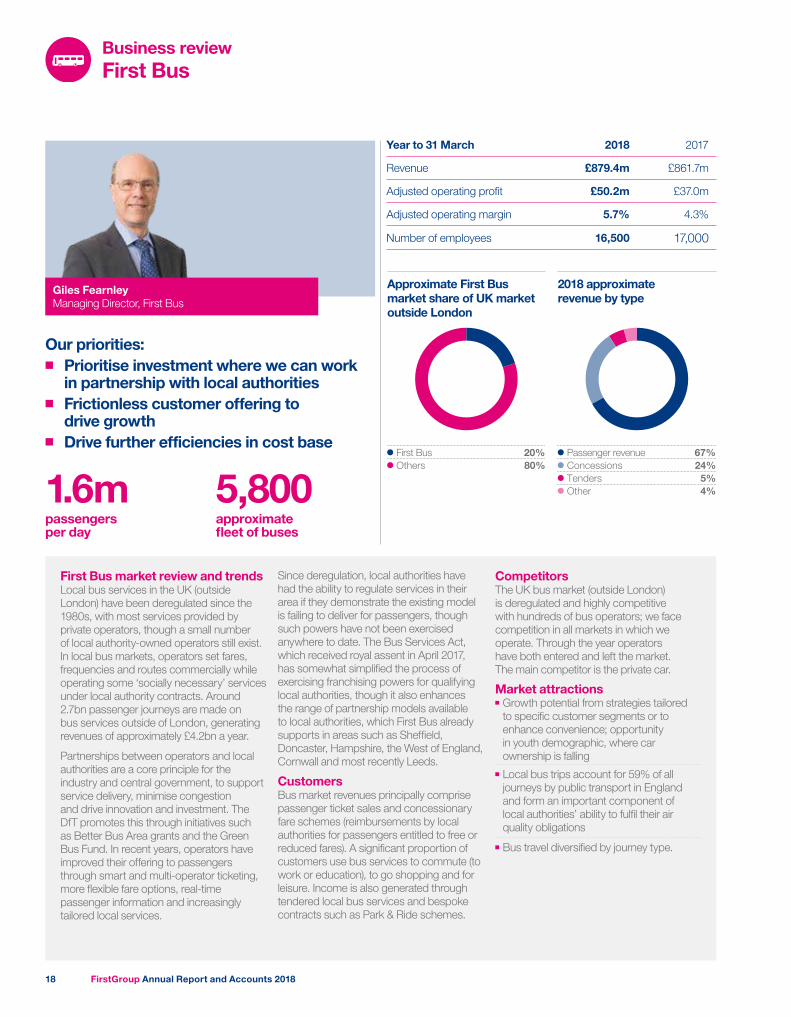
First Bus 20%Others 80%
Approximate First Bus market share of UK market outside London
Passenger revenue 67%Concessions 24%Tenders 5%Other 4%
2018 approximate revenue by type
Year to 31 March 2018 2017
Revenue £879.4m £861.7m
Adjusted operating profit £50.2m £37.0m
Adjusted operating margin 5.7% 4.3%
Number of employees 16,500 17,000
Our priorities:■■ Prioritise investment where we can work
in partnership with local authorities■■ Frictionless customer offering to
drive growth■■ Drive further efficiencies in cost base
First Bus market review and trends Local bus services in the UK (outside London) have been deregulated since the 1980s, with most services provided by private operators, though a small number of local authority-owned operators still exist. In local bus markets, operators set fares, frequencies and routes commercially while operating some ‘socially necessary’ services under local authority contracts. Around 2.7bn passenger journeys are made on bus services outside of London, generating revenues of approximately £4.2bn a year.
Partnerships between operators and local authorities are a core principle for the industry and central government, to support service delivery, minimise congestion and drive innovation and investment. The DfT promotes this through initiatives such as Better Bus Area grants and the Green Bus Fund. In recent years, operators have improved their offering to passengers through smart and multi-operator ticketing, more flexible fare options, real-time passenger information and increasingly tailored local services.
Since deregulation, local authorities have had the ability to regulate services in their area if they demonstrate the existing model is failing to deliver for passengers, though such powers have not been exercised anywhere to date. The Bus Services Act, which received royal assent in April 2017, has somewhat simplified the process of exercising franchising powers for qualifying local authorities, though it also enhances the range of partnership models available to local authorities, which First Bus already supports in areas such as Sheffield, Doncaster, Hampshire, the West of England, Cornwall and most recently Leeds.
Customers Bus market revenues principally comprise passenger ticket sales and concessionary fare schemes (reimbursements by local authorities for passengers entitled to free or reduced fares). A significant proportion of customers use bus services to commute (to work or education), to go shopping and for leisure. Income is also generated through tendered local bus services and bespoke contracts such as Park & Ride schemes.
Competitors The UK bus market (outside London) is deregulated and highly competitive with hundreds of bus operators; we face competition in all markets in which we operate. Through the year operators have both entered and left the market. The main competitor is the private car.
Market attractions■■ Growth potential from strategies tailored to specific customer segments or to enhance convenience; opportunity in youth demographic, where car ownership is falling
■■ Local bus trips account for 59% of all journeys by public transport in England and form an important component of local authorities’ ability to fulfil their air quality obligations
■■ Bus travel diversified by journey type.
1.6m 5,800passengers per day
approximate fleet of buses
FirstGroup Annual Report and Accounts 201818
First Bus reported revenue of £879.4m (2017: £861.7m) for the year, an increase of 2.1%. Divisional like-for-like passenger revenue growth was 1.1%, and we are encouraged that it accelerated in each quarter of the financial year, though market conditions for the industry remain uncertain and vary by local market. High street retail footfall trends, worsening congestion in several localities, and general UK macroeconomic uncertainty all affect passenger demand in different ways. Like-for-like commercial passenger volumes increased by 0.2% in the year, though overall like-for-like volumes fell by 0.7%, reflecting further reductions in concessions volumes due to changes in bus pass entitlement and funding. Our contract and tendered revenue increased by 1.1%.
Adjusted operating profit was £50.2m (2017: £37.0m), or an adjusted margin of 5.7% (2017: 4.3%). Adjusted margin increased by 140bps, reflecting stabilised passenger volumes, the cumulative effect of our actions to tailor our network, fares, depot footprints and other costs to become more efficient and a fuel tailwind. Widespread service suspensions due to the severe snowstorms in February and March had a negative impact on revenues and profit, while the impact of the 53rd week was muted because the year included two Easter weekends, when commuter and school patronage is lower. Principally reflecting restructuring and reorganisation costs, the division reported a statutory profit of £29.3m (2017: £26.1m).
Driving growth through attractive commercial propositionsWe continue to improve the simplicity and convenience of our offering for passengers, particularly in ticketing. Around 80% of our fleet has now been fitted with contactless payment card readers and we will complete
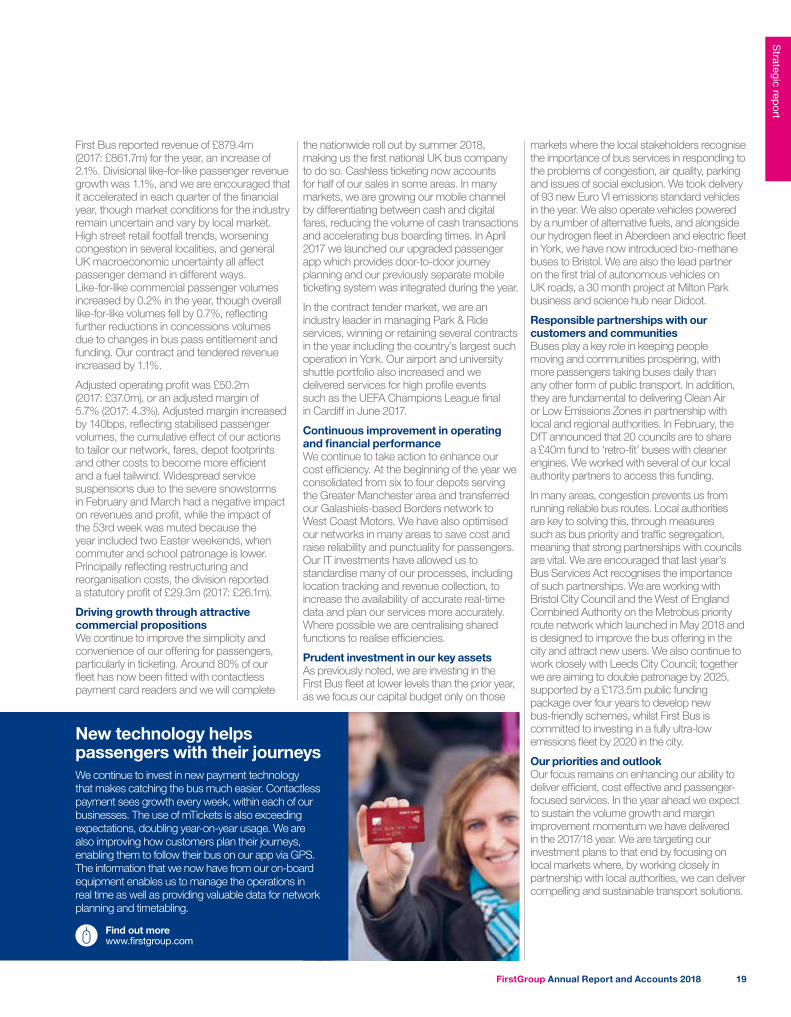
New technology helps passengers with their journeysWe continue to invest in new payment technology that makes catching the bus much easier. Contactless payment sees growth every week, within each of our businesses. The use of mTickets is also exceeding expectations, doubling year-on-year usage. We are also improving how customers plan their journeys, enabling them to follow their bus on our app via GPS. The information that we now have from our on-board equipment enables us to manage the operations in real time as well as providing valuable data for network planning and timetabling.
Find out more www.firstgroup.com
the nationwide roll out by summer 2018, making us the first national UK bus company to do so. Cashless ticketing now accounts for half of our sales in some areas. In many markets, we are growing our mobile channel by differentiating between cash and digital fares, reducing the volume of cash transactions and accelerating bus boarding times. In April 2017 we launched our upgraded passenger app which provides door-to-door journey planning and our previously separate mobile ticketing system was integrated during the year.
In the contract tender market, we are an industry leader in managing Park & Ride services, winning or retaining several contracts in the year including the country’s largest such operation in York. Our airport and university shuttle portfolio also increased and we delivered services for high profile events such as the UEFA Champions League final in Cardiff in June 2017.
Continuous improvement in operating and financial performanceWe continue to take action to enhance our cost efficiency. At the beginning of the year we consolidated from six to four depots serving the Greater Manchester area and transferred our Galashiels-based Borders network to West Coast Motors. We have also optimised our networks in many areas to save cost and raise reliability and punctuality for passengers. Our IT investments have allowed us to standardise many of our processes, including location tracking and revenue collection, to increase the availability of accurate real-time data and plan our services more accurately. Where possible we are centralising shared functions to realise efficiencies.
Prudent investment in our key assetsAs previously noted, we are investing in the First Bus fleet at lower levels than the prior year, as we focus our capital budget only on those
markets where the local stakeholders recognise the importance of bus services in responding to the problems of congestion, air quality, parking and issues of social exclusion. We took delivery of 93 new Euro VI emissions standard vehicles in the year. We also operate vehicles powered by a number of alternative fuels, and alongside our hydrogen fleet in Aberdeen and electric fleet in York, we have now introduced bio-methane buses to Bristol. We are also the lead partner on the first trial of autonomous vehicles on UK roads, a 30 month project at Milton Park business and science hub near Didcot.
Responsible partnerships with our customers and communitiesBuses play a key role in keeping people moving and communities prospering, with more passengers taking buses daily than any other form of public transport. In addition, they are fundamental to delivering Clean Air or Low Emissions Zones in partnership with local and regional authorities. In February, the DfT announced that 20 councils are to share a £40m fund to ‘retro-fit’ buses with cleaner engines. We worked with several of our local authority partners to access this funding.
In many areas, congestion prevents us from running reliable bus routes. Local authorities are key to solving this, through measures such as bus priority and traffic segregation, meaning that strong partnerships with councils are vital. We are encouraged that last year’s Bus Services Act recognises the importance of such partnerships. We are working with Bristol City Council and the West of England Combined Authority on the Metrobus priority route network which launched in May 2018 and is designed to improve the bus offering in the city and attract new users. We also continue to work closely with Leeds City Council; together we are aiming to double patronage by 2025, supported by a £173.5m public funding package over four years to develop new bus-friendly schemes, whilst First Bus is committed to investing in a fully ultra-low emissions fleet by 2020 in the city.
Our priorities and outlookOur focus remains on enhancing our ability to deliver efficient, cost effective and passenger-focused services. In the year ahead we expect to sustain the volume growth and margin improvement momentum we have delivered in the 2017/18 year. We are targeting our investment plans to that end by focusing on local markets where, by working closely in partnership with local authorities, we can deliver compelling and sustainable transport solutions.
FirstGroup Annual Report and Accounts 2018 19
Strategic report
Business reviewFirst Rail
Steve MontgomeryManaging Director, First Rail
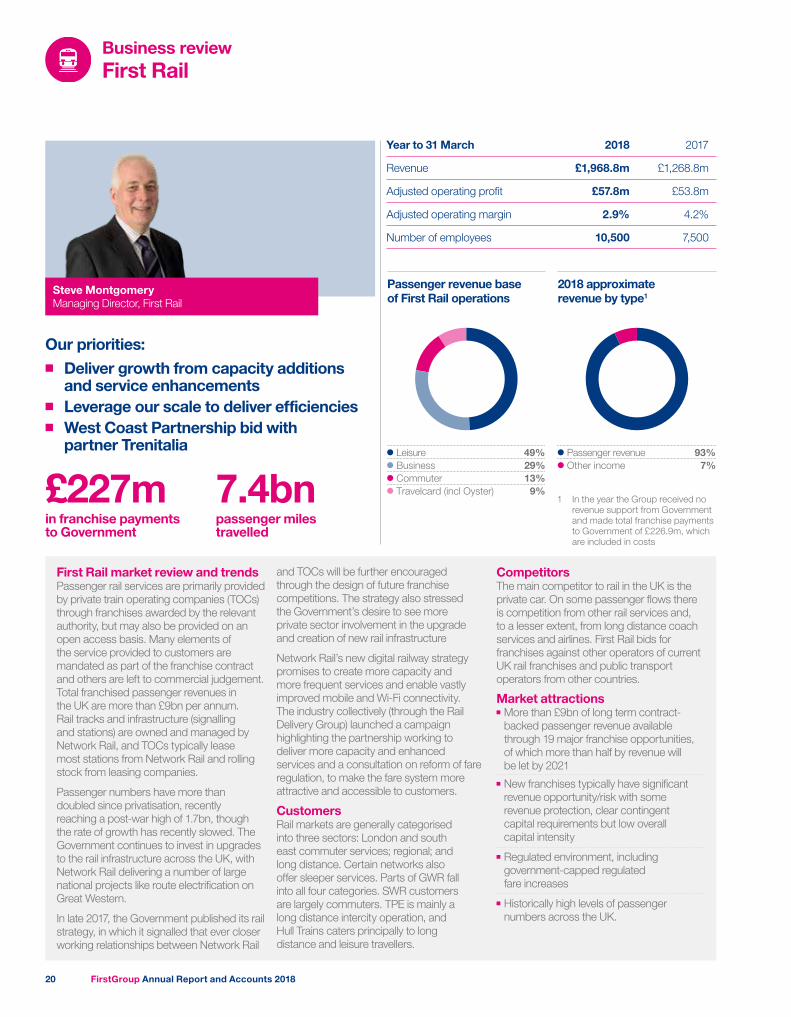
Leisure 49%Business 29%Commuter 13%Travelcard (incl Oyster) 9%
Passenger revenue base of First Rail operations
Passenger revenue 93%Other income 7%
2018 approximate revenue by type1
1 In the year the Group received no revenue support from Government and made total franchise payments to Government of £226.9m, which are included in costs
Year to 31 March 2018 2017
Revenue £1,968.8m £1,268.8m
Adjusted operating profit £57.8m £53.8m
Adjusted operating margin 2.9% 4.2%
Number of employees 10,500 7,500
Our priorities:■■ Deliver growth from capacity additions
and service enhancements■■ Leverage our scale to deliver efficiencies■■ West Coast Partnership bid with
partner Trenitalia
First Rail market review and trends Passenger rail services are primarily provided by private train operating companies (TOCs) through franchises awarded by the relevant authority, but may also be provided on an open access basis. Many elements of the service provided to customers are mandated as part of the franchise contract and others are left to commercial judgement. Total franchised passenger revenues in the UK are more than £9bn per annum. Rail tracks and infrastructure (signalling and stations) are owned and managed by Network Rail, and TOCs typically lease most stations from Network Rail and rolling stock from leasing companies.
Passenger numbers have more than doubled since privatisation, recently reaching a post-war high of 1.7bn, though the rate of growth has recently slowed. The Government continues to invest in upgrades to the rail infrastructure across the UK, with Network Rail delivering a number of large national projects like route electrification on Great Western.
In late 2017, the Government published its rail strategy, in which it signalled that ever closer working relationships between Network Rail
and TOCs will be further encouraged through the design of future franchise competitions. The strategy also stressed the Government’s desire to see more private sector involvement in the upgrade and creation of new rail infrastructure
Network Rail’s new digital railway strategy promises to create more capacity and more frequent services and enable vastly improved mobile and Wi-Fi connectivity. The industry collectively (through the Rail Delivery Group) launched a campaign highlighting the partnership working to deliver more capacity and enhanced services and a consultation on reform of fare regulation, to make the fare system more attractive and accessible to customers.
Customers Rail markets are generally categorised into three sectors: London and south east commuter services; regional; and long distance. Certain networks also offer sleeper services. Parts of GWR fall into all four categories. SWR customers are largely commuters. TPE is mainly a long distance intercity operation, and Hull Trains caters principally to long distance and leisure travellers.
Competitors The main competitor to rail in the UK is the private car. On some passenger flows there is competition from other rail services and, to a lesser extent, from long distance coach services and airlines. First Rail bids for franchises against other operators of current UK rail franchises and public transport operators from other countries.
Market attractions■■ More than £9bn of long term contract-backed passenger revenue available through 19 major franchise opportunities, of which more than half by revenue will be let by 2021
■■ New franchises typically have significant revenue opportunity/risk with some revenue protection, clear contingent capital requirements but low overall capital intensity
■■ Regulated environment, including government-capped regulated fare increases
■■ Historically high levels of passenger numbers across the UK.
£227m 7.4bnin franchise payments to Government
passenger miles travelled
FirstGroup Annual Report and Accounts 201820
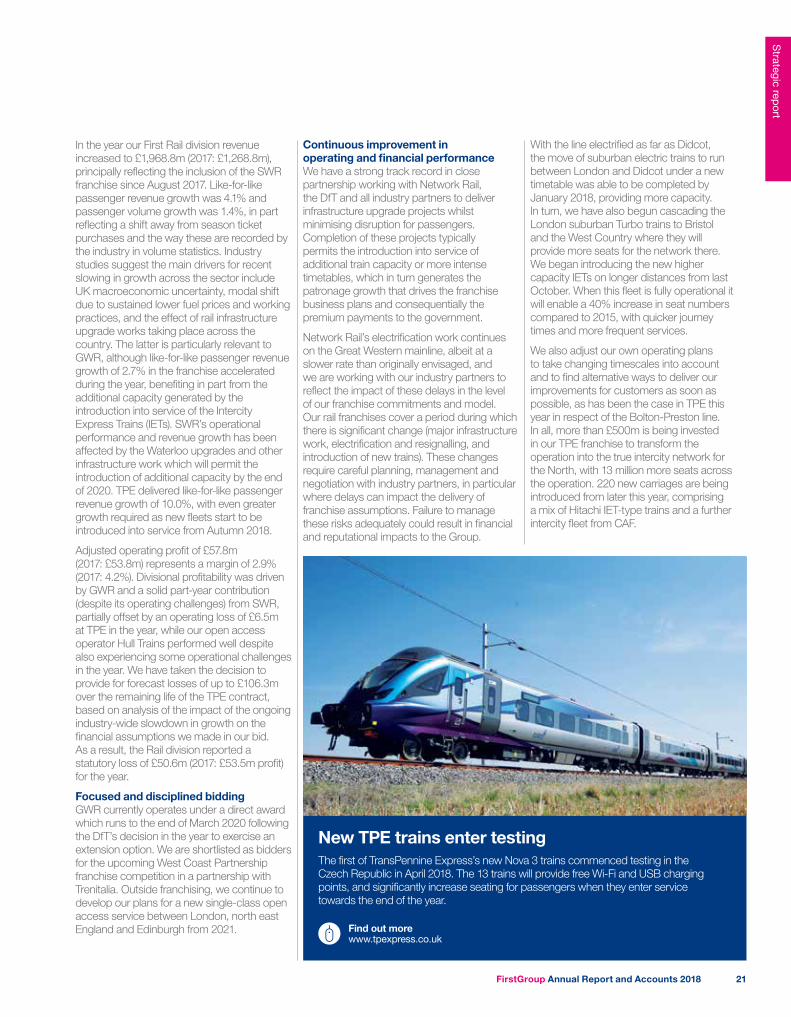
In the year our First Rail division revenue increased to £1,968.8m (2017: £1,268.8m), principally reflecting the inclusion of the SWR franchise since August 2017. Like-for-like passenger revenue growth was 4.1% and passenger volume growth was 1.4%, in part reflecting a shift away from season ticket purchases and the way these are recorded by the industry in volume statistics. Industry studies suggest the main drivers for recent slowing in growth across the sector include UK macroeconomic uncertainty, modal shift due to sustained lower fuel prices and working practices, and the effect of rail infrastructure upgrade works taking place across the country. The latter is particularly relevant to GWR, although like-for-like passenger revenue growth of 2.7% in the franchise accelerated during the year, benefiting in part from the additional capacity generated by the introduction into service of the Intercity Express Trains (IETs). SWR’s operational performance and revenue growth has been affected by the Waterloo upgrades and other infrastructure work which will permit the introduction of additional capacity by the end of 2020. TPE delivered like-for-like passenger revenue growth of 10.0%, with even greater growth required as new fleets start to be introduced into service from Autumn 2018.
Adjusted operating profit of £57.8m (2017: £53.8m) represents a margin of 2.9% (2017: 4.2%). Divisional profitability was driven by GWR and a solid part-year contribution (despite its operating challenges) from SWR, partially offset by an operating loss of £6.5m at TPE in the year, while our open access operator Hull Trains performed well despite also experiencing some operational challenges in the year. We have taken the decision to provide for forecast losses of up to £106.3m over the remaining life of the TPE contract, based on analysis of the impact of the ongoing industry-wide slowdown in growth on the financial assumptions we made in our bid. As a result, the Rail division reported a statutory loss of £50.6m (2017: £53.5m profit) for the year.
Focused and disciplined biddingGWR currently operates under a direct award which runs to the end of March 2020 following the DfT’s decision in the year to exercise an extension option. We are shortlisted as bidders for the upcoming West Coast Partnership franchise competition in a partnership with Trenitalia. Outside franchising, we continue to develop our plans for a new single-class open access service between London, north east England and Edinburgh from 2021.
Continuous improvement in operating and financial performanceWe have a strong track record in close partnership working with Network Rail, the DfT and all industry partners to deliver infrastructure upgrade projects whilst minimising disruption for passengers. Completion of these projects typically permits the introduction into service of additional train capacity or more intense timetables, which in turn generates the patronage growth that drives the franchise business plans and consequentially the premium payments to the government.
Network Rail’s electrification work continues on the Great Western mainline, albeit at a slower rate than originally envisaged, and we are working with our industry partners to reflect the impact of these delays in the level of our franchise commitments and model. Our rail franchises cover a period during which there is significant change (major infrastructure work, electrification and resignalling, and introduction of new trains). These changes require careful planning, management and negotiation with industry partners, in particular where delays can impact the delivery of franchise assumptions. Failure to manage these risks adequately could result in financial and reputational impacts to the Group.
With the line electrified as far as Didcot, the move of suburban electric trains to run between London and Didcot under a new timetable was able to be completed by January 2018, providing more capacity. In turn, we have also begun cascading the London suburban Turbo trains to Bristol and the West Country where they will provide more seats for the network there. We began introducing the new higher capacity IETs on longer distances from last October. When this fleet is fully operational it will enable a 40% increase in seat numbers compared to 2015, with quicker journey times and more frequent services.
We also adjust our own operating plans to take changing timescales into account and to find alternative ways to deliver our improvements for customers as soon as possible, as has been the case in TPE this year in respect of the Bolton-Preston line. In all, more than £500m is being invested in our TPE franchise to transform the operation into the true intercity network for the North, with 13 million more seats across the operation. 220 new carriages are being introduced from later this year, comprising a mix of Hitachi IET-type trains and a further intercity fleet from CAF.
New TPE trains enter testingThe first of TransPennine Express’s new Nova 3 trains commenced testing in the Czech Republic in April 2018. The 13 trains will provide free Wi-Fi and USB charging points, and significantly increase seating for passengers when they enter service towards the end of the year.
Find out more www.tpexpress.co.uk
FirstGroup Annual Report and Accounts 2018 21
Strategic report
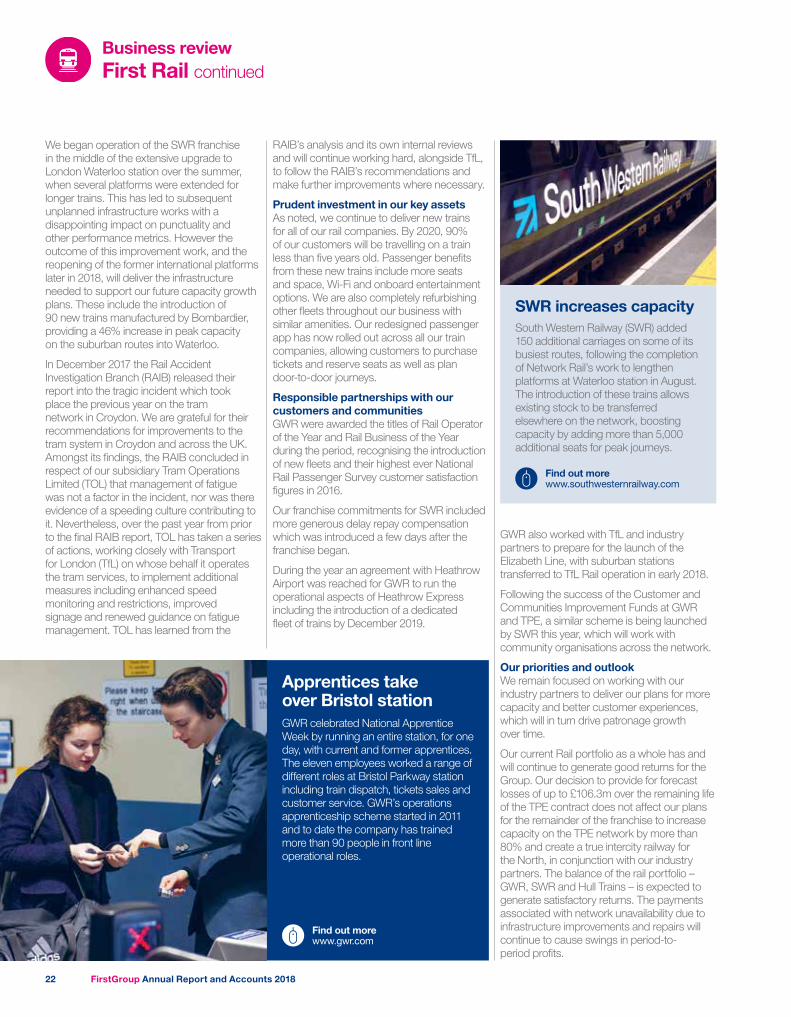
Business reviewFirst Rail continued
SWR increases capacitySouth Western Railway (SWR) added 150 additional carriages on some of its busiest routes, following the completion of Network Rail’s work to lengthen platforms at Waterloo station in August. The introduction of these trains allows existing stock to be transferred elsewhere on the network, boosting capacity by adding more than 5,000 additional seats for peak journeys.
Apprentices take over Bristol stationGWR celebrated National Apprentice Week by running an entire station, for one day, with current and former apprentices. The eleven employees worked a range of different roles at Bristol Parkway station including train dispatch, tickets sales and customer service. GWR’s operations apprenticeship scheme started in 2011 and to date the company has trained more than 90 people in front line operational roles.
Find out more www.gwr.com
We began operation of the SWR franchise in the middle of the extensive upgrade to London Waterloo station over the summer, when several platforms were extended for longer trains. This has led to subsequent unplanned infrastructure works with a disappointing impact on punctuality and other performance metrics. However the outcome of this improvement work, and the reopening of the former international platforms later in 2018, will deliver the infrastructure needed to support our future capacity growth plans. These include the introduction of 90 new trains manufactured by Bombardier, providing a 46% increase in peak capacity on the suburban routes into Waterloo.
In December 2017 the Rail Accident Investigation Branch (RAIB) released their report into the tragic incident which took place the previous year on the tram network in Croydon. We are grateful for their recommendations for improvements to the tram system in Croydon and across the UK. Amongst its findings, the RAIB concluded in respect of our subsidiary Tram Operations Limited (TOL) that management of fatigue was not a factor in the incident, nor was there evidence of a speeding culture contributing to it. Nevertheless, over the past year from prior to the final RAIB report, TOL has taken a series of actions, working closely with Transport for London (TfL) on whose behalf it operates the tram services, to implement additional measures including enhanced speed monitoring and restrictions, improved signage and renewed guidance on fatigue management. TOL has learned from the
RAIB’s analysis and its own internal reviews and will continue working hard, alongside TfL, to follow the RAIB’s recommendations and make further improvements where necessary.
Prudent investment in our key assetsAs noted, we continue to deliver new trains for all of our rail companies. By 2020, 90% of our customers will be travelling on a train less than five years old. Passenger benefits from these new trains include more seats and space, Wi-Fi and onboard entertainment options. We are also completely refurbishing other fleets throughout our business with similar amenities. Our redesigned passenger app has now rolled out across all our train companies, allowing customers to purchase tickets and reserve seats as well as plan door-to-door journeys.
Responsible partnerships with our customers and communitiesGWR were awarded the titles of Rail Operator of the Year and Rail Business of the Year during the period, recognising the introduction of new fleets and their highest ever National Rail Passenger Survey customer satisfaction figures in 2016.
Our franchise commitments for SWR included more generous delay repay compensation which was introduced a few days after the franchise began.
During the year an agreement with Heathrow Airport was reached for GWR to run the operational aspects of Heathrow Express including the introduction of a dedicated fleet of trains by December 2019.
GWR also worked with TfL and industry partners to prepare for the launch of the Elizabeth Line, with suburban stations transferred to TfL Rail operation in early 2018.
Following the success of the Customer and Communities Improvement Funds at GWR and TPE, a similar scheme is being launched by SWR this year, which will work with community organisations across the network.
Our priorities and outlookWe remain focused on working with our industry partners to deliver our plans for more capacity and better customer experiences, which will in turn drive patronage growth over time.
Our current Rail portfolio as a whole has and will continue to generate good returns for the Group. Our decision to provide for forecast losses of up to £106.3m over the remaining life of the TPE contract does not affect our plans for the remainder of the franchise to increase capacity on the TPE network by more than 80% and create a true intercity railway for the North, in conjunction with our industry partners. The balance of the rail portfolio – GWR, SWR and Hull Trains – is expected to generate satisfactory returns. The payments associated with network unavailability due to infrastructure improvements and repairs will continue to cause swings in period-to-period profits.
Find out more www.southwesternrailway.com
FirstGroup Annual Report and Accounts 201822
Corporate responsibility
Public transport is at the heart of the local economy in all markets in which we operate and central to the quality of life of communities that we serve. Buses and trains connect people to jobs and customers to businesses, offering access to education and public services and promoting social inclusion. Not only does local transport contribute to local prosperity and growth, it can also offer lower levels of greenhouse gases and local air pollutants per passenger and reduces congestion due to lower traffic volumes.
As a leading transport operator we provide sustainable travel solutions for our customers and the communities we serve. The contribution of safe, affordable and accessible transport is key to the sustainability of our business. Our approach to corporate responsibility covers our commitment to the environment, safety, our people and communities – the areas where we have a material impact and can bring about positive change.
We have detailed policies in place across FirstGroup that ensure a cohesive approach to corporate responsibility. In each of these areas, we aim to exceed regulatory requirements, and work with expert networks and groups to learn from best practice, helping us to respond to current and future trends. To ensure we are sharing industry best practice, we are active members in groups such as the UK’s Rail Safety and Standards Board (RSSB) and Greener Journeys – a campaign dedicated to encouraging people to make more sustainable travel choices. In the US, First Student works closely with the School Superintendents Association (AASA).
We are constantly striving to find innovative ways to meet the changing expectations and needs of our customers. Our aim is always to be the provider of choice for those we serve – optimising our resources and investing in the future of our people and communities.
1 http://www.worldbank.org/en/news/press-release/2016/05/05/leaders-call-for-global- action-to-reduce-transports-climate-footprint
2 IEA (International Energy Association)
3 RSSB
EnvironmentTransport related CO2 emissions contribute 23% to the global total and are increasing at an annual rate of around 2.5%1.In the last two years, the transport sector has overtaken the power sector as the largest contributor to greenhouse gas emissions both in the UK and North America. At the same time, there has been a focus on local air quality due to the increasing number of studies showing the links between local air pollutants and human health. A significant modal shift in urban transport from private vehicles to more efficient public transport modes is needed to achieve related objectives of CO2 emission reductions and improve urban air quality.2
The provision of affordable and accessible transport is central to our offering ‘end to end’ journeys with exceptionally low ‘per passenger’ emissions and high levels of comfort and safety.3
Greenhouse gas emissionsThe significant contribution that the transport sector makes to the greenhouse gas emissions in the countries in which we operate has led to increasing scrutiny from policy makers and regulators.
Transport services provided by FirstGroup offer compelling ‘per passenger’ CO2 reductions when compared with private transport and air travel. This is indicated in the table below:
ModegCO2(e)/passenger
kilometre
First Bus 81.8
First Rail 44.8
Greyhound 32.1
Car (average UK)* 112.1
Car (average US)** 222.7
Domestic Flight* 267.4
Source:
* DEFRA Conversion Factors (2017) and UK Gov NTS 0905 (2016).
** EPA/Climate Leaders (2018) and NHTS Federal Highway Administration (2017)
Local air qualityThe link between vehicle exhaust emissions, poor local air quality and the impact on human health drives our programme of investment in cleaner vehicles and information systems. Regulatory standards for bus engine types in both the UK and North America have become increasingly stringent as shown in the graph on page 24.
The air quality impact of our vehicles is something we are constantly striving to improve. One way in which we can do this is to use the cleanest vehicles we have most often. The latest diesel engine type that we can use in the UK is called Euro VI – offering significant improvements in local air emissions such as Nitrogen Oxides (NOx) and Particulate Matter (PMs). In the US the latest diesel engine types must conform to the EPA 2014 standard.
First StudentIn the US, the American School Bus Council reports that each yellow school bus carries (on average) 54 students and takes 36 cars off the road during the morning and evening peaks. Without school buses more than 17m extra cars would be needed to transport students currently riding on all school buses in the US.
First Student emissions of PMs and NOx have fallen by 22% and 17% respectively between 2016/17 and 2017/18. This decrease results largely from our replacement of older fleet with lower-emission alternatives and because we are using our older vehicles less often. For example, we have achieved a 28% reduction in mileage by vehicles which pre-date 2007 – which is the year in which the EPA emissions standards became markedly more stringent with respect to NOx and PMs.
First TransitFirst Transit are at the forefront of new technologies offering zero tailpipe emissions, such as the battery electric vehicles operating in Rochester, Minnesota and Arlington, Texas as well as autonomous shuttle vehicles in San Ramon, California.
We have delivered a range of alternative fuel, low and zero emission buses both in response to customer demand and to meet our longer term aims of carbon reduction and clean air.
In 2017/18 we completed 13% of miles with natural gas and liquid petroleum gas (LPG) powered buses – these are amongst the lowest emission vehicles in our fleet. Whilst tailpipe emissions of CO2 are on par with those of the latest generation of diesel engines, harmful air emissions of NOx and PMs are significantly reduced.
FirstGroup Annual Report and Accounts 2018 23
Strategic report
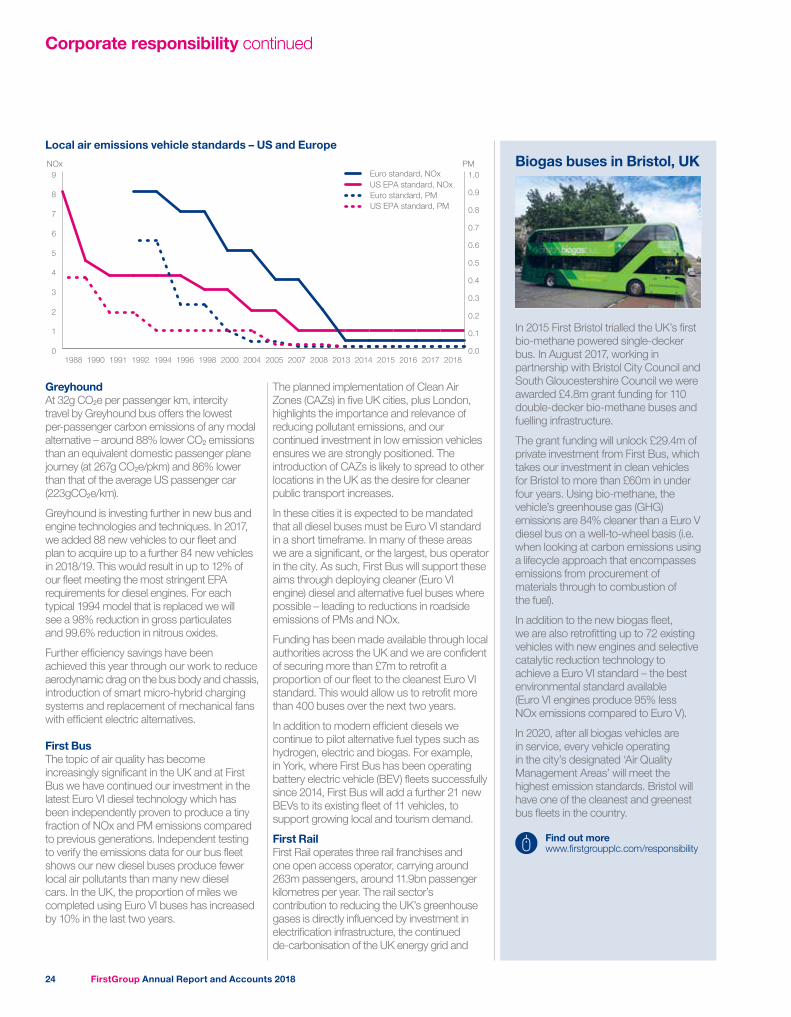
Corporate responsibility continued
GreyhoundAt 32g CO2e per passenger km, intercity travel by Greyhound bus offers the lowest per-passenger carbon emissions of any modal alternative – around 88% lower CO2 emissions than an equivalent domestic passenger plane journey (at 267g CO2e/pkm) and 86% lower than that of the average US passenger car (223gCO2e/km).
Greyhound is investing further in new bus and engine technologies and techniques. In 2017, we added 88 new vehicles to our fleet and plan to acquire up to a further 84 new vehicles in 2018/19. This would result in up to 12% of our fleet meeting the most stringent EPA requirements for diesel engines. For each typical 1994 model that is replaced we will see a 98% reduction in gross particulates and 99.6% reduction in nitrous oxides.
Further efficiency savings have been achieved this year through our work to reduce aerodynamic drag on the bus body and chassis, introduction of smart micro-hybrid charging systems and replacement of mechanical fans with efficient electric alternatives.
First Bus The topic of air quality has become increasingly significant in the UK and at First Bus we have continued our investment in the latest Euro VI diesel technology which has been independently proven to produce a tiny fraction of NOx and PM emissions compared to previous generations. Independent testing to verify the emissions data for our bus fleet shows our new diesel buses produce fewer local air pollutants than many new diesel cars. In the UK, the proportion of miles we completed using Euro VI buses has increased by 10% in the last two years.
The planned implementation of Clean Air Zones (CAZs) in five UK cities, plus London, highlights the importance and relevance of reducing pollutant emissions, and our continued investment in low emission vehicles ensures we are strongly positioned. The introduction of CAZs is likely to spread to other locations in the UK as the desire for cleaner public transport increases.
In these cities it is expected to be mandated that all diesel buses must be Euro VI standard in a short timeframe. In many of these areas we are a significant, or the largest, bus operator in the city. As such, First Bus will support these aims through deploying cleaner (Euro VI engine) diesel and alternative fuel buses where possible – leading to reductions in roadside emissions of PMs and NOx.
Funding has been made available through local authorities across the UK and we are confident of securing more than £7m to retrofit a proportion of our fleet to the cleanest Euro VI standard. This would allow us to retrofit more than 400 buses over the next two years.
In addition to modern efficient diesels we continue to pilot alternative fuel types such as hydrogen, electric and biogas. For example, in York, where First Bus has been operating battery electric vehicle (BEV) fleets successfully since 2014, First Bus will add a further 21 new BEVs to its existing fleet of 11 vehicles, to support growing local and tourism demand.
First RailFirst Rail operates three rail franchises and one open access operator, carrying around 263m passengers, around 11.9bn passenger kilometres per year. The rail sector’s contribution to reducing the UK’s greenhouse gases is directly influenced by investment in electrification infrastructure, the continued de-carbonisation of the UK energy grid and
Biogas buses in Bristol, UK
In 2015 First Bristol trialled the UK’s first bio-methane powered single-decker bus. In August 2017, working in partnership with Bristol City Council and South Gloucestershire Council we were awarded £4.8m grant funding for 110 double-decker bio-methane buses and fuelling infrastructure.
The grant funding will unlock £29.4m of private investment from First Bus, which takes our investment in clean vehicles for Bristol to more than £60m in under four years. Using bio-methane, the vehicle’s greenhouse gas (GHG) emissions are 84% cleaner than a Euro V diesel bus on a well-to-wheel basis (i.e. when looking at carbon emissions using a lifecycle approach that encompasses emissions from procurement of materials through to combustion of the fuel).
In addition to the new biogas fleet, we are also retrofitting up to 72 existing vehicles with new engines and selective catalytic reduction technology to achieve a Euro VI standard – the best environmental standard available (Euro VI engines produce 95% less NOx emissions compared to Euro V).
In 2020, after all biogas vehicles are in service, every vehicle operating in the city’s designated ‘Air Quality Management Areas’ will meet the highest emission standards. Bristol will have one of the cleanest and greenest bus fleets in the country.
Find out more www.firstgroupplc.com/responsibility
Local air emissions vehicle standards – US and Europe
0
1
2
3
4
5
6
7
8
9
2018201720162015201420132008200720052004200019981996199419921991199019880.0
0.1
0.2
0.3
0.4
0.5
0.6
0.7
0.8
0.9
1.0US EPA standard, NOxEuro standard, NOx
Euro standard, PMUS EPA standard, PM
PMNOx
FirstGroup Annual Report and Accounts 201824
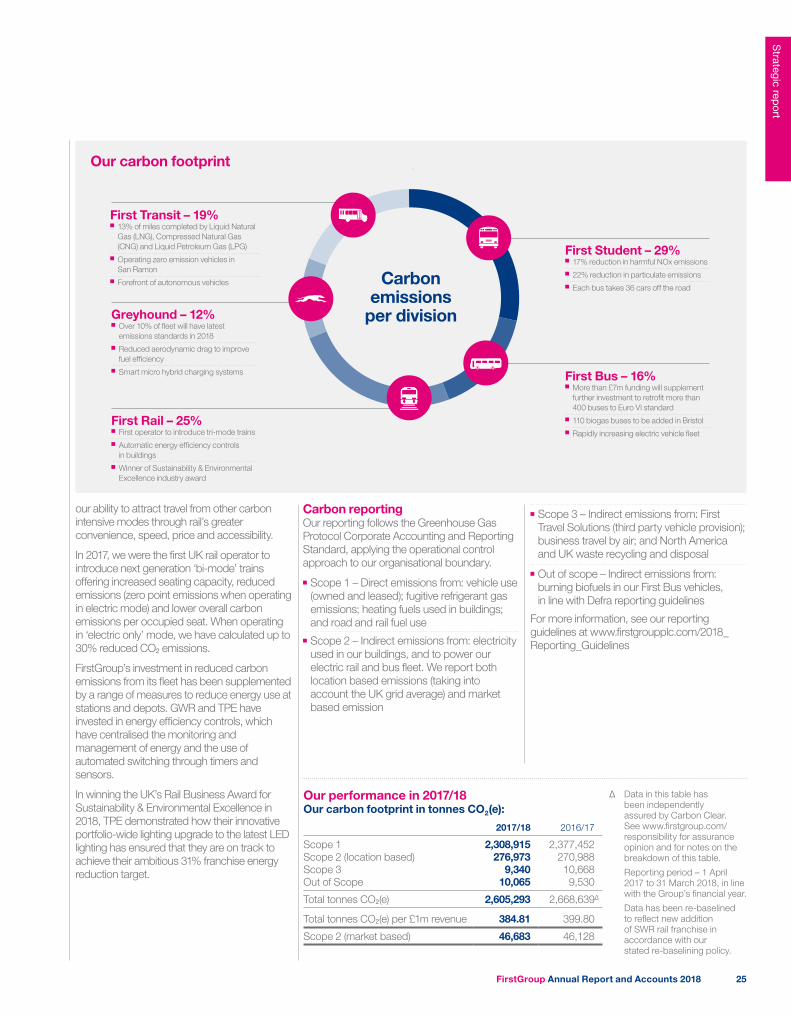
First Bus – 16%■■ More than £7m funding will supplement further investment to retrofit more than 400 buses to Euro VI standard
■■ 110 biogas buses to be added in Bristol■■ Rapidly increasing electric vehicle fleet
First Rail – 25%■■ First operator to introduce tri-mode trains■■ Automatic energy efficiency controls in buildings
■■ Winner of Sustainability & Environmental Excellence industry award
First Student – 29%■■ 17% reduction in harmful NOx emissions■■ 22% reduction in particulate emissions■■ Each bus takes 36 cars off the road
First Transit – 19%■■ 13% of miles completed by Liquid Natural Gas (LNG), Compressed Natural Gas (CNG) and Liquid Petroleum Gas (LPG)
■■ Operating zero emission vehicles in San Ramon
■■ Forefront of autonomous vehicles
Greyhound – 12%■■ Over 10% of fleet will have latest emissions standards in 2018
■■ Reduced aerodynamic drag to improve fuel efficiency
■■ Smart micro hybrid charging systems
our ability to attract travel from other carbon intensive modes through rail’s greater convenience, speed, price and accessibility.
In 2017, we were the first UK rail operator to introduce next generation ‘bi-mode’ trains offering increased seating capacity, reduced emissions (zero point emissions when operating in electric mode) and lower overall carbon emissions per occupied seat. When operating in ‘electric only’ mode, we have calculated up to 30% reduced CO2 emissions.
FirstGroup’s investment in reduced carbon emissions from its fleet has been supplemented by a range of measures to reduce energy use at stations and depots. GWR and TPE have invested in energy efficiency controls, which have centralised the monitoring and management of energy and the use of automated switching through timers and sensors.
In winning the UK’s Rail Business Award for Sustainability & Environmental Excellence in 2018, TPE demonstrated how their innovative portfolio-wide lighting upgrade to the latest LED lighting has ensured that they are on track to achieve their ambitious 31% franchise energy reduction target.
Carbon reporting Our reporting follows the Greenhouse Gas Protocol Corporate Accounting and Reporting Standard, applying the operational control approach to our organisational boundary.
■■ Scope 1 – Direct emissions from: vehicle use (owned and leased); fugitive refrigerant gas emissions; heating fuels used in buildings; and road and rail fuel use
■■ Scope 2 – Indirect emissions from: electricity used in our buildings, and to power our electric rail and bus fleet. We report both location based emissions (taking into account the UK grid average) and market based emission
■■ Scope 3 – Indirect emissions from: First Travel Solutions (third party vehicle provision); business travel by air; and North America and UK waste recycling and disposal
■■ Out of scope – Indirect emissions from: burning biofuels in our First Bus vehicles, in line with Defra reporting guidelines
For more information, see our reporting guidelines at www.firstgroupplc.com/2018_Reporting_Guidelines
Our performance in 2017/18Our carbon footprint in tonnes CO2(e):
2017/18 2016/17
Scope 1 2,308,915 2,377,452Scope 2 (location based) 276,973 270,988Scope 3 9,340 10,668Out of Scope 10,065 9,530
Total tonnes CO2(e) 2,605,293 2,668,639Δ
Total tonnes CO2(e) per £1m revenue 384.81 399.80
Scope 2 (market based) 46,683 46,128
Δ Data in this table has been independently assured by Carbon Clear. See www.firstgroup.com/responsibility for assurance opinion and for notes on the breakdown of this table.
Reporting period – 1 April 2017 to 31 March 2018, in line with the Group’s financial year.
Data has been re-baselined to reflect new addition of SWR rail franchise in accordance with our stated re-baselining policy.
Our carbon footprint
Carbon emissions
per division
FirstGroup Annual Report and Accounts 2018 25
Strategic report
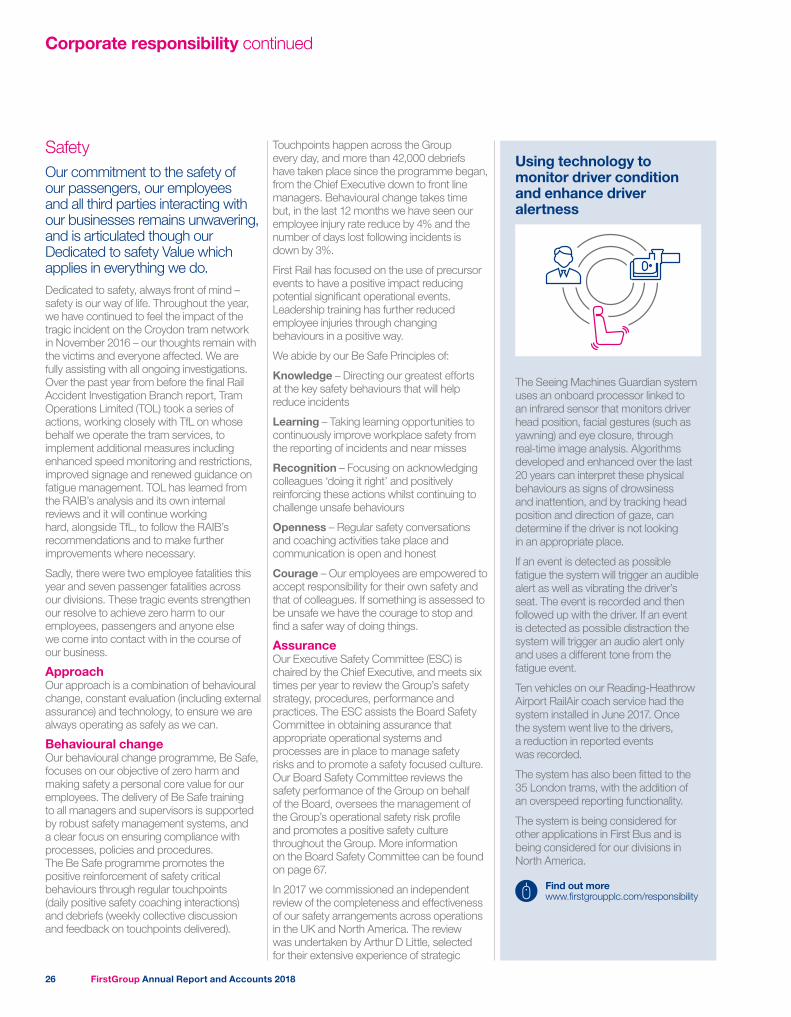
Corporate responsibility continued
Safety Our commitment to the safety of our passengers, our employees and all third parties interacting with our businesses remains unwavering, and is articulated though our Dedicated to safety Value which applies in everything we do.Dedicated to safety, always front of mind – safety is our way of life. Throughout the year, we have continued to feel the impact of the tragic incident on the Croydon tram network in November 2016 – our thoughts remain with the victims and everyone affected. We are fully assisting with all ongoing investigations. Over the past year from before the final Rail Accident Investigation Branch report, Tram Operations Limited (TOL) took a series of actions, working closely with TfL on whose behalf we operate the tram services, to implement additional measures including enhanced speed monitoring and restrictions, improved signage and renewed guidance on fatigue management. TOL has learned from the RAIB’s analysis and its own internal reviews and it will continue working hard, alongside TfL, to follow the RAIB’s recommendations and to make further improvements where necessary.
Sadly, there were two employee fatalities this year and seven passenger fatalities across our divisions. These tragic events strengthen our resolve to achieve zero harm to our employees, passengers and anyone else we come into contact with in the course of our business.
Approach Our approach is a combination of behavioural change, constant evaluation (including external assurance) and technology, to ensure we are always operating as safely as we can.
Behavioural change Our behavioural change programme, Be Safe, focuses on our objective of zero harm and making safety a personal core value for our employees. The delivery of Be Safe training to all managers and supervisors is supported by robust safety management systems, and a clear focus on ensuring compliance with processes, policies and procedures. The Be Safe programme promotes the positive reinforcement of safety critical behaviours through regular touchpoints (daily positive safety coaching interactions) and debriefs (weekly collective discussion and feedback on touchpoints delivered).
Touchpoints happen across the Group every day, and more than 42,000 debriefs have taken place since the programme began, from the Chief Executive down to front line managers. Behavioural change takes time but, in the last 12 months we have seen our employee injury rate reduce by 4% and the number of days lost following incidents is down by 3%.
First Rail has focused on the use of precursor events to have a positive impact reducing potential significant operational events. Leadership training has further reduced employee injuries through changing behaviours in a positive way.
We abide by our Be Safe Principles of:
Knowledge – Directing our greatest efforts at the key safety behaviours that will help reduce incidents
Learning – Taking learning opportunities to continuously improve workplace safety from the reporting of incidents and near misses
Recognition – Focusing on acknowledging colleagues ‘doing it right’ and positively reinforcing these actions whilst continuing to challenge unsafe behaviours
Openness – Regular safety conversations and coaching activities take place and communication is open and honest
Courage – Our employees are empowered to accept responsibility for their own safety and that of colleagues. If something is assessed to be unsafe we have the courage to stop and find a safer way of doing things.
AssuranceOur Executive Safety Committee (ESC) is chaired by the Chief Executive, and meets six times per year to review the Group’s safety strategy, procedures, performance and practices. The ESC assists the Board Safety Committee in obtaining assurance that appropriate operational systems and processes are in place to manage safety risks and to promote a safety focused culture. Our Board Safety Committee reviews the safety performance of the Group on behalf of the Board, oversees the management of the Group’s operational safety risk profile and promotes a positive safety culture throughout the Group. More information on the Board Safety Committee can be found on page 67.
In 2017 we commissioned an independent review of the completeness and effectiveness of our safety arrangements across operations in the UK and North America. The review was undertaken by Arthur D Little, selected for their extensive experience of strategic
Using technology to monitor driver condition and enhance driver alertness
The Seeing Machines Guardian system uses an onboard processor linked to an infrared sensor that monitors driver head position, facial gestures (such as yawning) and eye closure, through real-time image analysis. Algorithms developed and enhanced over the last 20 years can interpret these physical behaviours as signs of drowsiness and inattention, and by tracking head position and direction of gaze, can determine if the driver is not looking in an appropriate place.
If an event is detected as possible fatigue the system will trigger an audible alert as well as vibrating the driver’s seat. The event is recorded and then followed up with the driver. If an event is detected as possible distraction the system will trigger an audio alert only and uses a different tone from the fatigue event.
Ten vehicles on our Reading-Heathrow Airport RailAir coach service had the system installed in June 2017. Once the system went live to the drivers, a reduction in reported events was recorded.
The system has also been fitted to the 35 London trams, with the addition of an overspeed reporting functionality.
The system is being considered for other applications in First Bus and is being considered for our divisions in North America.
Find out more www.firstgroupplc.com/responsibility
FirstGroup Annual Report and Accounts 201826
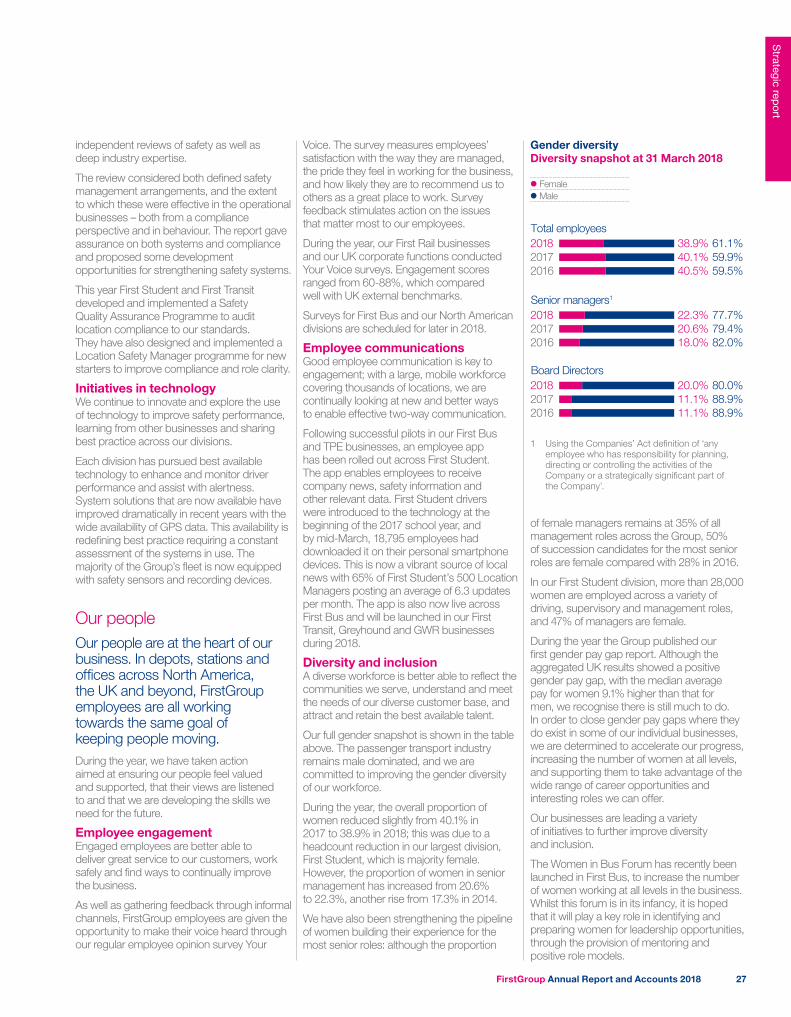
independent reviews of safety as well as deep industry expertise.
The review considered both defined safety management arrangements, and the extent to which these were effective in the operational businesses – both from a compliance perspective and in behaviour. The report gave assurance on both systems and compliance and proposed some development opportunities for strengthening safety systems.
This year First Student and First Transit developed and implemented a Safety Quality Assurance Programme to audit location compliance to our standards. They have also designed and implemented a Location Safety Manager programme for new starters to improve compliance and role clarity.
Initiatives in technologyWe continue to innovate and explore the use of technology to improve safety performance, learning from other businesses and sharing best practice across our divisions.
Each division has pursued best available technology to enhance and monitor driver performance and assist with alertness. System solutions that are now available have improved dramatically in recent years with the wide availability of GPS data. This availability is redefining best practice requiring a constant assessment of the systems in use. The majority of the Group’s fleet is now equipped with safety sensors and recording devices.
Our peopleOur people are at the heart of our business. In depots, stations and offices across North America, the UK and beyond, FirstGroup employees are all working towards the same goal of keeping people moving. During the year, we have taken action aimed at ensuring our people feel valued and supported, that their views are listened to and that we are developing the skills we need for the future.
Employee engagementEngaged employees are better able to deliver great service to our customers, work safely and find ways to continually improve the business.
As well as gathering feedback through informal channels, FirstGroup employees are given the opportunity to make their voice heard through our regular employee opinion survey Your
Voice. The survey measures employees’ satisfaction with the way they are managed, the pride they feel in working for the business, and how likely they are to recommend us to others as a great place to work. Survey feedback stimulates action on the issues that matter most to our employees.
During the year, our First Rail businesses and our UK corporate functions conducted Your Voice surveys. Engagement scores ranged from 60-88%, which compared well with UK external benchmarks.
Surveys for First Bus and our North American divisions are scheduled for later in 2018.
Employee communicationsGood employee communication is key to engagement; with a large, mobile workforce covering thousands of locations, we are continually looking at new and better ways to enable effective two-way communication.
Following successful pilots in our First Bus and TPE businesses, an employee app has been rolled out across First Student. The app enables employees to receive company news, safety information and other relevant data. First Student drivers were introduced to the technology at the beginning of the 2017 school year, and by mid-March, 18,795 employees had downloaded it on their personal smartphone devices. This is now a vibrant source of local news with 65% of First Student’s 500 Location Managers posting an average of 6.3 updates per month. The app is also now live across First Bus and will be launched in our First Transit, Greyhound and GWR businesses during 2018.
Diversity and inclusionA diverse workforce is better able to reflect the communities we serve, understand and meet the needs of our diverse customer base, and attract and retain the best available talent.
Our full gender snapshot is shown in the table above. The passenger transport industry remains male dominated, and we are committed to improving the gender diversity of our workforce.
During the year, the overall proportion of women reduced slightly from 40.1% in 2017 to 38.9% in 2018; this was due to a headcount reduction in our largest division, First Student, which is majority female. However, the proportion of women in senior management has increased from 20.6% to 22.3%, another rise from 17.3% in 2014.
We have also been strengthening the pipeline of women building their experience for the most senior roles: although the proportion
of female managers remains at 35% of all management roles across the Group, 50% of succession candidates for the most senior roles are female compared with 28% in 2016.
In our First Student division, more than 28,000 women are employed across a variety of driving, supervisory and management roles, and 47% of managers are female.
During the year the Group published our first gender pay gap report. Although the aggregated UK results showed a positive gender pay gap, with the median average pay for women 9.1% higher than that for men, we recognise there is still much to do. In order to close gender pay gaps where they do exist in some of our individual businesses, we are determined to accelerate our progress, increasing the number of women at all levels, and supporting them to take advantage of the wide range of career opportunities and interesting roles we can offer.
Our businesses are leading a variety of initiatives to further improve diversity and inclusion.
The Women in Bus Forum has recently been launched in First Bus, to increase the number of women working at all levels in the business. Whilst this forum is in its infancy, it is hoped that it will play a key role in identifying and preparing women for leadership opportunities, through the provision of mentoring and positive role models.
Gender diversityDiversity snapshot at 31 March 2018
Total employees
Senior managers1
Board Directors
2018 38.9%40.1%201740.5%2016
61.1%59.9%59.5%
2018 22.3%20.6%201718.0%2016
77.7%79.4%82.0%
2018 20.0%11.1%201711.1%2016
80.0%88.9%88.9%
Female Male
1 Using the Companies’ Act definition of ‘any employee who has responsibility for planning, directing or controlling the activities of the Company or a strategically significant part of the Company’.
FirstGroup Annual Report and Accounts 2018 27
Strategic report
Corporate responsibility continued
We are piloting new approaches to the way we market roles which have traditionally attracted many more male than female candidates. For example in TPE, advertising the ‘Conductor’ role as a ‘Customer Service Professional’ last year resulted in 38% of new hires being female, a significant increase. Following a proactive campaign at TPE to encourage females to apply for train driver vacancies, 12.5% of recent hires were women, compared with 4.7% of the existing driver population.
We have refreshed all our UK recruitment advertising photography and video content to ensure women are prominent, and we now use the software tool ‘Textio’ to check the language of our recruitment advertising material to ensure it is not unconsciously biased towards male candidates. Following these actions, we saw a 9% increase in the number of women viewing our opportunities in First Bus, and a 3% increase in the proportion of job offers made to female candidates.
Health and wellbeingWe want to support our people to stay healthy and active; good physical and mental health helps ensure better customer service, employee motivation, performance and safety. All our businesses offer access to free and confidential counselling for employees.
In addition, each runs local initiatives targeting the issues most relevant to the workforce.
SWR provides interactive wellbeing kiosks at key locations, where employees can measure themselves on a range of health indicators including mental wellbeing. SWR is also rolling out mental health awareness workshops to help managers to understand how they can best provide support for their people.
At TPE, free health assessment events help colleagues understand their key health indicators such as cholesterol, blood sugar and lung health. A network of wellbeing champions have received training in musculoskeletal health, nutritional awareness, communication and influencing skills so that they can act as role models and encourage colleagues to adopt a healthier lifestyle.
At GWR, the in-house occupational health team continues to provide free rapid access to physiotherapy for employees with musculoskeletal conditions, and also proactively undertakes risk assessments in ticket offices, on trains and in depots to prevent incidents and injuries from occurring.
First Bus has promoted healthy eating options in canteen menus, and has offered health ‘mini MOTs’ and healthy eating workshops.
In North America, we operate a variety of wellness initiatives and reward programmes designed to help employees to get a full picture of their health, provide them with advice and support to help them meet their goals, and encourage healthy lifestyle choices. Greyhound’s ‘Rolling Strong’ programme provides wellbeing advice to drivers with a particular focus on healthy eating. The programme expanded further this year by partnering with a major gym provider in Canada, enabling colleagues and their families to benefit from discounted gym membership.
Developing our peopleAcross the Group we continue to invest in developing the skills of our people. This year, we are proud that our North American divisions have developed e-learning platforms, giving our frontline distributed workforce access to good quality training to enhance and grow their skills. During the year, employees across the US, Canada, Mexico, and Panama took more than 11,000 online courses through FGA University and Greyhound University.
Audrey Simpson Bus driver, First Bus
Audrey works on the flagship Glasgow Airport service based out of our Caledonia Depot. Before joining First Bus in 2008, mother-of-three Audrey previously worked in the school kitchens, then later as a Catering Supervisor at a local hospital but was always interested in changing career paths to become a bus driver.
Audrey says: “I always wanted to be a bus driver. After having kids, I saw an advert on the back of a bus and decided to go for it. Working on the Airport bus, I’m often the first person tourists speak to when they arrive in Glasgow. I love my job.”
Our UK graduate scheme
Following a degree in International Business at Edinburgh University, Evie was looking for a ‘hands on’ graduate scheme which would give her the opportunity to apply what she’d learned. The transport sector appealed because of the change and modernisation that’s ongoing, and she felt that First Bus offered a broad graduate scheme with lots of opportunities.
Evie says: “It’s a fantastic graduate scheme with the chance to see all aspects of the business first hand. People here are very friendly and supportive. I love the variety, it will help me decide which type of management role I want to take on after the two-year programme.”
Building future capabilityIn addition to investing in the skills of our existing workforce we are expanding our UK graduate and apprenticeship schemes to bring in new engineering, operational and leadership talent for the future.
In 2017, 75 new apprentices began their careers in our First Bus and Rail divisions, an increase on the 66 who joined in 2016.
Our UK graduate programme continues to help us attract engineering and leadership talent, with ten graduates joining in 2017, and 22 due to join us in 2018.
During the year we made significant efforts to promote our graduate opportunities to women, and we were particularly pleased that 55% of the offers and 67% of the engineering places for our 2018 graduate scheme went to female candidates. This represents another step forward from last year when 43% of our graduates were female.
FirstGroup Annual Report and Accounts 201828

Our communitiesWe are proud to serve our communities across the UK, North America and beyond. We use our expertise, passion and support to make a positive impact wherever we work, helping to meet our ambition of being the preferred partner of the communities we serve.Community engagement Community partnership and engagement remains at the heart of our business. Much of our success depends on the relationships we foster in the communities we serve. Towards this, our focus is building a culture of engagement with our stakeholders and within our five divisions across the UK and North America.
To ensure a consistent approach to stakeholders, every new employee is trained in our approach to community engagement. We also hold cross-divisional sessions to provide opportunities for our location leaders
to learn, ask questions and share best practices. We take this further with cross-divisional collaboration opportunities in key cities and regions to develop synergies and expand strategic plans to collectively deliver on our communities’ needs.
Community investmentAn important part of our approach to engaging in the communities in which we operate is the investment we make with charitable organisations who share our ambition of keeping our communities prospering. In total, FirstGroup and our employees donated £4.12m during 2017/18 as measured by the London Benchmarking Group (LBG) model on community impact. This year we supported hundreds of charitable organisations through corporate donations and gifts in kind, including the donation of advertising space and vehicle hires, event sponsorships and tickets.
Our employees take us even further into our communities, giving their time and effort to fundraise and support the causes they are passionate about. This year we continued to offer our UK employees matched funding for their fundraising efforts, matching up to £200 per person to registered charities. In addition, many of our UK employees took part in our payroll giving scheme, donating almost £100,000 to charity through their pre-tax pay in the past year alone.
UK charity partnershipIn 2017 FirstGroup employees in the UK voted for a new charity partner and from April 2018 until 2021, FirstGroup will work with Action for Children to support the mental health of the UK’s most disadvantaged children.
Action for Children helps young people across the UK through fostering or adoption, by intervening early to stop neglect and abuse, by influencing policy, and by making life better for disabled children. With more than 600 services, the charity improves the lives of 370,000 children, young people and families every year.
Our three-year partnership will have the objective of raising funding for mental health projects and enable the delivery of essential specialist support to young people who desperately need help.
Prostate Cancer UK Partnership
In 2015, FirstGroup employees voted for Prostate Cancer UK as our UK charity partner for a three-year term, with the ambition of raising £1m in fundraising, corporate donations and the commercial value of gift in kind advertising to support men with prostate cancer and those close to them. The partnership exceeded all expectations due to the commitment and generosity of everyone connected to FirstGroup – and by March 2018 had achieved a partnership value of more than £1.5m, significantly ahead of our original target.
Over the course of the partnership, employee fundraising and corporate donations have funded the production of one million ‘Know your prostate’ pocket guides and ensured more men have access to this vital health message. FirstGroup has also donated hugely valuable advertising space throughout our bus and rail networks across the UK to promote Prostate Cancer UK’s health awareness campaigns and the support available from the charity.
Find out more www.firstgroupplc.com/responsibility
Partnering with schools
TPE has been working with the Ahead Partnership, an organisation that links up businesses and educators to help employers engage, inspire and motivate young people about skills, career options and future employment. Through the ‘Make the Grade’ programme TPE is helping young people develop employability skills across the Leeds City Region and North East, as well as raising greater awareness of career opportunities and pathways into the transport industry.
Projects have included a ‘transport scheduling challenge’ which sees a technical team from TPE working with students to give an insight into how the Science, Technology, Engineering and Maths (STEM) subjects studied at school are applied in a real world scenario.
Photo credit: Ahead Partnership
FirstGroup Annual Report and Accounts 2018 29
Strategic report
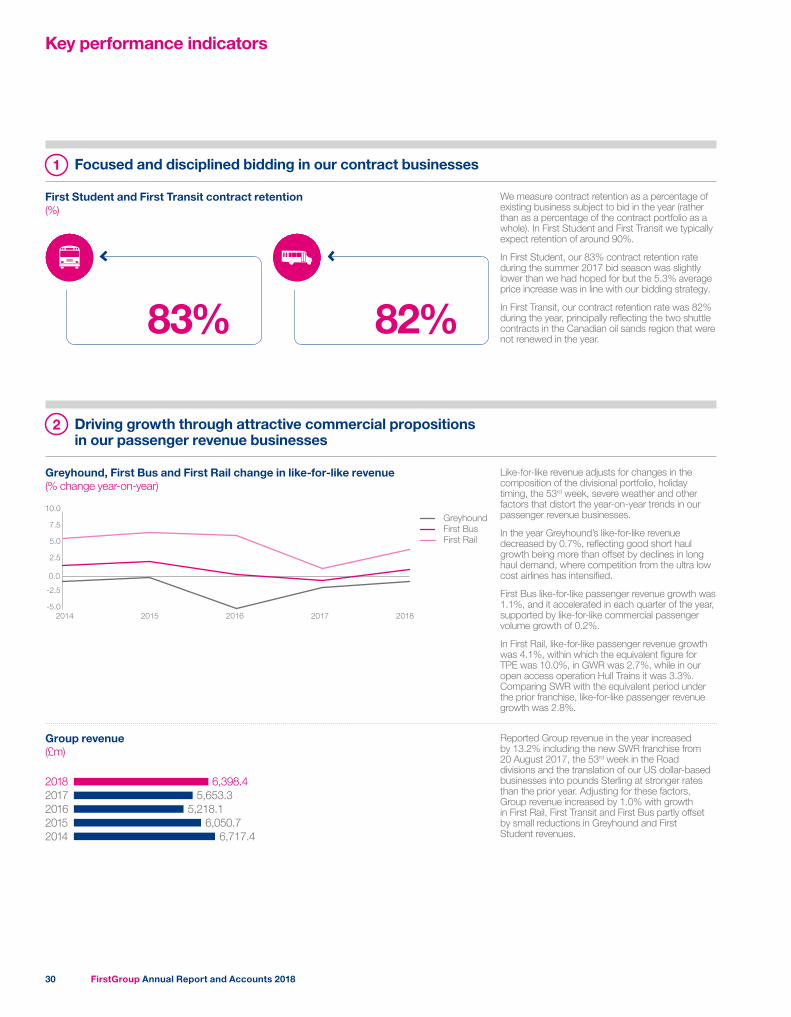
Key performance indicators
-5.0
-2.5
0.0
2.5
5.0
7.5
10.0
First BusGreyhound
First Rail
2014 2018201720162015
2018 6,398.45,653.32017
5,218.120166,050.7
6,717.420152014
1 Focused and disciplined bidding in our contract businesses
First Student and First Transit contract retention(%)
We measure contract retention as a percentage of existing business subject to bid in the year (rather than as a percentage of the contract portfolio as a whole). In First Student and First Transit we typically expect retention of around 90%.
In First Student, our 83% contract retention rate during the summer 2017 bid season was slightly lower than we had hoped for but the 5.3% average price increase was in line with our bidding strategy.
In First Transit, our contract retention rate was 82% during the year, principally reflecting the two shuttle contracts in the Canadian oil sands region that were not renewed in the year.
Reported Group revenue in the year increased by 13.2% including the new SWR franchise from 20 August 2017, the 53rd week in the Road divisions and the translation of our US dollar-based businesses into pounds Sterling at stronger rates than the prior year. Adjusting for these factors, Group revenue increased by 1.0% with growth in First Rail, First Transit and First Bus partly offset by small reductions in Greyhound and First Student revenues.
Like-for-like revenue adjusts for changes in the composition of the divisional portfolio, holiday timing, the 53rd week, severe weather and other factors that distort the year-on-year trends in our passenger revenue businesses.
In the year Greyhound’s like-for-like revenue decreased by 0.7%, reflecting good short haul growth being more than offset by declines in long haul demand, where competition from the ultra low cost airlines has intensified.
First Bus like-for-like passenger revenue growth was 1.1%, and it accelerated in each quarter of the year, supported by like-for-like commercial passenger volume growth of 0.2%.
In First Rail, like-for-like passenger revenue growth was 4.1%, within which the equivalent figure for TPE was 10.0%, in GWR was 2.7%, while in our open access operation Hull Trains it was 3.3%. Comparing SWR with the equivalent period under the prior franchise, like-for-like passenger revenue growth was 2.8%.
Greyhound, First Bus and First Rail change in like‑for‑like revenue(% change year-on-year)
2 Driving growth through attractive commercial propositions in our passenger revenue businesses
Group revenue(£m)
83% 82%
FirstGroup Annual Report and Accounts 201830
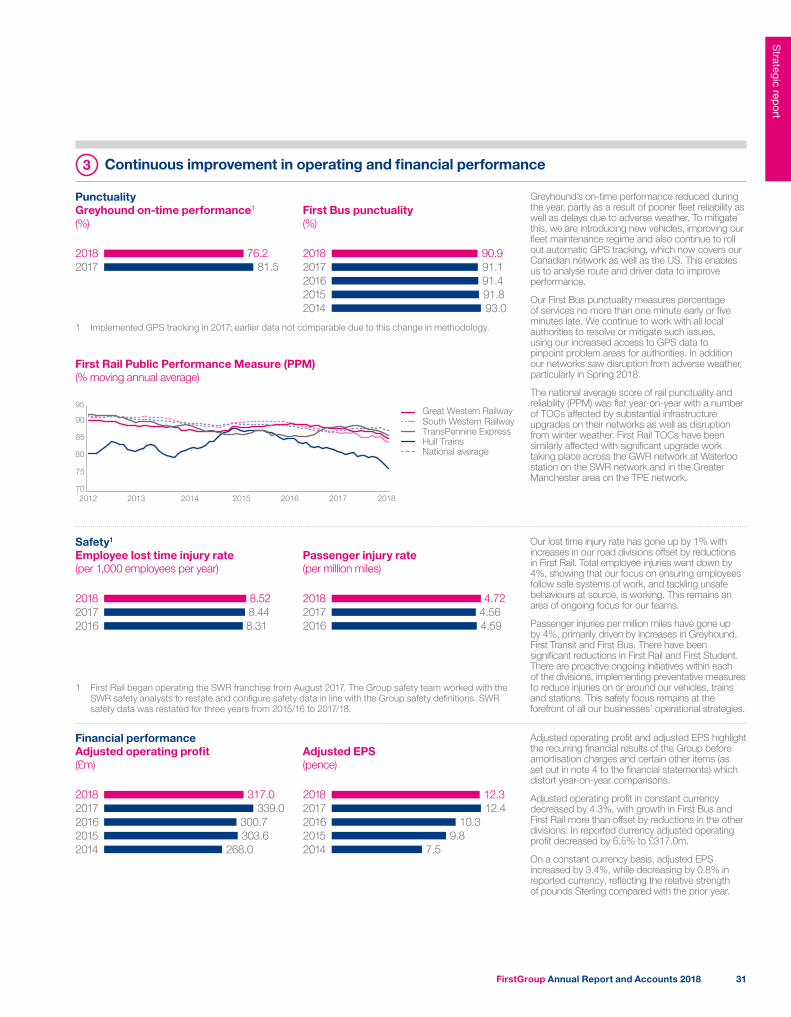
2018 76.22017 81.5
2018 8.528.4420178.312016
2018 317.0339.02017
300.72016303.6
268.020152014
2018 90.991.1201791.4201691.893.0
20152014
2018 4.724.5620174.592016
2018 12.312.42017
10.320169.8
7.520152014
70
75
80
85
90
95Great Western RailwaySouth Western Railway
2012 2013 20182017201620152014
TransPennine ExpressHull TrainsNational average
Our lost time injury rate has gone up by 1% with increases in our road divisions offset by reductions in First Rail. Total employee injuries went down by 4%, showing that our focus on ensuring employees follow safe systems of work, and tackling unsafe behaviours at source, is working. This remains an area of ongoing focus for our teams.
Passenger injuries per million miles have gone up by 4%, primarily driven by increases in Greyhound, First Transit and First Bus. There have been significant reductions in First Rail and First Student. There are proactive ongoing initiatives within each of the divisions, implementing preventative measures to reduce injuries on or around our vehicles, trains and stations. This safety focus remains at the forefront of all our businesses’ operational strategies.
Adjusted operating profit and adjusted EPS highlight the recurring financial results of the Group before amortisation charges and certain other items (as set out in note 4 to the financial statements) which distort year-on-year comparisons.
Adjusted operating profit in constant currency decreased by 4.3%, with growth in First Bus and First Rail more than offset by reductions in the other divisions. In reported currency adjusted operating profit decreased by 6.5% to £317.0m.
On a constant currency basis, adjusted EPS increased by 3.4%, while decreasing by 0.8% in reported currency, reflecting the relative strength of pounds Sterling compared with the prior year.
Greyhound’s on-time performance reduced during the year, partly as a result of poorer fleet reliability as well as delays due to adverse weather. To mitigate this, we are introducing new vehicles, improving our fleet maintenance regime and also continue to roll out automatic GPS tracking, which now covers our Canadian network as well as the US. This enables us to analyse route and driver data to improve performance.
Our First Bus punctuality measures percentage of services no more than one minute early or five minutes late. We continue to work with all local authorities to resolve or mitigate such issues, using our increased access to GPS data to pinpoint problem areas for authorities. In addition our networks saw disruption from adverse weather, particularly in Spring 2018.
The national average score of rail punctuality and reliability (PPM) was flat year-on-year with a number of TOCs affected by substantial infrastructure upgrades on their networks as well as disruption from winter weather. First Rail TOCs have been similarly affected with significant upgrade work taking place across the GWR network at Waterloo station on the SWR network and in the Greater Manchester area on the TPE network.
PunctualityGreyhound on‑time performance1
(%)First Bus punctuality(%)
3 Continuous improvement in operating and financial performance
First Rail Public Performance Measure (PPM)(% moving annual average)
1 Implemented GPS tracking in 2017; earlier data not comparable due to this change in methodology.
Safety1
Employee lost time injury rate(per 1,000 employees per year)
Passenger injury rate(per million miles)
1 First Rail began operating the SWR franchise from August 2017. The Group safety team worked with the SWR safety analysts to restate and configure safety data in line with the Group safety definitions. SWR safety data was restated for three years from 2015/16 to 2017/18.
Financial performanceAdjusted operating profit(£m)
Adjusted EPS(pence)
FirstGroup Annual Report and Accounts 2018 31
Strategic report
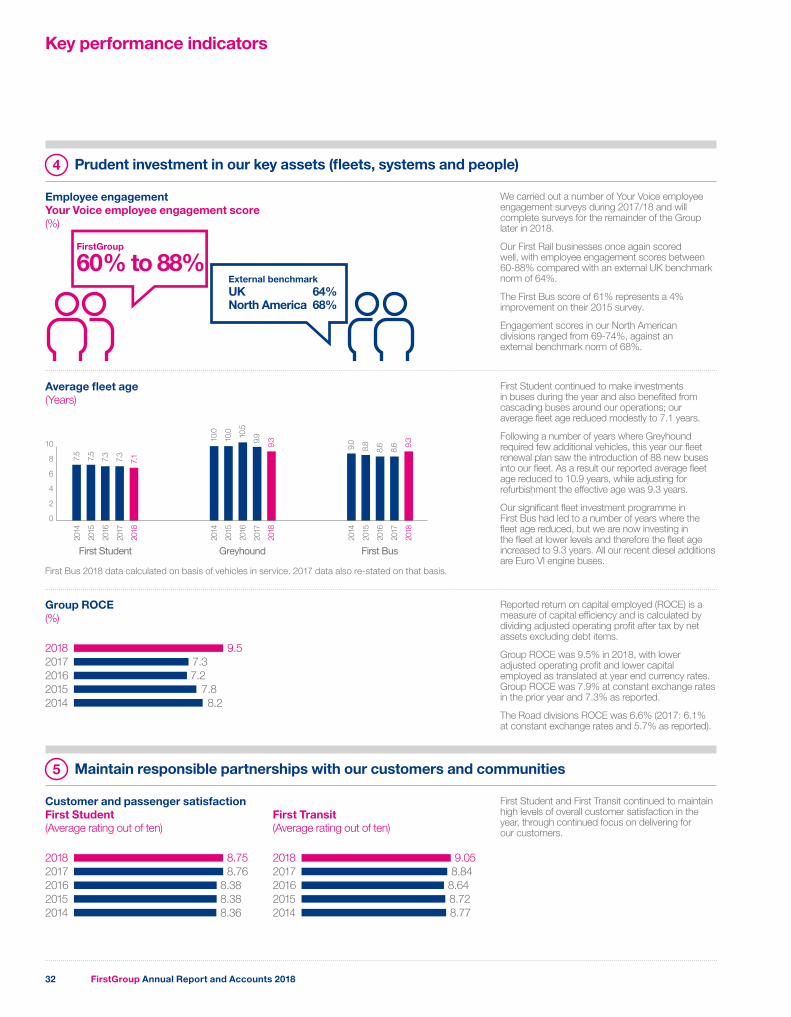
Key performance indicators
2018
2017
2016
2015
2014
0
10
8
6
4
2
First Student
2018
2017
2016
2015
2014
Greyhound
2018
2017
2016
2015
2014
First Bus
10.0
10.0
9.910
.5
9.3
9.0
8.6
8.6 9.
3
8.8
7.5
7.5
7.3
7.3
7.1
2018 9.57.320177.22016
7.88.2
20152014
2018 8.75
8.382017
8.382016
8.3620152014
8.762018 9.05
8.8420178.6420168.728.77
20152014
4 Prudent investment in our key assets (fleets, systems and people)
We carried out a number of Your Voice employee engagement surveys during 2017/18 and will complete surveys for the remainder of the Group later in 2018.
Our First Rail businesses once again scored well, with employee engagement scores between 60-88% compared with an external UK benchmark norm of 64%.
The First Bus score of 61% represents a 4% improvement on their 2015 survey.
Engagement scores in our North American divisions ranged from 69-74%, against an external benchmark norm of 68%.
First Student continued to make investments in buses during the year and also benefited from cascading buses around our operations; our average fleet age reduced modestly to 7.1 years.
Following a number of years where Greyhound required few additional vehicles, this year our fleet renewal plan saw the introduction of 88 new buses into our fleet. As a result our reported average fleet age reduced to 10.9 years, while adjusting for refurbishment the effective age was 9.3 years.
Our significant fleet investment programme in First Bus had led to a number of years where the fleet age reduced, but we are now investing in the fleet at lower levels and therefore the fleet age increased to 9.3 years. All our recent diesel additions are Euro VI engine buses.
Reported return on capital employed (ROCE) is a measure of capital efficiency and is calculated by dividing adjusted operating profit after tax by net assets excluding debt items.
Group ROCE was 9.5% in 2018, with lower adjusted operating profit and lower capital employed as translated at year end currency rates. Group ROCE was 7.9% at constant exchange rates in the prior year and 7.3% as reported.
The Road divisions ROCE was 6.6% (2017: 6.1% at constant exchange rates and 5.7% as reported).
First Student and First Transit continued to maintain high levels of overall customer satisfaction in the year, through continued focus on delivering for our customers.
Average fleet age (Years)
Employee engagementYour Voice employee engagement score (%)
Group ROCE(%)
5 Maintain responsible partnerships with our customers and communities
Customer and passenger satisfactionFirst Student(Average rating out of ten)
First Transit(Average rating out of ten)
First Bus 2018 data calculated on basis of vehicles in service. 2017 data also re-stated on that basis.
External benchmarkUK 64% North America 68%
FirstGroup
60% to 88%
FirstGroup Annual Report and Accounts 201832
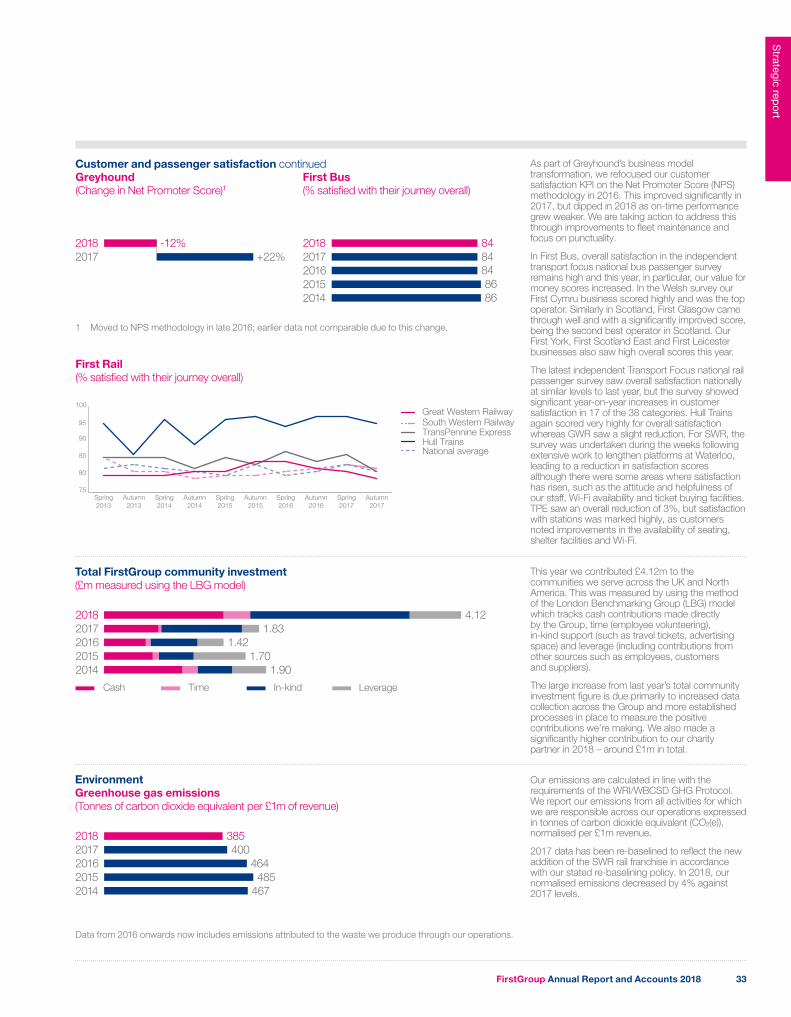
20172018 -12%
+22%
2018 3854002017
4642016485
46720152014
2018 84842017
862016
8620152014
84
75
80
85
90
95
100
Autumn2017
Spring2017
Autumn2016
Spring2016
Autumn2015
Spring2015
Autumn2014
Spring2014
Autumn2013
Spring2013
Great Western RailwaySouth Western Railway
National average
TransPennine ExpressHull Trains
Cash Time In-kind Leverage
20182017201620152014
4.121.83
1.421.70
1.90
As part of Greyhound’s business model transformation, we refocused our customer satisfaction KPI on the Net Promoter Score (NPS) methodology in 2016. This improved significantly in 2017, but dipped in 2018 as on-time performance grew weaker. We are taking action to address this through improvements to fleet maintenance and focus on punctuality.
In First Bus, overall satisfaction in the independent transport focus national bus passenger survey remains high and this year, in particular, our value for money scores increased. In the Welsh survey our First Cymru business scored highly and was the top operator. Similarly in Scotland, First Glasgow came through well and with a significantly improved score, being the second best operator in Scotland. Our First York, First Scotland East and First Leicester businesses also saw high overall scores this year.
The latest independent Transport Focus national rail passenger survey saw overall satisfaction nationally at similar levels to last year, but the survey showed significant year-on-year increases in customer satisfaction in 17 of the 38 categories. Hull Trains again scored very highly for overall satisfaction whereas GWR saw a slight reduction. For SWR, the survey was undertaken during the weeks following extensive work to lengthen platforms at Waterloo, leading to a reduction in satisfaction scores although there were some areas where satisfaction has risen, such as the attitude and helpfulness of our staff, Wi-Fi availability and ticket buying facilities. TPE saw an overall reduction of 3%, but satisfaction with stations was marked highly, as customers noted improvements in the availability of seating, shelter facilities and Wi-Fi.
This year we contributed £4.12m to the communities we serve across the UK and North America. This was measured by using the method of the London Benchmarking Group (LBG) model which tracks cash contributions made directly by the Group, time (employee volunteering), in-kind support (such as travel tickets, advertising space) and leverage (including contributions from other sources such as employees, customers and suppliers).
The large increase from last year’s total community investment figure is due primarily to increased data collection across the Group and more established processes in place to measure the positive contributions we’re making. We also made a significantly higher contribution to our charity partner in 2018 – around £1m in total.
Our emissions are calculated in line with the requirements of the WRI/WBCSD GHG Protocol. We report our emissions from all activities for which we are responsible across our operations expressed in tonnes of carbon dioxide equivalent (CO2(e)), normalised per £1m revenue.
2017 data has been re-baselined to reflect the new addition of the SWR rail franchise in accordance with our stated re-baselining policy. In 2018, our normalised emissions decreased by 4% against 2017 levels.
Customer and passenger satisfaction continuedGreyhound(Change in Net Promoter Score)1
First Bus(% satisfied with their journey overall)
First Rail(% satisfied with their journey overall)
Total FirstGroup community investment(£m measured using the LBG model)
EnvironmentGreenhouse gas emissions(Tonnes of carbon dioxide equivalent per £1m of revenue)
Data from 2016 onwards now includes emissions attributed to the waste we produce through our operations.
1 Moved to NPS methodology in late 2016; earlier data not comparable due to this change.
FirstGroup Annual Report and Accounts 2018 33
Strategic report
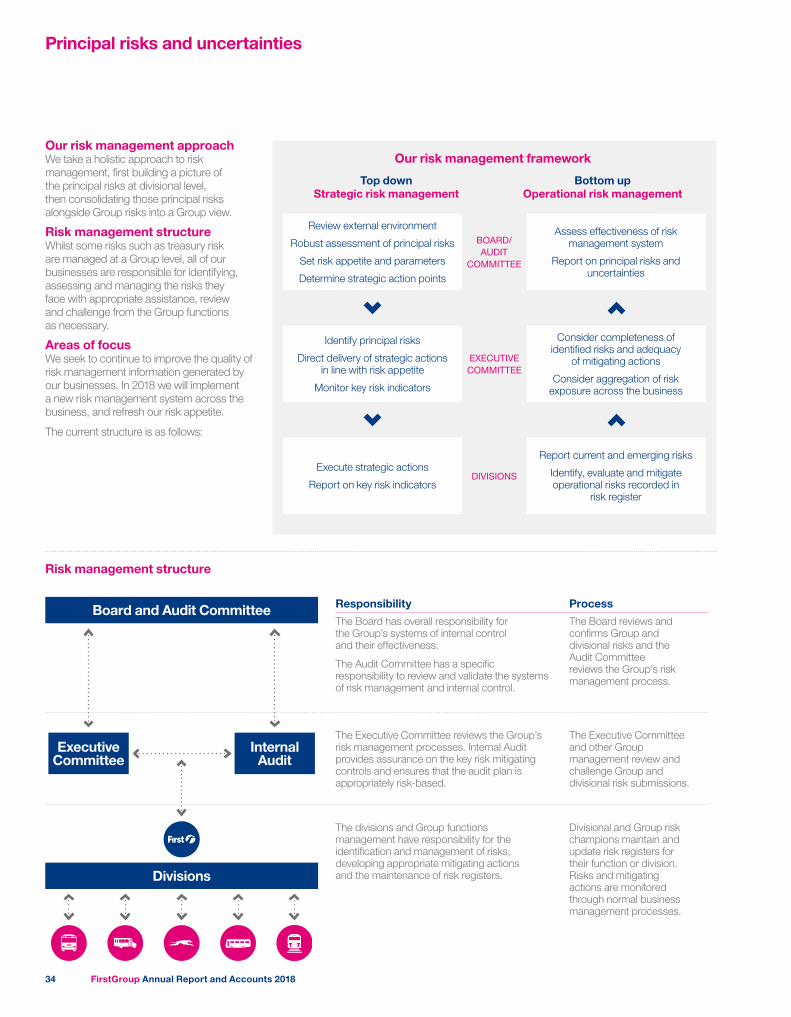
Principal risks and uncertainties
Our risk management approachWe take a holistic approach to risk management, first building a picture of the principal risks at divisional level, then consolidating those principal risks alongside Group risks into a Group view.
Risk management structureWhilst some risks such as treasury risk are managed at a Group level, all of our businesses are responsible for identifying, assessing and managing the risks they face with appropriate assistance, review and challenge from the Group functions as necessary.
Areas of focusWe seek to continue to improve the quality of risk management information generated by our businesses. In 2018 we will implement a new risk management system across the business, and refresh our risk appetite.
The current structure is as follows:
Risk management structure
Our risk management framework
Top downStrategic risk management
Bottom upOperational risk management
Consider completeness of identified risks and adequacy
of mitigating actions
Consider aggregation of risk exposure across the business
Assess effectiveness of risk management system
Report on principal risks and uncertainties
BOARD/ AUDIT
COMMITTEE
EXECUTIVE COMMITTEE
DIVISIONS
Review external environment
Robust assessment of principal risks
Set risk appetite and parameters
Determine strategic action points
Identify principal risks
Direct delivery of strategic actions in line with risk appetite
Monitor key risk indicators
Execute strategic actions
Report on key risk indicators
Report current and emerging risks
Identify, evaluate and mitigate operational risks recorded in
risk register
Responsibility Process
The Board has overall responsibility for the Group’s systems of internal control and their effectiveness.
The Audit Committee has a specific responsibility to review and validate the systems of risk management and internal control.
The Board reviews and confirms Group and divisional risks and the Audit Committee reviews the Group’s risk management process.
The Executive Committee reviews the Group’s risk management processes. Internal Audit provides assurance on the key risk mitigating controls and ensures that the audit plan is appropriately risk-based.
The Executive Committee and other Group management review and challenge Group and divisional risk submissions.
The divisions and Group functions management have responsibility for the identification and management of risks, developing appropriate mitigating actions and the maintenance of risk registers.
Divisional and Group risk champions maintain and update risk registers for their function or division. Risks and mitigating actions are monitored through normal business management processes.
Board and Audit Committee
Divisions
Executive Committee
Internal Audit
FirstGroup Annual Report and Accounts 201834
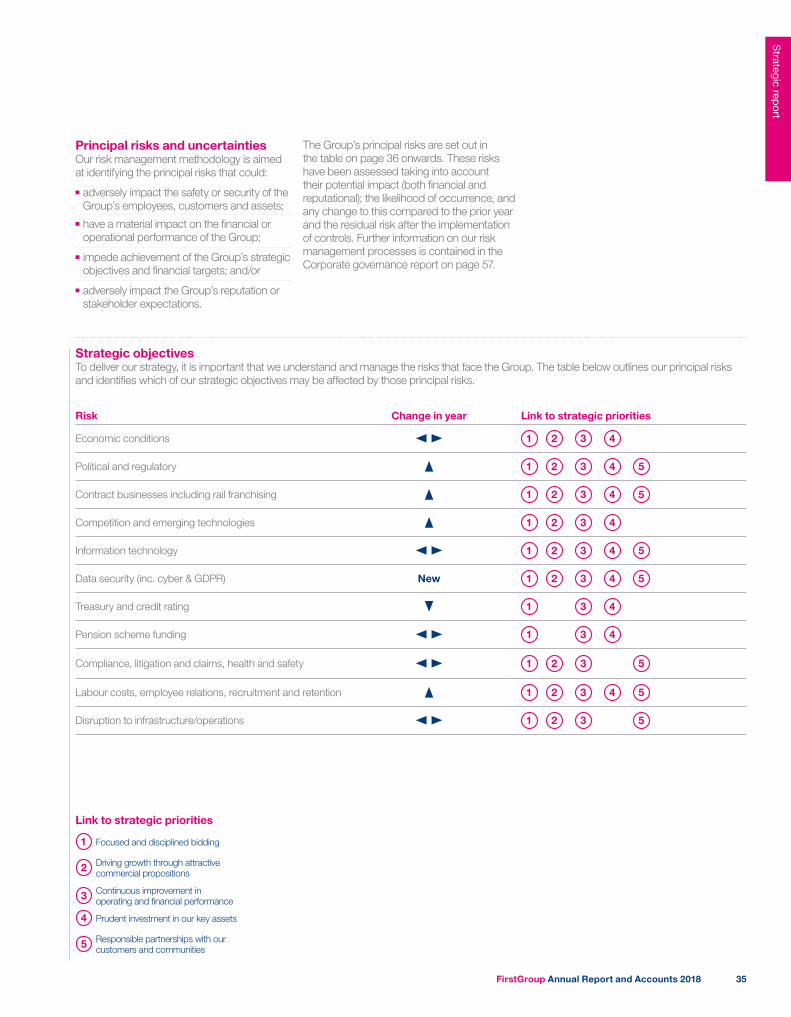
Principal risks and uncertaintiesOur risk management methodology is aimed at identifying the principal risks that could:
■■ adversely impact the safety or security of the Group’s employees, customers and assets;
■■ have a material impact on the financial or operational performance of the Group;
■■ impede achievement of the Group’s strategic objectives and financial targets; and/or
■■ adversely impact the Group’s reputation or stakeholder expectations.
Strategic objectivesTo deliver our strategy, it is important that we understand and manage the risks that face the Group. The table below outlines our principal risks and identifies which of our strategic objectives may be affected by those principal risks.
Link to strategic priorities
1 Focused and disciplined bidding
2 Driving growth through attractive commercial propositions
3 Continuous improvement in operating and financial performance
4 Prudent investment in our key assets
5 Responsible partnerships with our customers and communities
The Group’s principal risks are set out in the table on page 36 onwards. These risks have been assessed taking into account their potential impact (both financial and reputational); the likelihood of occurrence, and any change to this compared to the prior year and the residual risk after the implementation of controls. Further information on our risk management processes is contained in the Corporate governance report on page 57.
Risk Change in year Link to strategic priorities
Economic conditions 1 2 3 4
Political and regulatory 1 4 532
Contract businesses including rail franchising 1 5432
Competition and emerging technologies 1 432
Information technology 1 5432
Data security (inc. cyber & GDPR) New 1 5432
Treasury and credit rating 1 43
Pension scheme funding 1 43
Compliance, litigation and claims, health and safety 1 532
Labour costs, employee relations, recruitment and retention 1 5432
Disruption to infrastructure/operations 1 532
FirstGroup Annual Report and Accounts 2018 35
Strategic report
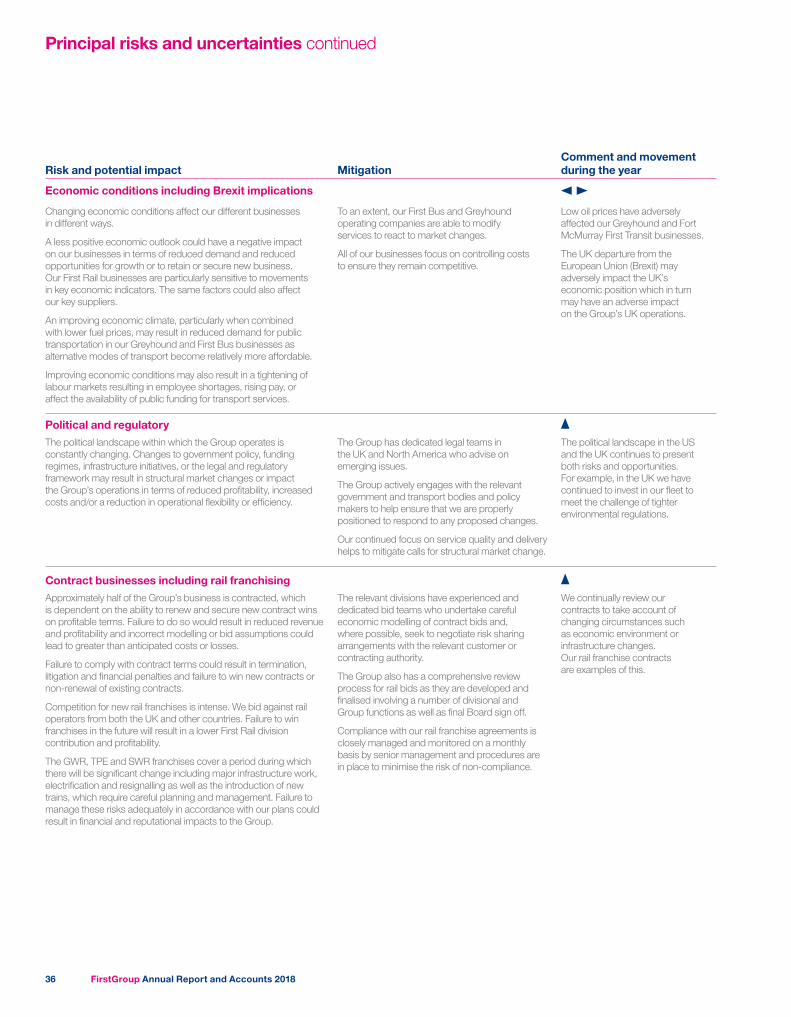
Principal risks and uncertainties continued
Risk and potential impact MitigationComment and movement during the year
Economic conditions including Brexit implications
Changing economic conditions affect our different businesses in different ways.
A less positive economic outlook could have a negative impact on our businesses in terms of reduced demand and reduced opportunities for growth or to retain or secure new business. Our First Rail businesses are particularly sensitive to movements in key economic indicators. The same factors could also affect our key suppliers.
An improving economic climate, particularly when combined with lower fuel prices, may result in reduced demand for public transportation in our Greyhound and First Bus businesses as alternative modes of transport become relatively more affordable.
Improving economic conditions may also result in a tightening of labour markets resulting in employee shortages, rising pay, or affect the availability of public funding for transport services.
To an extent, our First Bus and Greyhound operating companies are able to modify services to react to market changes.
All of our businesses focus on controlling costs to ensure they remain competitive.
Low oil prices have adversely affected our Greyhound and Fort McMurray First Transit businesses.
The UK departure from the European Union (Brexit) may adversely impact the UK’s economic position which in turn may have an adverse impact on the Group’s UK operations.
Political and regulatoryThe political landscape within which the Group operates is constantly changing. Changes to government policy, funding regimes, infrastructure initiatives, or the legal and regulatory framework may result in structural market changes or impact the Group’s operations in terms of reduced profitability, increased costs and/or a reduction in operational flexibility or efficiency.
The Group has dedicated legal teams in the UK and North America who advise on emerging issues.
The Group actively engages with the relevant government and transport bodies and policy makers to help ensure that we are properly positioned to respond to any proposed changes.
Our continued focus on service quality and delivery helps to mitigate calls for structural market change.
The political landscape in the US and the UK continues to present both risks and opportunities. For example, in the UK we have continued to invest in our fleet to meet the challenge of tighter environmental regulations.
Contract businesses including rail franchisingApproximately half of the Group’s business is contracted, which is dependent on the ability to renew and secure new contract wins on profitable terms. Failure to do so would result in reduced revenue and profitability and incorrect modelling or bid assumptions could lead to greater than anticipated costs or losses.
Failure to comply with contract terms could result in termination, litigation and financial penalties and failure to win new contracts or non-renewal of existing contracts.
Competition for new rail franchises is intense. We bid against rail operators from both the UK and other countries. Failure to win franchises in the future will result in a lower First Rail division contribution and profitability.
The GWR, TPE and SWR franchises cover a period during which there will be significant change including major infrastructure work, electrification and resignalling as well as the introduction of new trains, which require careful planning and management. Failure to manage these risks adequately in accordance with our plans could result in financial and reputational impacts to the Group.
The relevant divisions have experienced and dedicated bid teams who undertake careful economic modelling of contract bids and, where possible, seek to negotiate risk sharing arrangements with the relevant customer or contracting authority.
The Group also has a comprehensive review process for rail bids as they are developed and finalised involving a number of divisional and Group functions as well as final Board sign off.
Compliance with our rail franchise agreements is closely managed and monitored on a monthly basis by senior management and procedures are in place to minimise the risk of non-compliance.
We continually review our contracts to take account of changing circumstances such as economic environment or infrastructure changes. Our rail franchise contracts are examples of this.
FirstGroup Annual Report and Accounts 201836
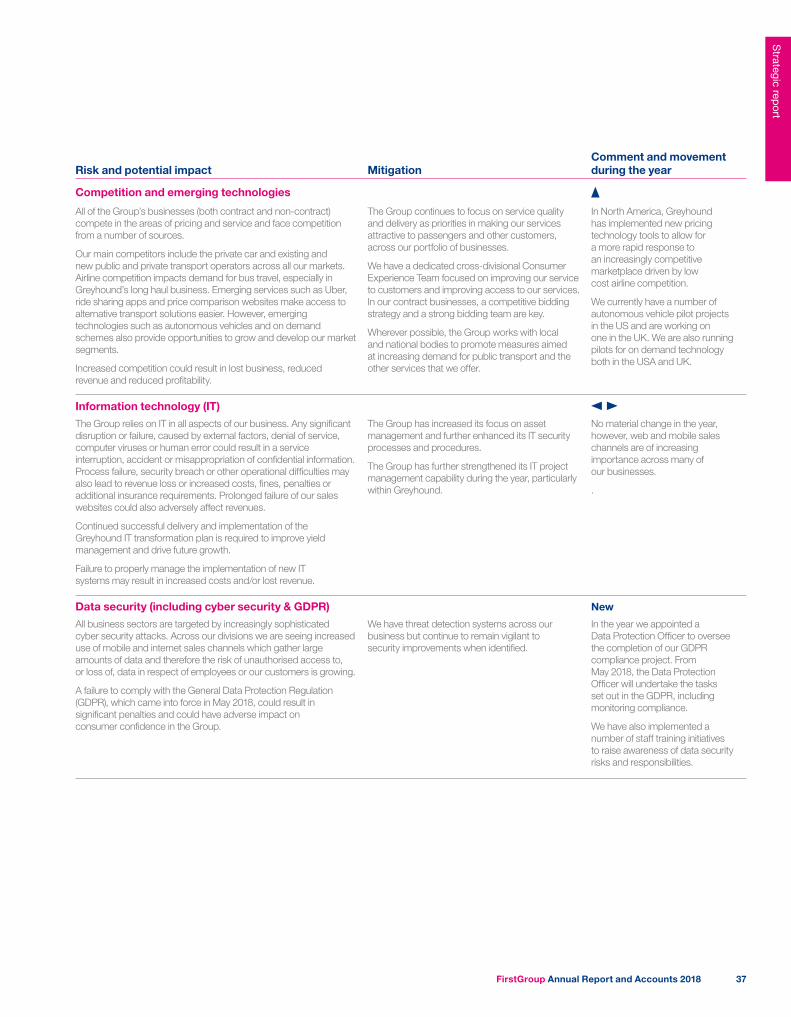
Risk and potential impact MitigationComment and movement during the year
Competition and emerging technologies
All of the Group’s businesses (both contract and non-contract) compete in the areas of pricing and service and face competition from a number of sources.
Our main competitors include the private car and existing and new public and private transport operators across all our markets. Airline competition impacts demand for bus travel, especially in Greyhound’s long haul business. Emerging services such as Uber, ride sharing apps and price comparison websites make access to alternative transport solutions easier. However, emerging technologies such as autonomous vehicles and on demand schemes also provide opportunities to grow and develop our market segments.
Increased competition could result in lost business, reduced revenue and reduced profitability.
The Group continues to focus on service quality and delivery as priorities in making our services attractive to passengers and other customers, across our portfolio of businesses.
We have a dedicated cross-divisional Consumer Experience Team focused on improving our service to customers and improving access to our services. In our contract businesses, a competitive bidding strategy and a strong bidding team are key.
Wherever possible, the Group works with local and national bodies to promote measures aimed at increasing demand for public transport and the other services that we offer.
In North America, Greyhound has implemented new pricing technology tools to allow for a more rapid response to an increasingly competitive marketplace driven by low cost airline competition.
We currently have a number of autonomous vehicle pilot projects in the US and are working on one in the UK. We are also running pilots for on demand technology both in the USA and UK.
Information technology (IT)The Group relies on IT in all aspects of our business. Any significant disruption or failure, caused by external factors, denial of service, computer viruses or human error could result in a service interruption, accident or misappropriation of confidential information. Process failure, security breach or other operational difficulties may also lead to revenue loss or increased costs, fines, penalties or additional insurance requirements. Prolonged failure of our sales websites could also adversely affect revenues.
Continued successful delivery and implementation of the Greyhound IT transformation plan is required to improve yield management and drive future growth.
Failure to properly manage the implementation of new IT systems may result in increased costs and/or lost revenue.
The Group has increased its focus on asset management and further enhanced its IT security processes and procedures.
The Group has further strengthened its IT project management capability during the year, particularly within Greyhound.
No material change in the year, however, web and mobile sales channels are of increasing importance across many of our businesses.
.
Data security (including cyber security & GDPR) New
All business sectors are targeted by increasingly sophisticated cyber security attacks. Across our divisions we are seeing increased use of mobile and internet sales channels which gather large amounts of data and therefore the risk of unauthorised access to, or loss of, data in respect of employees or our customers is growing.
A failure to comply with the General Data Protection Regulation (GDPR), which came into force in May 2018, could result in significant penalties and could have adverse impact on consumer confidence in the Group.
We have threat detection systems across our business but continue to remain vigilant to security improvements when identified.
In the year we appointed a Data Protection Officer to oversee the completion of our GDPR compliance project. From May 2018, the Data Protection Officer will undertake the tasks set out in the GDPR, including monitoring compliance.
We have also implemented a number of staff training initiatives to raise awareness of data security risks and responsibilities.
FirstGroup Annual Report and Accounts 2018 37
Strategic report
Principal risks and uncertainties continued
Risk and potential impact MitigationComment and movement during the year
Treasury and credit rating
As set out in further detail in note 24 to the financial statements on pages 130 to 134, treasury risks include liquidity risks, risks arising from changes to foreign exchange and interest rates and fuel price risk.
Foreign currency and interest rate movements may impact the profits, balance sheet and cash flows of the Group.
Ineffective hedging arrangements may not fully mitigate losses or may increase them.
The Group is credit rated by Standard & Poor’s and Fitch. A downgrade in the Group’s credit ratings to below investment grade may lead to increased financing costs and other consequences and affect the Group’s ability to invest in its operations.
The Group’s Treasury Committee manages treasury policy, and delegated authorities are reviewed periodically to ensure compliance with best practice and to control and monitor these risks appropriately.
The Group is continuously focused on improving operating and financial performance as part of our strategic objectives as outlined on page 11.
The continued reduction in the Group’s leverage from 1.9 times net debt: EBITDA to 1.5 times at the end of the financial year as a result of strong cash generation and the bond refinancing has further reduced refinancing risk.
Pension scheme fundingThe Group sponsors or participates in a number of significant defined benefit pension schemes, primarily in the UK.
Future cash contribution requirements may increase or decrease based upon financial markets, notably investment returns and valuations, the rates used to value the liabilities and through changes to life expectancy, and could result in material changes in the accounting cost and cash contributions required.
Diversification of investments, hedging of liabilities, amendment of the defined benefit promises and the introduction of defined contribution benefits for new starters in First Bus, FirstGroup corporate functions and our Canadian businesses have reduced these risks.
The Group also seeks to remove liabilities from the balance sheet where it can be achieved cost effectively.
Under the First Rail franchise arrangements, the Group’s train operating companies are not responsible for any residual deficit at the end of a franchise so there is only short term cash flow risk within any particular franchise.
The Group has closed the UK Group and First Bus Pension Schemes to future accrual from April 2018. and consolidated other First Bus legacy schemes. This will further reduce the size and volatility of the pension funding risk over the longer term.
During the year, The Pensions Regulator (‘TPR’) has been in discussion with the Railways Pension Scheme (the ‘Scheme’) regarding the funding assumptions which could result in changes to contributions. The Scheme is the industry-wide pension scheme. The outcome of the review, which could impact all rail operators, is not yet known. The Rail Delivery Group is engaging with rail operators to understand and assess TPR’s concerns and to develop an industry-wide solution.
Compliance, litigation and claims, health and safetyThe Group’s operations are subject to a wide range of legislation and regulation. Failure to comply can lead to litigation, claims, damages, fines and penalties.
The Group has three main insurable risks: third party injury and other claims arising from vehicle and general operations, employee injuries and property damage.
The Group is also subject to other litigation, which is not insured, particularly in North America, including contractual claims and those relating to employee wage and hour, and meal and break, matters.
A higher volume of litigation and claims can lead to increased costs, reduced availability of insurance cover, and/or reputational impact.
Increased frequency of accidents, clusters of higher severity losses, a large single claim, or a large number of smaller claims may negatively affect profitability and cash flow.
Compliance with Group and divisional policies and procedures.
The Group has a very strong focus on safety and it is one of our five values. The Group self-insures third party and employee injury claims up to a certain level commensurate with the historical risk profile. We purchase insurance above these limits from reputable global insurance firms. Claims are managed by experienced claims handlers.
Non-insured claims are managed by the Group’s dedicated in-house legal teams with external assistance as appropriate.
The legal climate in North America, particularly in the US, continues to deliver judgements which are disproportionately in favour of plaintiffs, and at times unpredictable. The costs of dealing with this challenging legal environment is factored in the budgets. Due to the scale and scope of our operations, risk mitigation in this area continues to be an area of focus for the Group.
FirstGroup Annual Report and Accounts 201838
Risk and potential impact MitigationComment and movement during the year
Labour costs, employee relations, recruitment and retentionEmployee costs represent the largest component of the Group’s operating costs, and new regulation or pressure to increase wages could increase these costs. Competition for employees, particularly in an improved economic climate, can lead to shortages which increase costs and affect service delivery.
High employee turnover could lead to higher than expected increases in the cost of recruitment, training and labour costs and operational disruption.
Similarly, industrial action could adversely impact customer service and have a financial impact on the Group’s operations.
The Group seeks to mitigate these risks via its recruitment and retention policies, training schemes and working practices.
Our working practices include building communication and engagement with trade unions and the wider workforce. Examples of this engagement include regular employee communication, satisfaction surveys, and the presence of Employee Directors (who are voted for by the employees to represent them) on many of the Group’s UK operating company boards and the FirstGroup plc Board.
Where increased wages and incentives are necessary to attract and retain employees, those extra costs are factored into our bid models, where possible, to ensure appropriate returns are achieved.
Strong economic conditions, particularly in North America, continue to impact retention and recruitment.
During the year, we have refreshed our recruitment approach and offer in First Student and First Transit to reflect local market conditions.
Disruption to infrastructure/operationsOur operations, and the infrastructure on which they depend, can be affected by a number of different external factors, many of which are not within our control. These factors include terrorism, adverse weather events and, potentially, climate change or pandemics.
The threat from terrorism is enduring and continues to exist in all of our markets. Public transport continues to be regarded as an attractive and viable target, and has previously been subject to attack. Across our businesses, we take all reasonable steps to help guard against such activity on the services we operate. An attack, or threat of attack, could lead to reduced public confidence in public transportation, and/or specifically in the Group’s security and safety record and could reduce demand for our services, increase costs or security requirements and cause operational disruption.
Greater and more frequent adverse weather could lead to interruptions or disruption to service performance and reduced customer demand with consequent financial impact, potential increased costs and accident rates.
As a leading transport provider, we face the challenge of addressing climate change, both through managing its impact and reducing emissions.
We continue to develop and apply good practice, and provide guidance to our employees to help them identify and respond effectively to any potential threat or incident.
We maintain close working relationships with specialist government agencies, in relation to terror threats, in both the UK and North America.
We employ dedicated security specialists in the UK and North America.
The geographic spread of the Group’s businesses offers some protection against specific incidents. In addition, some of our contract-based businesses have force majeure clauses in place.
We have severe weather action plans and procedures to manage the impact on our operations.
The Group continues to target reductions in our emissions, including through behaviour change initiatives and investment in new technology.
No material change during the year, although severe weather has led to service disruption in both our North American and UK operations.
The risks listed are not all of those highlighted by our risk management processes and are not set out in any order of priority. Additional risks and uncertainties not presently known to us, or currently deemed to be less material, may also impact our business. Indication of a movement in a risk may not indicate a change in the overall net risk position after taking into account risk mitigations.
FirstGroup Annual Report and Accounts 2018 39
Strategic report
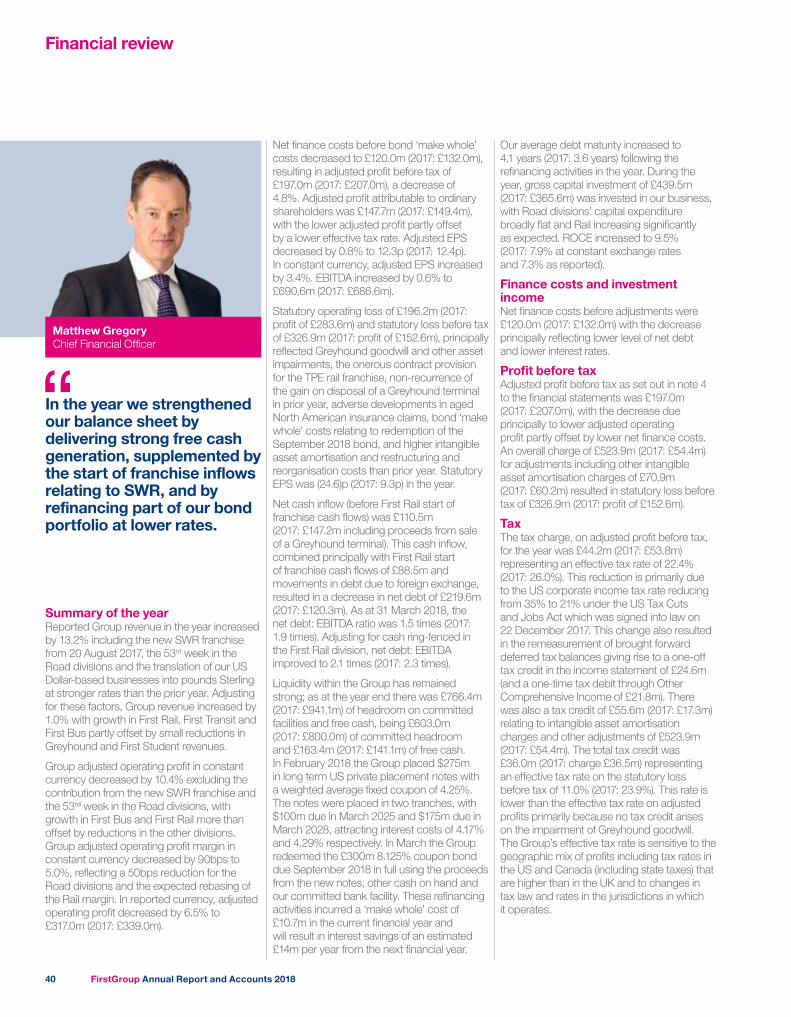
Financial review
Summary of the yearReported Group revenue in the year increased by 13.2% including the new SWR franchise from 20 August 2017, the 53rd week in the Road divisions and the translation of our US Dollar-based businesses into pounds Sterling at stronger rates than the prior year. Adjusting for these factors, Group revenue increased by 1.0% with growth in First Rail, First Transit and First Bus partly offset by small reductions in Greyhound and First Student revenues.
Group adjusted operating profit in constant currency decreased by 10.4% excluding the contribution from the new SWR franchise and the 53rd week in the Road divisions, with growth in First Bus and First Rail more than offset by reductions in the other divisions. Group adjusted operating profit margin in constant currency decreased by 90bps to 5.0%, reflecting a 50bps reduction for the Road divisions and the expected rebasing of the Rail margin. In reported currency, adjusted operating profit decreased by 6.5% to £317.0m (2017: £339.0m).
Our average debt maturity increased to 4.1 years (2017: 3.6 years) following the refinancing activities in the year. During the year, gross capital investment of £439.5m (2017: £365.6m) was invested in our business, with Road divisions’ capital expenditure broadly flat and Rail increasing significantly as expected. ROCE increased to 9.5% (2017: 7.9% at constant exchange rates and 7.3% as reported).
Finance costs and investment income Net finance costs before adjustments were £120.0m (2017: £132.0m) with the decrease principally reflecting lower level of net debt and lower interest rates.
Profit before tax Adjusted profit before tax as set out in note 4 to the financial statements was £197.0m (2017: £207.0m), with the decrease due principally to lower adjusted operating profit partly offset by lower net finance costs. An overall charge of £523.9m (2017: £54.4m) for adjustments including other intangible asset amortisation charges of £70.9m (2017: £60.2m) resulted in statutory loss before tax of £326.9m (2017: profit of £152.6m).
Tax The tax charge, on adjusted profit before tax, for the year was £44.2m (2017: £53.8m) representing an effective tax rate of 22.4% (2017: 26.0%). This reduction is primarily due to the US corporate income tax rate reducing from 35% to 21% under the US Tax Cuts and Jobs Act which was signed into law on 22 December 2017. This change also resulted in the remeasurement of brought forward deferred tax balances giving rise to a one-off tax credit in the income statement of £24.6m (and a one-time tax debit through Other Comprehensive Income of £21.8m). There was also a tax credit of £55.6m (2017: £17.3m) relating to intangible asset amortisation charges and other adjustments of £523.9m (2017: £54.4m). The total tax credit was £36.0m (2017: charge £36.5m) representing an effective tax rate on the statutory loss before tax of 11.0% (2017: 23.9%). This rate is lower than the effective tax rate on adjusted profits primarily because no tax credit arises on the impairment of Greyhound goodwill. The Group’s effective tax rate is sensitive to the geographic mix of profits including tax rates in the US and Canada (including state taxes) that are higher than in the UK and to changes in tax law and rates in the jurisdictions in which it operates.
Matthew GregoryChief Financial Officer
Net finance costs before bond ‘make whole’ costs decreased to £120.0m (2017: £132.0m), resulting in adjusted profit before tax of £197.0m (2017: £207.0m), a decrease of 4.8%. Adjusted profit attributable to ordinary shareholders was £147.7m (2017: £149.4m), with the lower adjusted profit partly offset by a lower effective tax rate. Adjusted EPS decreased by 0.8% to 12.3p (2017: 12.4p). In constant currency, adjusted EPS increased by 3.4%. EBITDA increased by 0.6% to £690.6m (2017: £686.6m).
Statutory operating loss of £196.2m (2017: profit of £283.6m) and statutory loss before tax of £326.9m (2017: profit of £152.6m), principally reflected Greyhound goodwill and other asset impairments, the onerous contract provision for the TPE rail franchise, non-recurrence of the gain on disposal of a Greyhound terminal in prior year, adverse developments in aged North American insurance claims, bond ‘make whole’ costs relating to redemption of the September 2018 bond, and higher intangible asset amortisation and restructuring and reorganisation costs than prior year. Statutory EPS was (24.6)p (2017: 9.3p) in the year.
Net cash inflow (before First Rail start of franchise cash flows) was £110.5m (2017: £147.2m including proceeds from sale of a Greyhound terminal). This cash inflow, combined principally with First Rail start of franchise cash flows of £88.5m and movements in debt due to foreign exchange, resulted in a decrease in net debt of £219.6m (2017: £120.3m). As at 31 March 2018, the net debt: EBITDA ratio was 1.5 times (2017: 1.9 times). Adjusting for cash ring-fenced in the First Rail division, net debt: EBITDA improved to 2.1 times (2017: 2.3 times).
Liquidity within the Group has remained strong; as at the year end there was £766.4m (2017: £941.1m) of headroom on committed facilities and free cash, being £603.0m (2017: £800.0m) of committed headroom and £163.4m (2017: £141.1m) of free cash. In February 2018 the Group placed $275m in long term US private placement notes with a weighted average fixed coupon of 4.25%. The notes were placed in two tranches, with $100m due in March 2025 and $175m due in March 2028, attracting interest costs of 4.17% and 4.29% respectively. In March the Group redeemed the £300m 8.125% coupon bond due September 2018 in full using the proceeds from the new notes, other cash on hand and our committed bank facility. These refinancing activities incurred a ‘make whole’ cost of £10.7m in the current financial year and will result in interest savings of an estimated £14m per year from the next financial year.
In the year we strengthened our balance sheet by delivering strong free cash generation, supplemented by the start of franchise inflows relating to SWR, and by refinancing part of our bond portfolio at lower rates.
FirstGroup Annual Report and Accounts 201840
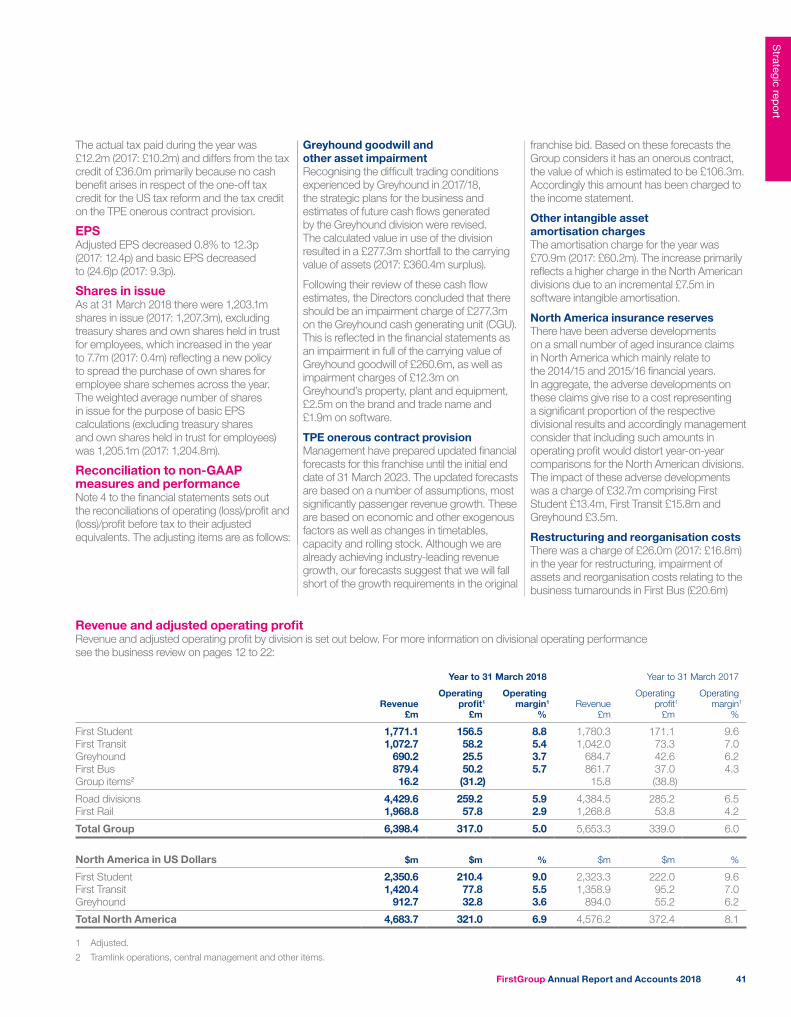
The actual tax paid during the year was £12.2m (2017: £10.2m) and differs from the tax credit of £36.0m primarily because no cash benefit arises in respect of the one-off tax credit for the US tax reform and the tax credit on the TPE onerous contract provision.
EPS Adjusted EPS decreased 0.8% to 12.3p (2017: 12.4p) and basic EPS decreased to (24.6)p (2017: 9.3p).
Shares in issue As at 31 March 2018 there were 1,203.1m shares in issue (2017: 1,207.3m), excluding treasury shares and own shares held in trust for employees, which increased in the year to 7.7m (2017: 0.4m) reflecting a new policy to spread the purchase of own shares for employee share schemes across the year. The weighted average number of shares in issue for the purpose of basic EPS calculations (excluding treasury shares and own shares held in trust for employees) was 1,205.1m (2017: 1,204.8m).
Reconciliation to non-GAAP measures and performance Note 4 to the financial statements sets out the reconciliations of operating (loss)/profit and (loss)/profit before tax to their adjusted equivalents. The adjusting items are as follows:
Greyhound goodwill and other asset impairmentRecognising the difficult trading conditions experienced by Greyhound in 2017/18, the strategic plans for the business and estimates of future cash flows generated by the Greyhound division were revised. The calculated value in use of the division resulted in a £277.3m shortfall to the carrying value of assets (2017: £360.4m surplus).
Following their review of these cash flow estimates, the Directors concluded that there should be an impairment charge of £277.3m on the Greyhound cash generating unit (CGU). This is reflected in the financial statements as an impairment in full of the carrying value of Greyhound goodwill of £260.6m, as well as impairment charges of £12.3m on Greyhound’s property, plant and equipment, £2.5m on the brand and trade name and £1.9m on software.
TPE onerous contract provisionManagement have prepared updated financial forecasts for this franchise until the initial end date of 31 March 2023. The updated forecasts are based on a number of assumptions, most significantly passenger revenue growth. These are based on economic and other exogenous factors as well as changes in timetables, capacity and rolling stock. Although we are already achieving industry-leading revenue growth, our forecasts suggest that we will fall short of the growth requirements in the original
franchise bid. Based on these forecasts the Group considers it has an onerous contract, the value of which is estimated to be £106.3m. Accordingly this amount has been charged to the income statement.
Other intangible asset amortisation chargesThe amortisation charge for the year was £70.9m (2017: £60.2m). The increase primarily reflects a higher charge in the North American divisions due to an incremental £7.5m in software intangible amortisation.
North America insurance reservesThere have been adverse developments on a small number of aged insurance claims in North America which mainly relate to the 2014/15 and 2015/16 financial years. In aggregate, the adverse developments on these claims give rise to a cost representing a significant proportion of the respective divisional results and accordingly management consider that including such amounts in operating profit would distort year-on-year comparisons for the North American divisions. The impact of these adverse developments was a charge of £32.7m comprising First Student £13.4m, First Transit £15.8m and Greyhound £3.5m.
Restructuring and reorganisation costsThere was a charge of £26.0m (2017: £16.8m) in the year for restructuring, impairment of assets and reorganisation costs relating to the business turnarounds in First Bus (£20.6m)
Revenue and adjusted operating profitRevenue and adjusted operating profit by division is set out below. For more information on divisional operating performance see the business review on pages 12 to 22:
Year to 31 March 2018 Year to 31 March 2017
Revenue £m
Operating profit1
£m
Operating margin1
% Revenue
£m
Operating profit1
£m
Operating margin1
%
First Student 1,771.1 156.5 8.8 1,780.3 171.1 9.6First Transit 1,072.7 58.2 5.4 1,042.0 73.3 7.0Greyhound 690.2 25.5 3.7 684.7 42.6 6.2First Bus 879.4 50.2 5.7 861.7 37.0 4.3Group items2 16.2 (31.2) 15.8 (38.8)
Road divisions 4,429.6 259.2 5.9 4,384.5 285.2 6.5First Rail 1,968.8 57.8 2.9 1,268.8 53.8 4.2
Total Group 6,398.4 317.0 5.0 5,653.3 339.0 6.0
North America in US Dollars $m $m % $m $m %
First Student 2,350.6 210.4 9.0 2,323.3 222.0 9.6First Transit 1,420.4 77.8 5.5 1,358.9 95.2 7.0Greyhound 912.7 32.8 3.6 894.0 55.2 6.2
Total North America 4,683.7 321.0 6.9 4,576.2 372.4 8.1
1 Adjusted.
2 Tramlink operations, central management and other items.
FirstGroup Annual Report and Accounts 2018 41
Strategic report
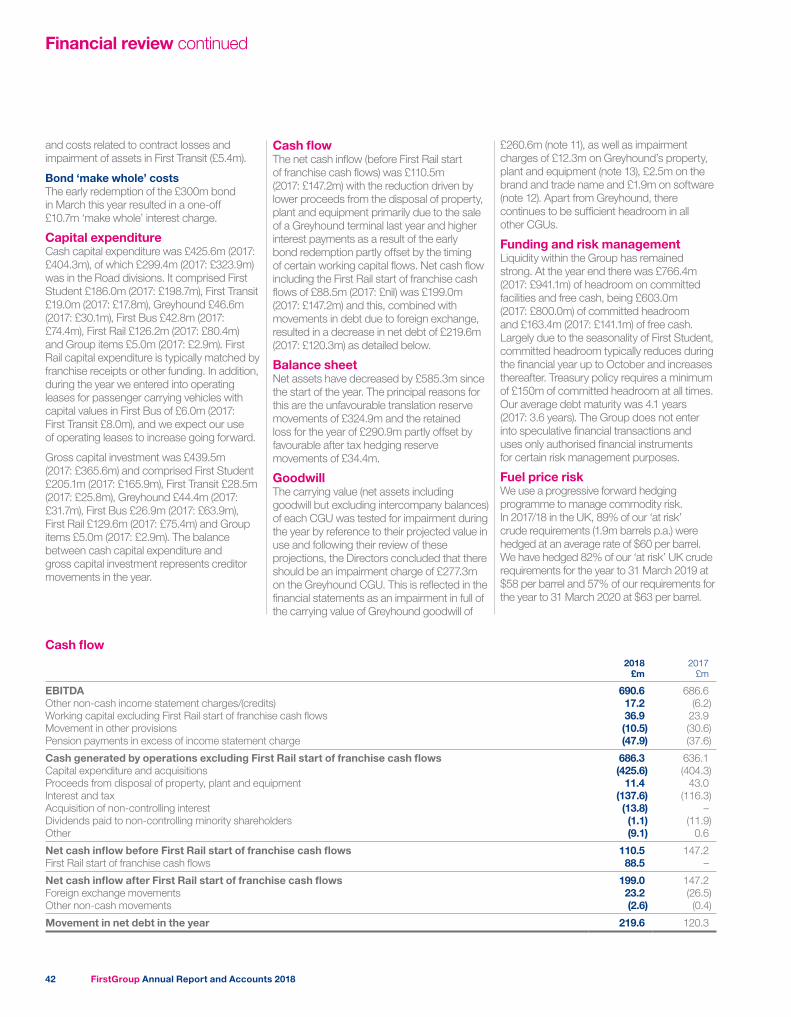
Financial review continued
Cash flow The net cash inflow (before First Rail start of franchise cash flows) was £110.5m (2017: £147.2m) with the reduction driven by lower proceeds from the disposal of property, plant and equipment primarily due to the sale of a Greyhound terminal last year and higher interest payments as a result of the early bond redemption partly offset by the timing of certain working capital flows. Net cash flow including the First Rail start of franchise cash flows of £88.5m (2017: £nil) was £199.0m (2017: £147.2m) and this, combined with movements in debt due to foreign exchange, resulted in a decrease in net debt of £219.6m (2017: £120.3m) as detailed below.
Balance sheet Net assets have decreased by £585.3m since the start of the year. The principal reasons for this are the unfavourable translation reserve movements of £324.9m and the retained loss for the year of £290.9m partly offset by favourable after tax hedging reserve movements of £34.4m.
Goodwill The carrying value (net assets including goodwill but excluding intercompany balances) of each CGU was tested for impairment during the year by reference to their projected value in use and following their review of these projections, the Directors concluded that there should be an impairment charge of £277.3m on the Greyhound CGU. This is reflected in the financial statements as an impairment in full of the carrying value of Greyhound goodwill of
and costs related to contract losses and impairment of assets in First Transit (£5.4m).
Bond ‘make whole’ costsThe early redemption of the £300m bond in March this year resulted in a one-off £10.7m ‘make whole’ interest charge.
Capital expenditure Cash capital expenditure was £425.6m (2017: £404.3m), of which £299.4m (2017: £323.9m) was in the Road divisions. It comprised First Student £186.0m (2017: £198.7m), First Transit £19.0m (2017: £17.8m), Greyhound £46.6m (2017: £30.1m), First Bus £42.8m (2017: £74.4m), First Rail £126.2m (2017: £80.4m) and Group items £5.0m (2017: £2.9m). First Rail capital expenditure is typically matched by franchise receipts or other funding. In addition, during the year we entered into operating leases for passenger carrying vehicles with capital values in First Bus of £6.0m (2017: First Transit £8.0m), and we expect our use of operating leases to increase going forward.
Gross capital investment was £439.5m (2017: £365.6m) and comprised First Student £205.1m (2017: £165.9m), First Transit £28.5m (2017: £25.8m), Greyhound £44.4m (2017: £31.7m), First Bus £26.9m (2017: £63.9m), First Rail £129.6m (2017: £75.4m) and Group items £5.0m (2017: £2.9m). The balance between cash capital expenditure and gross capital investment represents creditor movements in the year.
£260.6m (note 11), as well as impairment charges of £12.3m on Greyhound’s property, plant and equipment (note 13), £2.5m on the brand and trade name and £1.9m on software (note 12). Apart from Greyhound, there continues to be sufficient headroom in all other CGUs.
Funding and risk management Liquidity within the Group has remained strong. At the year end there was £766.4m (2017: £941.1m) of headroom on committed facilities and free cash, being £603.0m (2017: £800.0m) of committed headroom and £163.4m (2017: £141.1m) of free cash. Largely due to the seasonality of First Student, committed headroom typically reduces during the financial year up to October and increases thereafter. Treasury policy requires a minimum of £150m of committed headroom at all times. Our average debt maturity was 4.1 years (2017: 3.6 years). The Group does not enter into speculative financial transactions and uses only authorised financial instruments for certain risk management purposes.
Fuel price risk We use a progressive forward hedging programme to manage commodity risk. In 2017/18 in the UK, 89% of our ‘at risk’ crude requirements (1.9m barrels p.a.) were hedged at an average rate of $60 per barrel. We have hedged 82% of our ‘at risk’ UK crude requirements for the year to 31 March 2019 at $58 per barrel and 57% of our requirements for the year to 31 March 2020 at $63 per barrel.
Cash flow 2018
£m2017
£m
EBITDA 690.6 686.6Other non-cash income statement charges/(credits) 17.2 (6.2)Working capital excluding First Rail start of franchise cash flows 36.9 23.9Movement in other provisions (10.5) (30.6)Pension payments in excess of income statement charge (47.9) (37.6)
Cash generated by operations excluding First Rail start of franchise cash flows 686.3 636.1Capital expenditure and acquisitions (425.6) (404.3)Proceeds from disposal of property, plant and equipment 11.4 43.0Interest and tax (137.6) (116.3)Acquisition of non-controlling interest (13.8) –Dividends paid to non-controlling minority shareholders (1.1) (11.9)Other (9.1) 0.6
Net cash inflow before First Rail start of franchise cash flows 110.5 147.2First Rail start of franchise cash flows 88.5 –
Net cash inflow after First Rail start of franchise cash flows 199.0 147.2Foreign exchange movements 23.2 (26.5)Other non-cash movements (2.6) (0.4)
Movement in net debt in the year 219.6 120.3
FirstGroup Annual Report and Accounts 201842
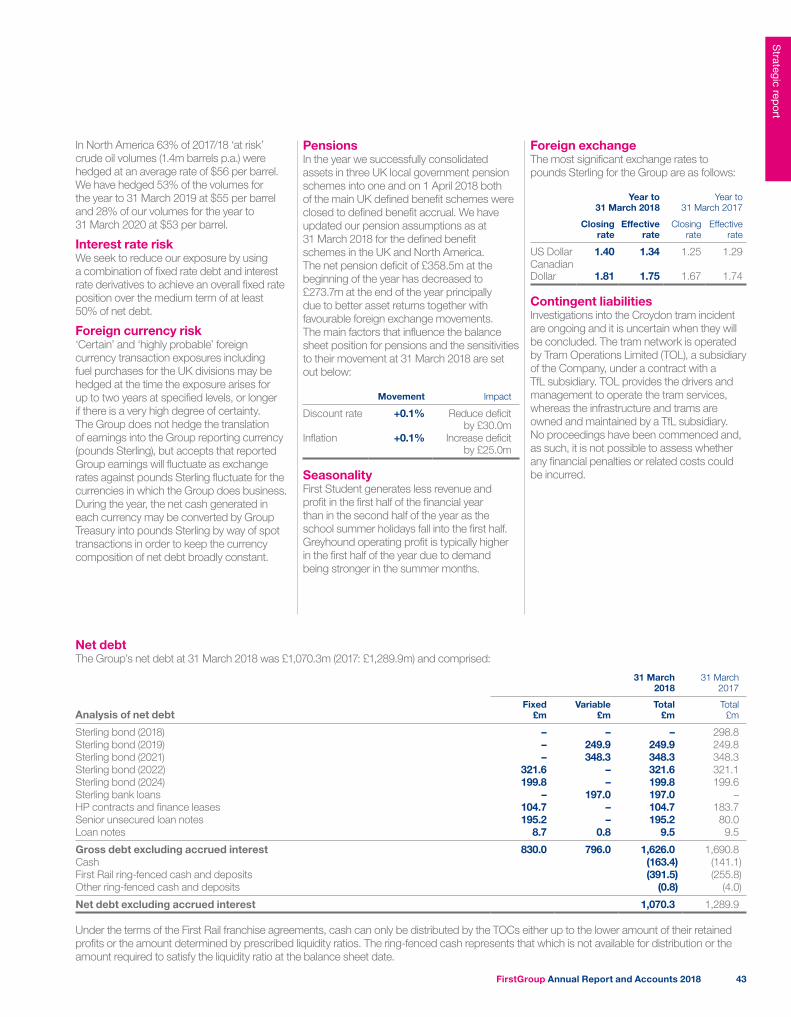
PensionsIn the year we successfully consolidated assets in three UK local government pension schemes into one and on 1 April 2018 both of the main UK defined benefit schemes were closed to defined benefit accrual. We have updated our pension assumptions as at 31 March 2018 for the defined benefit schemes in the UK and North America. The net pension deficit of £358.5m at the beginning of the year has decreased to £273.7m at the end of the year principally due to better asset returns together with favourable foreign exchange movements. The main factors that influence the balance sheet position for pensions and the sensitivities to their movement at 31 March 2018 are set out below:
Movement Impact
Discount rate +0.1% Reduce deficit by £30.0m
Inflation +0.1% Increase deficit by £25.0m
Seasonality First Student generates less revenue and profit in the first half of the financial year than in the second half of the year as the school summer holidays fall into the first half. Greyhound operating profit is typically higher in the first half of the year due to demand being stronger in the summer months.
In North America 63% of 2017/18 ‘at risk’ crude oil volumes (1.4m barrels p.a.) were hedged at an average rate of $56 per barrel. We have hedged 53% of the volumes for the year to 31 March 2019 at $55 per barrel and 28% of our volumes for the year to 31 March 2020 at $53 per barrel.
Interest rate risk We seek to reduce our exposure by using a combination of fixed rate debt and interest rate derivatives to achieve an overall fixed rate position over the medium term of at least 50% of net debt.
Foreign currency risk ‘Certain’ and ‘highly probable’ foreign currency transaction exposures including fuel purchases for the UK divisions may be hedged at the time the exposure arises for up to two years at specified levels, or longer if there is a very high degree of certainty. The Group does not hedge the translation of earnings into the Group reporting currency (pounds Sterling), but accepts that reported Group earnings will fluctuate as exchange rates against pounds Sterling fluctuate for the currencies in which the Group does business. During the year, the net cash generated in each currency may be converted by Group Treasury into pounds Sterling by way of spot transactions in order to keep the currency composition of net debt broadly constant.
Foreign exchange The most significant exchange rates to pounds Sterling for the Group are as follows:
Year to 31 March 2018
Year to 31 March 2017
Closing rate
Effective rate
Closing rate
Effective rate
US Dollar 1.40 1.34 1.25 1.29Canadian Dollar 1.81 1.75 1.67 1.74
Contingent liabilitiesInvestigations into the Croydon tram incident are ongoing and it is uncertain when they will be concluded. The tram network is operated by Tram Operations Limited (TOL), a subsidiary of the Company, under a contract with a TfL subsidiary. TOL provides the drivers and management to operate the tram services, whereas the infrastructure and trams are owned and maintained by a TfL subsidiary. No proceedings have been commenced and, as such, it is not possible to assess whether any financial penalties or related costs could be incurred.
Net debt The Group’s net debt at 31 March 2018 was £1,070.3m (2017: £1,289.9m) and comprised:
31 March 2018
31 March 2017
Analysis of net debtFixed
£mVariable
£mTotal
£mTotal £m
Sterling bond (2018) – – – 298.8Sterling bond (2019) – 249.9 249.9 249.8Sterling bond (2021) – 348.3 348.3 348.3Sterling bond (2022) 321.6 – 321.6 321.1Sterling bond (2024) 199.8 – 199.8 199.6Sterling bank loans – 197.0 197.0 –HP contracts and finance leases 104.7 – 104.7 183.7Senior unsecured loan notes 195.2 – 195.2 80.0Loan notes 8.7 0.8 9.5 9.5
Gross debt excluding accrued interest 830.0 796.0 1,626.0 1,690.8Cash (163.4) (141.1)First Rail ring-fenced cash and deposits (391.5) (255.8)Other ring-fenced cash and deposits (0.8) (4.0)
Net debt excluding accrued interest 1,070.3 1,289.9
Under the terms of the First Rail franchise agreements, cash can only be distributed by the TOCs either up to the lower amount of their retained profits or the amount determined by prescribed liquidity ratios. The ring-fenced cash represents that which is not available for distribution or the amount required to satisfy the liquidity ratio at the balance sheet date.
FirstGroup Annual Report and Accounts 2018 43
Strategic report
Financial review continued
Viability statementIn accordance with provision C.2.2 of the UK Corporate Governance Code 2016, the Directors have assessed the viability of the Group over a three-year period, taking into account the Group’s current position and the potential impact of the principal risks set out on page 36 onwards. Based on this assessment, the Directors confirm that they have a reasonable expectation that the Group will be able to continue in operation and meet its liabilities as they fall due over the period to 31 March 2021.
Whilst the Directors have no reason to believe the Group will not be viable over a longer period, the period over which the Directors consider it possible to form a reasonable expectation as to the Group’s longer term is the three year period to 31 March 2021. This period reflects the Group’s corporate planning processes and is considered appropriate for a fast-moving competitive environment such as passenger transport.
The Group’s corporate planning processes include completion of a strategic review, preparation of a medium term business plan and a quarterly re-forecast of current year business performance. The plans and projections prepared as part of these corporate planning processes consider the Group’s cash flows, committed funding and liquidity positions, forecast future funding requirements, banking covenants and other key financial ratios, including those relevant to maintaining the Group’s existing investment grade status. It also considers the ability of the Group to deploy capital. A key assumption underpinning these corporate planning processes is that debt and asset-backed financing markets will be sufficiently available to the Group.
In making their assessment, the Directors took account of the potential financial and operational impacts, in severe but plausible scenarios, of the principal risks which might threaten the Group’s viability during the three-year period to 31 March 2021 and the likely degree of effectiveness of current and available mitigating actions that could be taken to avoid or reduce the impact or occurrence of such risks. The scenarios considered were: 1) weak economy, adverse operating environment and forfeit of rail franchises; 2) low growth economy, heightened terrorism and increased environmental pressures; and 3) weak economy and credit market shock.
The Board confirms that in making this statement it carried out a robust assessment of the principal risks facing the Group, including those that would threaten its business model, future performance, solvency or liquidity.
Going concern statementThe Group has established a strong balanced portfolio of businesses with approximately 50% of Group revenues secured under medium term contracts with government agencies and other large organisations in the UK and North America.
The Group has a diversified funding structure with average debt duration at 31 March 2018 of 4.1 years (2017: 3.6 years) and which is largely represented by medium term unsecured bank facilities and long term unsecured bond debt. The Group has an £800m committed revolving banking facility of which £603m (2017: £800m) was undrawn at the year end. This facility has a maturity of July 2021.
The Directors have carried out a detailed review of the Group’s budget for the year to 31 March 2019 and medium term plans, with due regard for the risks and uncertainties to which the Group is exposed, the uncertain economic climate and the impact that this could have on trading performance. Based on this review, the Directors believe that the Company and the Group have adequate resources to continue in operational existence for the foreseeable future. Accordingly, the financial statements have been prepared on a going concern basis.
FirstGroup Annual Report and Accounts 201844
Governance
GovernanceBoard of Directors 46
About the Board 48
Governance framework 49
Corporate governance report 50
Directors’ remuneration report 68
Directors’ report and additional disclosures 95
Directors’ responsibility statement 98
In this section we explain our Board’s approach to corporate governance and activities in the year, and give details of the Company’s remuneration framework, which aims to support sustainable value creation.
FirstGroup Annual Report and Accounts 2018 45
Governance
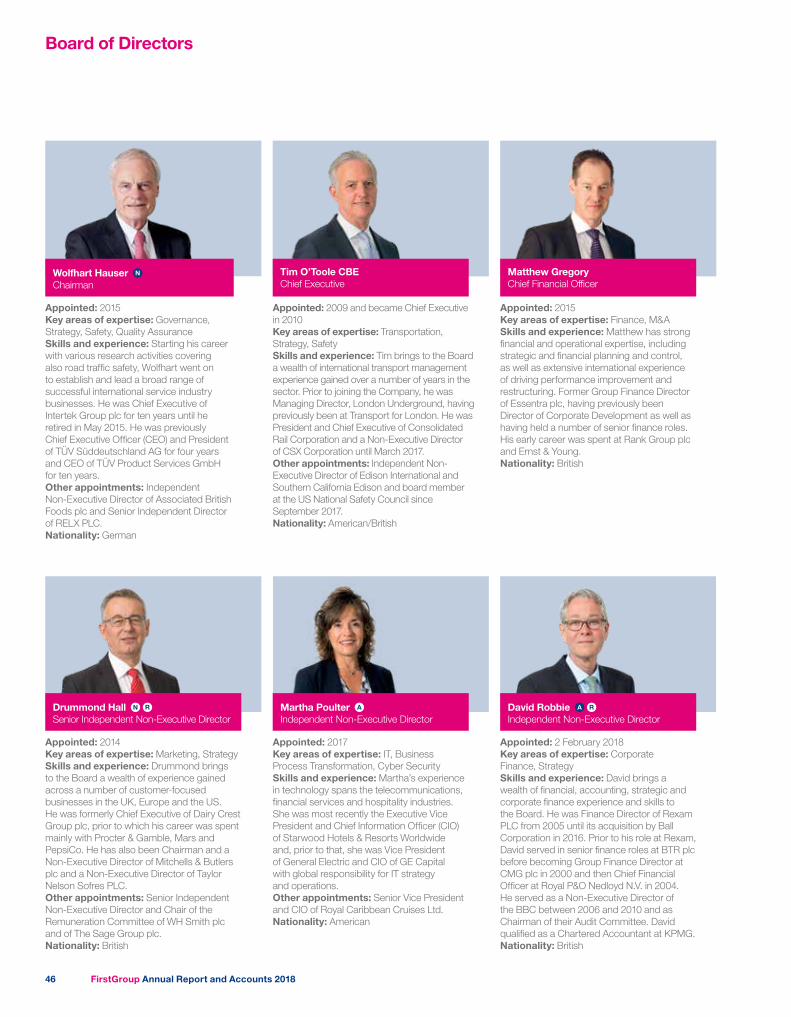
Board of Directors
Appointed: 2017 Key areas of expertise: IT, Business Process Transformation, Cyber Security Skills and experience: Martha’s experience in technology spans the telecommunications, financial services and hospitality industries. She was most recently the Executive Vice President and Chief Information Officer (CIO) of Starwood Hotels & Resorts Worldwide and, prior to that, she was Vice President of General Electric and CIO of GE Capital with global responsibility for IT strategy and operations. Other appointments: Senior Vice President and CIO of Royal Caribbean Cruises Ltd.Nationality: American
Appointed: 2014 Key areas of expertise: Marketing, Strategy Skills and experience: Drummond brings to the Board a wealth of experience gained across a number of customer-focused businesses in the UK, Europe and the US. He was formerly Chief Executive of Dairy Crest Group plc, prior to which his career was spent mainly with Procter & Gamble, Mars and PepsiCo. He has also been Chairman and a Non-Executive Director of Mitchells & Butlers plc and a Non-Executive Director of Taylor Nelson Sofres PLC. Other appointments: Senior Independent Non-Executive Director and Chair of the Remuneration Committee of WH Smith plc and of The Sage Group plc.Nationality: British
Appointed: 2 February 2018Key areas of expertise: Corporate Finance, StrategySkills and experience: David brings a wealth of financial, accounting, strategic and corporate finance experience and skills to the Board. He was Finance Director of Rexam PLC from 2005 until its acquisition by Ball Corporation in 2016. Prior to his role at Rexam, David served in senior finance roles at BTR plc before becoming Group Finance Director at CMG plc in 2000 and then Chief Financial Officer at Royal P&O Nedloyd N.V. in 2004. He served as a Non-Executive Director of the BBC between 2006 and 2010 and as Chairman of their Audit Committee. David qualified as a Chartered Accountant at KPMG.Nationality: British
Appointed: 2009 and became Chief Executive in 2010 Key areas of expertise: Transportation, Strategy, Safety Skills and experience: Tim brings to the Board a wealth of international transport management experience gained over a number of years in the sector. Prior to joining the Company, he was Managing Director, London Underground, having previously been at Transport for London. He was President and Chief Executive of Consolidated Rail Corporation and a Non-Executive Director of CSX Corporation until March 2017.Other appointments: Independent Non-Executive Director of Edison International and Southern California Edison and board member at the US National Safety Council since September 2017.Nationality: American/British
Appointed: 2015 Key areas of expertise: Finance, M&A Skills and experience: Matthew has strong financial and operational expertise, including strategic and financial planning and control, as well as extensive international experience of driving performance improvement and restructuring. Former Group Finance Director of Essentra plc, having previously been Director of Corporate Development as well as having held a number of senior finance roles. His early career was spent at Rank Group plc and Ernst & Young.Nationality: British
Appointed: 2015 Key areas of expertise: Governance, Strategy, Safety, Quality Assurance Skills and experience: Starting his career with various research activities covering also road traffic safety, Wolfhart went on to establish and lead a broad range of successful international service industry businesses. He was Chief Executive of Intertek Group plc for ten years until he retired in May 2015. He was previously Chief Executive Officer (CEO) and President of TÜV Süddeutschland AG for four years and CEO of TÜV Product Services GmbH for ten years. Other appointments: Independent Non-Executive Director of Associated British Foods plc and Senior Independent Director of RELX PLC.Nationality: German
Tim O’Toole CBE Chief Executive
Matthew GregoryChief Financial Officer
Martha Poulter A Independent Non-Executive Director
Drummond Hall N R
Senior Independent Non-Executive DirectorDavid Robbie A R Independent Non-Executive Director
Wolfhart Hauser N
Chairman
FirstGroup Annual Report and Accounts 201846
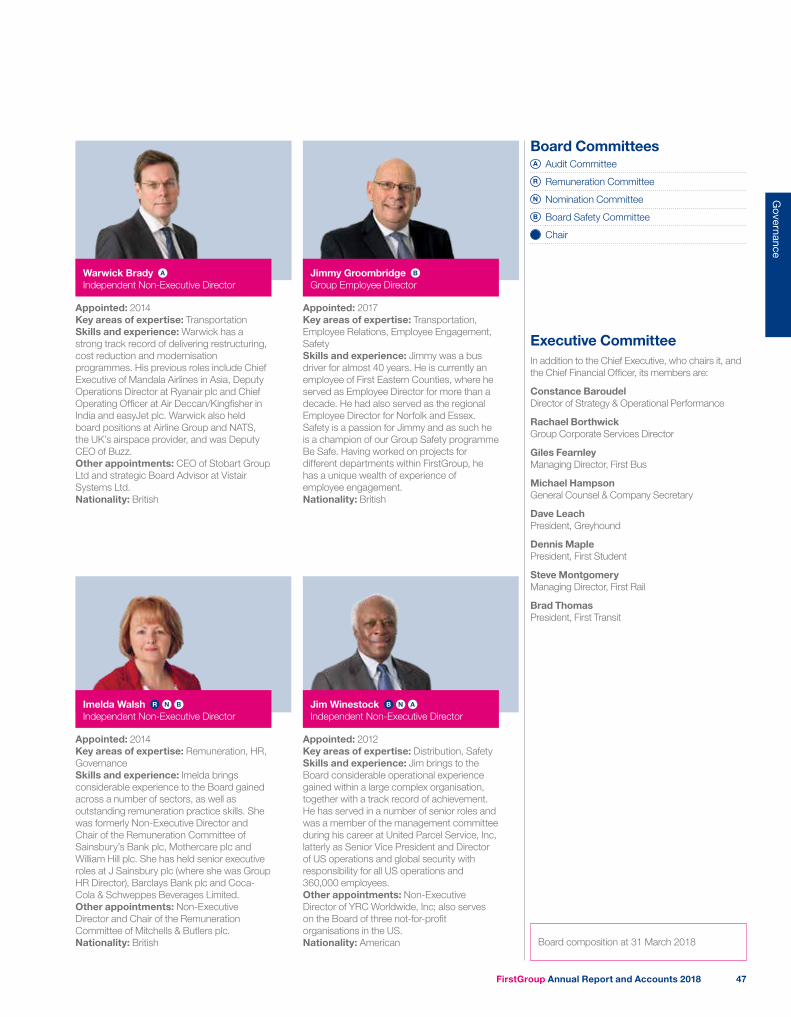
Board CommitteesA Audit Committee
R Remuneration Committee
N Nomination Committee
B Board Safety Committee
Chair
Executive CommitteeIn addition to the Chief Executive, who chairs it, and the Chief Financial Officer, its members are:
Constance Baroudel Director of Strategy & Operational Performance
Rachael Borthwick Group Corporate Services Director
Giles Fearnley Managing Director, First Bus
Michael Hampson General Counsel & Company Secretary
Dave Leach President, Greyhound
Dennis Maple President, First Student
Steve Montgomery Managing Director, First Rail
Brad Thomas President, First Transit
Appointed: 2014 Key areas of expertise: Remuneration, HR, Governance Skills and experience: Imelda brings considerable experience to the Board gained across a number of sectors, as well as outstanding remuneration practice skills. She was formerly Non-Executive Director and Chair of the Remuneration Committee of Sainsbury’s Bank plc, Mothercare plc and William Hill plc. She has held senior executive roles at J Sainsbury plc (where she was Group HR Director), Barclays Bank plc and Coca-Cola & Schweppes Beverages Limited. Other appointments: Non-Executive Director and Chair of the Remuneration Committee of Mitchells & Butlers plc.Nationality: British
Appointed: 2012Key areas of expertise: Distribution, SafetySkills and experience: Jim brings to the Board considerable operational experience gained within a large complex organisation, together with a track record of achievement. He has served in a number of senior roles and was a member of the management committee during his career at United Parcel Service, Inc, latterly as Senior Vice President and Director of US operations and global security with responsibility for all US operations and 360,000 employees.Other appointments: Non-Executive Director of YRC Worldwide, Inc; also serves on the Board of three not-for-profit organisations in the US.Nationality: American
Appointed: 2014 Key areas of expertise: Transportation Skills and experience: Warwick has a strong track record of delivering restructuring, cost reduction and modernisation programmes. His previous roles include Chief Executive of Mandala Airlines in Asia, Deputy Operations Director at Ryanair plc and Chief Operating Officer at Air Deccan/Kingfisher in India and easyJet plc. Warwick also held board positions at Airline Group and NATS, the UK’s airspace provider, and was Deputy CEO of Buzz. Other appointments: CEO of Stobart Group Ltd and strategic Board Advisor at Vistair Systems Ltd.Nationality: British
Appointed: 2017 Key areas of expertise: Transportation, Employee Relations, Employee Engagement, Safety Skills and experience: Jimmy was a bus driver for almost 40 years. He is currently an employee of First Eastern Counties, where he served as Employee Director for more than a decade. He had also served as the regional Employee Director for Norfolk and Essex. Safety is a passion for Jimmy and as such he is a champion of our Group Safety programme Be Safe. Having worked on projects for different departments within FirstGroup, he has a unique wealth of experience of employee engagement.Nationality: British
Warwick Brady A Independent Non-Executive Director
Jimmy Groombridge B
Group Employee Director
Imelda Walsh R N B
Independent Non-Executive DirectorJim Winestock B N A
Independent Non-Executive Director
Board composition at 31 March 2018
FirstGroup Annual Report and Accounts 2018 47
Governance
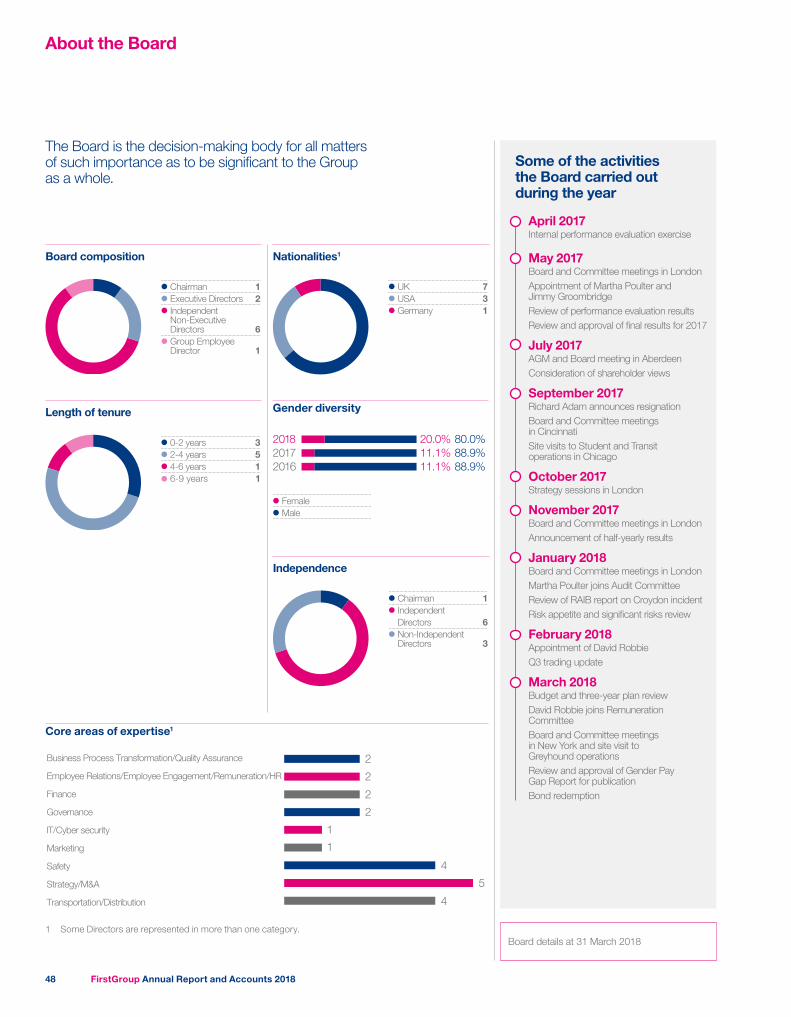
About the Board
The Board is the decision-making body for all matters of such importance as to be significant to the Group as a whole.
Chairman 1Executive Directors 2Independent Non-Executive Directors 6Group Employee Director 1
Board composition
0-2 years 32-4 years 54-6 years 16-9 years 1
Length of tenure
UK 7USA 3Germany 1
Nationalities1
Gender diversity
2018 20.0%11.1%201711.1%2016
80.0%88.9%88.9%
Female Male
Chairman 1Independent Directors 6Non-IndependentDirectors 3
Independence
Some of the activities the Board carried out during the year
April 2017Internal performance evaluation exercise
May 2017Board and Committee meetings in LondonAppointment of Martha Poulter and Jimmy GroombridgeReview of performance evaluation resultsReview and approval of final results for 2017
July 2017AGM and Board meeting in AberdeenConsideration of shareholder views
September 2017Richard Adam announces resignationBoard and Committee meetings in CincinnatiSite visits to Student and Transit operations in Chicago
October 2017Strategy sessions in London
November 2017Board and Committee meetings in LondonAnnouncement of half-yearly results
January 2018Board and Committee meetings in LondonMartha Poulter joins Audit CommitteeReview of RAIB report on Croydon incidentRisk appetite and significant risks review
February 2018Appointment of David RobbieQ3 trading update
March 2018Budget and three-year plan reviewDavid Robbie joins Remuneration CommitteeBoard and Committee meetings in New York and site visit to Greyhound operationsReview and approval of Gender Pay Gap Report for publicationBond redemption
Core areas of expertise1
Business Process Transformation/Quality Assurance
Employee Relations/Employee Engagement/Remuneration/HR
Finance
Governance
IT/Cyber security
Marketing
Safety
Strategy/M&A
Transportation/Distribution
2
2
2
2
5
1
1
4
4
1 Some Directors are represented in more than one category.Board details at 31 March 2018
FirstGroup Annual Report and Accounts 201848

Governance framework
Board of DirectorsLeadership, strategy, risk, governance, values and standards
Shareholders
Strategy/Principal Risks/Budget/Three-Year Plan
Chief ExecutiveDay-to-day management; development of Group strategy and
commercial objectives; implementation of Board decisions; promotion of high standards of corporate governance
Executive CommitteeSupporting the Chief Executive in the day-to-day running of the Group
Executive Safety CommitteeSafety standards, sharing of best practice and Be Safe Programme
Board Safety CommitteeSafety policies and standards oversight
Audit CommitteeFinancial reporting, internal controls, external audit oversight and cyber security
Nomination CommitteeBoard composition, skills matrix and succession planning
Remuneration CommitteeRemuneration framework and Executive Directors and Senior Executives’ packages
Our Group Employee DirectorWe are one of the few publicly listed companies that has an employee appointed to its Board (and also to the boards of most of its UK operating companies). This unique aspect of our corporate governance has been a feature of our Company since our origins in the late 1980s. Our employee directors have evolved with the Company as it has grown, which is one of the reasons that it is an accepted feature of the organisation amongst UK employees, and is not regarded as either an alternative to conventional industrial relations, nor an artificial adjunct to a corporate governance framework.
Since the founding of the Company, the Board has been committed to promoting employee involvement at local level. The appointment of employee directors to the boards of the UK operating companies gives directors an employee viewpoint on all matters affecting the direction and governance of the Group, and allows employee directors to engage with employees at a local level on the strategic direction of the business.
Employee directors are elected by a ballot of employees in their respective companies, which is independently supervised. They take an active role at local level, carrying out safety audits and highlighting to employees the many benefits and assistance provided by the Group. They have the same responsibilities as any other non-executive director and play as full a role as any director in challenging the senior management team.
The Employee Directors’ Forum meets at least twice a year and one of its functions is to nominate a candidate for the role of Group Employee Director when a vacancy arises. Last year the Employee Directors’ Forum nominated Jimmy Groombridge, whose appointment was recommended to the Board by the Nomination Committee. Jimmy was then elected by shareholders at the 2017 AGM.
Every Non-Executive Director brings a different perspective and experience to the Board; our Group Employee Director brings his experience as a frontline employee and helps ensure that the Board takes the views of the workforce into account in its discussions.
FirstGroup Annual Report and Accounts 2018 49
Governance
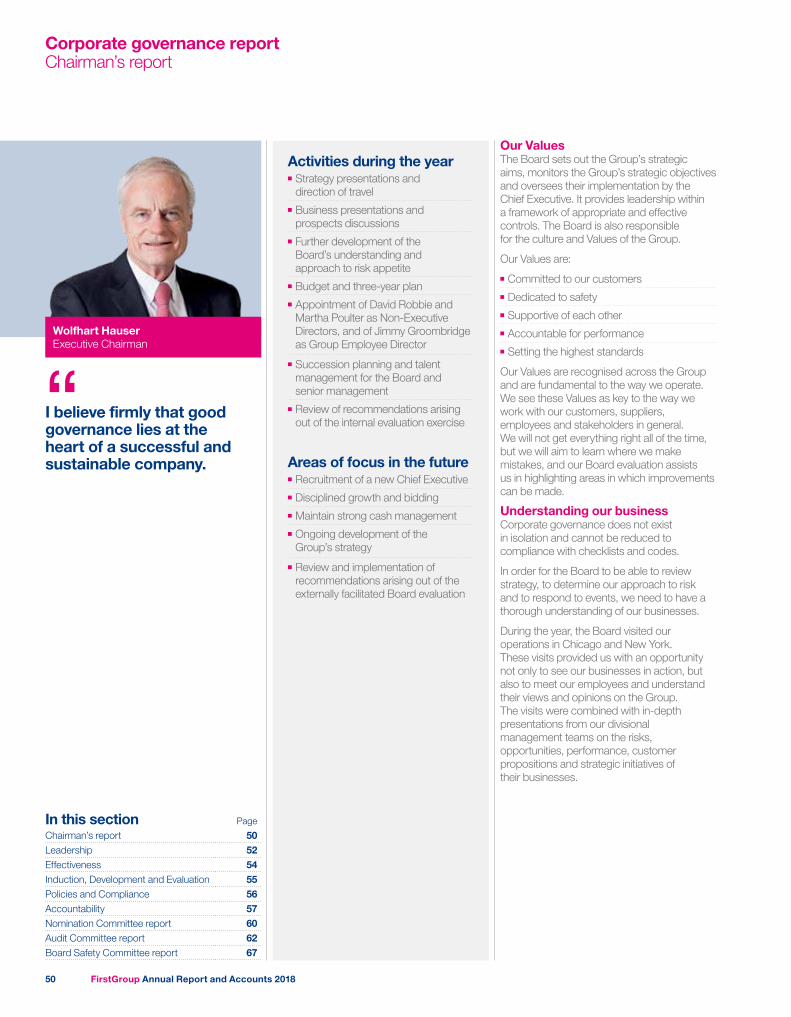
Corporate governance reportChairman’s report
Our ValuesThe Board sets out the Group’s strategic aims, monitors the Group’s strategic objectives and oversees their implementation by the Chief Executive. It provides leadership within a framework of appropriate and effective controls. The Board is also responsible for the culture and Values of the Group.
Our Values are:
■■ Committed to our customers■■ Dedicated to safety■■ Supportive of each other■■ Accountable for performance■■ Setting the highest standards
Our Values are recognised across the Group and are fundamental to the way we operate. We see these Values as key to the way we work with our customers, suppliers, employees and stakeholders in general. We will not get everything right all of the time, but we will aim to learn where we make mistakes, and our Board evaluation assists us in highlighting areas in which improvements can be made.
Understanding our businessCorporate governance does not exist in isolation and cannot be reduced to compliance with checklists and codes.
In order for the Board to be able to review strategy, to determine our approach to risk and to respond to events, we need to have a thorough understanding of our businesses.
During the year, the Board visited our operations in Chicago and New York. These visits provided us with an opportunity not only to see our businesses in action, but also to meet our employees and understand their views and opinions on the Group. The visits were combined with in-depth presentations from our divisional management teams on the risks, opportunities, performance, customer propositions and strategic initiatives of their businesses.
I believe firmly that good governance lies at the heart of a successful and sustainable company.
“
Activities during the year■■ Strategy presentations and direction of travel
■■ Business presentations and prospects discussions
■■ Further development of the Board’s understanding and approach to risk appetite
■■ Budget and three-year plan ■■ Appointment of David Robbie and Martha Poulter as Non-Executive Directors, and of Jimmy Groombridge as Group Employee Director
■■ Succession planning and talent management for the Board and senior management
■■ Review of recommendations arising out of the internal evaluation exercise
Areas of focus in the future■■ Recruitment of a new Chief Executive■■ Disciplined growth and bidding■■ Maintain strong cash management■■ Ongoing development of the Group’s strategy
■■ Review and implementation of recommendations arising out of the externally facilitated Board evaluation
In this section Page
Chairman’s report 50Leadership 52Effectiveness 54Induction, Development and Evaluation 55Policies and Compliance 56Accountability 57Nomination Committee report 60Audit Committee report 62Board Safety Committee report 67
Wolfhart HauserExecutive Chairman
FirstGroup Annual Report and Accounts 201850
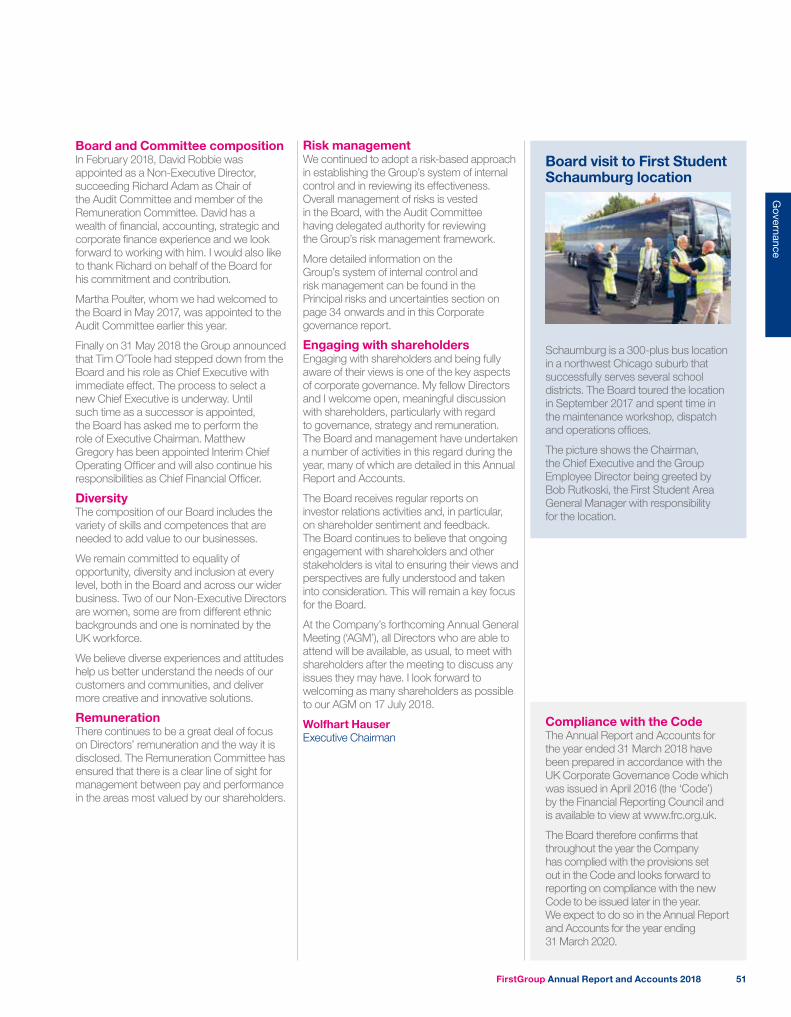
Board and Committee compositionIn February 2018, David Robbie was appointed as a Non-Executive Director, succeeding Richard Adam as Chair of the Audit Committee and member of the Remuneration Committee. David has a wealth of financial, accounting, strategic and corporate finance experience and we look forward to working with him. I would also like to thank Richard on behalf of the Board for his commitment and contribution.
Martha Poulter, whom we had welcomed to the Board in May 2017, was appointed to the Audit Committee earlier this year.
Finally on 31 May 2018 the Group announced that Tim O’Toole had stepped down from the Board and his role as Chief Executive with immediate effect. The process to select a new Chief Executive is underway. Until such time as a successor is appointed, the Board has asked me to perform the role of Executive Chairman. Matthew Gregory has been appointed Interim Chief Operating Officer and will also continue his responsibilities as Chief Financial Officer.
DiversityThe composition of our Board includes the variety of skills and competences that are needed to add value to our businesses.
We remain committed to equality of opportunity, diversity and inclusion at every level, both in the Board and across our wider business. Two of our Non-Executive Directors are women, some are from different ethnic backgrounds and one is nominated by the UK workforce.
We believe diverse experiences and attitudes help us better understand the needs of our customers and communities, and deliver more creative and innovative solutions.
RemunerationThere continues to be a great deal of focus on Directors’ remuneration and the way it is disclosed. The Remuneration Committee has ensured that there is a clear line of sight for management between pay and performance in the areas most valued by our shareholders.
Risk managementWe continued to adopt a risk-based approach in establishing the Group’s system of internal control and in reviewing its effectiveness. Overall management of risks is vested in the Board, with the Audit Committee having delegated authority for reviewing the Group’s risk management framework.
More detailed information on the Group’s system of internal control and risk management can be found in the Principal risks and uncertainties section on page 34 onwards and in this Corporate governance report.
Engaging with shareholdersEngaging with shareholders and being fully aware of their views is one of the key aspects of corporate governance. My fellow Directors and I welcome open, meaningful discussion with shareholders, particularly with regard to governance, strategy and remuneration. The Board and management have undertaken a number of activities in this regard during the year, many of which are detailed in this Annual Report and Accounts.
The Board receives regular reports on investor relations activities and, in particular, on shareholder sentiment and feedback. The Board continues to believe that ongoing engagement with shareholders and other stakeholders is vital to ensuring their views and perspectives are fully understood and taken into consideration. This will remain a key focus for the Board.
At the Company’s forthcoming Annual General Meeting (‘AGM’), all Directors who are able to attend will be available, as usual, to meet with shareholders after the meeting to discuss any issues they may have. I look forward to welcoming as many shareholders as possible to our AGM on 17 July 2018.
Wolfhart HauserExecutive Chairman
Board visit to First Student Schaumburg location
Schaumburg is a 300-plus bus location in a northwest Chicago suburb that successfully serves several school districts. The Board toured the location in September 2017 and spent time in the maintenance workshop, dispatch and operations offices.
The picture shows the Chairman, the Chief Executive and the Group Employee Director being greeted by Bob Rutkoski, the First Student Area General Manager with responsibility for the location.
Compliance with the CodeThe Annual Report and Accounts for the year ended 31 March 2018 have been prepared in accordance with the UK Corporate Governance Code which was issued in April 2016 (the ‘Code’) by the Financial Reporting Council and is available to view at www.frc.org.uk.
The Board therefore confirms that throughout the year the Company has complied with the provisions set out in the Code and looks forward to reporting on compliance with the new Code to be issued later in the year. We expect to do so in the Annual Report and Accounts for the year ending 31 March 2020.
FirstGroup Annual Report and Accounts 2018 51
Governance
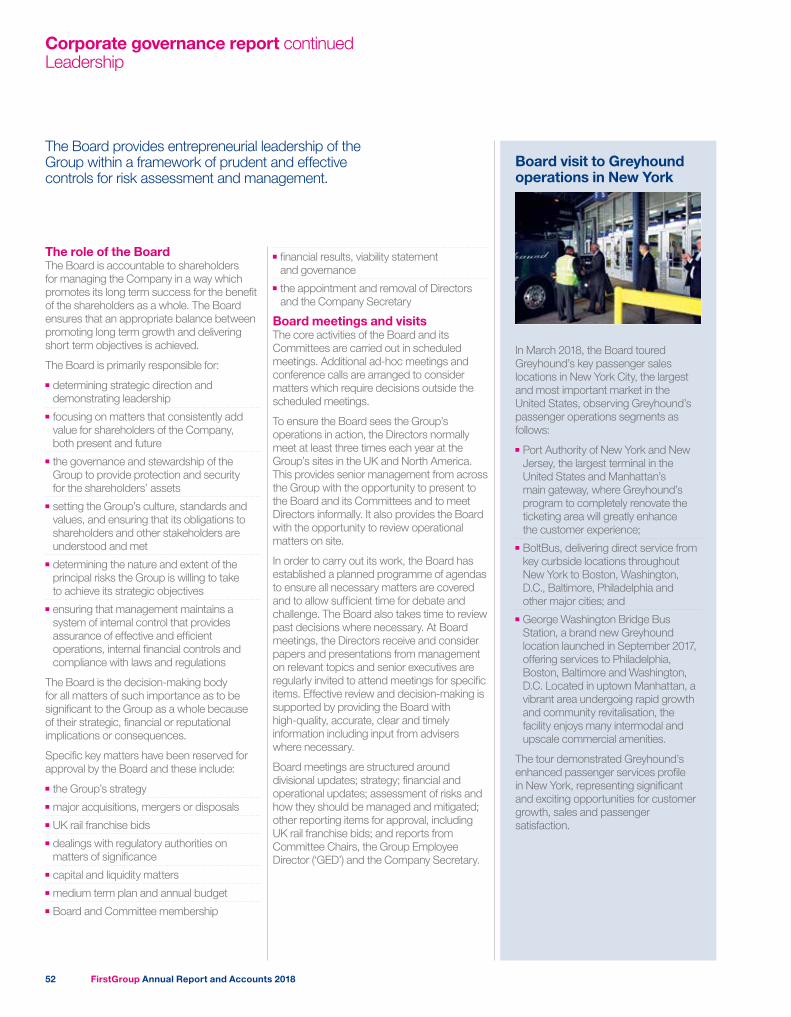
Corporate governance report continuedLeadership
■■ financial results, viability statement and governance
■■ the appointment and removal of Directors and the Company Secretary
Board meetings and visitsThe core activities of the Board and its Committees are carried out in scheduled meetings. Additional ad-hoc meetings and conference calls are arranged to consider matters which require decisions outside the scheduled meetings.
To ensure the Board sees the Group’s operations in action, the Directors normally meet at least three times each year at the Group’s sites in the UK and North America. This provides senior management from across the Group with the opportunity to present to the Board and its Committees and to meet Directors informally. It also provides the Board with the opportunity to review operational matters on site.
In order to carry out its work, the Board has established a planned programme of agendas to ensure all necessary matters are covered and to allow sufficient time for debate and challenge. The Board also takes time to review past decisions where necessary. At Board meetings, the Directors receive and consider papers and presentations from management on relevant topics and senior executives are regularly invited to attend meetings for specific items. Effective review and decision-making is supported by providing the Board with high-quality, accurate, clear and timely information including input from advisers where necessary.
Board meetings are structured around divisional updates; strategy; financial and operational updates; assessment of risks and how they should be managed and mitigated; other reporting items for approval, including UK rail franchise bids; and reports from Committee Chairs, the Group Employee Director (‘GED’) and the Company Secretary.
The Board provides entrepreneurial leadership of the Group within a framework of prudent and effective controls for risk assessment and management.
The role of the BoardThe Board is accountable to shareholders for managing the Company in a way which promotes its long term success for the benefit of the shareholders as a whole. The Board ensures that an appropriate balance between promoting long term growth and delivering short term objectives is achieved.
The Board is primarily responsible for:
■■ determining strategic direction and demonstrating leadership
■■ focusing on matters that consistently add value for shareholders of the Company, both present and future
■■ the governance and stewardship of the Group to provide protection and security for the shareholders’ assets
■■ setting the Group’s culture, standards and values, and ensuring that its obligations to shareholders and other stakeholders are understood and met
■■ determining the nature and extent of the principal risks the Group is willing to take to achieve its strategic objectives
■■ ensuring that management maintains a system of internal control that provides assurance of effective and efficient operations, internal financial controls and compliance with laws and regulations
The Board is the decision-making body for all matters of such importance as to be significant to the Group as a whole because of their strategic, financial or reputational implications or consequences.
Specific key matters have been reserved for approval by the Board and these include:
■■ the Group’s strategy■■ major acquisitions, mergers or disposals■■ UK rail franchise bids■■ dealings with regulatory authorities on matters of significance
■■ capital and liquidity matters■■ medium term plan and annual budget■■ Board and Committee membership
Board visit to Greyhound operations in New York
In March 2018, the Board toured Greyhound’s key passenger sales locations in New York City, the largest and most important market in the United States, observing Greyhound’s passenger operations segments as follows:
■■ Port Authority of New York and New Jersey, the largest terminal in the United States and Manhattan’s main gateway, where Greyhound’s program to completely renovate the ticketing area will greatly enhance the customer experience;
■■ BoltBus, delivering direct service from key curbside locations throughout New York to Boston, Washington, D.C., Baltimore, Philadelphia and other major cities; and
■■ George Washington Bridge Bus Station, a brand new Greyhound location launched in September 2017, offering services to Philadelphia, Boston, Baltimore and Washington, D.C. Located in uptown Manhattan, a vibrant area undergoing rapid growth and community revitalisation, the facility enjoys many intermodal and upscale commercial amenities.
The tour demonstrated Greyhound’s enhanced passenger services profile in New York, representing significant and exciting opportunities for customer growth, sales and passenger satisfaction.
FirstGroup Annual Report and Accounts 201852
Our Chief Executive■■ promotes the creation and maintenance of a safe working environment and a safety-focused culture across the Group; he does the latter by chairing the Executive Safety Committee
■■ leads the Executive Committee in the day-to-day running of the Group’s business
■■ develops the Group’s business objectives and strategy, having regard to the interests of shareholders, customers, employees and other stakeholders
■■ ensures the business of the Group is conducted, and results are delivered, in the right way
■■ establishes and maintains an organisational structure that enables the Group’s strategy to be implemented effectively
■■ leads communication with shareholders■■ ensures at all times that the Company’s standards are higher than the legal requirements of the countries in which we operate
■■ establishes a strong senior management team which has the knowledge, skills, attitude and motivation to achieve the Group’s business objectives and strategy, and with appropriate succession planning to ensure that this continues in the future
■■ develops and maintains an effective framework of internal controls and risk management
■■ ensures the Board is kept appraised in a timely manner of the issues facing the Group and of events and developments as they arise
Our Senior Independent Director■■ acts as a point of contact for shareholders and other stakeholders to discuss matters of concern which would not be appropriate through the normal channels of communication with the Chairman, Chief Executive or Chief Financial Officer
■■ acts as a sounding board for the Chairman and serves as an intermediary for the other Directors when necessary
■■ meets with the NEDs without the Chairman being present at least annually and leads the Board in the ongoing monitoring and annual performance evaluation of the Chairman
■■ deputises for the Chairman, as necessary
Division of responsibilitiesThe Board has agreed a clear division of responsibilities between the Chairman and the Chief Executive, and these roles, as well as those of other Directors, are clearly defined so that no single individual has unrestricted powers of decision.
Roles and responsibilitiesOur Chairman■■ establishes the Group’s Values and standards and sets the tone from the top
■■ promotes the interests of the Company with special regard to planning and development to secure the Group’s future and sustainable success
■■ promotes the Board, ensuring it functions efficiently and in conformity with the highest standards of corporate governance
■■ ensures Board meetings are effective and open and constructive debate is promoted, the views of all Directors are taken into account and adequate time is available for discussion on all agenda items
■■ ensures that shareholders and the Board receive accurate, timely, clear and high-quality information
■■ chairs the Nomination Committee■■ ensures effective induction and development of Directors
■■ ensures the performance of the Board, its Committees and individual Directors are formally evaluated annually, with an externally facilitated evaluation performed at least every three years
■■ facilitates effective and constructive relationships and communications between Non-Executive Directors (‘NEDs’) and Executive Directors and senior management
■■ ensures effective communication with shareholders and other stakeholders, and that their views are understood by the Board
■■ provides an appropriate balance of support and challenge to the Chief Executive in order to maintain an effective working relationship
Our Non-Executive DirectorsThe NEDs provide a strong independent element to the Board and a solid foundation for good corporate governance. Although all Directors are equally accountable under the law for the stewardship of the Company’s affairs, the NEDs fulfil a vital role in corporate accountability. They have responsibility for constructively challenging the strategies proposed by the Executive Directors, scrutinising the performance of management in achieving agreed goals and objectives, as well as playing a leading role in the functioning of the main Board Committees. Between them, the current NEDs have the appropriate balance of skills, experience, knowledge and independent judgement gained through experience in a variety of business sectors.
Our Group Employee DirectorThe Board considers that it is extremely beneficial for its employees to be represented on the Board so that employee-related issues are raised directly. The GED provides a two-way communication between the Board and employees. The GED is nominated by the Employee Directors of our UK operating companies at the Employee Directors’ Forum, and serves a maximum of three, three-year terms.
The Committees of the BoardThe four principal Committees of the Board are Audit, Board Safety, Nomination and Remuneration. Their members are appointed by the Board upon the recommendation of the Nomination Committee and membership is spread between the NEDs and the GED, drawing on each of their relevant skills and experience. Committee members are expected to attend each Committee meeting, unless there are exceptional circumstances that prevent them from doing so. Only members of the Committees are entitled to attend their meetings, but others may attend at the Committee’s discretion.
The Executive CommitteeThe Executive Committee supports the Chief Executive in the day-to-day running of the Group. Its membership is shown on page 47. It normally meets every month and its main responsibilities are:
■■ to communicate, review and agree on significant issues and actions;
■■ to help to develop, implement and monitor strategic and operational plans;
■■ to consider the continuing applicability, appropriateness and impact of risks; and
■■ to lead the Group’s culture and safety programme, supported by the Executive Safety Committee.
FirstGroup Annual Report and Accounts 2018 53
Governance
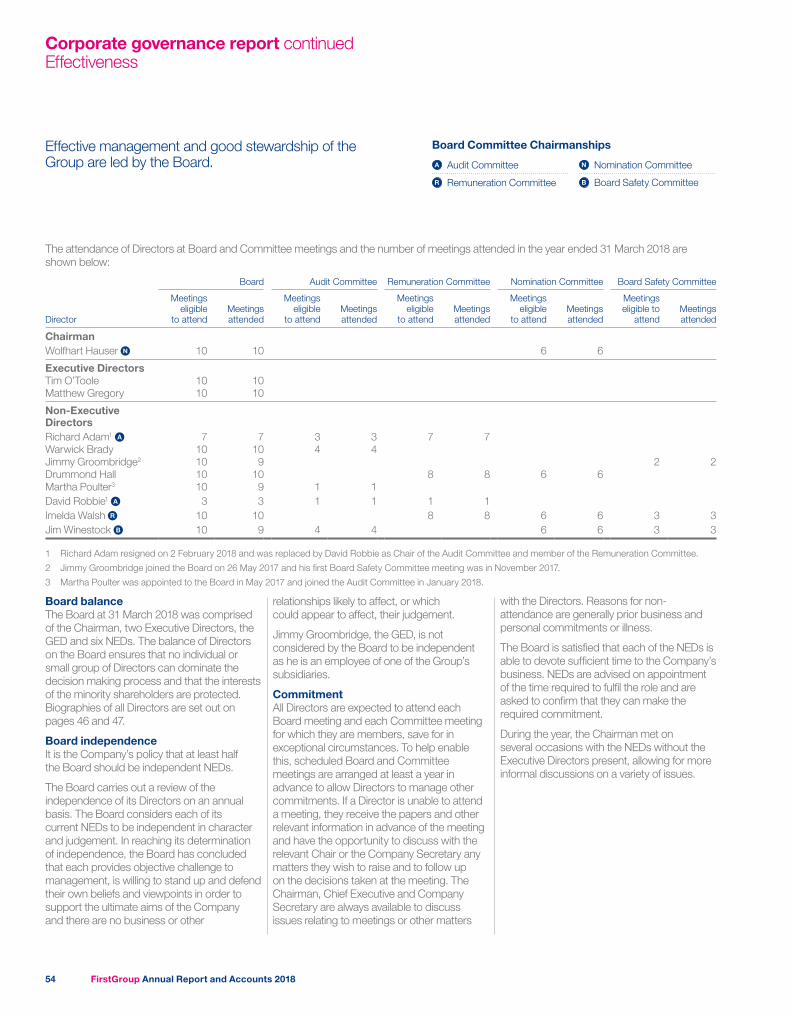
relationships likely to affect, or which could appear to affect, their judgement.
Jimmy Groombridge, the GED, is not considered by the Board to be independent as he is an employee of one of the Group’s subsidiaries.
CommitmentAll Directors are expected to attend each Board meeting and each Committee meeting for which they are members, save for in exceptional circumstances. To help enable this, scheduled Board and Committee meetings are arranged at least a year in advance to allow Directors to manage other commitments. If a Director is unable to attend a meeting, they receive the papers and other relevant information in advance of the meeting and have the opportunity to discuss with the relevant Chair or the Company Secretary any matters they wish to raise and to follow up on the decisions taken at the meeting. The Chairman, Chief Executive and Company Secretary are always available to discuss issues relating to meetings or other matters
Board balanceThe Board at 31 March 2018 was comprised of the Chairman, two Executive Directors, the GED and six NEDs. The balance of Directors on the Board ensures that no individual or small group of Directors can dominate the decision making process and that the interests of the minority shareholders are protected. Biographies of all Directors are set out on pages 46 and 47.
Board independenceIt is the Company’s policy that at least half the Board should be independent NEDs.
The Board carries out a review of the independence of its Directors on an annual basis. The Board considers each of its current NEDs to be independent in character and judgement. In reaching its determination of independence, the Board has concluded that each provides objective challenge to management, is willing to stand up and defend their own beliefs and viewpoints in order to support the ultimate aims of the Company and there are no business or other
with the Directors. Reasons for non-attendance are generally prior business and personal commitments or illness.
The Board is satisfied that each of the NEDs is able to devote sufficient time to the Company’s business. NEDs are advised on appointment of the time required to fulfil the role and are asked to confirm that they can make the required commitment.
During the year, the Chairman met on several occasions with the NEDs without the Executive Directors present, allowing for more informal discussions on a variety of issues.
Effective management and good stewardship of the Group are led by the Board. A Audit Committee
R Remuneration Committee
N Nomination Committee
B Board Safety Committee
The attendance of Directors at Board and Committee meetings and the number of meetings attended in the year ended 31 March 2018 are shown below:
Board Audit Committee Remuneration Committee Nomination Committee Board Safety Committee
Director
Meetings eligible
to attendMeetings attended
Meetings eligible
to attendMeetings attended
Meetings eligible
to attendMeetings attended
Meetings eligible
to attendMeetings attended
Meetings eligible to
attendMeetings attended
ChairmanWolfhart Hauser N 10 10 6 6
Executive DirectorsTim O’Toole 10 10Matthew Gregory 10 10
Non-Executive DirectorsRichard Adam1 A 7 7 3 3 7 7Warwick Brady 10 10 4 4Jimmy Groombridge2 10 9 2 2Drummond Hall 10 10 8 8 6 6Martha Poulter3 10 9 1 1David Robbie1 A 3 3 1 1 1 1Imelda Walsh R 10 10 8 8 6 6 3 3Jim Winestock B 10 9 4 4 6 6 3 3
1 Richard Adam resigned on 2 February 2018 and was replaced by David Robbie as Chair of the Audit Committee and member of the Remuneration Committee.
2 Jimmy Groombridge joined the Board on 26 May 2017 and his first Board Safety Committee meeting was in November 2017.
3 Martha Poulter was appointed to the Board in May 2017 and joined the Audit Committee in January 2018.
Board Committee Chairmanships
Corporate governance report continuedEffectiveness
FirstGroup Annual Report and Accounts 201854
Induction, Development and Evaluation
Receiving timely information enables the Directors to discharge their duties on strategic, financial, operational, compliance and governance issues effectively.
EvaluationThe Board undertakes regular evaluations of its own performance as well as that of its Committees providing an opportunity to consider ways of identifying greater efficiencies, maximising strengths and highlighting areas for further development.
Following internal reviews in 2015/16 and 2016/17, the Board conducted an externally facilitated review in 2017/18. The results of the performance evaluation were presented and discussed at the May 2018 Board meeting and will be disclosed in the 2018/19 Annual Report and Accounts.
The 2016/17 internal review was led by the Chairman with the support of Company Secretariat. It was carefully structured and pragmatic, designed to bring about a genuine debate on issues that were relevant, check on progress against matters identified in the previous evaluation and assist in identifying any potential for improvement in the Company’s processes. It entailed the completion of a questionnaire to assess the effectiveness of the Board, its Committees and individual Directors, and the preparation of a report. The questionnaire focused on the oversight responsibilities and effectiveness of the Board, the role of the Chairman and the operation of the Committees. It was concluded that the dynamics, culture and effectiveness of the Board had improved and that the individual members of the Board remained effective in their ability to discharge their duties and responsibilities. Each Director continued to make a valuable contribution whilst demonstrating commitment to their role.
Induction and developmentOn appointment, all new Directors receive a comprehensive and structured induction, tailored to their individual requirements. The induction programme, which is arranged by Company Secretariat, includes visits to the Group’s businesses and meetings with senior managers and advisers, as appropriate. The programme is designed to facilitate their understanding of the Group, the key drivers of business performance, the role of the Board and its Committees, the Company’s corporate governance practices and procedures. It also provides them with appropriate training and guidance as to their duties, responsibilities and liabilities as a director of a public limited company. During the year, Martha Poulter, Jimmy Groombridge and David Robbie were supported by Company Secretariat in this regard.
In addition, in order to assist Directors in the performance of their duties, there are procedures in place to provide them with appropriate and timely information, including receiving information between meetings regarding Group business developments and financial performance.
All Directors are provided with training opportunities to ensure they are kept up to date on relevant legal, regulatory and financial developments or changes in best practice. Typical training for Directors includes attendance at seminars, forums, conferences and working groups as well as receiving updates on various legal, regulatory and corporate governance matters.
To ensure the Board as a whole remains fully informed of the views of shareholders, the Board receives regular reports on shareholder sentiment at Board meetings.
All NEDs can attend shareholder meetings and analyst presentations, and shareholders may meet informally with Directors at the AGM.
The Senior Independent Director also led the NEDs in evaluating the performance of the Chairman, with the Chairman showing effectiveness in leadership.
Information and supportThe Company Secretary and the Deputy Company Secretary, through the Chairman, are responsible for advising the Board on all governance matters and for ensuring that Board procedures are followed, applicable rules and regulations are complied with and that due account is taken of relevant codes of best practice. Company Secretariat is also responsible for ensuring communication flows between the Board and its Committees, and between senior management and NEDs. All Directors have access to the advice of the Company Secretary and, in appropriate circumstances, may obtain independent professional advice at the Company’s expense.
All Directors receive detailed papers and other relevant information on the business to be conducted at each Board or Committee meeting well in advance and all Directors have direct access to senior management should they wish to receive additional information on any of the items for discussion. The head of each division attends Board meetings on a regular basis to ensure that the Board is properly informed about the performance of that division and any issues that it faces. Directors are provided between meetings with relevant information on matters affecting the business. Such updates are carried out by a variety of methods, including conference calls and video conferences of the full Board or
The main areas identified for improvement in the 2016/17 internal review and corresponding actions taken during 2017/18 are detailed in the table below:
Area identified Responsibility Action taken
More time to consider investors’ expectations, succession planning and people matters Chairman
Identified topics added to the rolling agenda to become standing items
Provision of supporting papers in a timely manner and presentation less complex Company Secretary
Guidelines and template developed and implemented
Reinforce the work of the Board Safety Committee Board Safety Committee Rolling agenda developed
FirstGroup Annual Report and Accounts 2018 55
Governance
between the Chairman and/or the Chief Executive and the NEDs. Company Secretariat also circulates monthly financial and operational reports as well as papers and updates on relevant issues. Board and Committee papers are delivered securely to the Directors using a fully encrypted electronic portal system which enables a faster and more secure distribution of information.
The Company Secretary is Michael Hampson, who joined the Group in 2016. Michael is secretary to the Remuneration, Nomination and Executive Committees, and his deputy, Silvana Glibota-Vigo, is secretary to the Audit, Board Safety and Executive Safety Committees.
Conflicts of interestThe Directors have a statutory duty under the Companies Act 2006 (the ‘2006 Act’) to avoid situations in which they have or can have a direct or indirect interest that conflicts or may conflict with the interests of the Company. This duty is in addition to the existing duty that a Director owes to the Company to disclose to the Board any transaction or arrangement under consideration by the Company. The Company’s conflict of interest procedures are reflected in the Articles of Association (the ‘Articles’). In line with the 2006 Act, the Articles allow the Directors to authorise conflicts and potential conflicts of interest where appropriate. The decision to authorise a conflict can only be made by non-conflicted Directors. Directors do not participate in decisions concerning their own remuneration or interests.
The Company Secretary minutes the consideration of any conflict or potential conflict of interest and authorisations granted by the Board. On an ongoing basis, the Directors inform the Company Secretary of any new, actual or potential conflict of interest that may arise or if there are any changes in circumstances that may affect an authorisation previously given. Even when authorisation is given, a Director is not absolved from their duty to promote the success of the Company.
Furthermore, the Articles include provisions relating to confidential information, attendance at Board meetings and availability of Board papers to protect a Director from breaching their duty if a conflict of interest arises. These provisions will only apply where the circumstance giving rise to the potential conflict of interest has previously been authorised by the Directors.
The Board considers that the formal procedures for managing conflicts of interest currently in place have operated effectively during the year under review.
Election and re-election of DirectorsDirectors are required under the Articles to submit themselves for election by shareholders at the AGM following their appointment by the Board. Also, in accordance with best practice and the Code, all of our Directors put themselves forward for re-election by shareholders annually.
David Robbie, who was appointed on 2 February 2018, will therefore retire and submit himself for election and all other Directors will submit themselves for re-election at the forthcoming AGM.
Following the formal performance evaluation process, the Chairman is content that all Directors continue to be effective and demonstrate commitment to their role.
Anti-bribery and corruptionThe Group has continued to implement its compliance programmes and specific policies around key legislation (e.g. UK Bribery Act and the Modern Slavery Act), as well as refreshing its programme in response to new legislation and regulation (e.g. the UK Criminal Finances Act). In addition, the Group has developed a new Group-wide Code of Ethics which will be implemented across the operational divisions and support functions during 2018/19. Colleagues in high risk areas have continued to receive training and policy communications to support their ongoing awareness of policies upholding our zero tolerance position on bribery and corruption, including on the giving and receipt of appropriate gifts, hospitality or entertainment. The training is supplemented by a dedicated ethics and compliance section on the Group intranet. There is also an externally managed whistleblowing service available across the Group for colleagues, with a helpline (online and phone-based) for the anonymous reporting of inappropriate conduct. The anti-bribery steering committee has the primary and day-to-day responsibility to ensure that our internal control systems and procedures are effective in countering bribery and corruption. The Group continues to develop its effective systems to counter bribery and corruption, including the introduction of its integrated risk and compliance online tool to monitor the use and awareness of policies and procedures and, to provide management data on compliance risks.
Modern slavery and human trafficking We continue our zero tolerance approach to slavery and human trafficking, which extends to all business dealings and transactions in which we are involved, regardless of location or sector. As part of our contracting processes with suppliers, we include prohibitions against the use of forced, compulsory or trafficked labour, or anyone held in slavery or servitude, whether adults or children. We have continued to implement our Code of Conduct on Anti-Slavery and Human Trafficking Prevention and have required our higher risk UK-based suppliers to provide us with a detailed update on their activities to address the issue in their supply chains. We have included a section on modern slavery in our new Group Code of Ethics, and have also published our second Modern Slavery and Human Trafficking Statement on our Group websites. The statement sets out the steps we took to address this issue during the previous financial year, and sets goals for the current one. We will publish an updated statement for the year ended 31 March 2018 on our Group websites in due course. We remain committed to strengthening our practices in this area, both within our own business and across our supply chains.
Brexit Steering CommitteeThe Committee, which was formed in 2016 to monitor the potential impact of Brexit, met on two occasions during the year and reported to the Board via the CFO and the Company Secretary, where appropriate.
Corporate governance report continuedPolicies and Compliance
FirstGroup Annual Report and Accounts 201856

Accountability
The Board is responsible for promoting the long term success of the Company for the benefit of shareholders and other stakeholders.
The Board confirms that throughout the year ended 31 March 2018 and up to the date of approval of this Annual Report and Accounts, there have been rigorous processes in place to identify, evaluate and manage the principal risks faced by the Group, including those that would threaten its business model, future performance, solvency or liquidity in accordance with the Guidance on Risk Management and Internal Control published by the Financial Reporting Council.
To assist in the identification and management of the Group’s principal risks, the Board has:
■■ established a risk management framework■■ developed a system of regular reports from management
■■ reserved specific key matters for its decision■■ authorised the Audit Committee to oversee the risk management framework and the effectiveness of the Group’s financial reporting, internal control and assurance systems
■■ established a number of Group-wide procedures, policies and standards
■■ set up a framework for reporting matters of significance
■■ authorised the Board Safety Committee to oversee the Group’s framework of safety policies and procedures to manage risk
Key elements of the Group’s system of internal control which have operated throughout the year are:
■■ a clearly defined organisation structure with established responsibilities
■■ a focused business strategy, thus restricting potential risk exposures
■■ Group financial, treasury, operating, compliance and administrative policies and procedures which incorporate statements of required behaviour
■■ ongoing review of safety, operating and financial performance of the Group’s businesses
■■ regular reports to the Board, Board Safety Committee and Executive Safety Committee on safety matters
The Board ensures that an appropriate system of governance is in place throughout the Group. To discharge this responsibility, the Board has established a framework for risk management and internal control which identifies, evaluates and manages the principal risks associated with the Group’s achievement of its business objectives, with a view to safeguarding shareholders’ investment and the Group’s assets.
The Board considers the Annual Report and Accounts, taken as a whole, to be fair, balanced and understandable and provides the necessary information required for shareholders to assess the Company’s position and performance, business model and strategy, and that the business continues to operate as a going concern. The co-ordination and review of the Annual Report and Accounts follows a well-established and documented process, which is conducted in parallel with the formal audit process undertaken by the external auditor and the review by the Board and its Committees.
Internal controlThe Board is responsible for determining the nature and extent of any significant risks the Group is willing to take in order to achieve its strategic objectives and for maintaining sound risk management and internal control systems to ensure that an appropriate culture is embedded throughout the Group. The Board has established a Group-wide system of risk management and internal control that identifies and enables management and the Board to evaluate and manage the Group’s principal risks with a view to safeguarding the Group’s stakeholders. This system is bespoke to the Company’s particular needs and the risks to which it is exposed and is designed to manage, rather than eliminate, risk. Owing to the limitations inherent in any system of internal control, this system provides robust, but not absolute, assurance against material misstatement or loss. The effectiveness of the Group’s system of internal control is regularly reviewed by the Board.
■■ monitoring by the Board of a comprehensive reporting system, including monthly results, periodic short term forecasts, annual budgets and a medium term business plan
■■ well-defined procedures for the assessment, approval, control and monitoring of major investments, with proposals being subject to rigorous strategic, financial and commercial examination
■■ divisions identifying and reviewing their principal risks and controls for monitoring and managing risks, which are reviewed by senior executive management. The updated divisional and Group risk profiles, which are reviewed by the Chief Executive and CFO, are presented to the Executive Committee prior to being assessed by the Audit Committee
■■ an established methodology for ranking the level of risk in each of its business operations and the principal risk issues associated therewith
■■ implementation of appropriate strategies to deal with principal risks, including careful internal monitoring and ensuring external specialists are consulted where necessary
■■ a centrally co-ordinated internal audit programme to verify that policies and internal control procedures are being correctly implemented and to identify any risks at an early stage
■■ reviewing and monitoring the confidential reporting system to allow employees to raise concerns about possible legal, regulatory, financial reporting or any other improprieties
■■ regular reports to the Audit Committee on the adequacy and effectiveness of internal controls
■■ a remuneration policy for executives that motivates them, without delivering excessive benefits or encouraging excessive risk-taking
FirstGroup Annual Report and Accounts 2018 57
Governance
Twice a year the Board is presented with an update for its robust assessment on the principal risks facing the Group together with a risk map, highlighting any changes made since the previous update and the reasons for any changes. Each Committee that reports regularly to the Board provides an update on the status of risks considered within its remit. Biannually, the Group’s risk management framework is robustly reviewed by the Audit Committee, together with the process for identifying and assessing risks and a detailed analysis of the risks identified in the previous six months.
Reviews of internal controls within operating units by internal audit have sometimes highlighted control weaknesses, which are discussed with management and, where appropriate, the Audit Committee, and remedial action plans are agreed. Action plans are monitored by internal audit and, in some cases, follow up visits to the operating entity are conducted until such time as the controls that have been put in place are working effectively. No material losses, contingencies or uncertainties that would require disclosure in the Annual Report and Accounts have been identified during the year by this process.
The Board, in conjunction with management, continually reviews and develops the internal control environment. No significant internal control failings were identified during the year. Where any gaps are identified, processes are put in place to address them and these are continually monitored.
The process is designed to provide assurance by way of cumulative assessment. It is a risk-based approach.
Internal auditInternal audit advises management on the extent to which systems of internal control are adequate and effective to manage business risk, safeguard the Group’s resources, and ensure compliance with the Group’s policies and legal and regulatory requirements as well as advising on ways in which areas of risk can be addressed. It provides objective assurance on risk and controls to senior management, the Audit Committee and the Board. Internal audit’s work is focused on the Group’s principal risks. The mandate and programme of work of the internal audit department is considered and approved by the Audit Committee. Based on the approved internal audit plan, a number of internal audits took place across the Group’s divisions to facilitate improvement of the Group’s internal controls and findings were reported to relevant operational management and to the Audit Committee. Internal audit follows up on the
implementation of recommendations and reports on progress to senior management and to the Audit Committee.
The Group Director of Assurance reports regularly to the Chair of the Audit Committee and attends each Audit Committee meeting to present the internal control findings from the internal audits performed. The Audit Committee reviews and discusses the effectiveness of internal audits on an annual basis with the Group Director of Assurance. This is done by the review of the internal audit plan of work for the year and monitoring progress against the plan and actions identified by internal audit. The Group Director of Assurance meets with the Audit Committee every time the Committee meets, without management present.
Financial and business reportingIn its reporting to shareholders the Board recognises its responsibility to present a fair, balanced and understandable assessment of the Group’s position and prospects. This responsibility encompasses all published information including, but not limited to: the year end and half-yearly financial statements; regulatory news announcements; and other public information.
The quality of the Company’s reporting is ensured by having in place procedures for the review of information by management. There are also strict procedures determining who has authority to release information. A statement of the Directors’ responsibilities for preparing the financial statements can be found on page 98.
The Group adopts a financial reporting and information system that complies with generally accepted accounting practice. The Group Finance Manual details the Group’s accounting policies and procedures with which subsidiaries must comply. Budgets are prepared by subsidiary company management which are then consolidated into divisional budgets. These are subject to review by both senior management and the Executive Directors followed by formal approval by the Board. Regular forecast updates are completed during the year and compared against actions required. Each subsidiary unit prepares a monthly report of operating performance with a commentary on variances against budget and the prior year, which is reviewed by senior management. Similar reports are prepared at a Group level. Key performance indicators, both financial and operational, are monitored on a weekly basis. In addition, business units participate in strategic reviews, which include consideration of long term financial projections and the evaluation of business alternatives.
Treasury operationsThe Board has set a policy for the management of the risks from treasury operations and this is set out in more detail in note 24 to the consolidated financial statements. A Group Treasury Policy has been formulated and adopted to ensure compliance with best practice and to control and monitor effectively the risks attendant upon treasury and banking operations. In addition, the treasury committee approves decisions regarding fuel, foreign exchange and other matters reserved for its decision.
Tax strategyWe believe we have a responsibility to manage our tax affairs in a way that sustainably benefits the customers and communities that we serve. We also have a responsibility to shareholders to ensure we pay the right amount of tax and ensure compliance with the tax rules in each country in which we operate. Our Tax Strategy was approved by the Board in March 2018 and is available on our website. The Board receives regular updates on taxation matters through the Audit Committee.
Payments policyWe recognise the importance of good supplier relationships to the overall success of our business. We manage dealings with suppliers in a fair, consistent and transparent manner and the Group has controls in place to ensure that all payments are made within the appropriate credit timeframe. The average credit period taken for trade purchases is 29 days (2017: 32 days).
Relations with shareholdersThe Board welcomes the opportunity to openly and purposefully engage with shareholders and it recognises the importance of a continuing effective dialogue, whether with institutional shareholders, private or employee shareholders. The Board takes responsibility for ensuring that such dialogue takes place. The Chief Executive and CFO are closely involved in investor relations, and the Group Corporate Services Director has day-to-day responsibility for such matters. Feedback from shareholders and the financial markets is provided at scheduled Board meetings and at other times, as appropriate.
The Executive Directors are available, through the Group Corporate Services Director, to discuss the concerns of major shareholders at any time during the year and the Chairman is available to discuss governance and strategy with major shareholders. The Senior Independent Director is available to discuss matters of concern that would not be appropriate through normal channels of communication, including issues relating to
Corporate governance report continuedAccountability continued
FirstGroup Annual Report and Accounts 201858
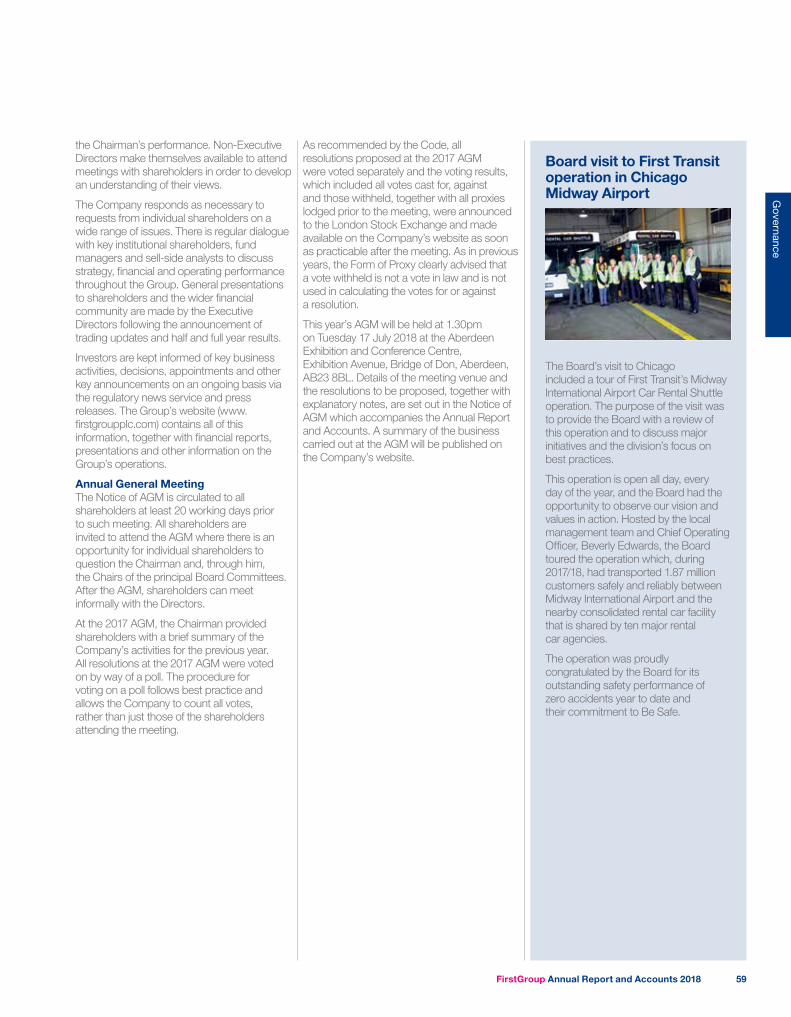
As recommended by the Code, all resolutions proposed at the 2017 AGM were voted separately and the voting results, which included all votes cast for, against and those withheld, together with all proxies lodged prior to the meeting, were announced to the London Stock Exchange and made available on the Company’s website as soon as practicable after the meeting. As in previous years, the Form of Proxy clearly advised that a vote withheld is not a vote in law and is not used in calculating the votes for or against a resolution.
This year’s AGM will be held at 1.30pm on Tuesday 17 July 2018 at the Aberdeen Exhibition and Conference Centre, Exhibition Avenue, Bridge of Don, Aberdeen, AB23 8BL. Details of the meeting venue and the resolutions to be proposed, together with explanatory notes, are set out in the Notice of AGM which accompanies the Annual Report and Accounts. A summary of the business carried out at the AGM will be published on the Company’s website.
the Chairman’s performance. Non-Executive Directors make themselves available to attend meetings with shareholders in order to develop an understanding of their views.
The Company responds as necessary to requests from individual shareholders on a wide range of issues. There is regular dialogue with key institutional shareholders, fund managers and sell-side analysts to discuss strategy, financial and operating performance throughout the Group. General presentations to shareholders and the wider financial community are made by the Executive Directors following the announcement of trading updates and half and full year results.
Investors are kept informed of key business activities, decisions, appointments and other key announcements on an ongoing basis via the regulatory news service and press releases. The Group’s website (www.firstgroupplc.com) contains all of this information, together with financial reports, presentations and other information on the Group’s operations.
Annual General MeetingThe Notice of AGM is circulated to all shareholders at least 20 working days prior to such meeting. All shareholders are invited to attend the AGM where there is an opportunity for individual shareholders to question the Chairman and, through him, the Chairs of the principal Board Committees. After the AGM, shareholders can meet informally with the Directors.
At the 2017 AGM, the Chairman provided shareholders with a brief summary of the Company’s activities for the previous year. All resolutions at the 2017 AGM were voted on by way of a poll. The procedure for voting on a poll follows best practice and allows the Company to count all votes, rather than just those of the shareholders attending the meeting.
Board visit to First Transit operation in Chicago Midway Airport
The Board’s visit to Chicago included a tour of First Transit’s Midway International Airport Car Rental Shuttle operation. The purpose of the visit was to provide the Board with a review of this operation and to discuss major initiatives and the division’s focus on best practices.
This operation is open all day, every day of the year, and the Board had the opportunity to observe our vision and values in action. Hosted by the local management team and Chief Operating Officer, Beverly Edwards, the Board toured the operation which, during 2017/18, had transported 1.87 million customers safely and reliably between Midway International Airport and the nearby consolidated rental car facility that is shared by ten major rental car agencies.
The operation was proudly congratulated by the Board for its outstanding safety performance of zero accidents year to date and their commitment to Be Safe.
FirstGroup Annual Report and Accounts 2018 59
Governance
Corporate governance report continuedNomination Committee report
The Committee is primarily responsible for leading the process for appointments to the Board and reviewing the composition of the Committees.
In terms of how the Committee operates, if a matter were to concern the Committee Chair, then he would leave the meeting and the Senior Independent Director would instead take the Chair. The Chief Executive attends meetings of the Committee upon invitation. Committee members take no part in any discussions concerning their own membership of the Board or appointment as a Chair of a Committee, but are involved in the recommendations on Committee membership changes. The General Counsel & Company Secretary acts as the Committee Secretary.
Activities during the yearDuring the year, the Committee kept under review the balance of skills, experience, independence, knowledge and diversity (including gender), on the Board to ensure the orderly evolution of the membership of the Board and its Committees. In identifying and nominating candidates for approval by the Board, the Committee tried to ensure that the right people with the right range of skills and experience are on the Board and in senior management positions in the coming years.
Recruitment of Non-Executive DirectorsWhen considering the recruitment of a new Director, the Committee adopts a formal, rigorous and transparent procedure with due regard to diversity. Prior to making an appointment, the Committee evaluates the balance of skills, knowledge, independence, experience and diversity on the Board and, in light of this evaluation, prepares a full description of the role and capabilities required. In identifying suitable candidates, the Committee:
The Committee ensures that the right people with the right range of skills and experience are on the Board.
“
Role and responsibilities■■ Regular review of the structure, size and composition (including skills, experience, independence, knowledge and diversity) of the Board and recommendation for change
■■ Identification and nomination of candidates to fill Board vacancies, including that of the Senior Independent Director
■■ Regular review of membership of the Board Committees and recommendation for change
■■ Ensuring that Board and executive leadership skills are fully aligned to the Company’s long term strategy
■■ Oversight of succession planning for Directors and other senior executives
■■ Assessing the time commitment of candidates to Board positions
■■ Recommendation of re-appointment of any Non-Executive Director at the conclusion of their specified term of office
■■ Recommendation of appointment of the Group Employee Director upon nomination by the Employee Directors’ Forum
■■ Recommendation of re-election by shareholders of any Director
■■ Formal reporting to the Board, performance evaluation and terms of reference
The full terms of reference of the Committee can be found on the Company’s website.
Wolfhart HauserChair, Nomination Committee
Membership and operation
Committee memberMeetingsattended
OtherCommittees/Roles Independent
Wolfhart Hauser (Chair) 6 Company Chairman Yes, on appointmentDrummond Hall 6 Senior Independent Director
Remuneration Committee Yes
Imelda Walsh 6 Chair of Remuneration Committee Board Safety Committee
Yes
Jim Winestock 6 Chair of Board Safety CommitteeAudit Committee
Yes
FirstGroup Annual Report and Accounts 201860
■■ uses open advertising or the services of external advisers to facilitate the search
■■ considers candidates from different genders and a wide range of backgrounds
■■ considers candidates on merit and against objective criteria ensuring that appointees have sufficient time to devote to the position, in light of other potential significant positions
■■ engages from time to time with the Group’s major shareholders on future skills requirements and experience in respect of potential candidates
Where the Committee appoints external advisers to facilitate the search, it ensures that the firm selected has signed up to the relevant industry codes (for example, on diversity) and has no connection with the Company.
The appointments of Martha Poulter and Jimmy Groombridge took place during this financial year but we reported on those in last year’s annual report.
Richard Adam announced he was stepping down in September 2017. The Committee then began a comprehensive and rigorous search, with a candidate profile and position specification drawn up. JCA Group, a global executive search firm with no other connection with the Company, was engaged to assist with the selection process and conducted searches to identify suitable, qualified candidates. A number of interviews and meetings were held with shortlisted candidates. The appointment of David Robbie was then recommended to the Board for approval as he fully met the criteria required. David joined the Board on 2 February 2018 and was appointed to chair the Audit Committee. Later in the year, David joined the Remuneration Committee, upon the Committee’s recommendation.
DiversityThe Committee and the Board consider diversity as an important factor when reviewing the composition of the Boards. The Committee views diversity in its wider sense, including gender, length of tenure and nationality.
The Board consists of Directors with a wide range of skills and business experience drawn from a number of industries, which is vital for bringing both the expertise required and to enable different perspectives to be brought to Board and Committee discussions.
Furthermore, the Board comprises a range of nationalities, which bring cultural diversity as well as different geographical experiences and viewpoints. The combination of these factors
means that the Board benefits from a diverse range of competencies, perspectives and thoughts, which provides a dynamic environment for decision making.
Whilst the Board at 31 March 2018 is below its target of 25% female representation at 20%, it remains committed to achieving that goal as soon as practicable. The Board remains of the opinion that appointments should be made on merit and relevant experience, against the criteria identified by the Committee. Future appointments to the Board must also complement the balance of skills the Board already possesses.
The Board recognises the need to create the conditions that foster talent and encourage more women and people from diverse backgrounds to achieve their full potential in their careers in the Group. The Board also welcomes the recommendations of the Hampton-Alexander and Parker reports. In that sense, as part of an overall approach to HR management, a framework has been developed which includes an Equality, Diversity and Inclusion Policy as well as practical training materials and support for line managers to promote its communication across the Group. Further details on the Group’s approach to diversity are set out in the Corporate responsibility section on page 27.
Looking ahead to 2018/19In the coming year, we will continue to monitor the needs of the Board and its Committees, with the aim of ensuring the Group’s succession planning policy is aligned to, and evolves to meet, the ongoing business objectives and strategic goals of the Group.
We will also continue with the process to select a new Chief Executive following the departure of Tim O’Toole on 31 May 2018.
Summary of Committee Activities during the year
May 2017Jimmy Groombridge – recommendation for appointment
Martha Poulter – recommendation for appointment
November 2017Internal performance evaluation – review of results
Terms of reference annual review
December 2017Committee composition review
January 2017Board composition review
Martha Poulter joins Audit Committee
February 2018David Robbie – recommendation for appointment
March 2018David Robbie joins Remuneration Committee
FirstGroup Annual Report and Accounts 2018 61
Governance
Corporate governance report continuedAudit Committee report
David Robbie has recent and relevant financial experience for the purposes of the Code, being a chartered accountant and having held a number of senior finance roles. The other Committee members have significant current or recent executive experience in the transport and distribution industries, as well as in IT. The range and depth of financial, commercial and IT experience in the Committee enable its members to deal effectively with the matters the Committee is required to address.
The Group Chairman, the Chief Executive, the CFO, the General Counsel & Company Secretary, the Director of Finance, the Group Director of Assurance, the Group Financial Controller and Deloitte LLP (Deloitte) are normally invited to attend Committee meetings, as well as other members of the Board. The Deputy Company Secretary acts as Committee Secretary.
At the end of each meeting, the Committee meets with the external auditor and the Group Director of Assurance, without management present, to discuss any matters relating to their remit and any matters arising from external and internal audits. These discussions help shape thought processes and decision making, and promote a more rounded view of the Group.
Activities during the yearDuring the year, the Committee has continued to devote significant time to reviewing the integrity of the Group’s financial statements, including the significant financial reporting judgements, as well as reviewing internal controls, and the effectiveness of both internal and external audit. The table on page 63 provides further information on the year’s activities.
Looking ahead to 2018/19In addition to its routine business, the Committee has the following focus areas for 2018/19:
■■ Plan for the tender of the external audit service
■■ Further develop the structure and effectiveness of the risk management system and process
I am pleased to present my first report as Chair of the Audit Committee. This Committee acts independently of management to ensure that the interests of shareholders are properly protected in relation to financial reporting, internal control and risk management.
“
Membership and operation
Committee memberMeetingsattended
OtherCommittees/Roles Independent
David Robbie1 (Chair) 1 Remuneration Committee YesWarwick Brady 4 YesMartha Poulter2 1 YesJim Winestock 4 Chair of Board Safety Committee
Nomination CommitteeYes
1 David Robbie was appointed on 2 February 2018.
2 Martha Poulter joined the Committee in January 2018.
Role and responsibilities■■ Monitor and challenge the integrity of the financial statements of the final and half-yearly results
■■ Review and challenge the actions and judgements of management taking into account the views of the external auditor
■■ Review the Company’s internal controls, including financial controls and risk management systems
■■ Approve the internal audit plan and monitor the role and effectiveness of the internal audit function
■■ Oversee the Company’s relationship with the external auditor, including:■■ independence and expertise■■ engagement terms and fees■■ effectiveness of the audit process■■ annual audit plan scope and output■■ policy on the provision of non-audit services
■■ appointment, re-appointment, dismissal or resignation of the external auditor
■■ review of plans regarding mandatory competitive tendering process
■■ Reporting formally to the Board, performance evaluation and terms of reference.
The full terms of reference of the Committee can be found on the Company’s website.
David RobbieChair, Audit Committee
FirstGroup Annual Report and Accounts 201862
Summary of Committee activities during the year
The Committee:May
2017Sep
2017Nov
2017Mar
2018
Financial Reportingreviewed the Group’s final and half-yearly results, considered the significant accounting policies, principal estimates and accounting judgements used in their preparation, the transparency and clarity of disclosures within them, and compliance with financial reporting standards and governance
reviewed the matters which informed the Board’s assessment that it was appropriate to prepare accounts on a going concern basis
reviewed the process for assessing the long term viability of the Company
received reports from management and Deloitte on accounting, financial reporting regulation and taxation issues
reviewed reports from Deloitte on its audit in respect of the final and half-yearly results prior to them being approved by the Board
reviewed and assessed the process by which the Annual Report and Accounts, taken as a whole, was fair, balanced and understandable and provided the information necessary for shareholders to assess the Company’s position and performance, business model and strategy
Internal control, risk management and internal auditreviewed the structure and effectiveness of the Group’s system of risk management and internal control and the disclosures made in the Annual Report and Accounts on this matter
reviewed the Group’s risk management activities undertaken by the divisions and at Group level in order to identify, measure and assess the Group’s principal risks and review the risk appetite statement, developed by management, for recommendation to the Board
reviewed the effectiveness of the Group’s risk management framework, and reports arising from the risk management process
approved the annual internal audit plan and reviewed reports from the internal audit department relating to control matters, monitored progress against the internal audit plan and any deviations to the plan were agreed
monitored and assessed the Group’s insurance arrangements
considered reports from the General Counsel & Company Secretary on litigation matters
External auditapproved the terms of engagement of Deloitte, the fees paid to it and the scope of work carried out by it
performed an annual review of the policies on the independence and objectivity of Deloitte, the use of Deloitte for non-audit services and the employment of former employees of Deloitte
reviewed the performance and effectiveness of Deloitte in respect of the previous financial year
assessed the objectivity and independence of Deloitte
received reports on the findings of Deloitte during the half-yearly review and annual audit, and reviewed the recommendations made to management by Deloitte and management’s responses
reviewed the external audit plan
reviewed letters of representation to Deloitte
recommended the re-appointment of Deloitte
Other mattersreviewed its terms of reference and the results of its performance evaluation, including effectiveness
received reports from divisional and functional management on a range of financial, operational, risk management, legal and corporate governance matters
received reports from the Chief Information Officer on cyber security
received reports on matters raised on the confidential whistleblowing system and the process for the investigation of such matters, ensuring that the arrangements in place were appropriate for employees to confidentially raise concerns about possible legal, regulatory or other improprieties
FirstGroup Annual Report and Accounts 2018 63
Governance
Corporate governance report continuedAudit Committee report continued
Auditor independence and objectivityThe independence of the external auditor is essential to the provision of an objective opinion on the true and fair view presented in the financial statements. The external auditor’s independence and objectivity are safeguarded by a number of control measures:
■■ limiting the nature of non-audit services performed by the external auditor
■■ placing restrictions on the employment by the Group of certain employees of the external auditor
■■ monitoring the changes in legislation related to auditor objectivity and independence to help ensure the Company remains compliant
■■ providing a confidential helpline that employees can use to report any concerns, including those relating to the relationship between Group employees and the external auditor
■■ the rotation of the lead auditor partner after five years
■■ independent reporting lines from the external auditor to the Committee and the opportunity to meet the Committee independently
■■ an annual review by the Committee of the policy in place to ensure the objectivity and independence of the external auditor is maintained
Internal control and risk managementDuring the year, the Committee reviewed the requirements of the Code in relation to the assessment and reporting of longer term viability, risk management and internal control. The Committee assessed the Group’s risk management methodology, which is used to identify and manage the principal risks, as well as the reporting and categorisation of Group risks. The Committee also reviewed the process for assessing the principal risks that could threaten the Company’s business model, future performance, solvency or liquidity in order to make the long term viability statement on page 44 and considered the appropriate period for which the Company was viable. Key external audit findings and management actions were discussed as well as reports on the outcomes of internal audit planned activities. The operation and effectiveness of the internal audit function were also reviewed, including its focus, plans and resources. The Committee monitored the progress of action plans to ensure they were completed satisfactorily.
The Company’s policies on financial risk management, including the Company’s exposure to liquidity risk, credit risk and certain market-based risks including foreign exchange rates, interest rates and fuel prices, can be found in note 24 to the consolidated financial statements.
Assessing the effectiveness of the external audit processDuring 2017/18, the effectiveness of the external audit process was reviewed by the Committee and the findings reported to the Board. The review involved an initial assessment of the delivery and performance of the external auditor against the external audit plan for the year. An annual assessment was then carried out by the Committee, taking into account the results of questionnaires completed by each of the divisions and Group management functions. These questionnaires covered a variety of topics including:
■■ the audit partners and team■■ the planning and execution of the audit approach
■■ insights and added value provided by the audit process
Feedback from the annual assessment was shared with the external auditor so that any areas for improvement could be followed up. The Committee concluded that the external audit process was effective.
Having reviewed the independence, objectivity and performance of the external auditor, the Audit Committee has recommended to the Board that Deloitte be re-appointed. Ordinary resolutions re-appointing Deloitte as auditor and authorising the Directors to set their remuneration will be proposed at the 2018 AGM.
External audit tenderingThe current external auditor, Deloitte, was appointed in 1998 following a full tendering process. The Committee has undertaken a review of Deloitte’s performance every year since its appointment. The Committee, which remains satisfied with Deloitte’s performance, believes that consistency of approach in the audit is of particular importance as the Group returns to a leadership position. It remains the Committee’s intention to put the external audit out to tender during the lead audit partner’s five-year tenure, which is due to expire at the conclusion of the 2019/20 audit. This means that the external audit will be put out to tender in 2019 so that the process is completed by the conclusion of the 2019/20 audit. This approach is in accordance with the
EU audit reform legislation and the Statutory Audit Services for Large Companies Market Investigation (Mandatory Use of Competitive Tender Processes and Audit Committee Responsibilities) Order 2014.
The lead audit partner is Mark Mullins.
Audit informationThe Directors who held office at 31 May 2018 confirm that so far as they each are aware, there is no relevant audit information (being information needed by the auditor in connection with preparing their audit report), of which the Company’s auditor is unaware, and each of the Directors has taken all the steps that they ought reasonably to have taken as a Director in order to make themselves aware of any relevant audit information and to establish that the Company’s auditor is aware of that information.
This confirmation is given and should be interpreted in accordance with the provisions of section 418 of the 2006 Act.
Committee effectiveness reviewThe effectiveness of the Committee was evaluated during the year as part of the Board evaluation process. Further details can be found on page 55. The review found that the Committee was operating effectively and its role and remit remained appropriate for the current needs of the business. In order to identify opportunities for further improvement, members discuss how the Committee is functioning in the private sessions that follow each meeting.
Significant issuesThe external audit process identifies significant issues and accounting estimates and judgements which are reviewed by the Committee. These are summarised in the table on page 65. Management prepared papers and analysis on the significant issues and judgements which were discussed in Committee meetings during the year. The Committee also discussed these issues with the external auditor at the half year and year end. All the significant issues were also areas of focus for the external auditor as detailed in the auditor’s report on page 157.
FirstGroup Annual Report and Accounts 201864
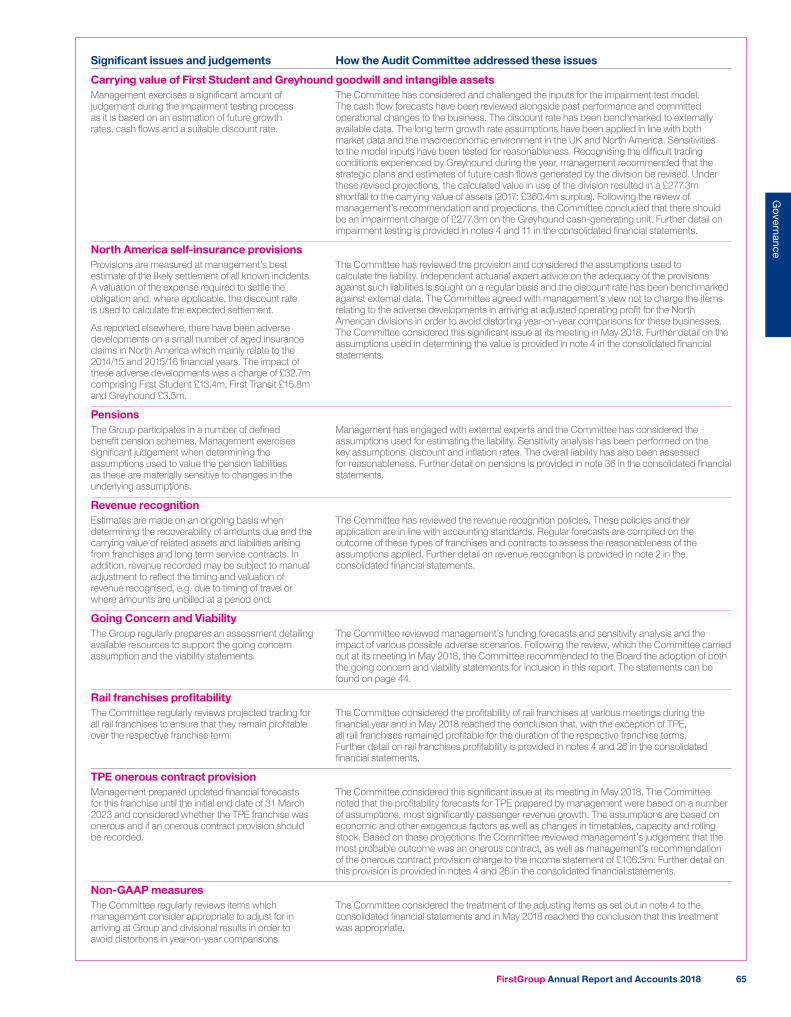
Significant issues and judgements How the Audit Committee addressed these issues
Carrying value of First Student and Greyhound goodwill and intangible assetsManagement exercises a significant amount of judgement during the impairment testing process as it is based on an estimation of future growth rates, cash flows and a suitable discount rate.
The Committee has considered and challenged the inputs for the impairment test model. The cash flow forecasts have been reviewed alongside past performance and committed operational changes to the business. The discount rate has been benchmarked to externally available data. The long term growth rate assumptions have been applied in line with both market data and the macroeconomic environment in the UK and North America. Sensitivities to the model inputs have been tested for reasonableness. Recognising the difficult trading conditions experienced by Greyhound during the year, management recommended that the strategic plans and estimates of future cash flows generated by the division be revised. Under these revised projections, the calculated value in use of the division resulted in a £277.3m shortfall to the carrying value of assets (2017: £360.4m surplus). Following the review of management’s recommendation and projections, the Committee concluded that there should be an impairment charge of £277.3m on the Greyhound cash-generating unit. Further detail on impairment testing is provided in notes 4 and 11 in the consolidated financial statements.
North America self-insurance provisionsProvisions are measured at management’s best estimate of the likely settlement of all known incidents. A valuation of the expense required to settle the obligation and, where applicable, the discount rate is used to calculate the expected settlement.
As reported elsewhere, there have been adverse developments on a small number of aged insurance claims in North America which mainly relate to the 2014/15 and 2015/16 financial years. The impact of these adverse developments was a charge of £32.7m comprising First Student £13.4m, First Transit £15.8m and Greyhound £3.5m.
The Committee has reviewed the provision and considered the assumptions used to calculate the liability. Independent actuarial expert advice on the adequacy of the provisions against such liabilities is sought on a regular basis and the discount rate has been benchmarked against external data. The Committee agreed with management’s view not to charge the items relating to the adverse developments in arriving at adjusted operating profit for the North American divisions in order to avoid distorting year-on-year comparisons for these businesses. The Committee considered this significant issue at its meeting in May 2018. Further detail on the assumptions used in determining the value is provided in note 4 in the consolidated financial statements.
Pensions The Group participates in a number of defined benefit pension schemes. Management exercises significant judgement when determining the assumptions used to value the pension liabilities as these are materially sensitive to changes in the underlying assumptions.
Management has engaged with external experts and the Committee has considered the assumptions used for estimating the liability. Sensitivity analysis has been performed on the key assumptions: discount and inflation rates. The overall liability has also been assessed for reasonableness. Further detail on pensions is provided in note 36 in the consolidated financial statements.
Revenue recognition Estimates are made on an ongoing basis when determining the recoverability of amounts due and the carrying value of related assets and liabilities arising from franchises and long term service contracts. In addition, revenue recorded may be subject to manual adjustment to reflect the timing and valuation of revenue recognised, e.g. due to timing of travel or where amounts are unbilled at a period end.
The Committee has reviewed the revenue recognition policies. These policies and their application are in line with accounting standards. Regular forecasts are compiled on the outcome of these types of franchises and contracts to assess the reasonableness of the assumptions applied. Further detail on revenue recognition is provided in note 2 in the consolidated financial statements.
Going Concern and ViabilityThe Group regularly prepares an assessment detailing available resources to support the going concern assumption and the viability statements.
The Committee reviewed management’s funding forecasts and sensitivity analysis and the impact of various possible adverse scenarios. Following the review, which the Committee carried out at its meeting in May 2018, the Committee recommended to the Board the adoption of both the going concern and viability statements for inclusion in this report. The statements can be found on page 44.
Rail franchises profitabilityThe Committee regularly reviews projected trading for all rail franchises to ensure that they remain profitable over the respective franchise term.
The Committee considered the profitability of rail franchises at various meetings during the financial year and in May 2018 reached the conclusion that, with the exception of TPE, all rail franchises remained profitable for the duration of the respective franchise terms. Further detail on rail franchises profitability is provided in notes 4 and 26 in the consolidated financial statements.
TPE onerous contract provisionManagement prepared updated financial forecasts for this franchise until the initial end date of 31 March 2023 and considered whether the TPE franchise was onerous and if an onerous contract provision should be recorded.
The Committee considered this significant issue at its meeting in May 2018. The Committee noted that the profitability forecasts for TPE prepared by management were based on a number of assumptions, most significantly passenger revenue growth. The assumptions are based on economic and other exogenous factors as well as changes in timetables, capacity and rolling stock. Based on these projections the Committee reviewed management’s judgement that the most probable outcome was an onerous contract, as well as management’s recommendation of the onerous contract provision charge to the income statement of £106.3m. Further detail on this provision is provided in notes 4 and 26 in the consolidated financial statements.
Non-GAAP measuresThe Committee regularly reviews items which management consider appropriate to adjust for in arriving at Group and divisional results in order to avoid distortions in year-on-year comparisons.
The Committee considered the treatment of the adjusting items as set out in note 4 to the consolidated financial statements and in May 2018 reached the conclusion that this treatment was appropriate.
FirstGroup Annual Report and Accounts 2018 65
Governance
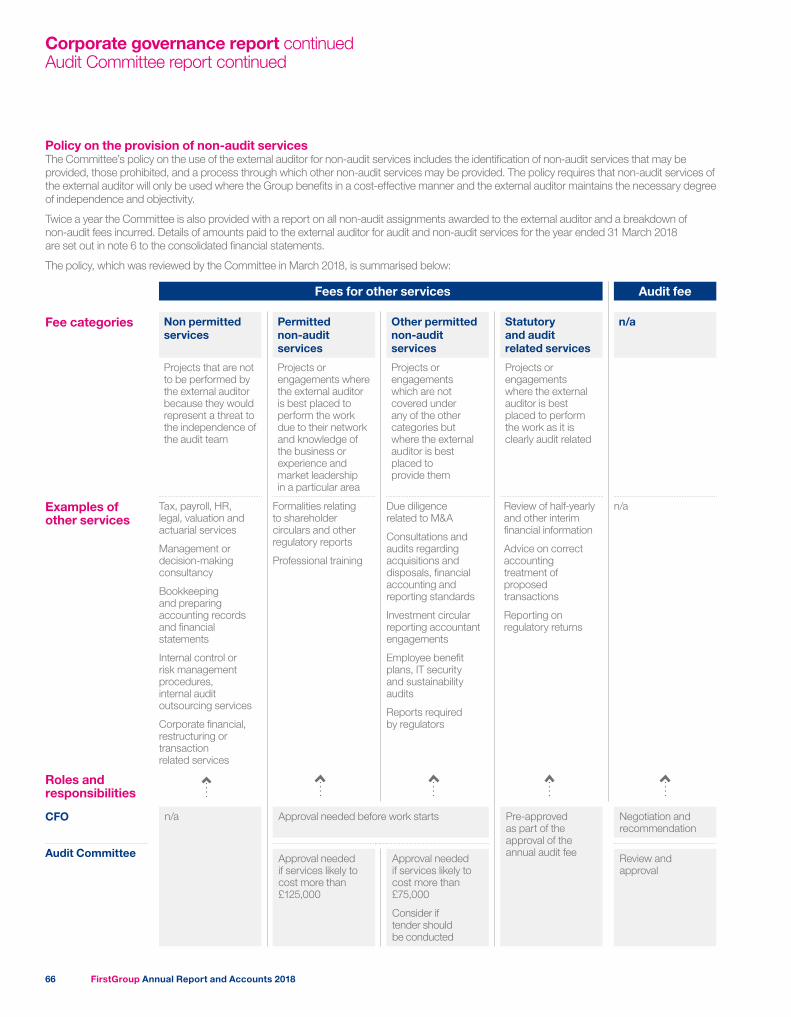
Corporate governance report continuedAudit Committee report continued
Policy on the provision of non-audit servicesThe Committee’s policy on the use of the external auditor for non-audit services includes the identification of non-audit services that may be provided, those prohibited, and a process through which other non-audit services may be provided. The policy requires that non-audit services of the external auditor will only be used where the Group benefits in a cost-effective manner and the external auditor maintains the necessary degree of independence and objectivity.
Twice a year the Committee is also provided with a report on all non-audit assignments awarded to the external auditor and a breakdown of non-audit fees incurred. Details of amounts paid to the external auditor for audit and non-audit services for the year ended 31 March 2018 are set out in note 6 to the consolidated financial statements.
The policy, which was reviewed by the Committee in March 2018, is summarised below:
Fees for other services Audit fee
Fee categories Non permitted services
Permitted non-audit services
Other permitted non-audit services
Statutory and audit related services
n/a
Projects that are not to be performed by the external auditor because they would represent a threat to the independence of the audit team
Projects or engagements where the external auditor is best placed to perform the work due to their network and knowledge of the business or experience and market leadership in a particular area
Projects or engagements which are not covered under any of the other categories but where the external auditor is best placed to provide them
Projects or engagements where the external auditor is best placed to perform the work as it is clearly audit related
Examples of other services
Tax, payroll, HR, legal, valuation and actuarial services
Management or decision-making consultancy
Bookkeeping and preparing accounting records and financial statements
Internal control or risk management procedures, internal audit outsourcing services
Corporate financial, restructuring or transaction related services
Formalities relating to shareholder circulars and other regulatory reports
Professional training
Due diligence related to M&A
Consultations and audits regarding acquisitions and disposals, financial accounting and reporting standards
Investment circular reporting accountant engagements
Employee benefit plans, IT security and sustainability audits
Reports required by regulators
Review of half-yearly and other interim financial information
Advice on correct accounting treatment of proposed transactions
Reporting on regulatory returns
n/a
Roles and responsibilities
CFO n/a Approval needed before work starts Pre-approved as part of the approval of the annual audit fee
Negotiation and recommendation
Audit Committee Approval needed if services likely to cost more than £125,000
Approval needed if services likely to cost more than £75,000
Consider if tender should be conducted
Review and approval
FirstGroup Annual Report and Accounts 201866
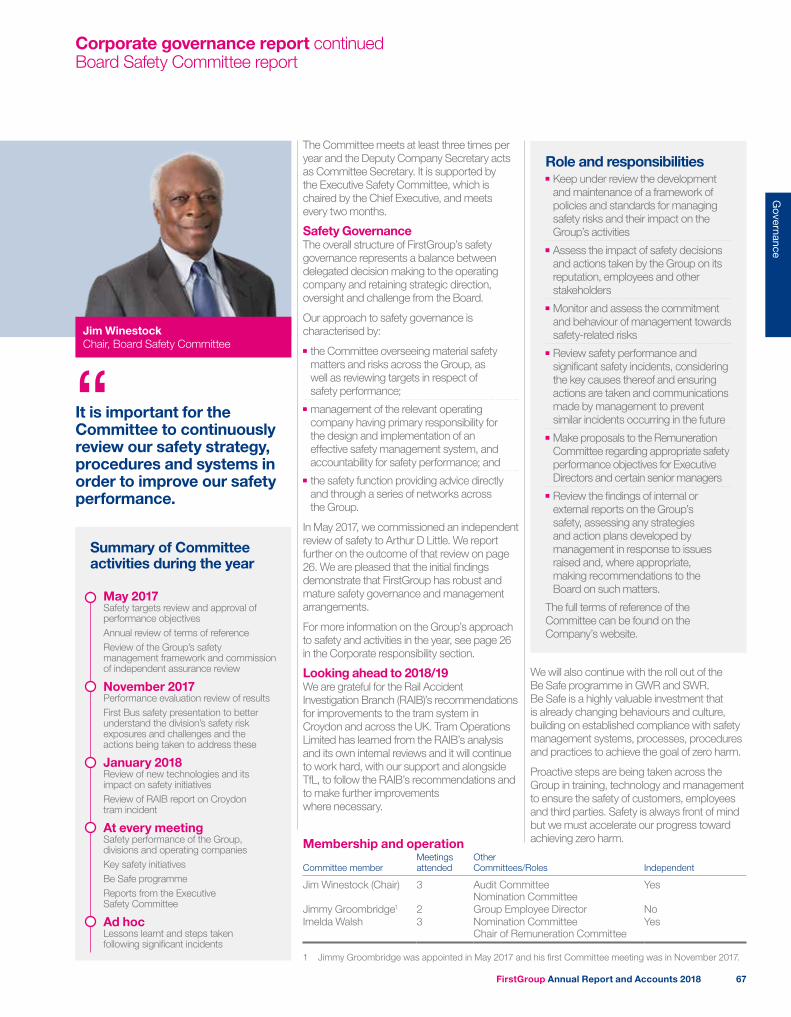
Corporate governance report continuedBoard Safety Committee report
The Committee meets at least three times per year and the Deputy Company Secretary acts as Committee Secretary. It is supported by the Executive Safety Committee, which is chaired by the Chief Executive, and meets every two months.
Safety GovernanceThe overall structure of FirstGroup’s safety governance represents a balance between delegated decision making to the operating company and retaining strategic direction, oversight and challenge from the Board.
Our approach to safety governance is characterised by:
■■ the Committee overseeing material safety matters and risks across the Group, as well as reviewing targets in respect of safety performance;
■■ management of the relevant operating company having primary responsibility for the design and implementation of an effective safety management system, and accountability for safety performance; and
■■ the safety function providing advice directly and through a series of networks across the Group.
In May 2017, we commissioned an independent review of safety to Arthur D Little. We report further on the outcome of that review on page 26. We are pleased that the initial findings demonstrate that FirstGroup has robust and mature safety governance and management arrangements.
For more information on the Group’s approach to safety and activities in the year, see page 26 in the Corporate responsibility section.
Looking ahead to 2018/19We are grateful for the Rail Accident Investigation Branch (RAIB)’s recommendations for improvements to the tram system in Croydon and across the UK. Tram Operations Limited has learned from the RAIB’s analysis and its own internal reviews and it will continue to work hard, with our support and alongside TfL, to follow the RAIB’s recommendations and to make further improvements where necessary.
Jim WinestockChair, Board Safety Committee
Membership and operation
Committee memberMeetingsattended
OtherCommittees/Roles Independent
Jim Winestock (Chair) 3 Audit CommitteeNomination Committee
Yes
Jimmy Groombridge1 2 Group Employee Director NoImelda Walsh 3 Nomination Committee
Chair of Remuneration CommitteeYes
1 Jimmy Groombridge was appointed in May 2017 and his first Committee meeting was in November 2017.
Role and responsibilities■■ Keep under review the development and maintenance of a framework of policies and standards for managing safety risks and their impact on the Group’s activities
■■ Assess the impact of safety decisions and actions taken by the Group on its reputation, employees and other stakeholders
■■ Monitor and assess the commitment and behaviour of management towards safety-related risks
■■ Review safety performance and significant safety incidents, considering the key causes thereof and ensuring actions are taken and communications made by management to prevent similar incidents occurring in the future
■■ Make proposals to the Remuneration Committee regarding appropriate safety performance objectives for Executive Directors and certain senior managers
■■ Review the findings of internal or external reports on the Group’s safety, assessing any strategies and action plans developed by management in response to issues raised and, where appropriate, making recommendations to the Board on such matters.
The full terms of reference of the Committee can be found on the Company’s website.
It is important for the Committee to continuously review our safety strategy, procedures and systems in order to improve our safety performance.
“Summary of Committee activities during the year
May 2017Safety targets review and approval of performance objectivesAnnual review of terms of referenceReview of the Group’s safety management framework and commission of independent assurance review
November 2017Performance evaluation review of resultsFirst Bus safety presentation to better understand the division’s safety risk exposures and challenges and the actions being taken to address these
January 2018Review of new technologies and its impact on safety initiativesReview of RAIB report on Croydon tram incident
At every meetingSafety performance of the Group, divisions and operating companiesKey safety initiativesBe Safe programmeReports from the Executive Safety Committee
Ad hocLessons learnt and steps taken following significant incidents
We will also continue with the roll out of the Be Safe programme in GWR and SWR. Be Safe is a highly valuable investment that is already changing behaviours and culture, building on established compliance with safety management systems, processes, procedures and practices to achieve the goal of zero harm.
Proactive steps are being taken across the Group in training, technology and management to ensure the safety of customers, employees and third parties. Safety is always front of mind but we must accelerate our progress toward achieving zero harm.
FirstGroup Annual Report and Accounts 2018 67
Governance
Directors’ remuneration reportStatement by the Chair of the Remuneration Committee
You will have read the recent announcement that Tim O’Toole, our Chief Executive for over seven years, stepped down from his position on the Board and as Chief Executive on 31 May 2018. The Board is grateful to Tim for his contribution and leadership since 2010. Full details of Tim’s termination arrangements will be included in next year’s report and will also be fully disclosed, in the normal way, when confirmed.
Our approach to remunerationThe key principles underpinning the Committee’s approach to executive remuneration are:
■■ Alignment with strategy and business objectives
■■ Rewarding performance■■ Performance-biased framework■■ Competitive remuneration■■ Simplicity and transparency
Alignment with strategyThe Executive Directors and senior management are specifically incentivised to achieve the Group’s strategy and business objectives, which are as follows:
Focused and disciplined bidding in our contract businesses
Driving growth through attractive commercial propositions in our passenger revenue businesses
Continuous improvement in operating and financial performance
Prudent investment in our fleets, systems and people
Maintaining responsible partnerships with our customers and communities
The Board believes that the ongoing achievement of these strategic objectives will deliver strong long term financial and shareholder value on a sustainable basis.
“Imelda Walsh Chair, Remuneration Committee
Dear Shareholder
I am pleased to present the Directors’ remuneration report for the financial year ended 31 March 2018.
OverviewThe Group delivered stable adjusted earnings and sustained cash generation this year and further strengthened its balance sheet through the bond refinancing and continued deleveraging. However, this year’s results fell short of our ambitions and we are disappointed that we did not make the progress we had intended. This context has framed the decisions and outcomes for our current and future remuneration and these are set out in this summary and also throughout the report.
The Company’s current Directors’ Remuneration Policy (the ‘Policy’) was approved by shareholders at the AGM in 2015 (92.82% voted in favour). This report includes the proposed Policy, which will be subject to shareholder approval at the 2018 AGM. This Statement and the Annual report on remuneration will be subject to an advisory vote at the 2018 AGM.
The Committee aims to ensure that the Policy provides a good framework for incentivising Executive Directors and senior managers to drive the performance of the Group for the long term benefit of shareholders and to enable the Company to recruit competitively. In 2015 we introduced a number of best practice features which continue to remain relevant. Overall, we view the current Policy as broadly fit for purpose and, as a result, the proposed changes are relatively minor. The proposed changes, along with the supporting rationale, are covered later in my Statement and in the remainder of this report.
The context of this year’s results has framed the Committee’s decisions and outcomes for our current and future remuneration framework.
In this section Page
Statement by the Chair of the Remuneration Committee 68Remuneration at a glance 71 Remuneration policy 72Annual report on remuneration 81
1
2
3
4
5
FirstGroup Annual Report and Accounts 201868
Business performanceAs reported in the main body of this report, although some progress has been made, including strong cash generation, our overall results fell short of our ambitions. Our largest division First Student was broadly stable but did not achieve the target level of business retention planned and continues to face driver labour cost inflation challenges due to the shortage of drivers in some regions. First Bus took an encouraging step forward in its margin improvement plans, but this was offset by the cost challenges experienced by First Transit in the first half and by Greyhound’s inability to overcome the structural shift taking place in its long haul markets, as ultra low cost airlines significantly increased capacity. We have therefore updated our view of the carrying value of the division’s goodwill and other assets in light of these issues, impairing them by a total of $387.3m or £277.3m accordingly. In First Rail, although our GWR and SWR rail franchises have operational challenges to overcome, both are profitable and are adding value to the Group. However, our TPE franchise was loss-making, and we have taken the decision to provide for forecast losses of up to £106.3m over the remaining life of the contract. Finally, both UK and US weather conditions in the final quarter created operational challenges with a consequent impact on performance.
The financial targets for our Executive Directors under the Executive Annual Bonus Plan (EABP) are based on revenue, adjusted operating profit and cash flow. In 2017/18 revenue was £6,398.4m, an increase of 13.2%, but when the benefits from the new SWR franchise and the 53rd week (Road businesses only) are excluded and on a constant currency basis, the increase was 1%.
Adjusted operating profit was £317.0m, a decrease of 6.5% compared with 2017 but on a constant currency basis and excluding SWR and the 53rd week, this represented a reduction of 10.4%. However, net cash flow increased substantially to £199.0m, which included SWR start of franchise cash flows of £88.5m.
The EABP also includes personal objectives and non-financial measures relating to safety and customer satisfaction which are measured at divisional level and averaged to provide a Group outturn.
As noted in my overview, although progress has been made in a number of areas, we believe we have not yet reached our full potential and results in some areas have been disappointing. As a Committee, we are cognisant of the way in which business and share price performance are aligned and our decisions in respect of executive remuneration are framed accordingly.
2017/18 performance and reward decisionsIn light of the overall challenges faced by the business during the year, Matthew Gregory, Chief Financial Officer (CFO), advised the Committee that he did not wish to be considered for a salary increase with effect from 1 April 2018. The Committee welcomed and supported this position. However, with the departure of the Chief Executive, and the additional responsibilities that Matthew will take on, the Committee will be considering a temporary increase in Matthew’s salary for the period of time in which he takes up his additional responsibilities as interim Chief Operating Officer.
As noted above, the Committee considered the outcome of the 2017/18 EABP in the context of broader business performance and shareholder experience. Following careful consideration and discussion with Tim O’Toole, the Committee determined that no bonus should be awarded to him in respect of 2017/18.
Separately, the Committee considered each element of the EABP against the financial and non-financial targets for Matthew Gregory as CFO. The Committee concluded that in light of the shortfall against target in adjusted operating profit, although Group revenue had increased, no bonus would be awarded in respect of this element. However, a strong cash flow performance had been delivered, which resulted in maximum vesting under this element and partial vesting achieved of the safety and customer satisfaction measures.
The final element of the EABP award was individual performance. Out of a potential 10%, the Committee awarded Matthew 8%. Full details on each objective and the performance achieved are set out on pages 83 and 84 of the Annual report on remuneration.
Overall, the Committee determined that the EABP award for Matthew Gregory will be £146,882, which is 22.3% of the total bonus opportunity. In line with the existing Policy, 50% of the award will be paid in cash and 50% deferred into shares.
The vesting of the 2015 LTIP award was subject to two performance measures: 50% ROCE and 50% relative TSR. Neither of these measures was achieved and therefore the 2015 LTIP lapsed.
Pay across the GroupThe Group is committed to offering an attractive reward package for employees at all levels. In addition to competitive base salaries, we offer a wide range of benefits to employees and their families, tailored to local markets. Further information is included in this report on page 91.
We published our first Gender Pay Gap Report in April 2018. Our median gender pay gap is -9.1%. This means that women’s median hourly pay is 9.1% higher than men’s.
FirstGroup is one of the few UK companies to have a Group Employee Director (GED), who is invited to attend meetings of the Committee. We will work closely with our GED, Jimmy Groombridge, as we consider the additional reporting requirements and wider remit of the Committee.
Non-Executive Directors’ (‘NED’) feesFollowing a review of the NEDs’ fees by the Chairman and the Executive Directors, the fees were increased from £55,000 to £58,000 p.a. with effect from 1 August 2017. At the same time, the Senior Independent Director fee and the fee for the Board Safety Committee Chair were increased from £10,000 p.a. to £12,000 p.a. bringing these into line with the Audit and Remuneration Committee Chairs’ fees, which were not increased. No further increase is anticipated during 2018, other than the introduction of an allowance for intercontinental travel which is described on page 80.
FirstGroup Annual Report and Accounts 2018 69
Governance
Directors’ remuneration report continuedStatement by the Chair of the Remuneration Committee
Chairman’s feeFollowing a review of the Chairman’s fee, this was increased from £280,000 p.a. to £295,000 p.a. with effect from 1 December 2017.
With Wolfhart Hauser now stepping up to the position of Executive Chairman, the Committee will be considering a temporary increase to his fees to reflect the additional time commitment and this will be disclosed in the normal manner in due course.
GovernanceThe Committee actively monitors developments in corporate governance and the guidelines produced by shareholders and their representative bodies to ensure that we remain aligned with best practice.
2018 Policy reviewThe Committee undertook a full review of the Policy during the year. Full details of the changes and the new Policy are set out later in this report. Whilst the overall conclusion was that the Policy remained broadly fit for purpose the following changes are proposed:
■■ Threshold vesting under the LTIP will be set at 20% of the maximum for future LTIP awards. Previously the Policy allowed for 25% of the maximum to vest at threshold. This was reduced to 20% of the maximum in respect of the 2017 LTIP following shareholder consultation and the Committee has determined that this should now be formalised as part of the Policy.
■■ The ability to award NEDs a fee when undertaking intercontinental travel is being introduced to reflect the significant time required when travelling long distances on Company business. This supports the NEDs in the effective performance of their roles.
■■ The maximum pension opportunity for newly appointed Executive Directors will be set at up to 20% of base salary. Previously the Policy explicitly set the pension allowance to be equal to 20% of salary. This change provides future flexibility and brings the approach to pension contributions into line with market practice.
2018/19 Performance and RewardThe Committee considers that the existing EABP framework, weightings and measures continue to be an appropriate short term incentive. The Committee has, however, determined that in order for the Group revenue element to be awarded, Group adjusted operating profit must exceed its threshold target. Targets in respect of the 2018 EABP will reflect the business context and challenges as well as the overall business plan for addressing these at both divisional and Group level.
Likewise, following a review during the year, the Committee believes that the LTIP framework remains appropriate. However, in light of the Company’s performance and also the bid activity, the Committee has determined that additional time is needed before the most appropriate targets can be determined and the 2018 LTIP awards can be made. It is the Committee’s expectation that targets and measures for the 2018 LTIP award will be no less demanding than those operated in respect of the 2017 award and that the three measures will remain TSR, EPS and ROCE. When the 2018 LTIP is awarded, details of the associated targets and measures will be fully disclosed.
Looking aheadFor the coming year, it is anticipated that the Committee will focus on the following areas:
■■ supporting the recruitment of a new Chief Executive
■■ supporting the Group’s business objectives and strategic goals
■■ ensuring compliance with new regulatory requirements, including the new UK Corporate Governance Code and the widening of the remit of the Committee
■■ ensuring that remuneration arrangements are designed to promote the long term success of the Company and reward performance, whilst maintaining a prudent approach to cost and the risk to the business
Shareholder engagementThe Committee is committed to an open and transparent dialogue with shareholders on the issue of executive remuneration and considers these engagements vital to ensure its remuneration strategy continues to be aligned with the long term interests of FirstGroup’s shareholders. We recognise that the performance of the Company can be further improved but in relation to incentive outcomes, both annual and long term incentive have, in recent years, reflected business performance and the Committee has exercised downward discretion where warranted.
We look forward to your support for this year’s report and the new Policy at the forthcoming AGM.
Finally, I am grateful to my colleagues on the Committee and those who support our work.
Imelda Walsh Chair, Remuneration Committee
FirstGroup Annual Report and Accounts 201870
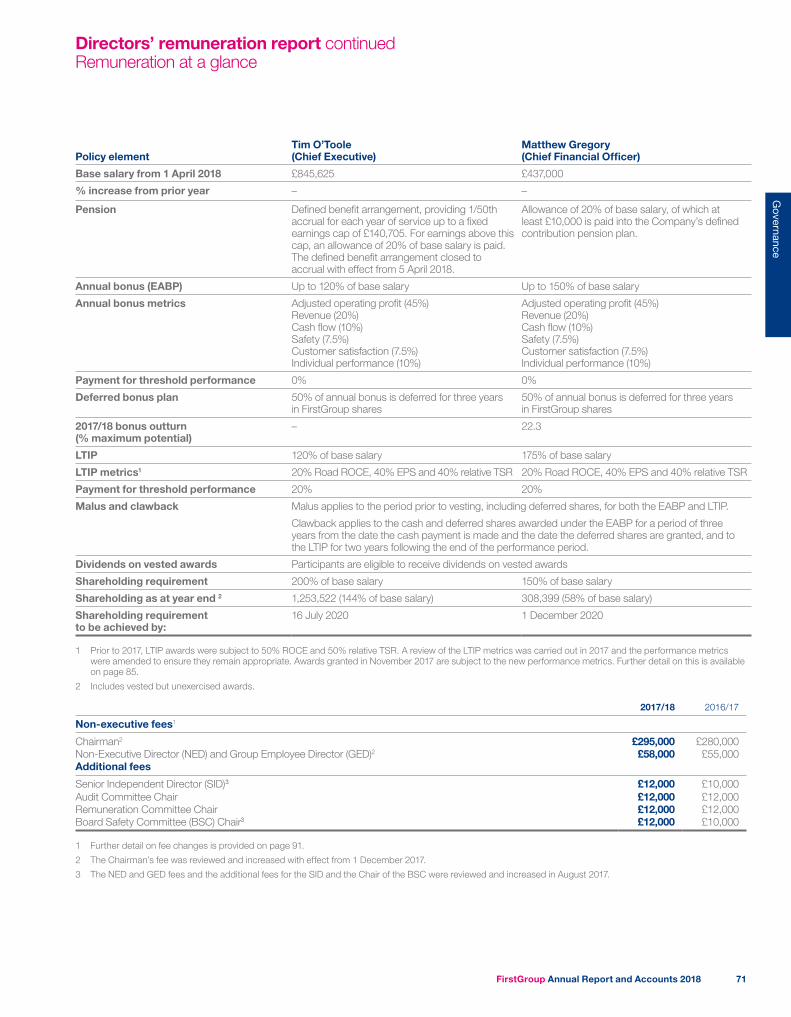
Policy elementTim O’Toole (Chief Executive)
Matthew Gregory (Chief Financial Officer)
Base salary from 1 April 2018 £845,625 £437,000
% increase from prior year – –
Pension Defined benefit arrangement, providing 1/50th accrual for each year of service up to a fixed earnings cap of £140,705. For earnings above this cap, an allowance of 20% of base salary is paid. The defined benefit arrangement closed to accrual with effect from 5 April 2018.
Allowance of 20% of base salary, of which at least £10,000 is paid into the Company’s defined contribution pension plan.
Annual bonus (EABP) Up to 120% of base salary Up to 150% of base salary
Annual bonus metrics Adjusted operating profit (45%) Revenue (20%) Cash flow (10%) Safety (7.5%) Customer satisfaction (7.5%) Individual performance (10%)
Adjusted operating profit (45%) Revenue (20%) Cash flow (10%) Safety (7.5%)Customer satisfaction (7.5%) Individual performance (10%)
Payment for threshold performance 0% 0%
Deferred bonus plan 50% of annual bonus is deferred for three years in FirstGroup shares
50% of annual bonus is deferred for three years in FirstGroup shares
2017/18 bonus outturn (% maximum potential)
– 22.3
LTIP 120% of base salary 175% of base salary
LTIP metrics1 20% Road ROCE, 40% EPS and 40% relative TSR 20% Road ROCE, 40% EPS and 40% relative TSR
Payment for threshold performance 20% 20%
Malus and clawback Malus applies to the period prior to vesting, including deferred shares, for both the EABP and LTIP.
Clawback applies to the cash and deferred shares awarded under the EABP for a period of three years from the date the cash payment is made and the date the deferred shares are granted, and to the LTIP for two years following the end of the performance period.
Dividends on vested awards Participants are eligible to receive dividends on vested awards
Shareholding requirement 200% of base salary 150% of base salary
Shareholding as at year end 2 1,253,522 (144% of base salary) 308,399 (58% of base salary)
Shareholding requirement to be achieved by:
16 July 2020 1 December 2020
1 Prior to 2017, LTIP awards were subject to 50% ROCE and 50% relative TSR. A review of the LTIP metrics was carried out in 2017 and the performance metrics were amended to ensure they remain appropriate. Awards granted in November 2017 are subject to the new performance metrics. Further detail on this is available on page 85.
2 Includes vested but unexercised awards.
2017/18 2016/17
Non-executive fees1
Chairman2 £295,000 £280,000Non-Executive Director (NED) and Group Employee Director (GED)2 £58,000 £55,000Additional fees
Senior Independent Director (SID)3 £12,000 £10,000Audit Committee Chair £12,000 £12,000Remuneration Committee Chair £12,000 £12,000Board Safety Committee (BSC) Chair3 £12,000 £10,000
1 Further detail on fee changes is provided on page 91.
2 The Chairman’s fee was reviewed and increased with effect from 1 December 2017.
3 The NED and GED fees and the additional fees for the SID and the Chair of the BSC were reviewed and increased in August 2017.
Directors’ remuneration report continuedRemuneration at a glance
FirstGroup Annual Report and Accounts 2018 71
Governance
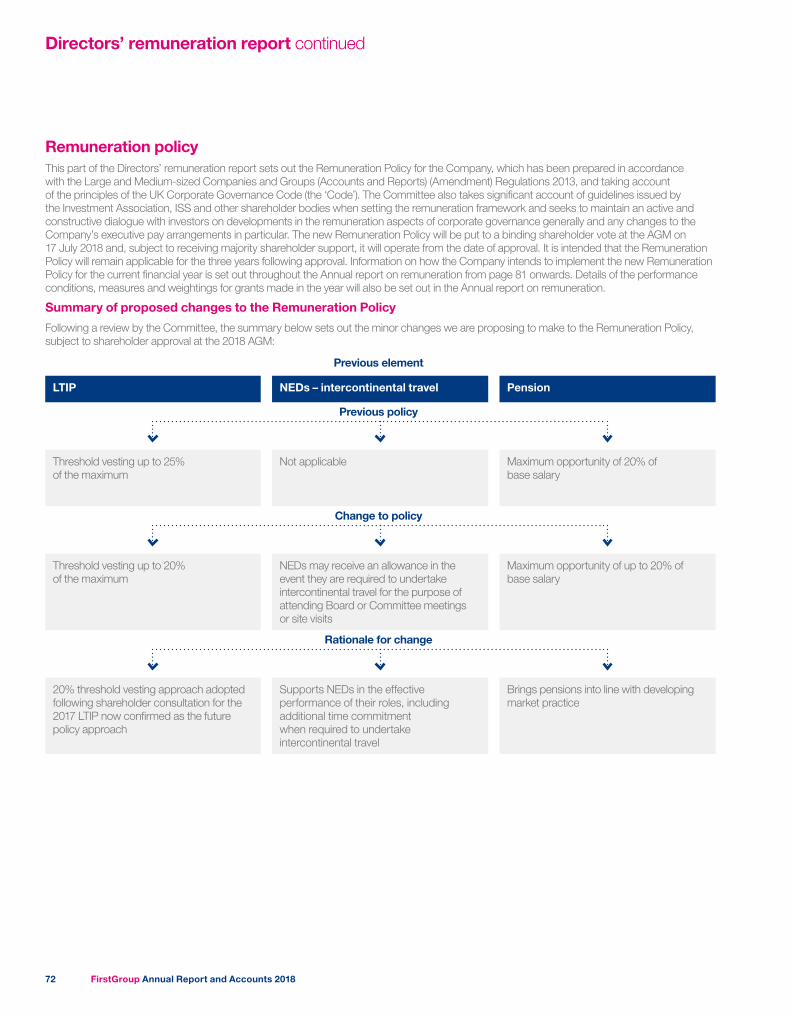
Directors’ remuneration report continued
Remuneration policyThis part of the Directors’ remuneration report sets out the Remuneration Policy for the Company, which has been prepared in accordance with the Large and Medium-sized Companies and Groups (Accounts and Reports) (Amendment) Regulations 2013, and taking account of the principles of the UK Corporate Governance Code (the ‘Code’). The Committee also takes significant account of guidelines issued by the Investment Association, ISS and other shareholder bodies when setting the remuneration framework and seeks to maintain an active and constructive dialogue with investors on developments in the remuneration aspects of corporate governance generally and any changes to the Company’s executive pay arrangements in particular. The new Remuneration Policy will be put to a binding shareholder vote at the AGM on 17 July 2018 and, subject to receiving majority shareholder support, it will operate from the date of approval. It is intended that the Remuneration Policy will remain applicable for the three years following approval. Information on how the Company intends to implement the new Remuneration Policy for the current financial year is set out throughout the Annual report on remuneration from page 81 onwards. Details of the performance conditions, measures and weightings for grants made in the year will also be set out in the Annual report on remuneration.
Summary of proposed changes to the Remuneration Policy
Following a review by the Committee, the summary below sets out the minor changes we are proposing to make to the Remuneration Policy, subject to shareholder approval at the 2018 AGM:
Previous element
LTIP NEDs – intercontinental travel Pension
Previous policy
Threshold vesting up to 25% of the maximum
Not applicable Maximum opportunity of 20% of base salary
Change to policy
Threshold vesting up to 20% of the maximum
NEDs may receive an allowance in the event they are required to undertake intercontinental travel for the purpose of attending Board or Committee meetings or site visits
Maximum opportunity of up to 20% of base salary
Rationale for change
20% threshold vesting approach adopted following shareholder consultation for the 2017 LTIP now confirmed as the future policy approach
Supports NEDs in the effective performance of their roles, including additional time commitment when required to undertake intercontinental travel
Brings pensions into line with developing market practice
FirstGroup Annual Report and Accounts 201872
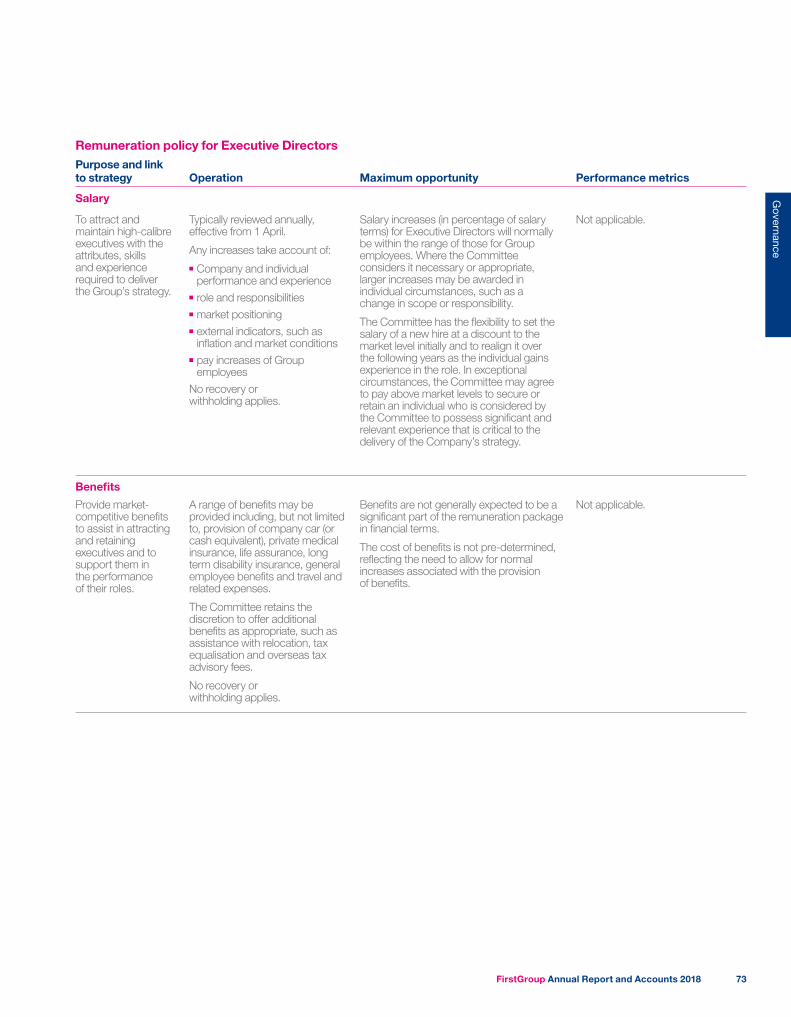
Remuneration policy for Executive DirectorsPurpose and link to strategy Operation Maximum opportunity Performance metrics
Salary
To attract and maintain high-calibre executives with the attributes, skills and experience required to deliver the Group’s strategy.
Typically reviewed annually, effective from 1 April.
Any increases take account of: ■■ Company and individual performance and experience
■■ role and responsibilities■■ market positioning■■ external indicators, such as inflation and market conditions
■■ pay increases of Group employees
No recovery or withholding applies.
Salary increases (in percentage of salary terms) for Executive Directors will normally be within the range of those for Group employees. Where the Committee considers it necessary or appropriate, larger increases may be awarded in individual circumstances, such as a change in scope or responsibility.
The Committee has the flexibility to set the salary of a new hire at a discount to the market level initially and to realign it over the following years as the individual gains experience in the role. In exceptional circumstances, the Committee may agree to pay above market levels to secure or retain an individual who is considered by the Committee to possess significant and relevant experience that is critical to the delivery of the Company’s strategy.
Not applicable.
Benefits
Provide market-competitive benefits to assist in attracting and retaining executives and to support them in the performance of their roles.
A range of benefits may be provided including, but not limited to, provision of company car (or cash equivalent), private medical insurance, life assurance, long term disability insurance, general employee benefits and travel and related expenses.
The Committee retains the discretion to offer additional benefits as appropriate, such as assistance with relocation, tax equalisation and overseas tax advisory fees.
No recovery or withholding applies.
Benefits are not generally expected to be a significant part of the remuneration package in financial terms.
The cost of benefits is not pre-determined, reflecting the need to allow for normal increases associated with the provision of benefits.
Not applicable.
FirstGroup Annual Report and Accounts 2018 73
Governance
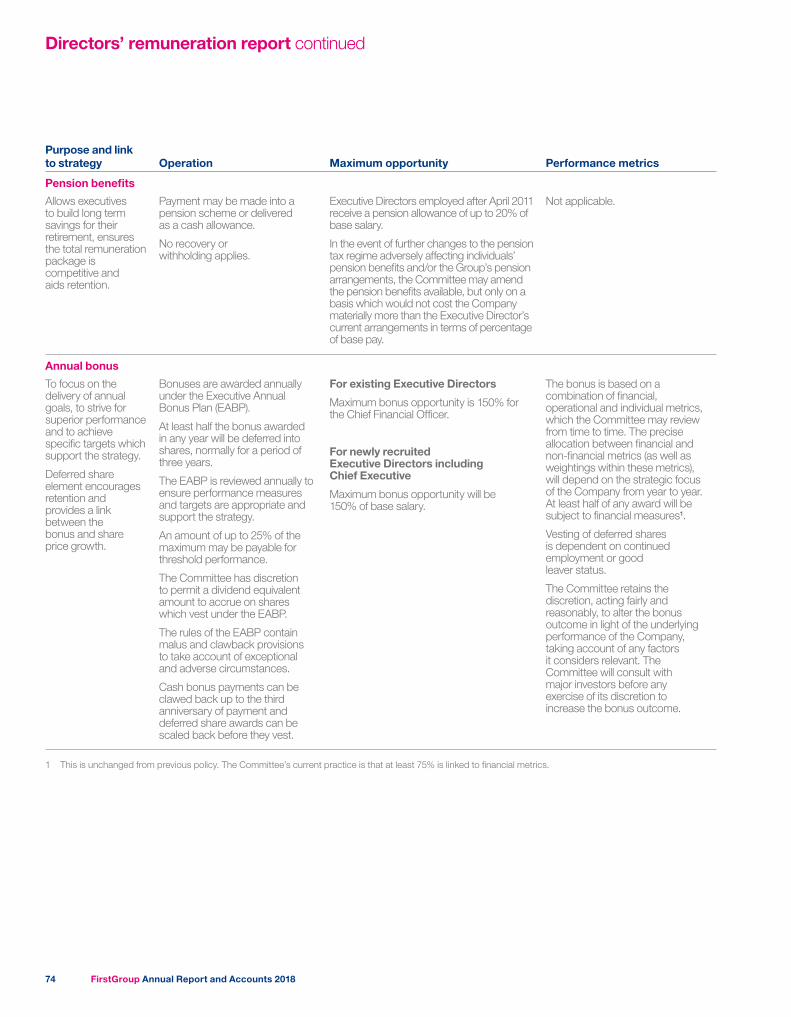
Directors’ remuneration report continued
Purpose and link to strategy Operation Maximum opportunity Performance metrics
Pension benefits
Allows executives to build long term savings for their retirement, ensures the total remuneration package is competitive and aids retention.
Payment may be made into a pension scheme or delivered as a cash allowance.
No recovery or withholding applies.
Executive Directors employed after April 2011 receive a pension allowance of up to 20% of base salary.
In the event of further changes to the pension tax regime adversely affecting individuals’ pension benefits and/or the Group’s pension arrangements, the Committee may amend the pension benefits available, but only on a basis which would not cost the Company materially more than the Executive Director’s current arrangements in terms of percentage of base pay.
Not applicable.
Annual bonus
To focus on the delivery of annual goals, to strive for superior performance and to achieve specific targets which support the strategy.
Deferred share element encourages retention and provides a link between the bonus and share price growth.
Bonuses are awarded annually under the Executive Annual Bonus Plan (EABP).
At least half the bonus awarded in any year will be deferred into shares, normally for a period of three years.
The EABP is reviewed annually to ensure performance measures and targets are appropriate and support the strategy.
An amount of up to 25% of the maximum may be payable for threshold performance.
The Committee has discretion to permit a dividend equivalent amount to accrue on shares which vest under the EABP.
The rules of the EABP contain malus and clawback provisions to take account of exceptional and adverse circumstances.
Cash bonus payments can be clawed back up to the third anniversary of payment and deferred share awards can be scaled back before they vest.
For existing Executive Directors
Maximum bonus opportunity is 150% for the Chief Financial Officer.
For newly recruited Executive Directors including Chief Executive
Maximum bonus opportunity will be 150% of base salary.
The bonus is based on a combination of financial, operational and individual metrics, which the Committee may review from time to time. The precise allocation between financial and non-financial metrics (as well as weightings within these metrics), will depend on the strategic focus of the Company from year to year. At least half of any award will be subject to financial measures1.
Vesting of deferred shares is dependent on continued employment or good leaver status.
The Committee retains the discretion, acting fairly and reasonably, to alter the bonus outcome in light of the underlying performance of the Company, taking account of any factors it considers relevant. The Committee will consult with major investors before any exercise of its discretion to increase the bonus outcome.
1 This is unchanged from previous policy. The Committee’s current practice is that at least 75% is linked to financial metrics.
FirstGroup Annual Report and Accounts 201874
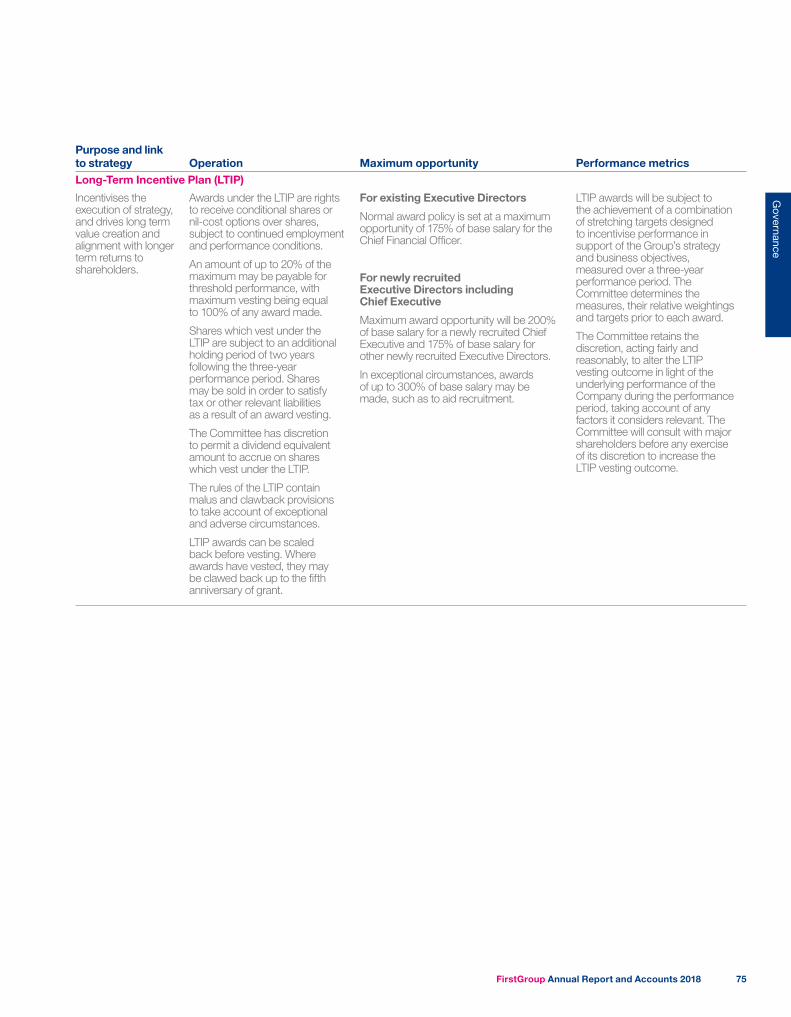
Purpose and link to strategy Operation Maximum opportunity Performance metricsLong-Term Incentive Plan (LTIP)
Incentivises the execution of strategy, and drives long term value creation and alignment with longer term returns to shareholders.
Awards under the LTIP are rights to receive conditional shares or nil-cost options over shares, subject to continued employment and performance conditions.
An amount of up to 20% of the maximum may be payable for threshold performance, with maximum vesting being equal to 100% of any award made.
Shares which vest under the LTIP are subject to an additional holding period of two years following the three-year performance period. Shares may be sold in order to satisfy tax or other relevant liabilities as a result of an award vesting.
The Committee has discretion to permit a dividend equivalent amount to accrue on shares which vest under the LTIP.
The rules of the LTIP contain malus and clawback provisions to take account of exceptional and adverse circumstances.
LTIP awards can be scaled back before vesting. Where awards have vested, they may be clawed back up to the fifth anniversary of grant.
For existing Executive Directors
Normal award policy is set at a maximum opportunity of 175% of base salary for the Chief Financial Officer.
For newly recruited Executive Directors including Chief Executive
Maximum award opportunity will be 200% of base salary for a newly recruited Chief Executive and 175% of base salary for other newly recruited Executive Directors.
In exceptional circumstances, awards of up to 300% of base salary may be made, such as to aid recruitment.
LTIP awards will be subject to the achievement of a combination of stretching targets designed to incentivise performance in support of the Group’s strategy and business objectives, measured over a three-year performance period. The Committee determines the measures, their relative weightings and targets prior to each award.
The Committee retains the discretion, acting fairly and reasonably, to alter the LTIP vesting outcome in light of the underlying performance of the Company during the performance period, taking account of any factors it considers relevant. The Committee will consult with major shareholders before any exercise of its discretion to increase the LTIP vesting outcome.
FirstGroup Annual Report and Accounts 2018 75
Governance
Directors’ remuneration report continued
Purpose and link to strategy Operation Maximum opportunity Performance metrics
All-Employee Share Plans
To encourage all employees to make a long term investment in the Company’s shares in a tax-efficient way.
Opportunity to participate in Save As You Earn (SAYE) and the Share Incentive Plan (known as Buy As You Earn or BAYE) on the same terms as other eligible employees.
No recovery or withholding applies.
The maximum participation level is in accordance with HMRC limits.
Not applicable
Shareholding Guidelines
To ensure that Executive Directors’ interests are aligned with those of shareholders over a longer term time period.
The Chief Executive is expected to hold shares equivalent in value to a minimum of 200% of base salary and other Executive Directors 150% of base salary within a five-year period from the later of their date of appointment or the initial approval of and, if appropriate, subsequent amendments to, this remuneration policy.
Executive Directors are further required to retain at least 75% of the shares, net of tax, vesting under a Group share incentive plan or otherwise acquire shares in the Company until the shareholding guideline is met. The Committee reserves the right to relax or waive the application of the guidelines where it believes it is justified by the circumstances.
Not applicable Not applicable
EABP and Long-Term Incentive PlanThe Committee operates within its policy at all times. It will also operate the EABP and LTIP according to the rules of each respective plan and consistently with normal market practice and the Listing Rules, including flexibility in a number of areas. How the Committee will retain flexibility includes:
■■ when to make awards and payments■■ how to determine the size of an award, a payment, or when and how much of an award should vest■■ who receives an award or payment■■ how to deal with a change of control, restructuring or any other corporate event of the Group■■ whether an Executive Director or senior manager is a good/bad leaver for incentive plan purposes and what proportion of awards vest, if any, at the time of leaving or at the original vesting date(s)
■■ how and whether an award or its performance conditions may be adjusted in certain circumstances (e.g. change of accounting policy)■■ the choice of (and adjustment of) performance measures, weightings and targets for each incentive plan from year to year in accordance with the remuneration policy set out above and the rules of each plan
■■ amending plan rules in accordance with their terms.
Any use of the above discretions would, where relevant, be explained in the Annual report on remuneration and may, as appropriate, be the subject of consultation with the Company’s major shareholders.
FirstGroup Annual Report and Accounts 201876
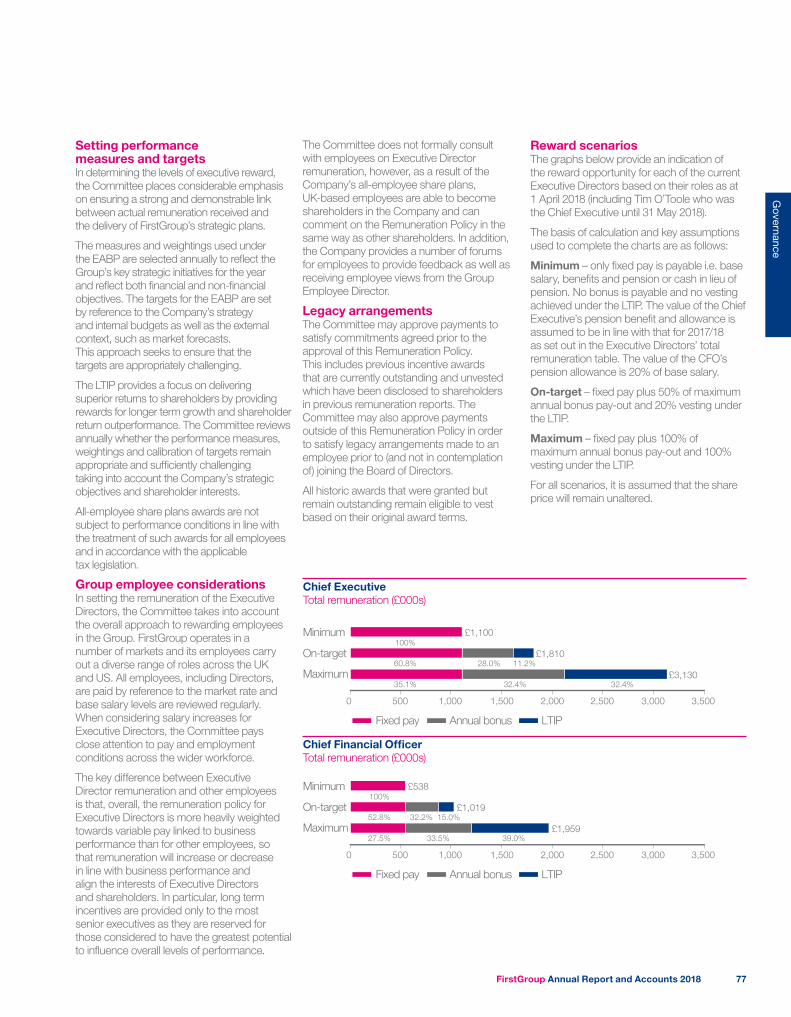
Setting performance measures and targetsIn determining the levels of executive reward, the Committee places considerable emphasis on ensuring a strong and demonstrable link between actual remuneration received and the delivery of FirstGroup’s strategic plans.
The measures and weightings used under the EABP are selected annually to reflect the Group’s key strategic initiatives for the year and reflect both financial and non-financial objectives. The targets for the EABP are set by reference to the Company’s strategy and internal budgets as well as the external context, such as market forecasts. This approach seeks to ensure that the targets are appropriately challenging.
The LTIP provides a focus on delivering superior returns to shareholders by providing rewards for longer term growth and shareholder return outperformance. The Committee reviews annually whether the performance measures, weightings and calibration of targets remain appropriate and sufficiently challenging taking into account the Company’s strategic objectives and shareholder interests.
All-employee share plans awards are not subject to performance conditions in line with the treatment of such awards for all employees and in accordance with the applicable tax legislation.
Group employee considerationsIn setting the remuneration of the Executive Directors, the Committee takes into account the overall approach to rewarding employees in the Group. FirstGroup operates in a number of markets and its employees carry out a diverse range of roles across the UK and US. All employees, including Directors, are paid by reference to the market rate and base salary levels are reviewed regularly. When considering salary increases for Executive Directors, the Committee pays close attention to pay and employment conditions across the wider workforce.
The key difference between Executive Director remuneration and other employees is that, overall, the remuneration policy for Executive Directors is more heavily weighted towards variable pay linked to business performance than for other employees, so that remuneration will increase or decrease in line with business performance and align the interests of Executive Directors and shareholders. In particular, long term incentives are provided only to the most senior executives as they are reserved for those considered to have the greatest potential to influence overall levels of performance.
The Committee does not formally consult with employees on Executive Director remuneration, however, as a result of the Company’s all-employee share plans, UK-based employees are able to become shareholders in the Company and can comment on the Remuneration Policy in the same way as other shareholders. In addition, the Company provides a number of forums for employees to provide feedback as well as receiving employee views from the Group Employee Director.
Legacy arrangementsThe Committee may approve payments to satisfy commitments agreed prior to the approval of this Remuneration Policy. This includes previous incentive awards that are currently outstanding and unvested which have been disclosed to shareholders in previous remuneration reports. The Committee may also approve payments outside of this Remuneration Policy in order to satisfy legacy arrangements made to an employee prior to (and not in contemplation of) joining the Board of Directors.
All historic awards that were granted but remain outstanding remain eligible to vest based on their original award terms.
Reward scenariosThe graphs below provide an indication of the reward opportunity for each of the current Executive Directors based on their roles as at 1 April 2018 (including Tim O’Toole who was the Chief Executive until 31 May 2018).
The basis of calculation and key assumptions used to complete the charts are as follows:
Minimum – only fixed pay is payable i.e. base salary, benefits and pension or cash in lieu of pension. No bonus is payable and no vesting achieved under the LTIP. The value of the Chief Executive’s pension benefit and allowance is assumed to be in line with that for 2017/18 as set out in the Executive Directors’ total remuneration table. The value of the CFO’s pension allowance is 20% of base salary.
On-target – fixed pay plus 50% of maximum annual bonus pay-out and 20% vesting under the LTIP.
Maximum – fixed pay plus 100% of maximum annual bonus pay-out and 100% vesting under the LTIP.
For all scenarios, it is assumed that the share price will remain unaltered.
Chief ExecutiveTotal remuneration (£000s)
Fixed pay
0 500 1,000 1,500
£3,130
£1,810
£1,100100%
60.8% 28.0% 11.2%
35.1% 32.4% 32.4%
2,000 2,500 3,000 3,500
Annual bonus LTIP
Minimum
On-target
Maximum
Chief Financial OfficerTotal remuneration (£000s)
0 500 1,000 1,500
£1,959
£1,019
£538100%
52.8% 32.2% 15.0%
27.5% 33.5% 39.0%
2,000 2,500 3,000 3,500
Minimum
On-target
Maximum
Fixed pay Annual bonus LTIP
FirstGroup Annual Report and Accounts 2018 77
Governance
Directors’ remuneration report continued
Approach to recruitment remuneration The Committee believes it is vital to be able to attract and recruit high-calibre executives who are focused on delivering the Group’s strategic plans, while relating reward to performance in the context of appropriate risk management, and aligning the interests of Executive Directors and senior managers with those of shareholders to build a sustainable performance culture.
The Committee’s approach when considering the overall remuneration arrangements in the recruitment of a new Executive Director is to take account of his or her remuneration package in their prior role, the market positioning of the remuneration package and not to pay more than is necessary to facilitate their recruitment.
The remuneration package for a new Executive Director will be set in accordance with the terms of the Company’s approved remuneration policy in force at the time of appointment, except:
Salary The salary level shall take into account companies in the comparator group, which comprises companies that are broadly in line with FirstGroup’s size, structure and complexity and have features that are comparable to FirstGroup.
The Committee has the flexibility to set the salary of a new Executive Director at a discount to the market level initially, with a series of planned increases implemented over the following few years to bring the salary to the desired positioning, subject to individual performance.
In exceptional circumstances, the Committee has the ability to set the salary of a new Executive Director at a rate higher than the market level to reflect the criticality of the role and the experience and performance of the individual.
Benefits The Company may award certain additional benefits and other allowances including, but not limited to, those to assist with relocation support, temporary living and transportation expenses, educational costs for children and tax equalisation to allow flexibility in employing an overseas national.
Pension benefits Any new Executive Director based outside the UK will be eligible to participate in pension or pension allowance, insurance and other benefit programmes in line with local practice.
Annual bonus The maximum bonus opportunity shall be 150% of base salary.
Long-Term Incentive Plan
The maximum opportunity shall be 200% of base salary for a newly recruited Chief Executive and 175% of base salary for other newly recruited Executive Directors. However, a maximum opportunity of 300% of base salary may be used in exceptional circumstances, in addition to any buy-out of forfeited awards.
Total incentive opportunity
The maximum incentive opportunity which may be granted in line with the policy maximums will be 450% of salary, excluding replacement awards.
Replacement awards
The Committee shall consider what cash or replacement share-based awards, if any, are reasonably necessary to facilitate the recruitment of a new Executive Director in all circumstances. This includes an assessment of the awards and any other compensation or benefits item that would be forfeited on leaving their current employer.
These payments would not exceed what is considered by the Committee to be a fair estimate of remuneration lost when leaving the former employer and would reflect, as far as possible, the nature and time horizons attached to that remuneration and the impact of any performance conditions.
If the Executive Director’s former employer pays a portion of the remuneration that was deemed foregone, the replacement payments will be reduced by an equivalent amount.
In the case of an internal executive appointment, any variable pay element awarded in respect of the prior role will be allowed to pay out according to its existing terms, adjusted as relevant to take into account the appointment. In addition, any other ongoing remuneration obligations existing prior to appointment will continue.
Relocation policies
In instances where the new Executive Director is required to relocate or spend significant time away from their normal residence, the Company may provide compensation to reflect the cost of relocation, including up to two years temporary provision of accommodation and associated moving costs. The level of the relocation package will be assessed on a case-by-case basis but will take into consideration, amongst other items, any cost-of-living differences, housing allowances and schooling. Where an Executive Director leaves within two years of their appointment, the Committee has the discretion to clawback part or all of the relocation package.
Notice periods The Committee shall utilise notice periods of up to 12 months.
For the appointment of a new Chairman or Non-Executive Director, the fee arrangement shall be set in accordance with the approved remuneration policy in force at that time.
FirstGroup Annual Report and Accounts 201878
Executive Directors’ service agreementsThe Executive Directors’ service agreements, including arrangements for early termination, are carefully considered by the Committee and are designed to recruit, retain and motivate Executive Directors of the calibre required to manage the Company. The Committee’s policy is for Executive Directors’ service contracts to be terminable on no more than one year’s notice. The details of existing Executive Directors’ service contracts are summarised in the table below:
Executive Director Date of service contract Notice period
Tim O’Toole 25 January 2011 12 monthsMatthew Gregory 1 December 2015 12 months
Policy on payment for loss of officeExecutive Directors’ service agreements contain provisions for payment in lieu of notice. The Company is unequivocally against rewards for failure; the circumstances of any departure, including the individual’s performance, would be taken into account in every case. Directors’ service agreements are kept for inspection by shareholders at the Company’s registered office.
Service agreements may be terminated without notice and without payment in lieu of notice in certain circumstances, such as gross misconduct. The Company may require the Executive Director to work during their notice period or may choose to place the individual on ‘garden leave’, for example to ensure the protection of the Company’s and shareholders’ interests where the Executive Director has access to commercially sensitive information.
Except in the case of gross misconduct or resignation, the Company may at its absolute discretion reimburse for reasonable professional fees relating to the termination of employment and, where an Executive Director has been required to relocate, to pay reasonable repatriation costs, including possible tax exposure costs.
In the event of an Executive Director’s departure, any outstanding share awards will be treated in accordance with the plan rules as follows:
Plan Treatment on cessation
Salary, Benefits and Pension
These will be paid over the notice period. The Company has discretion to make a lump sum payment in lieu.
EABP Good leaver reason*Where an individual is considered a good leaver* a performance-related bonus will be paid. This will be based on the proportion of the bonus year for which the individual has been actively employed and bonus (if any) will be paid at the normal time, although the Committee retains discretion to pay it earlier in appropriate circumstances. There is no entitlement to any bonus award under the EABP for any financial year where an Executive Director has not been actively working, even if still in employment. The Committee has discretion to make an award in these circumstances, but would only consider exercising its discretion if this were justified by the circumstances and timing of the Executive Director’s departure. The Committee will not exercise that discretion in respect of any period when the Executive Director is on garden leave. Any resulting bonus payment will normally be time pro-rated and be based on the level of performance achieved.Other reasonThe EABP provides no entitlement to a bonus following cessation of employment, unless the leaver is considered a good leaver.
Deferred Share Awards
Good leaver reason*Where an individual is considered a good leaver* (other than in the case of death) unvested EABP deferred shares will vest either at the end of the vesting period or in the event of termination by reason of ill-health on the date of cessation of employment or any other date determined by the Committee. Where an award vests early, the good leaver will receive a pro-rated number of shares to reflect the acceleration of vesting, although in the event of termination by reason of ill-health the Company may exercise discretion to waive pro-rating. In the case of death, deferred share awards vest on the date of death and no pro-rating is applied.Other reasonUnvested deferred share awards will normally lapse on cessation of employment or, at the Committee’s discretion, on service of notice of termination of employment.
Long-Term Incentive Plan
Good leaver reason*Where an individual is considered a good leaver* (other than in the case of death) unvested LTIP shares will vest either at the end of the performance period or in the event of termination of employment by reason of ill-health on the date of cessation of employment to the extent the performance conditions have been satisfied as determined by the Committee. A good leaver* will normally receive a pro-rated proportion of any outstanding LTIP awards. The Committee may choose to allow certain awards to vest while others lapse, depending on the circumstances of the case. In the case of death, awards vest on the date of death and are not subject to the performance conditions, with pro-rating applying in the same way as for good leavers.Other reasonAwards will normally lapse on cessation of employment.
All-employee share plans
Awards will vest in accordance with the rules of the relevant plan, which do not permit the exercise of any discretion by the Committee.
* A good leaver is defined as cessation of employment in the following circumstances: death; ill-health; injury or disability; statutory redundancy; agreed retirement; employing company ceasing to be a Group company; transfer of employment to a company which is not a Group company; and at the Committee’s discretion. Cessation of employment in circumstances other than those set out above is cessation for other reasons.
FirstGroup Annual Report and Accounts 2018 79
Governance
Directors’ remuneration report continued
Policy on external appointmentsThe Committee believes that the Company can benefit from Executive Directors holding one approved non-executive directorship of another company, offering Executive Directors the opportunity to broaden their experience and knowledge. Company policy is to allow Executive Directors to retain the fees earned from such appointments.
Chairman and other Non-Executive Directors’ letters of appointmentThe Chairman and other Non-Executive Directors do not have service contracts, but each has a letter of appointment with the Company. Each letter of appointment generally provides for a three-month notice period. Non-Executive Directors are normally appointed for two consecutive three-year terms, with any third term of three years being subject to rigorous review, taking into account the need progressively to refresh the Board.
In line with the requirement of the Code, all Non-Executive Directors including the Chairman are subject to annual re-election by shareholders at each AGM. The appointment of each of the Non-Executive Directors is subject to early termination without compensation if they are not re-appointed at a meeting of shareholders.
Remuneration policy for the Chairman and Non-Executive DirectorsThe Chairman and Non-Executive Directors may on occasion receive reimbursement of costs incurred in relation to professional advice. These payments, if made, are taxable benefits to the Non-Executive Director and the tax arising is paid by the Company on the Director’s behalf.
Fees for the Non-Executive Directors are determined by the Board as a whole, on the recommendation of the Executive Directors and the Chairman. Fees for the Chairman are determined by the Remuneration Committee.
The policy on fees for the Chairman and Non-Executive Directors is:
Purpose and link to strategy
To be sufficient to attract, motivate and retain Non-Executive Directors necessary to contribute to a high-performing Board.
Chairman The fee for the Chairman is determined by the Committee and reflects the commitment, demands and responsibility of the role. The fee is paid monthly and can either be taken in cash or shares or a combination of both. The fee is inclusive of all Committee roles and is not performance-related or pensionable. Limited benefits relating to travel, accommodation and meals may also be payable in certain circumstances, with the tax arising being paid by the Company on the Chairman’s behalf.
The fee payable to the Chairman may be varied (either up or down) from this level during the three-year period that this Remuneration Policy operates to ensure it continues to appropriately recognise the requirements of the role.
Non-Executive Directors
Fees are determined by the Board, within the limits set out in the Company’s Articles of Association, with Non-Executive Directors abstaining from any discussion or decision on their fees.
The Board takes account of recognised best practice standards for such positions when determining the fee level and structure.
The Non-Executive Directors receive a base fee. Additional fees may be payable for chairmanship of the Company’s key Committees and for performing the Senior Independent Director role. Non-Executive Directors may also receive an allowance in the event they are required to undertake intercontinental travel for the purpose of attending Board or Committee meetings or site visits. Fees are paid monthly and can either be taken in cash or shares or a combination of both.
Non-Executive Directors’ letters of appointment contain provisions for payment in lieu of notice.
Other than the Group Employee Director, Non-Executive Directors do not participate in any of the Company’s incentive arrangements or receive any pension provision.
Non-Executive Directors are reimbursed for expenses and any tax arising on those expenses is settled directly by the Company. To the extent that these are deemed taxable benefits, they will be included in the Annual report on remuneration, as required.
Reasonable costs of travel and accommodation for business purposes are reimbursed to Non-Executive Directors. On the limited occasions when it is appropriate for a Non-Executive Director’s spouse or partner to attend, such as to a business event, the Company will meet these costs. The Company will meet any tax liabilities that may arise on such expenses.
Fee levels may be varied (either up or down) during the three-year period that the Remuneration Policy operates to ensure they continue to appropriately recognise the time commitment and responsibilities of the role, increases or decreases to fee levels for Non-Executive Directors in general and fee levels in companies of a similar size and complexity.
Group Employee Director
The Group Employee Director’s fee is in line with the basic fee of the Non-Executive Directors and is payable in addition to the remuneration received as an employee of the respective Group operating company, which includes participation in any benefit and incentive arrangements and pension scheme.
Consideration of shareholder viewsThe Committee values its continued dialogue with shareholders and engages directly with them and their representative bodies at the earliest opportunity. Shareholder feedback received in relation to the AGM, as well as any additional feedback and guidance received during the year, is considered by the Committee as it develops the Company’s remuneration framework and practices.
FirstGroup Annual Report and Accounts 201880
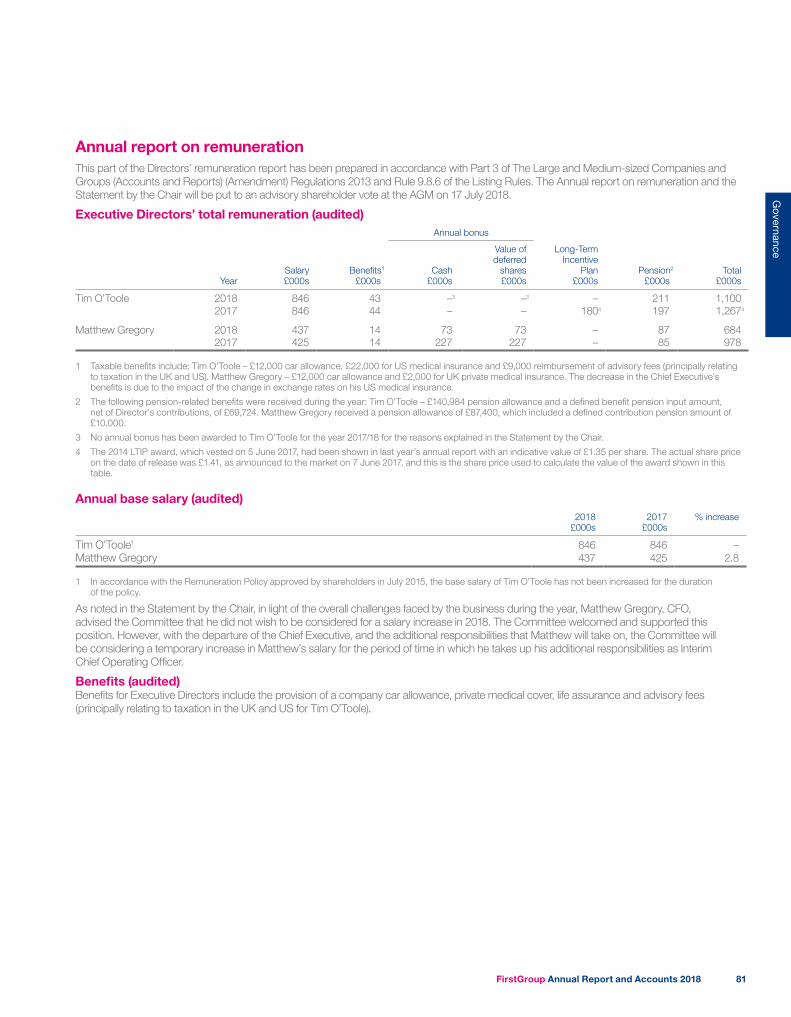
Annual report on remunerationThis part of the Directors’ remuneration report has been prepared in accordance with Part 3 of The Large and Medium-sized Companies and Groups (Accounts and Reports) (Amendment) Regulations 2013 and Rule 9.8.6 of the Listing Rules. The Annual report on remuneration and the Statement by the Chair will be put to an advisory shareholder vote at the AGM on 17 July 2018.
Executive Directors’ total remuneration (audited)Annual bonus
YearSalary £000s
Benefits1
£000s Cash
£000s
Value of deferred
shares £000s
Long-Term Incentive
Plan £000s
Pension2
£000s Total
£000s
Tim O’Toole 2018 846 43 –3 –3 – 211 1,1002017 846 44 – – 1804 197 1,2674
Matthew Gregory 2018 437 14 73 73 – 87 6842017 425 14 227 227 – 85 978
1 Taxable benefits include: Tim O’Toole – £12,000 car allowance, £22,000 for US medical insurance and £9,000 reimbursement of advisory fees (principally relating to taxation in the UK and US). Matthew Gregory – £12,000 car allowance and £2,000 for UK private medical insurance. The decrease in the Chief Executive’s benefits is due to the impact of the change in exchange rates on his US medical insurance.
2 The following pension-related benefits were received during the year: Tim O’Toole – £140,984 pension allowance and a defined benefit pension input amount, net of Director’s contributions, of £69,724. Matthew Gregory received a pension allowance of £87,400, which included a defined contribution pension amount of £10,000.
3 No annual bonus has been awarded to Tim O’Toole for the year 2017/18 for the reasons explained in the Statement by the Chair.
4 The 2014 LTIP award, which vested on 5 June 2017, had been shown in last year’s annual report with an indicative value of £1.35 per share. The actual share price on the date of release was £1.41, as announced to the market on 7 June 2017, and this is the share price used to calculate the value of the award shown in this table.
Annual base salary (audited)2018
£000s2017
£000s% increase
Tim O’Toole1 846 846 –Matthew Gregory 437 425 2.8
1 In accordance with the Remuneration Policy approved by shareholders in July 2015, the base salary of Tim O’Toole has not been increased for the duration of the policy.
As noted in the Statement by the Chair, in light of the overall challenges faced by the business during the year, Matthew Gregory, CFO, advised the Committee that he did not wish to be considered for a salary increase in 2018. The Committee welcomed and supported this position. However, with the departure of the Chief Executive, and the additional responsibilities that Matthew will take on, the Committee will be considering a temporary increase in Matthew’s salary for the period of time in which he takes up his additional responsibilities as Interim Chief Operating Officer.
Benefits (audited)Benefits for Executive Directors include the provision of a company car allowance, private medical cover, life assurance and advisory fees (principally relating to taxation in the UK and US for Tim O’Toole).
FirstGroup Annual Report and Accounts 2018 81
Governance
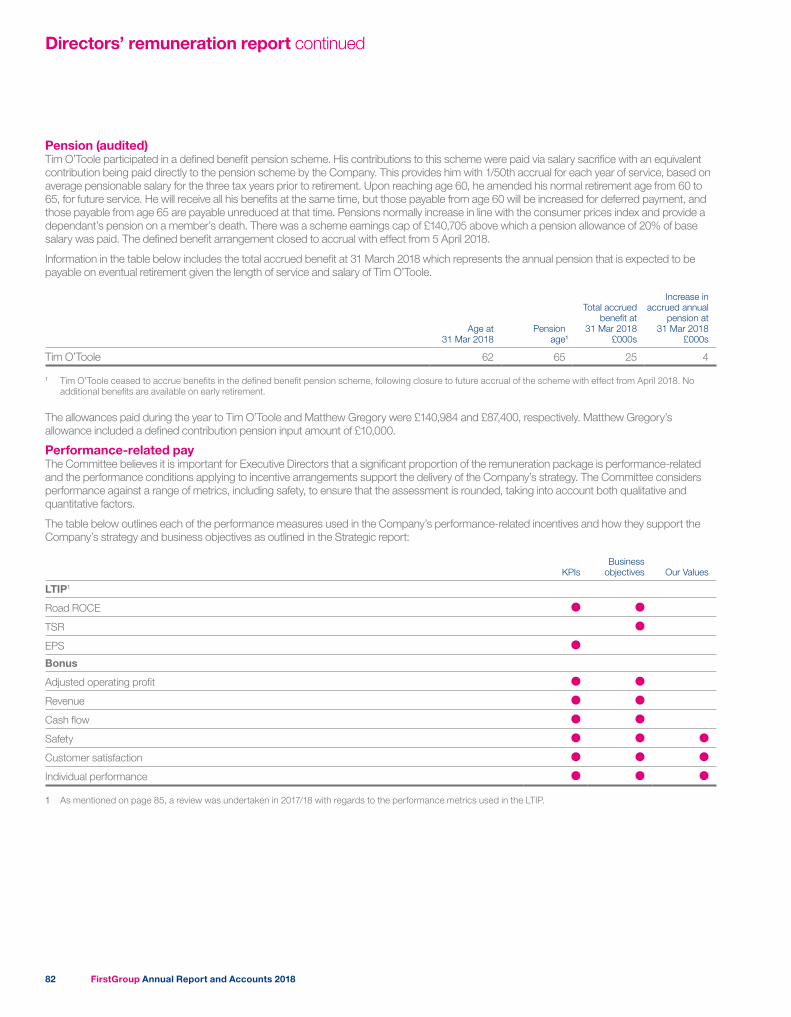
Directors’ remuneration report continued
Pension (audited)Tim O’Toole participated in a defined benefit pension scheme. His contributions to this scheme were paid via salary sacrifice with an equivalent contribution being paid directly to the pension scheme by the Company. This provides him with 1/50th accrual for each year of service, based on average pensionable salary for the three tax years prior to retirement. Upon reaching age 60, he amended his normal retirement age from 60 to 65, for future service. He will receive all his benefits at the same time, but those payable from age 60 will be increased for deferred payment, and those payable from age 65 are payable unreduced at that time. Pensions normally increase in line with the consumer prices index and provide a dependant’s pension on a member’s death. There was a scheme earnings cap of £140,705 above which a pension allowance of 20% of base salary was paid. The defined benefit arrangement closed to accrual with effect from 5 April 2018.
Information in the table below includes the total accrued benefit at 31 March 2018 which represents the annual pension that is expected to be payable on eventual retirement given the length of service and salary of Tim O’Toole.
Age at 31 Mar 2018
Pension age1
Total accrued benefit at
31 Mar 2018 £000s
Increase inaccrued annual
pension at 31 Mar 2018
£000s
Tim O’Toole 62 65 25 4
1 Tim O’Toole ceased to accrue benefits in the defined benefit pension scheme, following closure to future accrual of the scheme with effect from April 2018. No additional benefits are available on early retirement.
The allowances paid during the year to Tim O’Toole and Matthew Gregory were £140,984 and £87,400, respectively. Matthew Gregory’s allowance included a defined contribution pension input amount of £10,000.
Performance-related payThe Committee believes it is important for Executive Directors that a significant proportion of the remuneration package is performance-related and the performance conditions applying to incentive arrangements support the delivery of the Company’s strategy. The Committee considers performance against a range of metrics, including safety, to ensure that the assessment is rounded, taking into account both qualitative and quantitative factors.
The table below outlines each of the performance measures used in the Company’s performance-related incentives and how they support the Company’s strategy and business objectives as outlined in the Strategic report:
KPIsBusiness
objectives Our Values
LTIP1
Road ROCE
TSR
EPS
Bonus
Adjusted operating profit
Revenue
Cash flow
Safety
Customer satisfaction
Individual performance
1 As mentioned on page 85, a review was undertaken in 2017/18 with regards to the performance metrics used in the LTIP.
FirstGroup Annual Report and Accounts 201882
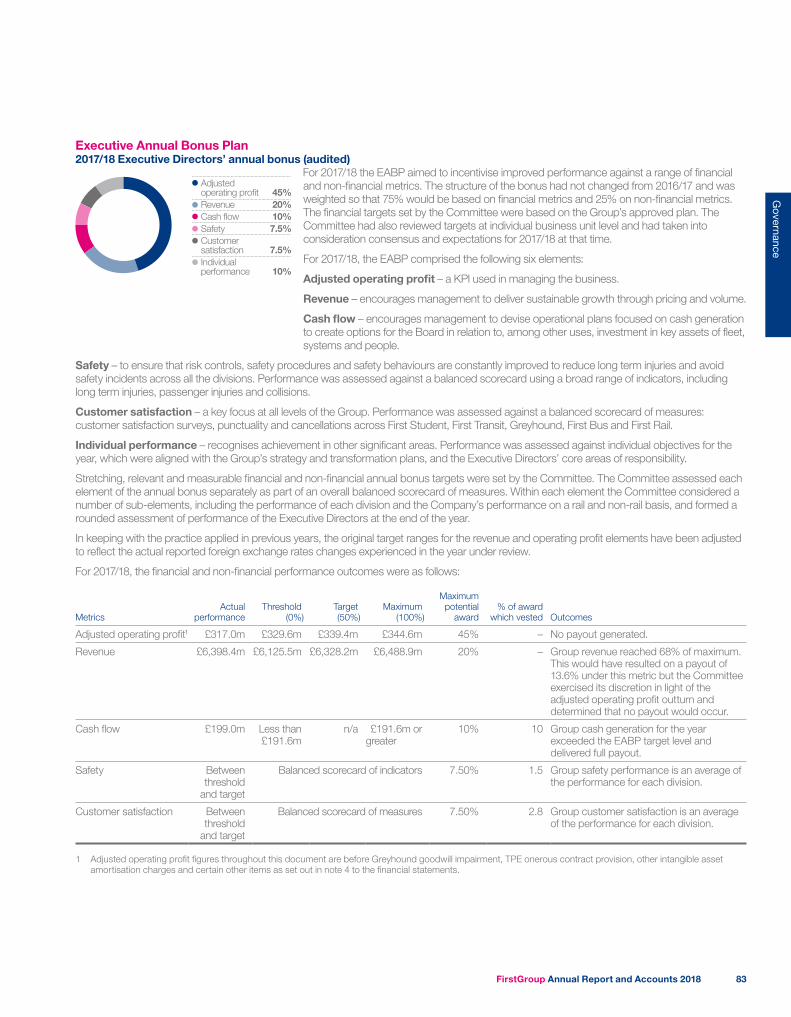
Executive Annual Bonus Plan2017/18 Executive Directors’ annual bonus (audited)
Adjusted operating profit 45%Revenue 20%Cash flow 10%Safety 7.5%Customer satisfaction 7.5%Individual performance 10%
For 2017/18 the EABP aimed to incentivise improved performance against a range of financial and non-financial metrics. The structure of the bonus had not changed from 2016/17 and was weighted so that 75% would be based on financial metrics and 25% on non-financial metrics. The financial targets set by the Committee were based on the Group’s approved plan. The Committee had also reviewed targets at individual business unit level and had taken into consideration consensus and expectations for 2017/18 at that time.
For 2017/18, the EABP comprised the following six elements:
Adjusted operating profit – a KPI used in managing the business.
Revenue – encourages management to deliver sustainable growth through pricing and volume.
Cash flow – encourages management to devise operational plans focused on cash generation to create options for the Board in relation to, among other uses, investment in key assets of fleet, systems and people.
Safety – to ensure that risk controls, safety procedures and safety behaviours are constantly improved to reduce long term injuries and avoid safety incidents across all the divisions. Performance was assessed against a balanced scorecard using a broad range of indicators, including long term injuries, passenger injuries and collisions.
Customer satisfaction – a key focus at all levels of the Group. Performance was assessed against a balanced scorecard of measures: customer satisfaction surveys, punctuality and cancellations across First Student, First Transit, Greyhound, First Bus and First Rail.
Individual performance – recognises achievement in other significant areas. Performance was assessed against individual objectives for the year, which were aligned with the Group’s strategy and transformation plans, and the Executive Directors’ core areas of responsibility.
Stretching, relevant and measurable financial and non-financial annual bonus targets were set by the Committee. The Committee assessed each element of the annual bonus separately as part of an overall balanced scorecard of measures. Within each element the Committee considered a number of sub-elements, including the performance of each division and the Company’s performance on a rail and non-rail basis, and formed a rounded assessment of performance of the Executive Directors at the end of the year.
In keeping with the practice applied in previous years, the original target ranges for the revenue and operating profit elements have been adjusted to reflect the actual reported foreign exchange rates changes experienced in the year under review.
For 2017/18, the financial and non-financial performance outcomes were as follows:
Metrics Actual
performanceThreshold
(0%)Target (50%)
Maximum (100%)
Maximum potential
award% of award
which vested Outcomes
Adjusted operating profit1 £317.0m £329.6m £339.4m £344.6m 45% – No payout generated.
Revenue £6,398.4m £6,125.5m £6,328.2m £6,488.9m 20% – Group revenue reached 68% of maximum. This would have resulted on a payout of 13.6% under this metric but the Committee exercised its discretion in light of the adjusted operating profit outturn and determined that no payout would occur.
Cash flow £199.0m Less than £191.6m
n/a £191.6m or greater
10% 10 Group cash generation for the year exceeded the EABP target level and delivered full payout.
Safety Between threshold
and target
Balanced scorecard of indicators 7.50% 1.5 Group safety performance is an average of the performance for each division.
Customer satisfaction Between threshold
and target
Balanced scorecard of measures 7.50% 2.8 Group customer satisfaction is an average of the performance for each division.
1 Adjusted operating profit figures throughout this document are before Greyhound goodwill impairment, TPE onerous contract provision, other intangible asset amortisation charges and certain other items as set out in note 4 to the financial statements.
FirstGroup Annual Report and Accounts 2018 83
Governance
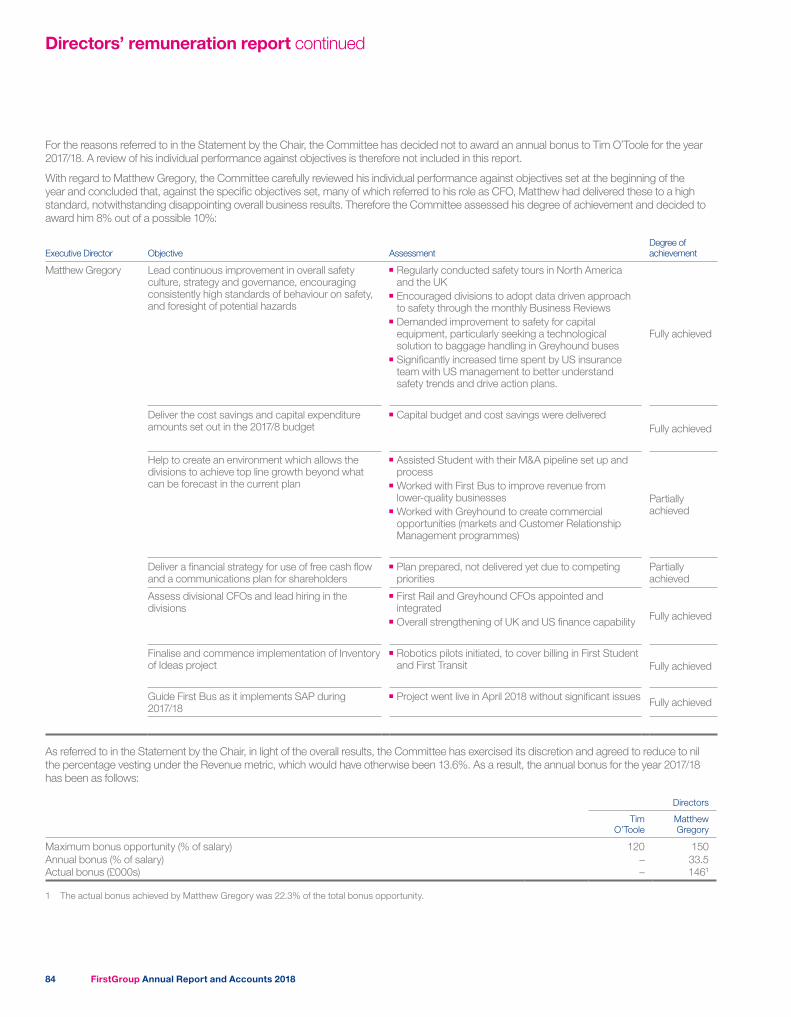
Directors’ remuneration report continued
For the reasons referred to in the Statement by the Chair, the Committee has decided not to award an annual bonus to Tim O’Toole for the year 2017/18. A review of his individual performance against objectives is therefore not included in this report.
With regard to Matthew Gregory, the Committee carefully reviewed his individual performance against objectives set at the beginning of the year and concluded that, against the specific objectives set, many of which referred to his role as CFO, Matthew had delivered these to a high standard, notwithstanding disappointing overall business results. Therefore the Committee assessed his degree of achievement and decided to award him 8% out of a possible 10%:
Executive Director Objective AssessmentDegree of achievement
Matthew Gregory Lead continuous improvement in overall safety culture, strategy and governance, encouraging consistently high standards of behaviour on safety, and foresight of potential hazards
■■ Regularly conducted safety tours in North America and the UK
■■ Encouraged divisions to adopt data driven approach to safety through the monthly Business Reviews
■■ Demanded improvement to safety for capital equipment, particularly seeking a technological solution to baggage handling in Greyhound buses
■■ Significantly increased time spent by US insurance team with US management to better understand safety trends and drive action plans.
Fully achieved
Deliver the cost savings and capital expenditure amounts set out in the 2017/8 budget
■■ Capital budget and cost savings were deliveredFully achieved
Help to create an environment which allows the divisions to achieve top line growth beyond what can be forecast in the current plan
■■ Assisted Student with their M&A pipeline set up and process
■■ Worked with First Bus to improve revenue from lower-quality businesses
■■ Worked with Greyhound to create commercial opportunities (markets and Customer Relationship Management programmes)
Partially achieved
Deliver a financial strategy for use of free cash flow and a communications plan for shareholders
■■ Plan prepared, not delivered yet due to competing priorities
Partially achieved
Assess divisional CFOs and lead hiring in the divisions
■■ First Rail and Greyhound CFOs appointed and integrated
■■ Overall strengthening of UK and US finance capability Fully achieved
Finalise and commence implementation of Inventory of Ideas project
■■ Robotics pilots initiated, to cover billing in First Student and First Transit Fully achieved
Guide First Bus as it implements SAP during 2017/18
■■ Project went live in April 2018 without significant issues Fully achieved
As referred to in the Statement by the Chair, in light of the overall results, the Committee has exercised its discretion and agreed to reduce to nil the percentage vesting under the Revenue metric, which would have otherwise been 13.6%. As a result, the annual bonus for the year 2017/18 has been as follows:
Directors
Tim O’Toole
Matthew Gregory
Maximum bonus opportunity (% of salary) 120 150Annual bonus (% of salary) – 33.5Actual bonus (£000s) – 1461
1 The actual bonus achieved by Matthew Gregory was 22.3% of the total bonus opportunity.
FirstGroup Annual Report and Accounts 201884
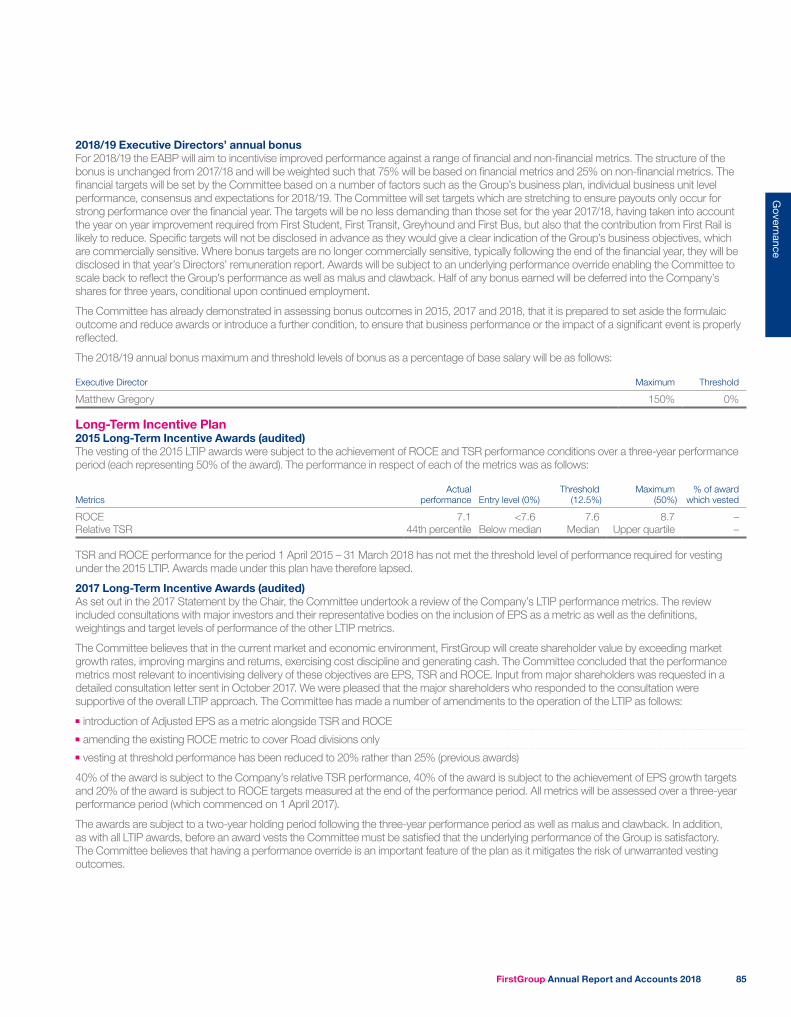
2018/19 Executive Directors’ annual bonusFor 2018/19 the EABP will aim to incentivise improved performance against a range of financial and non-financial metrics. The structure of the bonus is unchanged from 2017/18 and will be weighted such that 75% will be based on financial metrics and 25% on non-financial metrics. The financial targets will be set by the Committee based on a number of factors such as the Group’s business plan, individual business unit level performance, consensus and expectations for 2018/19. The Committee will set targets which are stretching to ensure payouts only occur for strong performance over the financial year. The targets will be no less demanding than those set for the year 2017/18, having taken into account the year on year improvement required from First Student, First Transit, Greyhound and First Bus, but also that the contribution from First Rail is likely to reduce. Specific targets will not be disclosed in advance as they would give a clear indication of the Group’s business objectives, which are commercially sensitive. Where bonus targets are no longer commercially sensitive, typically following the end of the financial year, they will be disclosed in that year’s Directors’ remuneration report. Awards will be subject to an underlying performance override enabling the Committee to scale back to reflect the Group’s performance as well as malus and clawback. Half of any bonus earned will be deferred into the Company’s shares for three years, conditional upon continued employment.
The Committee has already demonstrated in assessing bonus outcomes in 2015, 2017 and 2018, that it is prepared to set aside the formulaic outcome and reduce awards or introduce a further condition, to ensure that business performance or the impact of a significant event is properly reflected.
The 2018/19 annual bonus maximum and threshold levels of bonus as a percentage of base salary will be as follows:
Executive Director Maximum Threshold
Matthew Gregory 150% 0%
Long-Term Incentive Plan2015 Long-Term Incentive Awards (audited)The vesting of the 2015 LTIP awards were subject to the achievement of ROCE and TSR performance conditions over a three-year performance period (each representing 50% of the award). The performance in respect of each of the metrics was as follows:
MetricsActual
performance Entry level (0%)Threshold
(12.5%)Maximum
(50%)% of award
which vested
ROCE 7.1 <7.6 7.6 8.7 –Relative TSR 44th percentile Below median Median Upper quartile –
TSR and ROCE performance for the period 1 April 2015 – 31 March 2018 has not met the threshold level of performance required for vesting under the 2015 LTIP. Awards made under this plan have therefore lapsed.
2017 Long-Term Incentive Awards (audited)As set out in the 2017 Statement by the Chair, the Committee undertook a review of the Company’s LTIP performance metrics. The review included consultations with major investors and their representative bodies on the inclusion of EPS as a metric as well as the definitions, weightings and target levels of performance of the other LTIP metrics.
The Committee believes that in the current market and economic environment, FirstGroup will create shareholder value by exceeding market growth rates, improving margins and returns, exercising cost discipline and generating cash. The Committee concluded that the performance metrics most relevant to incentivising delivery of these objectives are EPS, TSR and ROCE. Input from major shareholders was requested in a detailed consultation letter sent in October 2017. We were pleased that the major shareholders who responded to the consultation were supportive of the overall LTIP approach. The Committee has made a number of amendments to the operation of the LTIP as follows:
■■ introduction of Adjusted EPS as a metric alongside TSR and ROCE ■■ amending the existing ROCE metric to cover Road divisions only ■■ vesting at threshold performance has been reduced to 20% rather than 25% (previous awards)
40% of the award is subject to the Company’s relative TSR performance, 40% of the award is subject to the achievement of EPS growth targets and 20% of the award is subject to ROCE targets measured at the end of the performance period. All metrics will be assessed over a three-year performance period (which commenced on 1 April 2017).
The awards are subject to a two-year holding period following the three-year performance period as well as malus and clawback. In addition, as with all LTIP awards, before an award vests the Committee must be satisfied that the underlying performance of the Group is satisfactory. The Committee believes that having a performance override is an important feature of the plan as it mitigates the risk of unwarranted vesting outcomes.
FirstGroup Annual Report and Accounts 2018 85
Governance
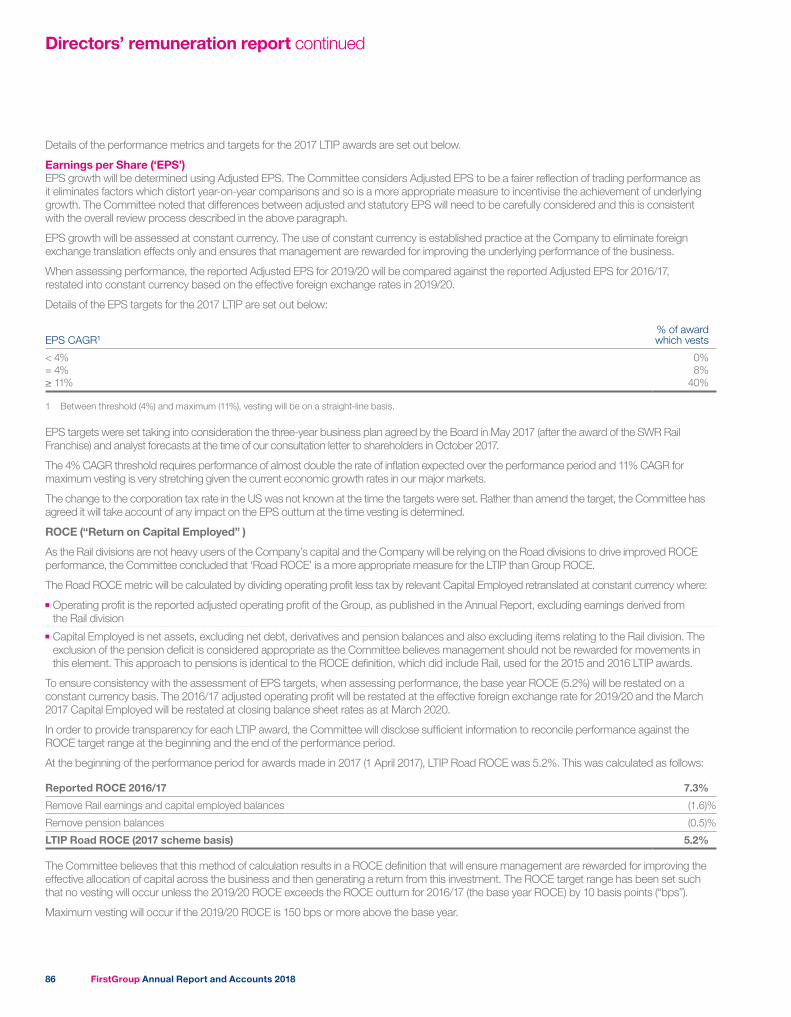
Directors’ remuneration report continued
Details of the performance metrics and targets for the 2017 LTIP awards are set out below.
Earnings per Share (‘EPS’) EPS growth will be determined using Adjusted EPS. The Committee considers Adjusted EPS to be a fairer reflection of trading performance as it eliminates factors which distort year-on-year comparisons and so is a more appropriate measure to incentivise the achievement of underlying growth. The Committee noted that differences between adjusted and statutory EPS will need to be carefully considered and this is consistent with the overall review process described in the above paragraph.
EPS growth will be assessed at constant currency. The use of constant currency is established practice at the Company to eliminate foreign exchange translation effects only and ensures that management are rewarded for improving the underlying performance of the business.
When assessing performance, the reported Adjusted EPS for 2019/20 will be compared against the reported Adjusted EPS for 2016/17, restated into constant currency based on the effective foreign exchange rates in 2019/20.
Details of the EPS targets for the 2017 LTIP are set out below:
EPS CAGR1% of award which vests
< 4% 0%= 4% 8%≥ 11% 40%
1 Between threshold (4%) and maximum (11%), vesting will be on a straight-line basis.
EPS targets were set taking into consideration the three-year business plan agreed by the Board in May 2017 (after the award of the SWR Rail Franchise) and analyst forecasts at the time of our consultation letter to shareholders in October 2017.
The 4% CAGR threshold requires performance of almost double the rate of inflation expected over the performance period and 11% CAGR for maximum vesting is very stretching given the current economic growth rates in our major markets.
The change to the corporation tax rate in the US was not known at the time the targets were set. Rather than amend the target, the Committee has agreed it will take account of any impact on the EPS outturn at the time vesting is determined.
ROCE (“Return on Capital Employed” )
As the Rail divisions are not heavy users of the Company’s capital and the Company will be relying on the Road divisions to drive improved ROCE performance, the Committee concluded that ‘Road ROCE’ is a more appropriate measure for the LTIP than Group ROCE.
The Road ROCE metric will be calculated by dividing operating profit less tax by relevant Capital Employed retranslated at constant currency where:
■■ Operating profit is the reported adjusted operating profit of the Group, as published in the Annual Report, excluding earnings derived from the Rail division
■■ Capital Employed is net assets, excluding net debt, derivatives and pension balances and also excluding items relating to the Rail division. The exclusion of the pension deficit is considered appropriate as the Committee believes management should not be rewarded for movements in this element. This approach to pensions is identical to the ROCE definition, which did include Rail, used for the 2015 and 2016 LTIP awards.
To ensure consistency with the assessment of EPS targets, when assessing performance, the base year ROCE (5.2%) will be restated on a constant currency basis. The 2016/17 adjusted operating profit will be restated at the effective foreign exchange rate for 2019/20 and the March 2017 Capital Employed will be restated at closing balance sheet rates as at March 2020.
In order to provide transparency for each LTIP award, the Committee will disclose sufficient information to reconcile performance against the ROCE target range at the beginning and the end of the performance period.
At the beginning of the performance period for awards made in 2017 (1 April 2017), LTIP Road ROCE was 5.2%. This was calculated as follows:
Reported ROCE 2016/17 7.3%
Remove Rail earnings and capital employed balances (1.6)%
Remove pension balances (0.5)%
LTIP Road ROCE (2017 scheme basis) 5.2%
The Committee believes that this method of calculation results in a ROCE definition that will ensure management are rewarded for improving the effective allocation of capital across the business and then generating a return from this investment. The ROCE target range has been set such that no vesting will occur unless the 2019/20 ROCE exceeds the ROCE outturn for 2016/17 (the base year ROCE) by 10 basis points (“bps”).
Maximum vesting will occur if the 2019/20 ROCE is 150 bps or more above the base year.
FirstGroup Annual Report and Accounts 201886
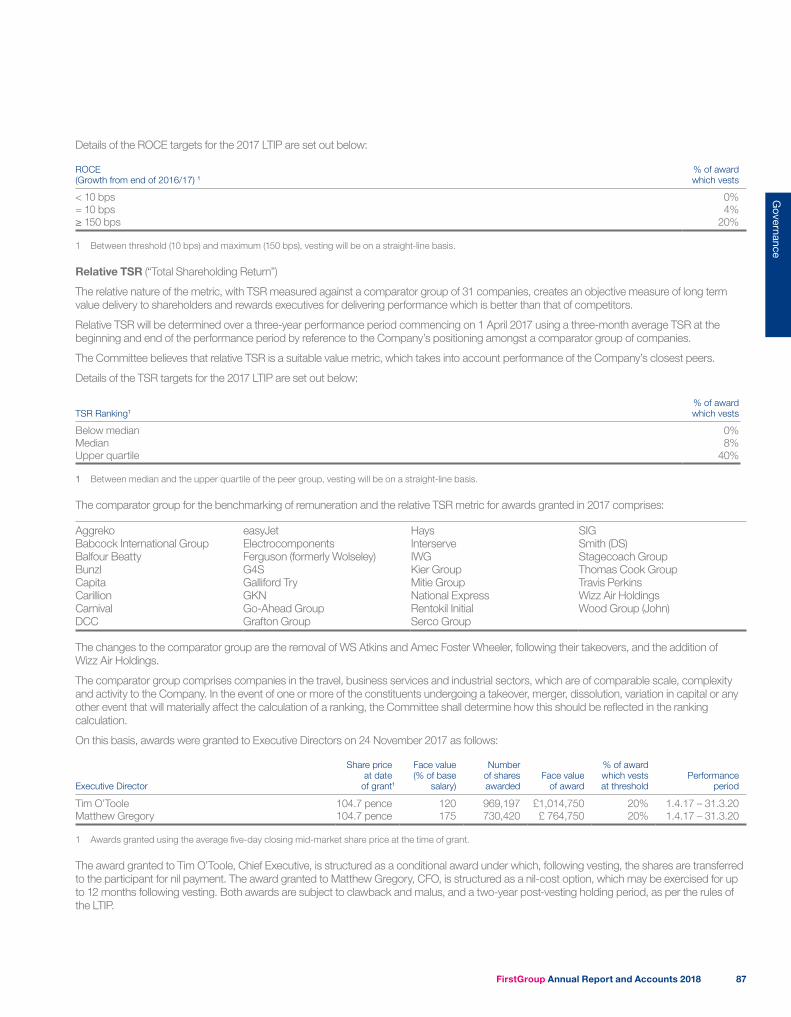
Details of the ROCE targets for the 2017 LTIP are set out below:
ROCE (Growth from end of 2016/17) 1
% of award which vests
< 10 bps 0%= 10 bps 4%≥ 150 bps 20%
1 Between threshold (10 bps) and maximum (150 bps), vesting will be on a straight-line basis.
Relative TSR (“Total Shareholding Return”)
The relative nature of the metric, with TSR measured against a comparator group of 31 companies, creates an objective measure of long term value delivery to shareholders and rewards executives for delivering performance which is better than that of competitors.
Relative TSR will be determined over a three-year performance period commencing on 1 April 2017 using a three-month average TSR at the beginning and end of the performance period by reference to the Company’s positioning amongst a comparator group of companies.
The Committee believes that relative TSR is a suitable value metric, which takes into account performance of the Company’s closest peers.
Details of the TSR targets for the 2017 LTIP are set out below:
TSR Ranking1% of award which vests
Below median 0%Median 8%Upper quartile 40%
1 Between median and the upper quartile of the peer group, vesting will be on a straight-line basis.
The comparator group for the benchmarking of remuneration and the relative TSR metric for awards granted in 2017 comprises:
Aggreko easyJet Hays SIGBabcock International Group Electrocomponents Interserve Smith (DS)Balfour Beatty Ferguson (formerly Wolseley) IWG Stagecoach GroupBunzl G4S Kier Group Thomas Cook GroupCapita Galliford Try Mitie Group Travis PerkinsCarillion GKN National Express Wizz Air HoldingsCarnival Go-Ahead Group Rentokil Initial Wood Group (John)DCC Grafton Group Serco Group
The changes to the comparator group are the removal of WS Atkins and Amec Foster Wheeler, following their takeovers, and the addition of Wizz Air Holdings.
The comparator group comprises companies in the travel, business services and industrial sectors, which are of comparable scale, complexity and activity to the Company. In the event of one or more of the constituents undergoing a takeover, merger, dissolution, variation in capital or any other event that will materially affect the calculation of a ranking, the Committee shall determine how this should be reflected in the ranking calculation.
On this basis, awards were granted to Executive Directors on 24 November 2017 as follows:
Executive Director
Share priceat date
of grant1
Face value(% of base
salary)
Numberof sharesawarded
Face valueof award
% of awardwhich vestsat threshold
Performanceperiod
Tim O’Toole 104.7 pence 120 969,197 £1,014,750 20% 1.4.17 – 31.3.20Matthew Gregory 104.7 pence 175 730,420 £ 764,750 20% 1.4.17 – 31.3.20
1 Awards granted using the average five-day closing mid-market share price at the time of grant.
The award granted to Tim O’Toole, Chief Executive, is structured as a conditional award under which, following vesting, the shares are transferred to the participant for nil payment. The award granted to Matthew Gregory, CFO, is structured as a nil-cost option, which may be exercised for up to 12 months following vesting. Both awards are subject to clawback and malus, and a two-year post-vesting holding period, as per the rules of the LTIP.
FirstGroup Annual Report and Accounts 2018 87
Governance
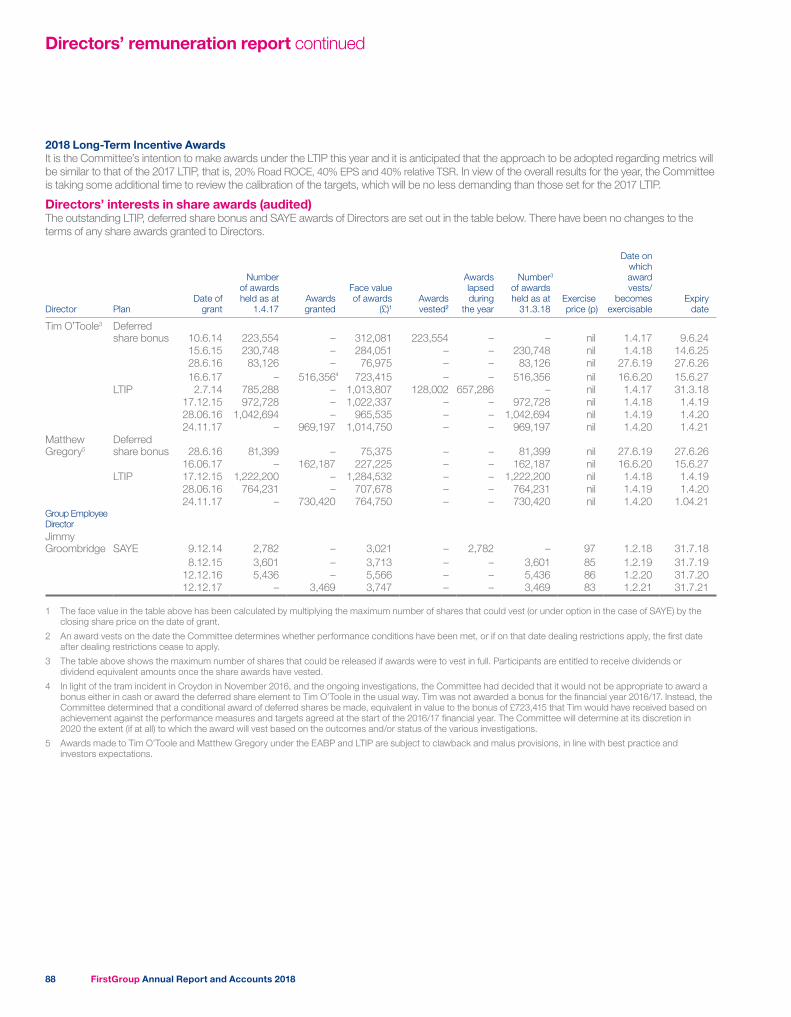
Directors’ remuneration report continued
2018 Long-Term Incentive AwardsIt is the Committee’s intention to make awards under the LTIP this year and it is anticipated that the approach to be adopted regarding metrics will be similar to that of the 2017 LTIP, that is, 20% Road ROCE, 40% EPS and 40% relative TSR. In view of the overall results for the year, the Committee is taking some additional time to review the calibration of the targets, which will be no less demanding than those set for the 2017 LTIP.
Directors’ interests in share awards (audited)The outstanding LTIP, deferred share bonus and SAYE awards of Directors are set out in the table below. There have been no changes to the terms of any share awards granted to Directors.
Director PlanDate of
grant
Number of awards held as at
1.4.17Awards granted
Face value of awards
(£)1Awards vested2
Awards lapsed during
the year
Number3 of awards held as at
31.3.18 Exercise price (p)
Date on which award vests/
becomes exercisable
Expiry date
Tim O’Toole3 Deferred share bonus 10.6.14 223,554 – 312,081 223,554 – – nil 1.4.17 9.6.24
15.6.15 230,748 – 284,051 – – 230,748 nil 1.4.18 14.6.2528.6.16 83,126 – 76,975 – – 83,126 nil 27.6.19 27.6.2616.6.17 – 516,3564 723,415 – – 516,356 nil 16.6.20 15.6.27
LTIP 2.7.14 785,288 – 1,013,807 128,002 657,286 – nil 1.4.17 31.3.1817.12.15 972,728 – 1,022,337 – – 972,728 nil 1.4.18 1.4.1928.06.16 1,042,694 – 965,535 – – 1,042,694 nil 1.4.19 1.4.2024.11.17 – 969,197 1,014,750 – – 969,197 nil 1.4.20 1.4.21
Matthew Gregory5
Deferred share bonus 28.6.16 81,399 – 75,375 – – 81,399 nil 27.6.19 27.6.26
16.06.17 – 162,187 227,225 – – 162,187 nil 16.6.20 15.6.27LTIP 17.12.15 1,222,200 – 1,284,532 – – 1,222,200 nil 1.4.18 1.4.19
28.06.16 764,231 – 707,678 – – 764,231 nil 1.4.19 1.4.2024.11.17 – 730,420 764,750 – – 730,420 nil 1.4.20 1.04.21
Group Employee Director Jimmy Groombridge SAYE 9.12.14 2,782 – 3,021 – 2,782 – 97 1.2.18 31.7.18
8.12.15 3,601 – 3,713 – – 3,601 85 1.2.19 31.7.1912.12.16 5,436 – 5,566 – – 5,436 86 1.2.20 31.7.2012.12.17 – 3,469 3,747 – – 3,469 83 1.2.21 31.7.21
1 The face value in the table above has been calculated by multiplying the maximum number of shares that could vest (or under option in the case of SAYE) by the closing share price on the date of grant.
2 An award vests on the date the Committee determines whether performance conditions have been met, or if on that date dealing restrictions apply, the first date after dealing restrictions cease to apply.
3 The table above shows the maximum number of shares that could be released if awards were to vest in full. Participants are entitled to receive dividends or dividend equivalent amounts once the share awards have vested.
4 In light of the tram incident in Croydon in November 2016, and the ongoing investigations, the Committee had decided that it would not be appropriate to award a bonus either in cash or award the deferred share element to Tim O’Toole in the usual way. Tim was not awarded a bonus for the financial year 2016/17. Instead, the Committee determined that a conditional award of deferred shares be made, equivalent in value to the bonus of £723,415 that Tim would have received based on achievement against the performance measures and targets agreed at the start of the 2016/17 financial year. The Committee will determine at its discretion in 2020 the extent (if at all) to which the award will vest based on the outcomes and/or status of the various investigations.
5 Awards made to Tim O’Toole and Matthew Gregory under the EABP and LTIP are subject to clawback and malus provisions, in line with best practice and investors expectations.
FirstGroup Annual Report and Accounts 201888
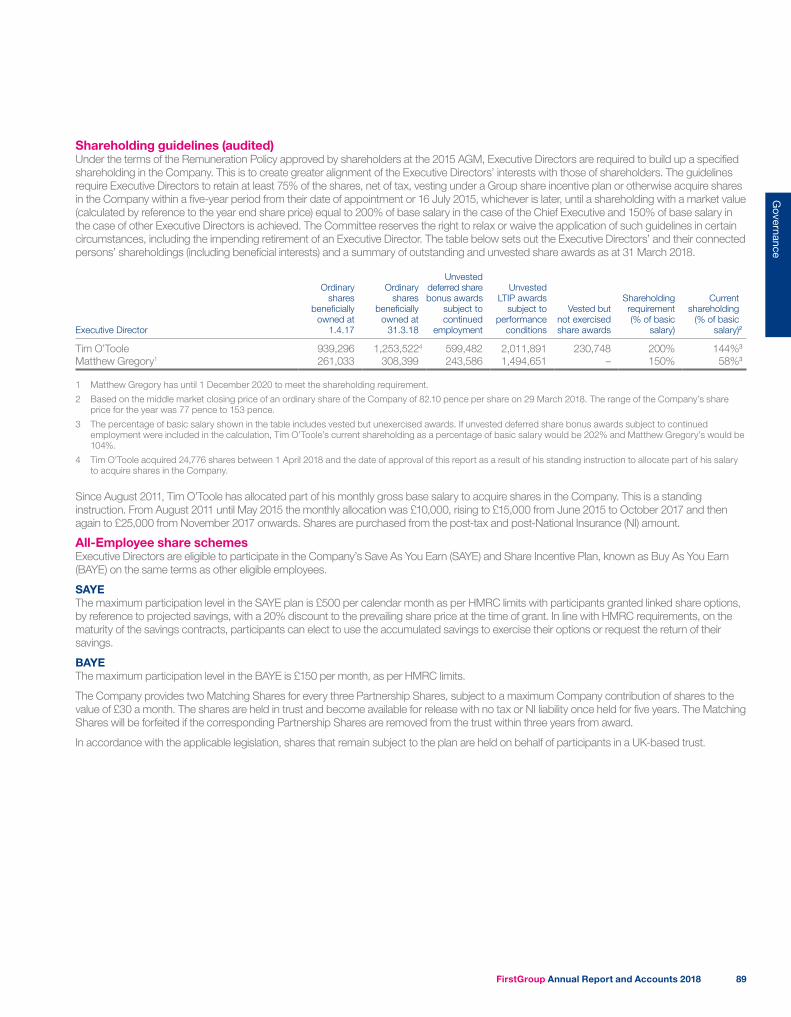
Shareholding guidelines (audited)Under the terms of the Remuneration Policy approved by shareholders at the 2015 AGM, Executive Directors are required to build up a specified shareholding in the Company. This is to create greater alignment of the Executive Directors’ interests with those of shareholders. The guidelines require Executive Directors to retain at least 75% of the shares, net of tax, vesting under a Group share incentive plan or otherwise acquire shares in the Company within a five-year period from their date of appointment or 16 July 2015, whichever is later, until a shareholding with a market value (calculated by reference to the year end share price) equal to 200% of base salary in the case of the Chief Executive and 150% of base salary in the case of other Executive Directors is achieved. The Committee reserves the right to relax or waive the application of such guidelines in certain circumstances, including the impending retirement of an Executive Director. The table below sets out the Executive Directors’ and their connected persons’ shareholdings (including beneficial interests) and a summary of outstanding and unvested share awards as at 31 March 2018.
Executive Director
Ordinary shares
beneficially owned at
1.4.17
Ordinary shares
beneficially owned at
31.3.18
Unvested deferred share bonus awards
subject to continued
employment
Unvested LTIP awards
subject to performance
conditions
Vested but not exercised share awards
Shareholding requirement(% of basic
salary)
Current shareholding
(% of basic salary)2
Tim O’Toole 939,296 1,253,5224 599,482 2,011,891 230,748 200% 144%3
Matthew Gregory1 261,033 308,399 243,586 1,494,651 – 150% 58%3
1 Matthew Gregory has until 1 December 2020 to meet the shareholding requirement.
2 Based on the middle market closing price of an ordinary share of the Company of 82.10 pence per share on 29 March 2018. The range of the Company’s share price for the year was 77 pence to 153 pence.
3 The percentage of basic salary shown in the table includes vested but unexercised awards. If unvested deferred share bonus awards subject to continued employment were included in the calculation, Tim O’Toole’s current shareholding as a percentage of basic salary would be 202% and Matthew Gregory’s would be 104%.
4 Tim O’Toole acquired 24,776 shares between 1 April 2018 and the date of approval of this report as a result of his standing instruction to allocate part of his salary to acquire shares in the Company.
Since August 2011, Tim O’Toole has allocated part of his monthly gross base salary to acquire shares in the Company. This is a standing instruction. From August 2011 until May 2015 the monthly allocation was £10,000, rising to £15,000 from June 2015 to October 2017 and then again to £25,000 from November 2017 onwards. Shares are purchased from the post-tax and post-National Insurance (NI) amount.
All-Employee share schemesExecutive Directors are eligible to participate in the Company’s Save As You Earn (SAYE) and Share Incentive Plan, known as Buy As You Earn (BAYE) on the same terms as other eligible employees.
SAYEThe maximum participation level in the SAYE plan is £500 per calendar month as per HMRC limits with participants granted linked share options, by reference to projected savings, with a 20% discount to the prevailing share price at the time of grant. In line with HMRC requirements, on the maturity of the savings contracts, participants can elect to use the accumulated savings to exercise their options or request the return of their savings.
BAYEThe maximum participation level in the BAYE is £150 per month, as per HMRC limits.
The Company provides two Matching Shares for every three Partnership Shares, subject to a maximum Company contribution of shares to the value of £30 a month. The shares are held in trust and become available for release with no tax or NI liability once held for five years. The Matching Shares will be forfeited if the corresponding Partnership Shares are removed from the trust within three years from award.
In accordance with the applicable legislation, shares that remain subject to the plan are held on behalf of participants in a UK-based trust.
FirstGroup Annual Report and Accounts 2018 89
Governance
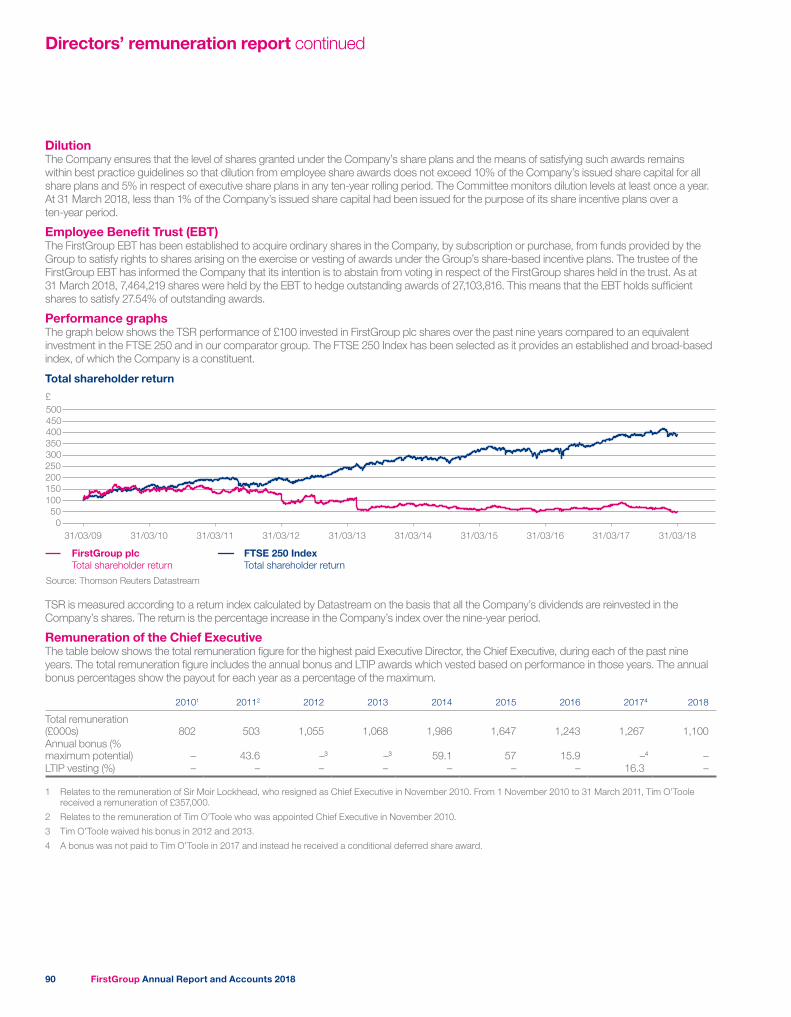
Directors’ remuneration report continued
DilutionThe Company ensures that the level of shares granted under the Company’s share plans and the means of satisfying such awards remains within best practice guidelines so that dilution from employee share awards does not exceed 10% of the Company’s issued share capital for all share plans and 5% in respect of executive share plans in any ten-year rolling period. The Committee monitors dilution levels at least once a year. At 31 March 2018, less than 1% of the Company’s issued share capital had been issued for the purpose of its share incentive plans over a ten-year period.
Employee Benefit Trust (EBT)The FirstGroup EBT has been established to acquire ordinary shares in the Company, by subscription or purchase, from funds provided by the Group to satisfy rights to shares arising on the exercise or vesting of awards under the Group’s share-based incentive plans. The trustee of the FirstGroup EBT has informed the Company that its intention is to abstain from voting in respect of the FirstGroup shares held in the trust. As at 31 March 2018, 7,464,219 shares were held by the EBT to hedge outstanding awards of 27,103,816. This means that the EBT holds sufficient shares to satisfy 27.54% of outstanding awards.
Performance graphsThe graph below shows the TSR performance of £100 invested in FirstGroup plc shares over the past nine years compared to an equivalent investment in the FTSE 250 and in our comparator group. The FTSE 250 Index has been selected as it provides an established and broad-based index, of which the Company is a constituent.
Total shareholder return
FirstGroup plc Total shareholder return
Source: Thomson Reuters Datastream
£
050
100150200250300350400450500
FTSE 250 Index Total shareholder return
31/03/11 31/03/12 31/03/13 31/03/14 31/03/15 31/03/16 31/03/17 31/03/1831/03/09 31/03/10
TSR is measured according to a return index calculated by Datastream on the basis that all the Company’s dividends are reinvested in the Company’s shares. The return is the percentage increase in the Company’s index over the nine-year period.
Remuneration of the Chief ExecutiveThe table below shows the total remuneration figure for the highest paid Executive Director, the Chief Executive, during each of the past nine years. The total remuneration figure includes the annual bonus and LTIP awards which vested based on performance in those years. The annual bonus percentages show the payout for each year as a percentage of the maximum.
20101 20112 2012 2013 2014 2015 2016 20174 2018
Total remuneration (£000s) 802 503 1,055 1,068 1,986 1,647 1,243 1,267 1,100Annual bonus (% maximum potential) – 43.6 –3 –3 59.1 57 15.9 –4 –LTIP vesting (%) – – – – – – – 16.3 –
1 Relates to the remuneration of Sir Moir Lockhead, who resigned as Chief Executive in November 2010. From 1 November 2010 to 31 March 2011, Tim O’Toole received a remuneration of £357,000.
2 Relates to the remuneration of Tim O’Toole who was appointed Chief Executive in November 2010.
3 Tim O’Toole waived his bonus in 2012 and 2013.
4 A bonus was not paid to Tim O’Toole in 2017 and instead he received a conditional deferred share award.
FirstGroup Annual Report and Accounts 201890
Percentage change in remuneration levelsThe table below shows the movement in the salary, benefits and annual bonus for the Chief Executive between the current and previous financial year compared to that for the average UK employee (First Bus and First Rail, but excluding Group). The Committee has chosen this comparator as it feels that it provides a more appropriate reflection of the earnings of the average worker than the movement in the Group’s total wage bill, which is distorted by movements in the number of employees and variations in wage practices in the US. However, the Committee will re-assess the comparator in 2018/19 to ensure it remains appropriate. For the benefits and bonus per employee, the figures are based on those employees eligible to participate in such schemes.
Base salary Benefits Annual bonus
Chief Executive 0% (2.3)%1 0%2
UK employees 2.89%3 6.86% (4.95)%4
1 The decrease in benefits is due to the impact of the change in exchange rates on the Chief Executive’s US medical insurance costs.
2 The Chief Executive did not receive a bonus for 2017/18.
3 Pay increases for the majority of UK employees in First Bus and First Rail are collectively bargained with trade unions in individual operating companies in First Bus and First Rail. Some of these agreements are multi-year deals. Typical increases for 2017/18 were in the range 1-3%.
4 This reflects the lower level of discretionary bonuses paid in some of our UK businesses in 2017/18 to the average UK employee compared to the previous year.
Relative importance of spend on payThe table below illustrates the Company’s expenditure on pay in comparison to adjusted operating profit and distributions to shareholders by way of dividend payments.
2018 £m 2017 £m % change
Adjusted operating profit1 317 339 (6.5)Distributions to shareholders – – –Total employee pay2 3,162 2,945 7.4
1 Group adjusted operating profit has been used as a comparison as it is a key financial metric which the Board considers when assessing Company performance.
2 Total employee pay is the total pay for all Group employees, including pension and social security costs. The average monthly number of employees in 2017/18 was 100,046 (2016/17: 100,891).
Wider pay and benefits environmentIn addition to competitive pay, FirstGroup offers a wide range of employee benefits to all employees regardless of role. We are committed to helping our colleagues save for retirement through a variety of company pension arrangements and retirement plans, and a further key element of our employee engagement strategy is the opportunity to share in the growth and success of the business through our UK employee share plans.
Other benefits in the UK include discounted travel on our rail and bus services, and discounts on shopping, entertainment and eating out. We also operate childcare voucher schemes across our UK businesses and our Employee Assistance programme offers all employees access to free, 24/7 confidential telephone, online and face to face advice for problems they may be experiencing at home or work.
Greyhound Canada and some of our larger UK businesses have their own dedicated in-house Occupational Health teams; our other businesses use external specialist advisers to support employees with health problems which may be affecting their performance at work.
In the US we offer a broad spectrum of health and welfare benefits to our employees and their families, including life insurance, health, dental and vision benefits for employees and their dependents. We encourage early preparation for retirement through an attractive 401(k) retirement savings plan, and we also provide disability plans for short and long term illness. Employee and family wellbeing is a focus through our ‘Route to Rewards’ wellness program, and throughout the year we encourage participation in wellness activities. In Canada, we provide a range of company pension arrangements and retirement plans to support employees in saving for retirement. Our employee benefits include life insurance, health and dental benefits, and disability coverage for employees and their dependents.
All our divisions run workplace health and wellbeing programmes to support employees to stay fit and healthy.
More information can be found in the ‘Our People’ section on page 27.
Non-Executive Directors’ (NED) and Chairman’s fees (audited)The Chairman’s fee was reviewed and increased from £280,000 to £295,000 with effect from 1 December 2017. This fee had not been increased since Wolfhart Hauser’s appointment as Chairman in 2015. The increase was implemented to reflect the demands of the role and the time commitment required of the Chairman.
With Wolfhart Hauser now stepping up to the position of Executive Chairman, the Committee will be considering a temporary increase to his fees to reflect the additional time commitment and this will be disclosed in the normal manner in due course.
FirstGroup Annual Report and Accounts 2018 91
Governance
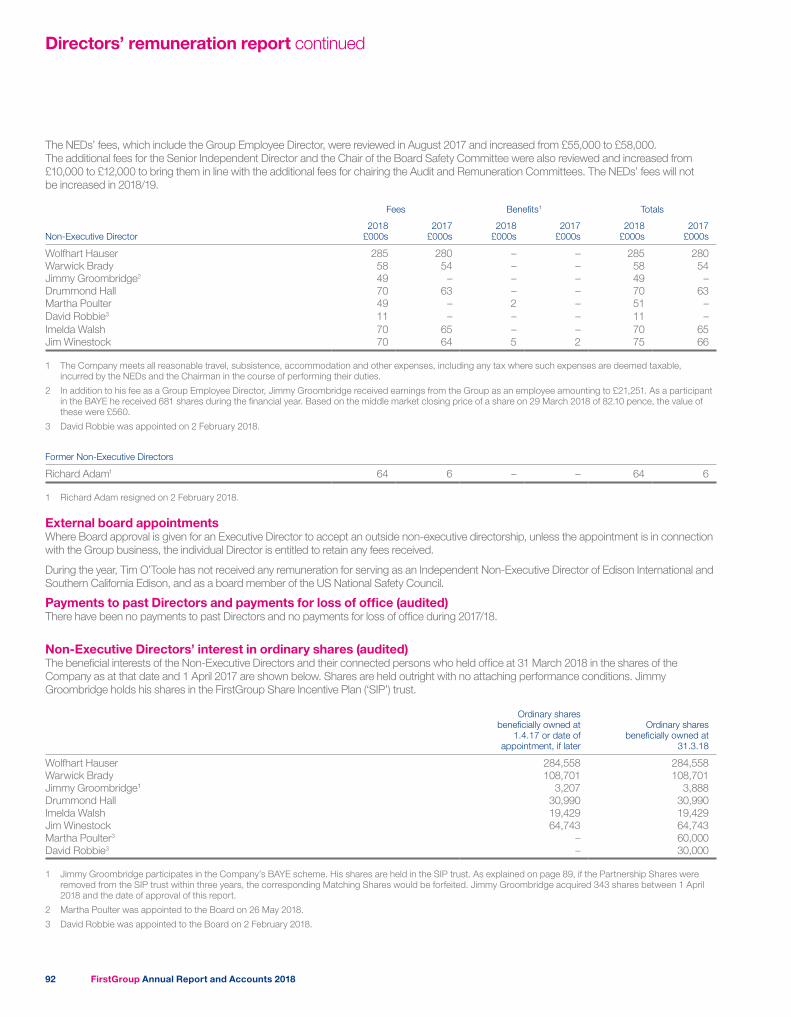
Directors’ remuneration report continued
The NEDs’ fees, which include the Group Employee Director, were reviewed in August 2017 and increased from £55,000 to £58,000. The additional fees for the Senior Independent Director and the Chair of the Board Safety Committee were also reviewed and increased from £10,000 to £12,000 to bring them in line with the additional fees for chairing the Audit and Remuneration Committees. The NEDs’ fees will not be increased in 2018/19.
Fees Benefits1 Totals
Non-Executive Director2018
£000s2017
£000s2018
£000s2017
£000s2018
£000s2017
£000s
Wolfhart Hauser 285 280 – – 285 280Warwick Brady 58 54 – – 58 54Jimmy Groombridge2 49 – – – 49 –Drummond Hall 70 63 – – 70 63Martha Poulter 49 – 2 – 51 –David Robbie3 11 – – – 11 –Imelda Walsh 70 65 – – 70 65Jim Winestock 70 64 5 2 75 66
1 The Company meets all reasonable travel, subsistence, accommodation and other expenses, including any tax where such expenses are deemed taxable, incurred by the NEDs and the Chairman in the course of performing their duties.
2 In addition to his fee as a Group Employee Director, Jimmy Groombridge received earnings from the Group as an employee amounting to £21,251. As a participant in the BAYE he received 681 shares during the financial year. Based on the middle market closing price of a share on 29 March 2018 of 82.10 pence, the value of these were £560.
3 David Robbie was appointed on 2 February 2018.
Former Non-Executive Directors
Richard Adam1 64 6 – – 64 6
1 Richard Adam resigned on 2 February 2018.
External board appointmentsWhere Board approval is given for an Executive Director to accept an outside non-executive directorship, unless the appointment is in connection with the Group business, the individual Director is entitled to retain any fees received.
During the year, Tim O’Toole has not received any remuneration for serving as an Independent Non-Executive Director of Edison International and Southern California Edison, and as a board member of the US National Safety Council.
Payments to past Directors and payments for loss of office (audited)There have been no payments to past Directors and no payments for loss of office during 2017/18.
Non-Executive Directors’ interest in ordinary shares (audited)The beneficial interests of the Non-Executive Directors and their connected persons who held office at 31 March 2018 in the shares of the Company as at that date and 1 April 2017 are shown below. Shares are held outright with no attaching performance conditions. Jimmy Groombridge holds his shares in the FirstGroup Share Incentive Plan (‘SIP’) trust.
Ordinary shares beneficially owned at
1.4.17 or date of appointment, if later
Ordinary shares beneficially owned at
31.3.18
Wolfhart Hauser 284,558 284,558Warwick Brady 108,701 108,701Jimmy Groombridge1 3,207 3,888Drummond Hall 30,990 30,990Imelda Walsh 19,429 19,429Jim Winestock 64,743 64,743Martha Poulter3 – 60,000David Robbie3 – 30,000
1 Jimmy Groombridge participates in the Company’s BAYE scheme. His shares are held in the SIP trust. As explained on page 89, if the Partnership Shares were removed from the SIP trust within three years, the corresponding Matching Shares would be forfeited. Jimmy Groombridge acquired 343 shares between 1 April 2018 and the date of approval of this report.
2 Martha Poulter was appointed to the Board on 26 May 2018.
3 David Robbie was appointed to the Board on 2 February 2018.
FirstGroup Annual Report and Accounts 201892
Non-Executive Directors’ dates of appointmentNon-Executive Directors have an agreement for service for an initial three-year term, which can be terminated by either party giving three months’ notice. In line with the Code, all Non-Executive Directors, including the Chairman, are subject to annual re-election by shareholders at each AGM. The table below sets out the appointment dates for those Non-Executive Directors who served during the year ending 31 March 2018. They will all, except for Richard Adam who stepped down on 2 February 2018, put themselves forward for election or re-election at the AGM, on 17 July 2018.
Non-Executive Director Date of appointment
Wolfhart Hauser 19 May 2015Richard Adam 24 February 2017 Warwick Brady 24 June 2014Jimmy Groombridge 26 May 2017Drummond Hall 24 June 2014Martha Poulter 26 May 2017David Robbie 2 February 2018Imelda Walsh 24 June 2014 Jim Winestock 1 August 2012
Role of the Remuneration CommitteeThe Committee is primarily responsible for determining and recommending to the Board the framework for executive remuneration and for determining, on behalf of the Board, the remuneration of Executive Directors and senior managers.
The Committee’s full terms of reference are available on the Company’s website. The Committee’s principal responsibilities are summarised below:
■■ determining and agreeing with the Board the framework for executive remuneration that ensures Executive Directors and senior managers are provided with appropriate incentives to encourage enhanced performance and are rewarded in a fair and responsible manner for their individual contribution towards the success of the Company
■■ ensuring that the remuneration policy is appropriate and consistent with effective risk management■■ within the agreed framework, setting and determining the total individual remuneration arrangements for Executive Directors and senior managers, giving due regard to individual and Company performance, and remuneration trends across the Group
■■ approving the design of, and determining the targets for, any performance-related plans and the total annual payments made under such plans to Executive Directors and senior managers
■■ determining the terms of employment and remuneration of each Executive Director and senior executives, including recruitment and termination arrangements
MembershipThe current members of the Committee, who are all independent Non-Executive Directors, are: Imelda Walsh, Chair; Drummond Hall, the Senior Independent Director, and David Robbie, who joined the Committee in March 2018.
Other attendees at the Committee meetings include the Chairman, the Chief Executive, the CFO, the Group Employee Director, the Group Corporate Services Director, the Group HR Director, the Group Head of Reward and PwC, the Committee’s external adviser. The General Counsel & Company Secretary is the secretary to the Committee. Attendees are not involved in any decisions, and are not present for any discussions, regarding their own remuneration.
After each meeting, the Chair of the Committee presents a report on its activities to the Board.
FirstGroup Annual Report and Accounts 2018 93
Governance
Directors’ remuneration report continued
Committee activitiesIn line with its remit, amongst other matters, the Committee took the following actions during the year:
■■ assessed the level of achievement against objectives under the EABP and LTIP
■■ reviewed the metrics, definitions, weightings and targets of the EABP and LTIP
■■ confirmed that the LTIP awards granted in 2014 would vest at 16.3% based on EPS performance
■■ approved individual remuneration arrangements for Executive Directors and senior managers
■■ approved the granting of awards under the EABP, LTIP and Executive Share Plan
■■ reviewed and approved the Directors’ Remuneration Report and changes to the Remuneration Policy
■■ discussed current trends in remuneration practice and corporate governance, including shareholders’ representatives’ guidelines and policies
■■ reviewed its terms of reference
■■ reviewed the performance of its advisers and that of the Committee
External adviserThe Committee has authority to obtain the advice of external independent remuneration consultants. It is solely responsible for their appointment, retention and termination and for approval of the basis of their fees and other terms. Over the course of the year, the Committee was supported by PwC, who were appointed by the Committee in 2014. The Chair of the Committee agrees the protocols under which PwC provides advice.
PwC is a member of the Remuneration Consultants’ Group and, as such, voluntarily operates under the code of conduct in relation to executive remuneration consulting in the UK.
During the year, PwC provided independent advice and commentary on a range of topics including Directors’ remuneration reporting, discretionary share plans, corporate governance and executive remuneration trends and shareholders consultation. PwC fees for advice provided to the Committee were £67,950 (2017: £32,200), charged on a time-and-materials basis.
PwC also provided general consultancy services to FirstGroup during the year; however, the Committee is satisfied that this does not compromise the independence and objectivity of the advice it has received from PwC, which has no other connection with the Company.
Shareholder votes on remuneration matters2017 AGM Annual Report
on Remuneration2016 AGM Annual Report
on Remuneration2015 AGM
Remuneration Policy2015 AGM Annual Report
on Remuneration
Votes for 902,019,470 (91.32%) 799,235,216 (96.53%) 779,923,966 (93%) 800,928,123 (95%)Votes against 85,771,076 (8.68%) 28,761,378 (3.47%) 60,313,189 (7%) 39,629,864 (5%)Total votes cast 987,790,546 827,996,594 840,237,155 840,557,987Votes withheld* 222,240 118,668,660 31,366,783 31,045,951
* Note: A ‘Vote withheld’ is not a vote in law and is not counted in the calculation of the votes ‘For’ and ‘Against’ a resolution.
Imelda WalshChair, Remuneration Committee 31 May 2018
FirstGroup Annual Report and Accounts 201894
Directors’ report and additional disclosures
The Directors present their report on the affairs of the Group, together with the audited financial statements and the report of the auditor for the year ended 31 March 2018. Information required to be disclosed in the Directors’ report may be found below and in the following sections of the Annual Report and Accounts, in accordance with the Companies Act 2006 (the “2006 Act”) and Listing Rule 9.8.4R of the Financial Conduct Authority (the “FCA”):
Information Section Page
Sustainability governance and greenhouse gas emissions
Corporate responsibility 23
Likely future developments in the business
Chief Executive’s report 7
Risk factors and principal risks; going concern and viability statements
Principal risks and uncertainties 34 and 44
Governance arrangements; human rights and anti-corruption and bribery matters
Corporate Governance report 50
Long term incentive schemes
Directors’ remuneration report 85
Financial instruments and related market transactions
Financial statements 130
DirectorsThe Directors of the Company who served during the year and their biographical details are shown on pages 46 and 47. Richard Adam and Tim O’Toole stood down from the Board on 2 February and 31 May 2018 separately. Details of Directors’ interests in shares can be found in the Directors’ remuneration report on pages 89 and 92.
During the year, no Director had any interest in any shares or debentures in the Company’s subsidiaries, or any material interest in any contract with the Company or a subsidiary being a contract of significance in relation to the Company’s business.
Powers of the DirectorsThe Directors are responsible for the management of the business of the Company and may exercise all powers of the Company subject to applicable legislation and regulation and the Company’s Articles.
Directors’ indemnities and liability insuranceFirstGroup maintains liability insurance for its Directors and Officers. The Company has also granted indemnities to each of the Directors as well as the General Counsel & Company Secretary, the Group Director of Finance, the Group Financial Controller, the Group Treasury & Tax Director, the Chief Information Officer, the Greyhound President and an Officer of FGI Canada to the extent permitted by law. These indemnities are uncapped in amount, in relation to certain losses and liabilities which they may incur to third parties in the course of acting as a Director (or Officer or Company Secretary as the case may be) of the Company or any of its associated companies. In the case of Group Director of Finance, the Group Financial Controller, the Group Treasury & Tax Director, the Chief Information Officer, the Greyhound President and an Officer of FGI Canada the indemnities are limited to their actions as Directors of specific associated companies. Neither the indemnity nor insurance cover provides cover in the event that a Director (or Officer or Company Secretary as the case may be) is proved to have acted fraudulently or dishonestly. The indemnity is categorised as a ‘qualifying third-party indemnity’ for the purposes of the 2006 Act and will continue in force for the benefit of Directors (or Officers or Company Secretary as the case may be) on an ongoing basis.
Share capitalAs at 31 March 2018, the Company’s issued share capital was 1,210,832,034 ordinary shares of 5 pence, each credited as fully paid. The Company holds 157,229 ordinary shares in treasury, and the issued share capital of the Company which carries voting rights of one vote per share comprises 1,210,674,805 ordinary shares. Further details of the Company’s issued share capital are shown in note 27 to the Company’s financial statements.
The Company’s shares are listed on the London Stock Exchange.
Substantial shareholdingsAs at 31 March 2018, the Company had been notified under the FCA’s Disclosure, Guidance and Transparency Rule (“DGTR”) 5 of the following interests in its total voting rights of 3% or more:
Name of holder
Number of ordinary
shares
% of total voting rights
Vidacos Nominees Ltd – HSBC Custody Nominees (Australia) Ltd 71,695,290 5.95
Schroders plc 64,283,712 5.33
Jupiter Asset Management Limited 60,603,024 5.03
Vidacos Nominees Ltd 59,397,756 4.93
There have been no further notifications between 31 March 2018 and the date of this report.
Articles of AssociationThe description in this section summarises certain provisions of the Company’s Articles and applicable Scottish law concerning companies. This summary is qualified in its entirety by reference to this Company’s Articles and the 2006 Act. The Company’s Articles may be amended by a special resolution of the Company’s shareholders.
FirstGroup Annual Report and Accounts 2018 95
Governance
Directors’ report and additional disclosures continued
SharesThe rights attached to the ordinary shares of the Company are defined in the Company’s Articles. No person has any special rights of control over the Company’s share capital and all issued shares are fully paid.
Voting rightsShareholders are entitled to attend and vote at any general meeting of the Company. It is the Company’s practice to hold a poll on every resolution at general meetings. Every member present in person or by proxy has, upon a poll, one vote for every share held. In the case of joint holders of a share the vote of the senior who tenders a vote, whether in person or by proxy, shall be accepted to the exclusion of the votes of the other joint holders and, for this purpose, seniority shall be determined by the order in which the names stand in the Register of Members in respect of the joint holding. The Notice of the 2018 AGM accompanying this document specifies the deadlines for exercising voting rights.
Dividend rightsShareholders may by ordinary resolution declare dividends but the amount of the dividend may not exceed the amount recommended by the Board. The Directors are not recommending the payment of a final dividend this year.
Transfer of sharesThere are no specific restrictions on the size of a holding nor on the transfer of shares which are both governed by the general provisions of the Company’s Articles and prevailing legislation. The Directors are not aware of any agreements between holders of the Company’s shares that may result in restrictions on the transfer of securities or on voting rights at any meeting of the Company.
Employee share plansThe Company operates a number of employee share plans, details of which are set out in note 35 to the consolidated financial statements. Kleinwort Benson (Guernsey) Trustees Limited, as trustee of the FirstGroup plc Employee Benefit Trust (EBT), holds shares in the Company in trust in order to satisfy awards made to participants under the Company’s employee share plans. The EBT waives its rights to vote and to dividends on the shares it holds which are unallocated.
Under the rules of the FirstGroup plc Share Incentive Plan, also known as BAYE, employees buy Partnership Shares and receive Matching Shares in the Company. In order to preserve certain tax benefits these shares are held in a trust by Computershare for employees. Whilst these shares are held in trust, the voting rights attached to them are exercised by the trustee, but only at the direction of the employees.
All of the Company’s employee share plans contain provisions relating to change of control. On a change of control, options and awards granted to employees may vest and become exercisable, subject to the satisfaction of any applicable performance conditions at the time.
Further details on the Company’s employee share plans can be found in the Directors’ remuneration report on page 68.
Purchase of own sharesAt the AGM of the Company in 2017 authority was granted for the Company to purchase up to 10% of its ordinary shares. During the year no ordinary shares were purchased. Under the existing authority the Company may purchase up to 120,791,435 ordinary shares. This authority remains in place until the 2018 AGM, when the company intends in to seek a renewal.
Political donations
At the 2017 AGM, shareholders passed a resolution to authorise the Company and its subsidiaries to make political donations to political parties or independent election candidates, to other political organisations, or to incur political expenditure (as such terms are defined in sections 362 to 379 of the 2006 Act), in each case in amounts not exceeding £100,000 in aggregate. As the authority granted at the 2017 AGM will expire, renewal of this authority will be sought at this year’s AGM. Further details are available in the Notice of AGM. As a result of the broad definition used in the 2006 Act of matters constituting political donations, it is possible that normal business activities, which might not be thought to be political expenditure in the usual sense, could be caught. Accordingly, authority is being sought as a precaution to ensure that the Company’s normal business activities do not infringe the 2006 Act, but it is not the policy of the Company to make donations to EU political organisations or to incur other political expenditure in the EU.
In the US it is far more common for businesses to participate in the political process through a variety of methods. During the year the Group’s US businesses incurred political expenditure in the US of $18,948 (2016/17: $67,748) in the support of their business goals. The Group has fully complied with jurisdictional reporting of these contributions.
No other political donations or expenditure was incurred by the Company and its subsidiaries during 2017/18.
Change of control – significant agreementsFinancing agreementsThe Group has a £800m multi-currency revolving credit and guarantee facility between, amongst others, the Company and The Royal Bank of Scotland plc dated 22 March 2017. This refinanced the Group’s existing revolving credit and guarantee facility. Following any change of control of the Company, individual lenders may negotiate with the Company with a view to resolving any concerns arising from such change of control. If the matter has not been resolved within 30 days, an individual bank may cancel its commitment and the Company must repay the relevant proportion of any drawdown.
The US$100m 4.17% notes due 2025, US$175m 4.29% notes due 2028, the £250m 6.125% bonds due 2019, the £350m 8.750% bonds due 2021, the £200m 6.875% bonds due 2024 and the £325m 5.250% bonds due 2022 issued by the Company may also be affected by a change of control of the Company. In respect of the £350m 8.750% bonds due 2021, the £200m 6.875% bonds due 2024 and the £325m 5.250% bonds due 2022, upon a change of control of the Company, provided that certain further thresholds in relation to the credit rating of the bonds are met, the bondholders have the option to require the Company to redeem the bonds. In respect of the US$100m 4.17% notes due 2025, US$175m 4.29% notes due 2028, upon a change of control, the Company must make an offer to noteholders to prepay the entire unpaid principal amount of the notes held by each bondholder (at par) together with interest accrued thereon.
FirstGroup Annual Report and Accounts 201896
First RailThe Group’s franchised passenger rail operators, First TransPennine Express Limited, First Greater Western Limited First MTR South Western Trains Limited (jointly owned with MTR Corporation) are each party to a franchise agreement with the Secretary of State for Transport. These franchise agreements are subject to termination clauses which may apply on a change of control. First MTR South Western Trains Limited, First TransPennine Express Limited and First Greater Western Limited and the Group’s non-franchised rail operator, Hull Trains Company Limited, each hold railway licences as required by the Railways Act 1993 (as amended); these licences may be revoked on three months’ notice if a change of control occurs without the approval of the Office of Rail and Road. All of these operators also require and hold track access agreements with Network Rail Infrastructure Limited under which they are permitted to access railway infrastructure. Failure by any of the operators to maintain its railway licence is a potential termination event under the terms of the track access agreements. The Group’s railway operators also lease rolling stock from specialist rolling stock leasing companies such as Eversholt Rail Group, Porterbrook Leasing Company Limited and Angel Trains Limited. A material number of the individual leasing agreements include change of control provisions. The Group is also involved from time to time in bidding processes for UK rail franchises and transport contracts further afield which customarily include change in circumstance provisions which would be triggered on a change of control and could result in termination or rejection from further participation in the relevant competitions.
Significant shareholders’ agreements The Group, through First Rail Holdings Limited, has shareholders’ agreements governing its relationship with MTR Corporation in relation to the South Western rail franchise and with Trenitalia for the purposes of bidding for (and, if successful, operating) the West Coast Partnership and East Midlands franchises. As is customary, these agreements include provisions addressing change of control.
Post-balance sheet eventsThere have been no material post-balance sheet events as at the date of this report.
Employee involvement and policies concerning disabled employeesThroughout the Group, regular dialogue is maintained with employee representatives, including trade unions. Each division has its own information and consultation arrangements, with employees being represented by more than 30 different unions.
Across the group, full and fair consideration is given to applications for employment by people with disabilities. We are committed to supporting disabled employees, including employees who become disabled during their employment, with regards to training, career development and promotion.
Management reportThe Strategic and Directors’ reports together are the management report for the purposes of the FCA’s DGTR 4.1.5R.
The Strategic report was approved on behalf of the Board on 31 May 2018.
Michael HampsonGeneral Counsel & Company Secretary31 May 2018395 King Street, Aberdeen AB24 5RP
FirstGroup Annual Report and Accounts 2018 97
Governance

Directors’ responsibility statement
Statement of Directors’ responsibilities in respect of the Annual Report and the financial statementsThe Directors are responsible for preparing the Annual Report and the Group and parent company financial statements in accordance with applicable law and regulations. Company law requires the Directors to prepare financial statements for each financial year. Under that law, the Directors are required to prepare the Group financial statements in accordance with International Financial Reporting Standards (IFRSs) as adopted by the European Union and Article 4 of the IAS Regulation and have chosen to prepare the parent company financial statements in accordance with applicable UK Accounting Standards, including Financial Reporting Standard 101 ‘Reduced Disclosure Framework’ (FRS 101) and applicable law.
Under company law, the Directors must not approve the financial statements unless they are satisfied that they give a true and fair view of the state of affairs of the Company and of the profit or loss of the Company for that period. In preparing the parent company financial statements, the Directors are required to:
■■ select suitable accounting policies and then apply them consistently;
■■ make judgements and accounting estimates that are reasonable and prudent;
■■ state whether applicable UK Accounting Standards, including FRS 101, have been followed, subject to any material departures disclosed and explained in the financial statements; and
■■ prepare the financial statements on the going concern basis unless it is inappropriate to presume that the Company will continue in business.
In preparing the Group financial statements, International Accounting Standard 1 requires that Directors:
■■ properly select and apply accounting policies;
■■ present information including accounting policies, in a manner that provides relevant, reliable, comparable and understandable information; provide additional disclosures when compliance with the specific requirements in IFRSs are insufficient to enable users to understand the impact of particular transactions, other events and conditions on the entity’s financial position and financial performance; and
■■ make an assessment of the Company’s ability to continue as a going concern.
The Directors are responsible for keeping adequate accounting records that are sufficient to show and explain the Company’s transactions and disclose with reasonable accuracy, at any time, the financial position of the Company and enable them to ensure that the financial statements comply with the 2006 Act. They are also responsible for safeguarding the assets of the Company and hence for taking reasonable steps for the prevention and detection of fraud and other irregularities, and have adopted a control framework across the Group.
The Directors are responsible for the maintenance and integrity of the corporate and financial information included on the Company’s website. Legislation in the United Kingdom governing the preparation and dissemination of financial statements may differ from legislation in other jurisdictions.
Responsibility statementEach Director confirms to the best of their knowledge that:
■■ the financial statements, prepared in accordance with the relevant financial reporting framework, give a true and fair view of the assets, liabilities, financial position and profit or loss of the Company and the undertakings included in the consolidation taken as a whole;
■■ the Strategic report and Governance section include a fair review of the development and performance of the business and the position of the Company and the undertakings included in the consolidation taken as a whole, together with a description of the principal risks and uncertainties that they face; and
■■ the Annual Report and Accounts, taken as a whole, is fair, balanced and understandable and provides the information necessary for shareholders to assess the Company’s and the Group’s position and performance, business model and strategy.
The Strategic report comprising pages 4 to 44 and the Governance section comprising pages 46 to 97, and including the sections of the Annual Report and Accounts referred to in these pages, have been approved by the Board and signed on its behalf by:
Matthew GregoryChief Financial Officer31 May 2018395 King Street, Aberdeen AB24 5RP
FirstGroup Annual Report and Accounts 201898
Financial statements
This section contains the financial statements, the auditor’s report, the accounting policies and the notes to the accounts, together with a glossary of key terms, information for shareholders and the financial calendar.
Financial statementsConsolidated income statement 100
Consolidated statement of comprehensive income 101
Consolidated balance sheet 102
Consolidated statement of changes in equity 103
Consolidated cash flow statement 104
Notes to the consolidated financial statements 105
Independent auditor’s report 157
Group financial summary 167
Company balance sheet 168
Statement of changes in equity 169
Notes to the Company financial statements 170
Shareholder information 174
Financial calendar 175
Glossary 176
FirstGroup Annual Report and Accounts 2018 99
Financial statements
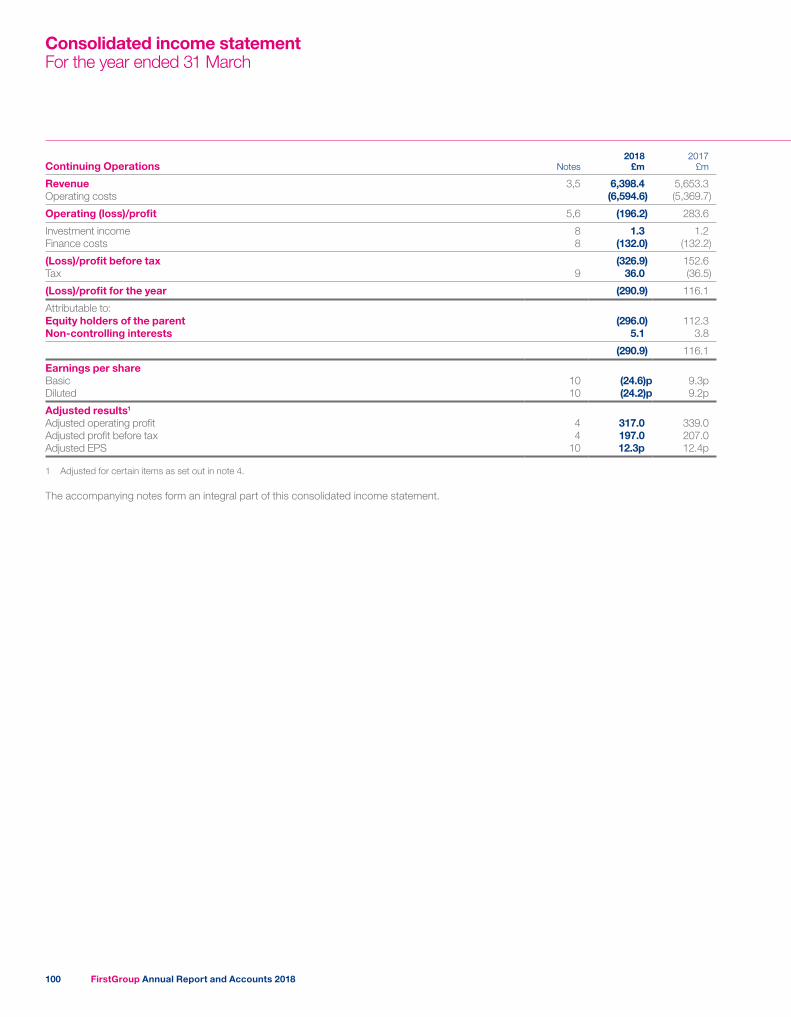
Continuing Operations Notes2018
£m2017
£m
Revenue 3,5 6,398.4 5,653.3Operating costs (6,594.6) (5,369.7)
Operating (loss)/profit 5,6 (196.2) 283.6
Investment income 8 1.3 1.2Finance costs 8 (132.0) (132.2)
(Loss)/profit before tax (326.9) 152.6Tax 9 36.0 (36.5)
(Loss)/profit for the year (290.9) 116.1
Attributable to:Equity holders of the parent (296.0) 112.3Non-controlling interests 5.1 3.8
(290.9) 116.1
Earnings per shareBasic 10 (24.6)p 9.3pDiluted 10 (24.2)p 9.2p
Adjusted results1
Adjusted operating profit 4 317.0 339.0Adjusted profit before tax 4 197.0 207.0Adjusted EPS 10 12.3p 12.4p
1 Adjusted for certain items as set out in note 4.
The accompanying notes form an integral part of this consolidated income statement.
Consolidated income statementFor the year ended 31 March
FirstGroup Annual Report and Accounts 2018100
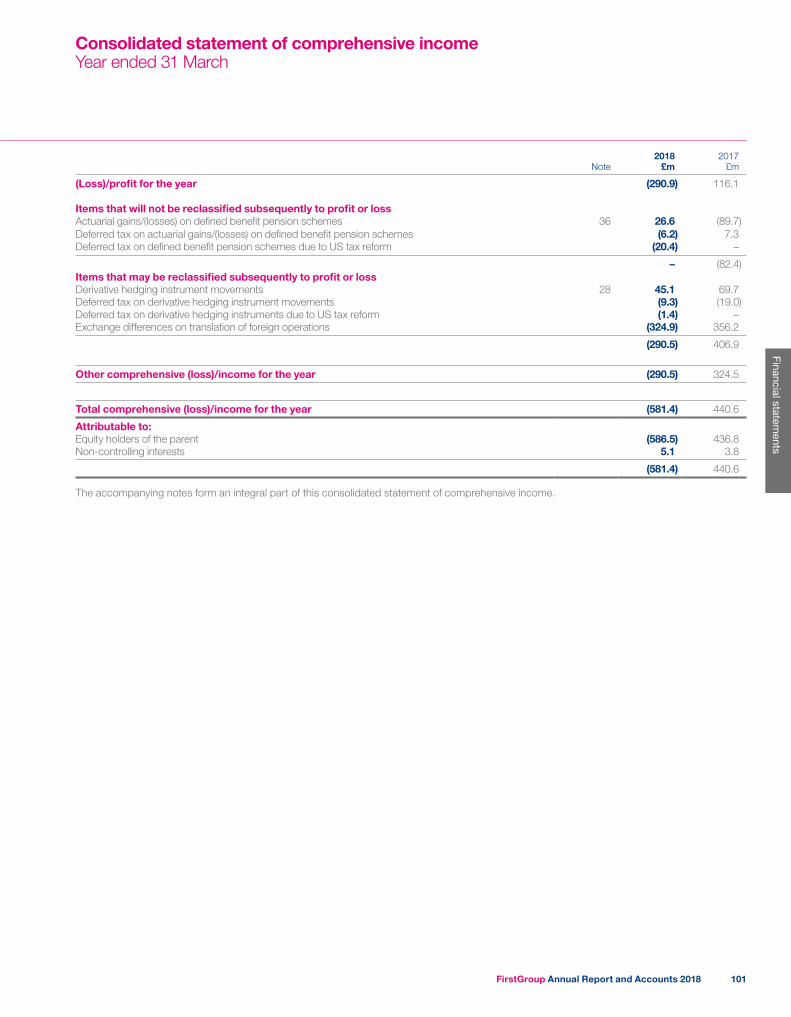
Note2018
£m2017
£m
(Loss)/profit for the year (290.9) 116.1
Items that will not be reclassified subsequently to profit or lossActuarial gains/(losses) on defined benefit pension schemes 36 26.6 (89.7)Deferred tax on actuarial gains/(losses) on defined benefit pension schemes (6.2) 7.3 Deferred tax on defined benefit pension schemes due to US tax reform (20.4) –
– (82.4)Items that may be reclassified subsequently to profit or lossDerivative hedging instrument movements 28 45.1 69.7Deferred tax on derivative hedging instrument movements (9.3) (19.0)Deferred tax on derivative hedging instruments due to US tax reform (1.4) –Exchange differences on translation of foreign operations (324.9) 356.2
(290.5) 406.9
Other comprehensive (loss)/income for the year (290.5) 324.5
Total comprehensive (loss)/income for the year (581.4) 440.6
Attributable to:Equity holders of the parent (586.5) 436.8Non-controlling interests 5.1 3.8
(581.4) 440.6
The accompanying notes form an integral part of this consolidated statement of comprehensive income.
Consolidated statement of comprehensive incomeYear ended 31 March
FirstGroup Annual Report and Accounts 2018 101
Financial statements
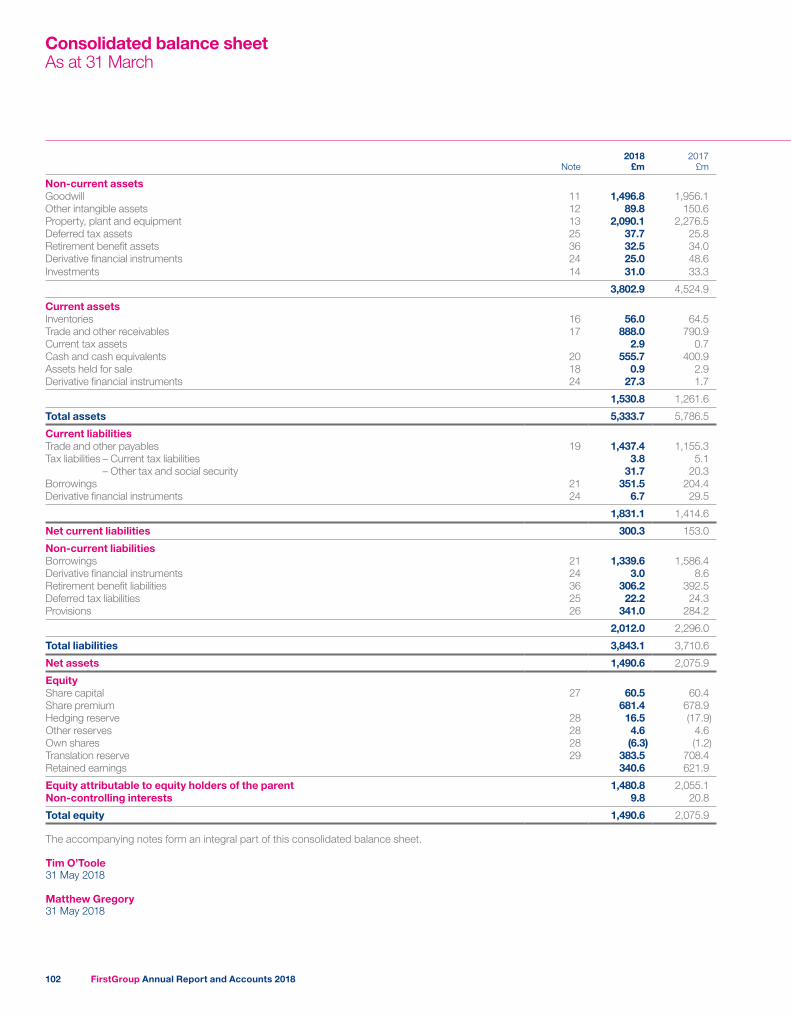
Note2018
£m2017
£m
Non-current assetsGoodwill 11 1,496.8 1,956.1Other intangible assets 12 89.8 150.6Property, plant and equipment 13 2,090.1 2,276.5Deferred tax assets 25 37.7 25.8Retirement benefit assets 36 32.5 34.0Derivative financial instruments 24 25.0 48.6Investments 14 31.0 33.3
3,802.9 4,524.9
Current assetsInventories 16 56.0 64.5Trade and other receivables 17 888.0 790.9Current tax assets 2.9 0.7Cash and cash equivalents 20 555.7 400.9Assets held for sale 18 0.9 2.9Derivative financial instruments 24 27.3 1.7
1,530.8 1,261.6
Total assets 5,333.7 5,786.5
Current liabilitiesTrade and other payables 19 1,437.4 1,155.3Tax liabilities – Current tax liabilities 3.8 5.1 – Other tax and social security 31.7 20.3Borrowings 21 351.5 204.4Derivative financial instruments 24 6.7 29.5
1,831.1 1,414.6
Net current liabilities 300.3 153.0
Non-current liabilitiesBorrowings 21 1,339.6 1,586.4Derivative financial instruments 24 3.0 8.6Retirement benefit liabilities 36 306.2 392.5Deferred tax liabilities 25 22.2 24.3Provisions 26 341.0 284.2
2,012.0 2,296.0
Total liabilities 3,843.1 3,710.6
Net assets 1,490.6 2,075.9
EquityShare capital 27 60.5 60.4Share premium 681.4 678.9Hedging reserve 28 16.5 (17.9)Other reserves 28 4.6 4.6Own shares 28 (6.3) (1.2)Translation reserve 29 383.5 708.4Retained earnings 340.6 621.9
Equity attributable to equity holders of the parent 1,480.8 2,055.1Non-controlling interests 9.8 20.8
Total equity 1,490.6 2,075.9
The accompanying notes form an integral part of this consolidated balance sheet.
Tim O’Toole31 May 2018
Matthew Gregory31 May 2018
Consolidated balance sheetAs at 31 March
FirstGroup Annual Report and Accounts 2018102
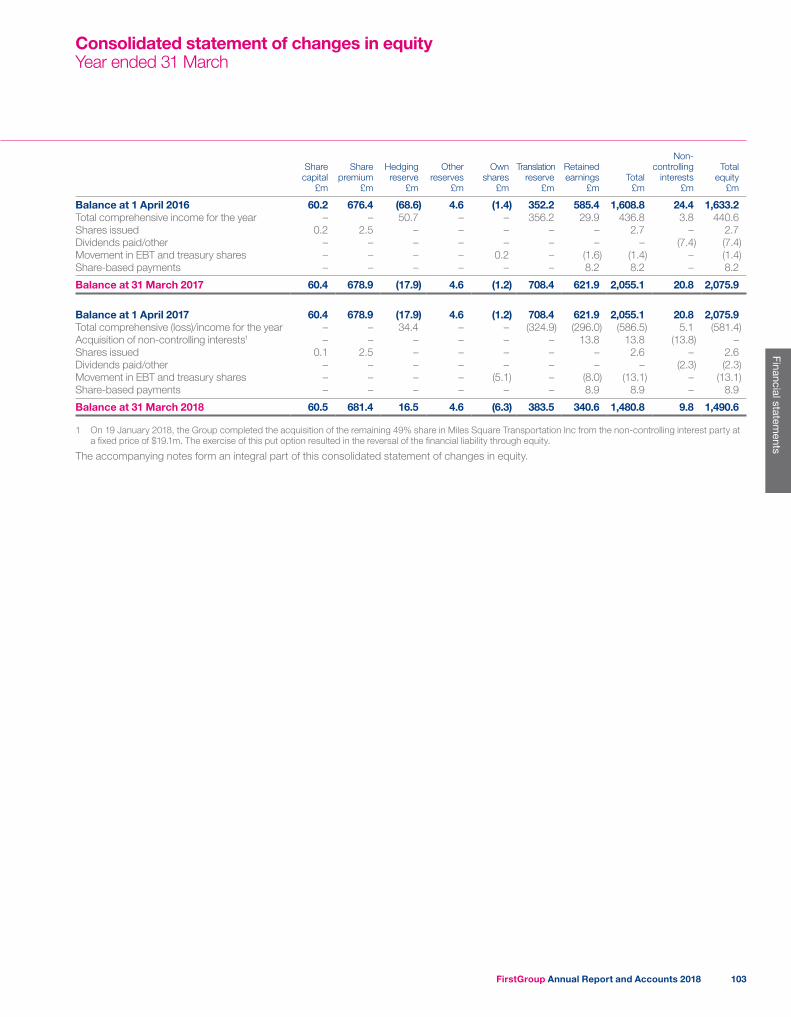
Share capital
£m
Share premium
£m
Hedging reserve
£m
Other reserves
£m
Own shares
£m
Translation reserve
£m
Retained earnings
£mTotal
£m
Non-controlling
interests £m
Total equity
£m
Balance at 1 April 2016 60.2 676.4 (68.6) 4.6 (1.4) 352.2 585.4 1,608.8 24.4 1,633.2Total comprehensive income for the year – – 50.7 – – 356.2 29.9 436.8 3.8 440.6Shares issued 0.2 2.5 – – – – – 2.7 – 2.7Dividends paid/other – – – – – – – – (7.4) (7.4)Movement in EBT and treasury shares – – – – 0.2 – (1.6) (1.4) – (1.4)Share-based payments – – – – – – 8.2 8.2 – 8.2
Balance at 31 March 2017 60.4 678.9 (17.9) 4.6 (1.2) 708.4 621.9 2,055.1 20.8 2,075.9
Balance at 1 April 2017 60.4 678.9 (17.9) 4.6 (1.2) 708.4 621.9 2,055.1 20.8 2,075.9Total comprehensive (loss)/income for the year – – 34.4 – – (324.9) (296.0) (586.5) 5.1 (581.4)Acquisition of non-controlling interests1 – – – – – – 13.8 13.8 (13.8) –Shares issued 0.1 2.5 – – – – – 2.6 – 2.6Dividends paid/other – – – – – – – – (2.3) (2.3)Movement in EBT and treasury shares – – – – (5.1) – (8.0) (13.1) – (13.1)Share-based payments – – – – – – 8.9 8.9 – 8.9
Balance at 31 March 2018 60.5 681.4 16.5 4.6 (6.3) 383.5 340.6 1,480.8 9.8 1,490.6
1 On 19 January 2018, the Group completed the acquisition of the remaining 49% share in Miles Square Transportation Inc from the non-controlling interest party at a fixed price of $19.1m. The exercise of this put option resulted in the reversal of the financial liability through equity.
The accompanying notes form an integral part of this consolidated statement of changes in equity.
Consolidated statement of changes in equityYear ended 31 March
FirstGroup Annual Report and Accounts 2018 103
Financial statements
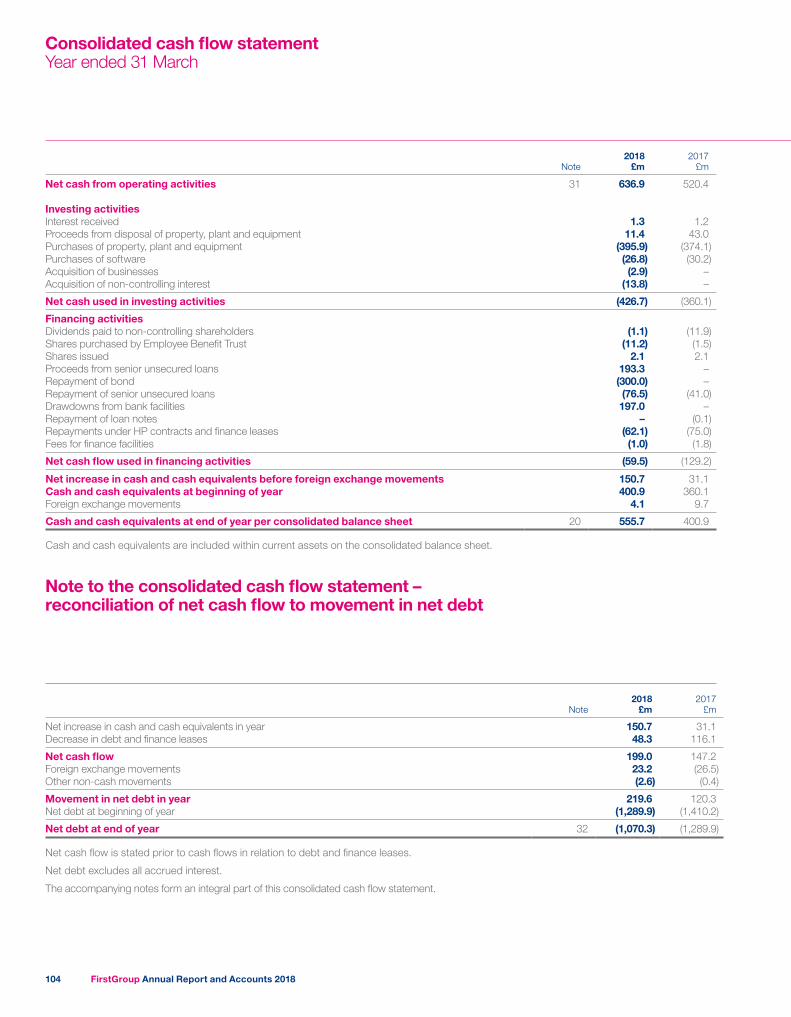
Note2018
£m2017
£m
Net cash from operating activities 31 636.9 520.4
Investing activitiesInterest received 1.3 1.2Proceeds from disposal of property, plant and equipment 11.4 43.0Purchases of property, plant and equipment (395.9) (374.1)Purchases of software (26.8) (30.2)Acquisition of businesses (2.9) –Acquisition of non-controlling interest (13.8) –
Net cash used in investing activities (426.7) (360.1)
Financing activitiesDividends paid to non-controlling shareholders (1.1) (11.9)Shares purchased by Employee Benefit Trust (11.2) (1.5)Shares issued 2.1 2.1Proceeds from senior unsecured loans 193.3 –Repayment of bond (300.0) –Repayment of senior unsecured loans (76.5) (41.0)Drawdowns from bank facilities 197.0 –Repayment of loan notes – (0.1)Repayments under HP contracts and finance leases (62.1) (75.0)Fees for finance facilities (1.0) (1.8)
Net cash flow used in financing activities (59.5) (129.2)
Net increase in cash and cash equivalents before foreign exchange movements 150.7 31.1Cash and cash equivalents at beginning of year 400.9 360.1Foreign exchange movements 4.1 9.7
Cash and cash equivalents at end of year per consolidated balance sheet 20 555.7 400.9
Cash and cash equivalents are included within current assets on the consolidated balance sheet.
Consolidated cash flow statementYear ended 31 March
Note to the consolidated cash flow statement – reconciliation of net cash flow to movement in net debt
Note2018
£m2017
£m
Net increase in cash and cash equivalents in year 150.7 31.1Decrease in debt and finance leases 48.3 116.1
Net cash flow 199.0 147.2Foreign exchange movements 23.2 (26.5)Other non-cash movements (2.6) (0.4)
Movement in net debt in year 219.6 120.3Net debt at beginning of year (1,289.9) (1,410.2)
Net debt at end of year 32 (1,070.3) (1,289.9)
Net cash flow is stated prior to cash flows in relation to debt and finance leases.
Net debt excludes all accrued interest.
The accompanying notes form an integral part of this consolidated cash flow statement.
FirstGroup Annual Report and Accounts 2018104
1 General informationFirstGroup plc is a company incorporated in the United Kingdom under the Companies Act 2006. The address of the registered office is 395 King Street, Aberdeen, AB24 5RP. The nature of the Group’s operations and its principal activities are set out in the Strategic report on pages 4 to 44.
These financial statements are presented in pounds Sterling. Foreign operations are included in accordance with the accounting policies set out in note 2.
2 Significant accounting policiesBasis of accountingThe financial statements have been prepared in accordance with IFRSs adopted and endorsed for use in the European Union and therefore comply with Article 4 of the EU IAS Regulation.
The financial statements have been prepared on the historical cost basis, except for the revaluation of certain financial instruments, and on a going concern basis, as described in the going concern statement within the directors’ report and additional disclosures on pages 95 to 98. The principal accounting policies adopted are set out below.
The financial statements for the year ended 31 March 2018, include the results and financial position of the First Rail business for the year ended 31 March 2018 and the results and financial position of all the other businesses for the 53 weeks ended 31 March 2018. The financial statements for the year ended 31 March 2017, include the results and financial position of the First Rail businesses for the year ended 31 March 2017 and the results and financial position of all the other businesses for the 52 weeks ended 25 March 2017.
Basis of consolidationThe consolidated financial statements incorporate the financial statements of the Company and entities controlled by the Company (its subsidiaries). Control is achieved where the Company has the power to govern the financial and operating policies of an investee entity so as to obtain benefits from its activities.
Non-controlling interests in subsidiaries are identified separately from the Group’s equity interest therein. Those interests of non-controlling shareholders that are present ownership interests entitling their holders to a proportionate share of net assets upon liquidation, may initially be measured at fair value, or at the non-controlling interests’ proportionate share of their fair value of the acquiree’s identifiable net assets. The choice of measurement is made on an acquisition by acquisition basis. Other non-controlling interests are initially measured at fair value. Subsequent to acquisition, the carrying amount of non-controlling interests is the amount of those interests at initial recognition plus the non-controlling interests’ share of subsequent changes in equity. Total comprehensive income is attributed to non-controlling interests even if this results in the non-controlling interests having a deficit balance.
The results of subsidiaries acquired or disposed of during the year are included in the consolidated income statement from the effective date of acquisition or up to the effective date of disposal, as appropriate.
Where necessary, adjustments are made to the financial statements of subsidiaries to bring the accounting policies used into line with those used by the Group.
All intra-group transactions, balances, income and expenses are eliminated on consolidation.
Business combinationsThe acquisition of subsidiaries is accounted for using the acquisitions method. The consideration for each acquisition is measured at the aggregate of the fair values, at the date of exchange, of assets given, liabilities incurred or assumed, and equity instruments issued by the Group in exchange for control of the acquiree. Acquisition-related costs are recognised in the income statement as incurred.
The acquiree’s identifiable assets, liabilities and contingent liabilities that meet the conditions for recognition under IFRS 3 Business Combinations are recognised at their fair value at the acquisition date, with the exception of deferred tax assets or liabilities and liabilities or assets related to employee benefit arrangements, liabilities or equity instruments related to the replacement by the Group of an acquiree’s share-based payment and non-current assets (or disposal groups) that are classified as held for sale in accordance with IFRS 5 Non-Current Assets Held for Sale and Discontinued Operations, which are recognised and measured at fair value less costs to sell.
The interest of non-controlling shareholders in the acquiree is initially measured at the non-controlling shareholder’s proportion of the net fair value of the assets, liabilities and contingent liabilities recognised.
Assets held for saleAssets held for sale are measured at the lower of carrying amount and fair value less costs to sell.
Assets are classified as held for sale if their carrying amount will be recovered through a sale transaction rather than through continuing use. This condition is regarded as met only when the sale is highly probable and the asset is available for immediate sale in its present condition. Management must be committed to the sale which should be expected to qualify for recognition as a completed sale within one year of the date of classification.
Notes to the consolidated financial statements
FirstGroup Annual Report and Accounts 2018 105
Financial statements
2 Significant accounting policies continuedGoodwill and intangible assetsGoodwill arising on consolidation is recognised as an asset at the date that control is acquired. Goodwill is measured as the excess of the sum of the consideration transferred, the amount of any non-controlling interest in the acquiree and the fair value of the acquirer’s previously held equity interest (if any) in the entity over the net of the acquisition date amounts of the identifiable assets acquired and liabilities assumed.
For the purpose of impairment testing, goodwill is allocated to each of the Group’s cash-generating units (CGUs) which are tested for impairment annually, or more frequently where there is an indication that the CGU may be impaired. If the recoverable amount of the CGU is less than the carrying amount of the CGU, the impairment loss is allocated to the goodwill of the CGU and then to the other assets of the CGU pro rata on the basis of the carrying amount of each asset in the CGU. An impairment loss recognised for goodwill is not reversed in a subsequent period. On disposal of a subsidiary, associate or jointly controlled entity, the attributable amount of goodwill is included in the determination of the profit or loss on disposal.
Goodwill arising on acquisitions before the date of transition to IFRS has been retained at the previous UK GAAP amounts subject to being tested for impairment at that date. Goodwill written off to reserves under UK GAAP prior to 1998 has not been reinstated and is not included in determining any subsequent profit or loss on disposal.
Computer software is recognised separately as an intangible asset and is carried at cost less accumulated amortisation and accumulated impairment losses. Costs include software licences, website development, costs attributable to the development, design and implementation of the computer software and internal costs directly attributable to the software.
The existing finite life intangible assets have a residual value of nil and are amortised on a straight-line basis over their useful economic lives as follows:
Customer contracts – over the estimated life of the contract (9 to 10 years) Greyhound brand and trade name – over the estimated life of the brand (20 years) Franchise agreements – over the initial term of the franchise (2 to 10 years) Software – over the estimated life of the software (3 to 5 years)
Revenue recognitionRevenue principally comprises revenue from train passenger services, road passenger transport, and certain management and maintenance services in the UK and North America. Where appropriate, amounts are shown net of rebates and sales taxes.
Revenue is recognised by reference to the stage of completion of the customers’ travel or services provided under contractual arrangements as the proportion of total services to be provided. Receipts for season tickets and travel cards are deferred within ‘Season ticket deferred income’ and recognised in the income statement over the period covered by the relevant ticket.
Revenue in First Rail includes franchise subsidy receipts from the Department for Transport (DfT) and amounts receivable under franchise arrangements including certain funded operational projects. Franchise premium payments to the DfT for amounts due under the terms of a franchise are included in operating costs. Revenue also includes amounts attributable to the Train Operating Companies (TOCs), predominantly based on models of route usage, by the Railway Settlement Plan in respect of passenger receipts.
First Bus revenue principally comprises amounts receivable from ticket sales and concessionary fare schemes. Concessionary amounts are recognised in the period in which the service is provided. Greyhound coach revenue mainly comprises of amounts receivable from ticket sales. Other Bus, including First Student and First Transit, and services revenue from contracts with government bodies and similar organisations is recognised as the services are provided.
Interest income is recognised on an accruals basis.
LeasingLeases are classified as finance leases whenever the terms of the lease transfer substantially all the risks and rewards of ownership to the lessee. All other leases are classified as operating leases and the rental charges are charged against income on a straight-line basis over the life of the lease.
Assets held under hire purchase contracts and finance leases are recognised as assets of the Group at their fair value or, if lower, at the present value of the minimum lease payments, each determined at the inception of the lease. The corresponding liability is included in the balance sheet as a finance lease obligation. Lease payments are apportioned between finance charges and reduction of the lease obligation so as to achieve a constant rate of interest on the remaining balance of the liability. Finance charges are charged directly against income, unless they are directly attributable to qualifying assets, in which case they are capitalised in accordance with the Group’s general policy on borrowing costs (see below).
Benefits received and receivable as an incentive to enter into an operating lease are spread on a straight-line basis over the lease term.
Notes to the consolidated financial statementscontinued
FirstGroup Annual Report and Accounts 2018106
2 Significant accounting policies continuedForeign currenciesThe individual financial statements of each Group company are presented in the currency of the primary economic environment in which it operates (its functional currency). For the purpose of the consolidated financial statements, the results and financial position of each Group company are expressed in pounds Sterling, which is the functional currency of the Company, and the presentation currency for the consolidated financial statements.
In preparing the financial statements of the individual companies, transactions in currencies other than the functional currency are recorded at the rates of exchange prevailing on the dates of the transactions. At each balance sheet date, monetary assets and liabilities that are denominated in foreign currencies are retranslated at the rates prevailing on the balance sheet date. Non-monetary assets and liabilities carried at fair value that are denominated in foreign currencies are translated at the rates prevailing at the date when the fair value was determined. Non-monetary items that are measured in terms of historical cost in a foreign currency are not retranslated.
Exchange differences arising on the settlement of monetary items, and on the retranslation of monetary items, are included in profit or loss for the period. Exchange differences arising on the retranslation of non-monetary items carried at fair value are included in profit or loss for the period, except for differences arising on the retranslation of non-monetary items in respect of which gains and losses are recognised directly in equity. For such non-monetary items, any exchange component of that gain or loss is also recognised directly in equity.
In order to hedge its exposure to certain foreign exchange risks, the Group holds currency swaps and borrowings in foreign currencies (see note 24 for details of the Group’s policies in respect of foreign exchange risks).
On consolidation, the assets and liabilities of the Group’s overseas operations are translated at the closing exchange rates on the balance sheet date. Income and expense items are translated at the average exchange rates for the period. Exchange differences arising from the average or actual exchange rates used and the period end rate, if any, are classified as equity and transferred to the Group’s translation reserve. Such translation differences are recognised as income or as expenses in the period in which the operation is disposed of.
Goodwill and fair value adjustments arising on the acquisition of a foreign entity are treated as assets and liabilities of the foreign entity and translated at the closing rate.
Borrowing costsBorrowing costs directly attributable to the acquisition, construction or production of qualifying assets, which are assets that necessarily take a substantial period of time to get ready for their intended use or sale, are added to the cost of those assets, until such time as the assets are substantially ready for their intended use or sale.
All other borrowing costs are recognised in profit or loss in the period in which they are incurred.
Non-GAAP measures and performanceIn measuring the Group and divisional adjusted operating performance, additional financial measures derived from the reported results have been used by management in order to eliminate factors which distort year-on-year comparisons. The Group’s adjusted performance is used to explain year-on-year changes when the effect of certain items are significant, including restructuring and reorganisation costs, property disposals, aged legal and self-insurance claims, onerous contract provisions, impairment charges and pension settlement gains or losses. In addition, management assess divisional performance before other intangible asset amortisation charges, as these are typically a result of Group decisions and therefore the divisions have little or no control over these charges. Management consider that this overall basis more appropriately reflects operating performance and provides a better understanding of the key performance indicators of the business. See note 4 for the reconciliation to non-GAAP measures and performance.
Subsequent revisions to adjusting items are also recognised as an adjusting item in future periods. In the current year non-GAAP adjusting items principally relate to other intangible asset amortisation charges, onerous contract provision, impairment charges, aged self-insurance claims, restructuring and reorganisation costs, bond ‘make-whole’ interest cost and the impact of the US tax reform. In the prior year the non-GAAP adjusting items principally related to other intangible asset amortisation charges, restructuring and reorganisation costs and gain on disposal of property.
Retirement benefit costsThe Group operates or participates in a number of pension schemes, which include both defined benefit schemes and defined contribution schemes.
Payments to defined contribution retirement benefit schemes are charged as an expense as they fall due. There is no legal or constructive obligation to pay additional contributions into a defined contribution scheme, if the fund has insufficient assets to pay all employees’ benefits relating to employee service in the current and prior periods.
For defined benefit schemes, the cost of providing benefits is determined using the Projected Unit Credit Method, with actuarial updates being carried out at each balance sheet date. Actuarial gains and losses are recognised in full in the period in which they occur. They are recognised outside the income statement and presented in the consolidated statement of comprehensive income.
All past service costs are recognised immediately in the consolidated income statement.
Where changes to the benefits in payment on defined benefit pension schemes require a change in scheme rules or ratification by the Trustees, the change is recognised as a past service charge or credit in the income statement. Where changes in assumptions can be made without changing the Trustee agreement, these are recognised as a change in assumptions in other comprehensive income.
FirstGroup Annual Report and Accounts 2018 107
Financial statements
2 Significant accounting policies continuedThe retirement benefit position recognised in the balance sheet represents the present value of the defined benefit obligation as reduced by the fair value of scheme assets. Any residual asset resulting from this calculation is limited to the present value of available refunds.
Various TOCs in the First Rail business participate in the Railways Pension Scheme, which is an industry-wide defined benefit scheme. The Group is obligated to fund the relevant section of the scheme over the period for which the franchise is held. The full liability is recognised on the balance sheet, which is then reduced by a franchise adjustment so that the net liability reflects the Group’s obligations to fund the scheme over the franchise term.
TaxThe tax expense represents the sum of the tax currently payable and deferred tax.
The tax currently payable is based on taxable profit for the year. Taxable profit differs from net profit as reported in the income statement because it excludes items of income or expense that are taxable or deductible in other years and it further excludes items that are never taxable or deductible. The Group’s liability for current tax is calculated using tax rates that have been enacted or substantively enacted by the balance sheet date and includes an estimate of the tax which could be payable as a result of differing interpretation of tax laws.
Deferred tax is the tax expected to be payable or recoverable on differences between the carrying amounts of assets and liabilities in the financial statements and the corresponding tax bases used in the computation of taxable profit, and is accounted for using the balance sheet liability method. Deferred tax liabilities are generally recognised for all taxable temporary differences and deferred tax assets are recognised to the extent that it is probable that taxable profits will be available against which deductible temporary differences can be utilised. Such assets and liabilities are not recognised if the temporary difference arises from the initial recognition of goodwill, or from the initial recognition (other than in a business combination) of other assets and liabilities in a transaction that affects neither the taxable profit nor the accounting profit.
Deferred tax liabilities are recognised for taxable temporary differences arising on investments in subsidiaries and associates, and interests in joint ventures, except where the Group is able to control the reversal of the temporary difference and it is probable that the temporary difference will not reverse in the foreseeable future.
The carrying amount of deferred tax assets is reviewed at each balance sheet date and reduced to the extent that it is no longer probable that sufficient taxable profits will be available to allow all or part of the asset to be recovered.
Deferred tax is calculated at the tax rates that are expected to apply in the period when the liability is settled or the asset is realised and is based on the estimated tax consequences of items that are subject to differing interpretations of tax laws. Deferred tax is charged or credited in the income statement, except when it relates to items charged or credited in other comprehensive income or directly to equity, in which case the deferred tax is also dealt with in other comprehensive income or directly in equity respectively.
Deferred tax assets and liabilities are offset when there is a legally enforceable right to set off current tax assets against current tax liabilities and when they relate to income taxes levied by the same tax authority and the Group intends to settle its current tax assets and liabilities on a net basis.
Property, plant and equipmentProperties for provision of services or administrative purposes are carried at cost, less any recognised impairment loss. Cost includes professional fees and, for qualifying assets, borrowing costs capitalised in accordance with the Group’s accounting policy. Depreciation of these assets, on the same basis as other property assets, commences when the assets are ready for their intended use.
Passenger carrying vehicles and other plant and equipment are stated at cost less accumulated depreciation and any recognised impairment loss.
Depreciation is charged so as to write off the cost of assets, other than freehold land, the land element of long leasehold properties or on assets in the course of construction, over their estimated useful lives, using the straight-line method, on the following bases:
Freehold buildings 50 years straight-lineLong leasehold buildings 50 years straight-lineShort leasehold properties period of leasePassenger carrying vehicles 7 to 17 years straight-lineOther plant and equipment 3 to 25 years straight-line
Assets held under finance leases are depreciated over their expected useful lives on the same basis as owned assets or, where shorter, over the term of the relevant lease.
The gain or loss arising on the disposal or retirement of an asset is determined as the difference between the sales proceeds and the carrying amount of the asset and is recognised in income.
Capital grantsCapital grants relating to property, plant and equipment are treated as deferred income and released to the income statement over the expected useful lives of the assets concerned. Capital grants are not recognised until there is a reasonable assurance that the Group will comply with the conditions attaching to them and that the grants will be received.
Notes to the consolidated financial statementscontinued
FirstGroup Annual Report and Accounts 2018108
2 Significant accounting policies continuedImpairment of tangible and intangible assets excluding goodwillAt each balance sheet date, the Group reviews the carrying amounts of its tangible and intangible assets to determine whether there is any indication that those assets have suffered an impairment loss. If any such indication exists, the recoverable amount of the asset is estimated in order to determine the extent of the impairment loss (if any). Where the asset does not generate cash flows that are independent from other assets, the Group estimates the recoverable amount of the CGU to which the asset belongs.
Recoverable amount is the higher of fair value less costs to sell and value in use. In assessing value in use, the estimated future cash flows are discounted to their present value using a pre-tax discount rate that reflects current market assessments of the time value of money and the risks specific to the asset for which the estimates of future cash flows have not been adjusted.
If the recoverable amount of an asset or CGU is estimated to be less than its carrying amount, the carrying amount of the asset or CGU is reduced to its recoverable amount. An impairment loss is recognised as an expense immediately.
Where an impairment loss subsequently reverses, the carrying amount of the asset or CGU is increased to the revised estimate of its recoverable amount, but so that the increased carrying amount does not exceed the carrying amount that would have been determined had no impairment loss been recognised for the asset or CGU in prior years. A reversal of an impairment loss is recognised as income immediately except in the case of goodwill, unless the relevant asset is carried at a revalued amount, in which case the reversal of the impairment loss is treated as a revaluation increase.
InventoriesInventories are stated at the lower of cost and net realisable value. Net realisable value represents the estimated selling price less all estimated costs of completion and costs to be incurred in marketing, selling and distribution.
Financial instrumentsFinancial assets and financial liabilities are recognised on the Group’s balance sheet when the Group becomes a party to the contractual provisions of the instrument.
Financial assetsThe Group measures financial assets on initial recognition at fair value, and determines the classification of such assets at initial recognition and on any subsequent reclassification event.
Where there is no active market for a financial asset, fair value is determined using valuation techniques including recent commercial transactions and discounted cash flows. Otherwise financial assets are carried at amortised cost.
Financial assets are classified into one of three primary categories:
Fair value through profit and lossThis covers any financial asset designated on initial recognition to be measured at fair value with fair value changes to go through the profit and loss, and financial assets acquired principally for the purpose of trading in the short term.
Held to maturity investmentsNon-derivative financial assets with fixed or determinable payments and fixed maturity are classified here when the Group has the intention and ability to hold to maturity. These financial assets are held at amortised cost using the effective interest method. Gains and losses are recognised in the income statement when the investments are derecognised or impaired as well as through amortisation.
Loans and receivablesNon-derivative financial assets with fixed or determinable payments that are not quoted in an active market. Such assets are carried at amortised cost using the effective interest rate method and the carrying value in all cases approximates to the fair value.
The most significant financial assets under this category are trade receivables and bank deposits.
Trade receivables are measured at amortised cost. Appropriate allowances for estimated irrecoverable amounts are recognised in profit or loss when there is objective evidence that the asset is impaired.
Bank deposits are included within cash and cash equivalents. Cash and cash equivalents as defined for the cash flow statement comprise cash in hand, cash held at bank with immediate access, other short term investments and bank deposits with maturities of three months or less from the date of inception and bank overdrafts. In the consolidated balance sheet, cash and cash equivalents exclude bank overdrafts. Bank overdrafts that have no legal right of set-off against cash and cash equivalents are included within borrowings in current liabilities. All are carried on the balance sheet at cost. Cash and cash equivalents includes ring-fenced cash. The most significant ring-fenced cash balances are held by the Group’s First Rail subsidiaries. Under the terms of the Rail franchise agreements, cash can only be distributed by the train operating companies up to the lower of the amount of retained profits or the amount determined by prescribed liquidity ratios. The ring-fenced cash represents that which is not available for distribution or the amount required to satisfy the contractual liquidity ratio at the balance sheet date.
FirstGroup Annual Report and Accounts 2018 109
Financial statements
2 Significant accounting policies continuedFinancial liabilities and equity instrumentsFinancial liabilities and equity instruments are classified according to the substance of the contractual arrangements entered into. An equity instrument is any contract that evidences a residual interest in the assets of the Group after deducting all of its liabilities. Equity instruments issued by the Company are recorded at the proceeds received net of direct issue costs.
Financial liabilitiesBank borrowingsInterest-bearing bank loans and overdrafts are recorded at the proceeds received, net of direct issue costs.
Bonds and loan notesThese are measured either on an amortised cost basis or at fair value, if adopted.
Trade payablesTrade payables are initially measured at fair value, and are subsequently measured at amortised cost, using the effective interest rate method.
Derivative financial instruments and hedge accountingThe Group uses derivative financial instruments to hedge interest rate risks, foreign currency risks and fuel price risks. Use of such financial instruments is governed by policies and delegated authorities approved by the Board. The Group does not use derivative financial instruments for speculative purposes.
The main derivative financial instruments used by the Group are interest rate swaps, fuel swaps, and cross currency interest rate swaps. Such instruments are initially recognised at fair value and subsequently remeasured to fair value at the reported balance sheet date. The fair values are calculated by reference to market exchange rates, interest rates and fuel prices at the period end, and supported by counterparty confirmations.
Changes in the fair value of derivative financial instruments that do not qualify for hedge accounting as cash flow hedges or foreign currency hedges of a foreign net investment are recognised in the income statement as they arise.
Hedge accounting is discontinued when the hedging instrument expires or is sold, terminated, or exercised, or no longer qualifies for hedge accounting. At that time, any cumulative gain or loss on the hedging instrument recognised in equity is retained in equity until the forecasted transaction occurs. If a hedged transaction is no longer expected to occur, the net cumulative gain or loss recognised in equity is transferred to the income statement for the period.
Derivatives embedded in other financial instruments or other host contracts are treated as separate derivatives when their risks and characteristics are not closely related to those of host contracts and the host contracts are not carried at fair value with unrealised gains or losses reported in the income statement.
DebtDebt is initially stated at the amount of the net proceeds after the deduction of issue costs. The carrying amount is increased by the amortisation of debt issuance fees in respect of the accounting period and reduced by repayments made in the period.
ProvisionsProvisions are recognised when the Group has a present obligation as a result of a past event and it is probable that the Group will be required to settle that obligation. Provisions are measured at the Directors’ best estimate of the expenditure required to settle the obligation at the balance sheet date and are discounted to present value where the effect is material. Amounts due within 12 months of the balance sheet date are considered to be reliably measured and are therefore included within accruals.
Self-insuranceThe Group’s policy is to self-insure high frequency, low value claims within the businesses. In addition there are typically a smaller number of major claims during a financial year for which cover is obtained through third-party insurance policies subject to an insurance deductible. Provision is made under IAS 37 Provisions, Contingent Liabilities and Contingent Assets for the estimated cost of settling uninsured claims for incidents occurring prior to the balance sheet date. The provision is discounted to appropriately reflect the timing of future cash claims settlements.
Share-based paymentsThe Group issues equity-settled share-based payments to certain employees. Equity-settled share-based payments are measured at fair value at the date of grant. The fair value is expensed on a straight-line basis over the vesting period, based on the Group’s estimate of shares that will eventually vest and is adjusted for the effects of non-market-based vesting conditions.
Fair value is measured by use of a Black-Scholes or other appropriate valuation models. The expected life used in the model has been adjusted, based on management’s best estimate, for the effects of non-transferability, exercise restrictions and behavioural considerations.
Dividend distributionDividend distribution to the Company’s shareholders is recognised as a liability in the Group’s financial statements in the period in which the dividends are approved by the Company’s shareholders.
Notes to the consolidated financial statementscontinued
FirstGroup Annual Report and Accounts 2018110
2 Significant accounting policies continuedNew standards and interpretations not appliedAt the date of authorisation of these Financial Statements, the Group has not applied the following standards that have been issued but are not yet effective:
IFRS 9 Financial InstrumentsIFRS 9 Financial Instruments replaces IAS 39 with effect from accounting periods commencing 1 January 2018. The new standard covers three distinct areas: the classification and measurement of financial assets and liabilities; the impairment of financial assets1; and new hedging requirements designed to give increased flexibility in relation to hedge effectiveness.
IFRS 9 requires a new impairment model with impairment provisions based on expected credit losses rather than incurred credit losses under IAS 39. Based on an initial assessment of 2017/18 closing balances, the current expectation is that there will be a transitional increase/decrease in impairment allowances of nil. This amount will be finalised in the financial statements for the year ended 31 March 2019.
In relation to hedge accounting, we do not expect a material impact on the Group’s financial statements. It is expected that our hedging instruments will remain effective and that current hedge relationships will qualify as continuing hedges upon the adoption of IFRS 9. There will be some increased disclosure requirements under IFRS 9 and these will be reflected in the financial statements for the year ended 31 March 2019.
The Group is adopting the new rules prospectively from 1 April 2018. It is currently considered that no material restatements will be necessary for the comparative period.
IFRS 15 Revenue from Contracts with CustomersIFRS 15 Revenue from Contracts with Customers replaces IAS 18 with effect from accounting periods commencing 1 January 2018. It introduces a new revenue recognition model that recognises revenue either at a point in time or over time. The model features a contract-based five step analysis of transactions to determine whether, how much and when revenue is recognised and is based on the principle that revenue is recognised when control of a good or service transfers to a customer.
The Group has evaluated a sample of customer contracts from all major revenue streams across the Group to identify the performance obligations, the timing of the revenue recognition and the treatment of variable elements of pricing.
Based on this assessment, Management have concluded that although there are areas of difference, there is not currently expected to be a material impact on the Group’s financial statements and that revenues are correctly attached to performance obligations and are recognised as the service is transferred to the customer and that variable elements of price such as discounts, rebates and liquidated damages are properly provided.
The Group is adopting IFRS 15 from 1 April 2018 on a prospective basis. It is currently considered that no material restatements will be necessary for the comparative period and that there will not be a material impact on the Group’s revenue recognition in future periods.
IFRS 16 LeasesIFRS 16 Leases replaces IAS 17 with effect from accounting periods commencing 1 January 2019. The new standard eliminates the operating lease classification and therefore on the balance sheet the lessees will be required to recognise an asset (the right to use the leased item) and lease liabilities for all leases unless they have a term of less than twelve months or are of low value. On the income statement, the operating lease expense will be replaced by a combination of depreciation and interest.
As at 31 March 2018, the Group holds a significant number of operating leases that are expensed over the lease term. Management are in the process of assessing the potential impact of this standard on the financial statements for the year ended 31 March 2020, and it is anticipated that the transition to IFRS 16 will have a material impact on the value of lease assets and liabilities recognised in the consolidated balance sheet. However at this stage it is not practical to provide a reasonable estimate of the financial effect until this assessment is complete.
Adoption of new and revised standards
The accounting policies adopted are consistent with those of the previous financial year except for the following amendments to existing Standards which have been adopted in the current year. Their adoption has not had any significant impact on the amounts reported in these financial statements.
Amendment to IAS 12 – Recognition of Deferred Tax Assets for Unrealised Losses, and
Amendment to IAS 7 – Disclosure initiative ‘Changes in Liabilities arising from financing activities’
The amendment to IAS 7 requires a disclosure of changes in liabilities arising from financing activities. This has been presented in note 32.
1 Financial assets include trade receivables, other receivables, prepayments and accrued income.
FirstGroup Annual Report and Accounts 2018 111
Financial statements
2 Significant accounting policies continuedCritical accounting judgements and key sources of estimation uncertaintyThe preparation of financial statements in conformity with generally accepted accounting principles requires the use of estimates and assumptions that affect the reported amounts of assets and liabilities at the date of the financial statements and the reported amounts of revenues and expenses during the reporting period. Although these estimates are based on management’s best knowledge, actual results may ultimately differ from those estimates. The estimates and underlying assumptions are reviewed on an ongoing basis. Revisions to accounting estimates are recognised in the period in which the estimate is revised if the revision affects only that period, or in the period of revision and future periods if the revision affects both current and future periods.
In the process of applying the Group’s accounting policies which are described above, management has made the following judgements and estimates that have the most significant effect on the amounts recognised in the financial statements.
i) Critical accounting judgements
Defined benefit pension arrangementsThe UK schemes retirement benefit obligations are discounted at a rate set by reference to market yields at the end of the reporting period on high-quality corporate bonds. Significant judgement is required when setting the criteria for bonds to be included in the population from which the yield curve is derived. The most significant criteria considered for the selection of bonds include the issue size of the corporate bonds, quality of the bonds and the identification of outliers which are excluded. Management follows actuarial advice from a third party when determining these judgements. Another key judgement is the longevity of members. We take specialist advice on this from our actuarial advisors which aims to consider the likely experience taking into account each scheme’s characteristics. Our approach is to review these assumptions following completion of their funding valuations, and more frequently only if appropriate to do so. The carrying amount of the Group’s retirement benefit obligations at 31 March 2018 was a liability of £273.7m (2017: £358.5m). Further details and sensitivities are set out in note 36.
ii) Key sources of estimation uncertainty
Impairment of intangible assets (including goodwill)Determining whether goodwill is impaired requires an estimation of the value in use of the CGUs to which the goodwill has been allocated. The value in use requires the entity to estimate the future cash flows expected to arise from the CGU and a suitable discount rate in order to calculate present value. As detailed in notes 4 and 11, the Directors have concluded that there should be an impairment charge of £277.3m on the Greyhound CGU (£260.6m on goodwill, £12.3m on property, plant and equipment and £4.4m on other intangible assets).
The carrying amount of goodwill at the balance sheet date was £1,496.8m (2017: £1,956.1m) as set out in note 11 and the carrying amount of other intangible assets at the balance sheet date was £89.8m (2017: £150.6m) as set out in note 12.
Onerous contractsThe Group has a number of contractual commitments most notably in respect of its rail franchises and First Student and First Transit businesses. IAS 37 requires a provision to be made for an onerous contract where it is probable that the future economic benefits to be derived from the contract are less than the unavoidable costs under the contract. In order to determine the amount of any contract provision it is necessary to forecast future financial performance and then apply an appropriate discount rate to determine a net present value. The estimation of both the forecasts and the discount rate involves a significant degree of judgement. Actual results can differ from those assumed in the forecasts and there can be no absolute assurance that the assumptions used will hold true.
The TPE onerous contract provision is sensitive to a change in the assumptions used, most notably to passenger revenue growth. A reduction or increase of 0.5% in the cumulative annual passenger growth rate assumption would increase or decrease the onerous contract provision required of £106.3m by £27.0m.
Self-insuranceProvision is made for all known incidents for which there is self-insurance using management’s best estimate of the likely settlement of these incidents. The estimated settlement is reviewed on a regular basis with independent actuarial advice and the amount provided (including IBNR) is adjusted as required. The self-insurance reserve is most sensitive to favourable or adverse developments on individually significant claims. The Group’s total self-insurance provisions, including those classified within accruals, as at the balance sheet date were £368.8m (2017: £391.0m) as set out in note 26.
Notes to the consolidated financial statementscontinued
FirstGroup Annual Report and Accounts 2018112
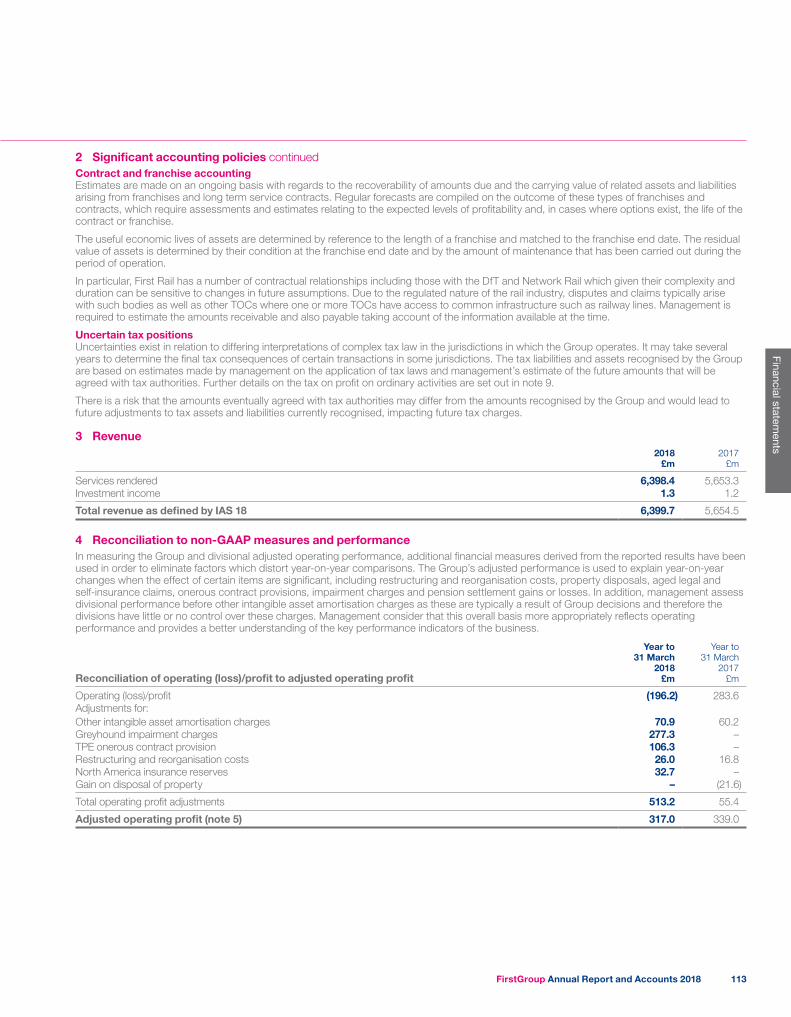
2 Significant accounting policies continuedContract and franchise accountingEstimates are made on an ongoing basis with regards to the recoverability of amounts due and the carrying value of related assets and liabilities arising from franchises and long term service contracts. Regular forecasts are compiled on the outcome of these types of franchises and contracts, which require assessments and estimates relating to the expected levels of profitability and, in cases where options exist, the life of the contract or franchise.
The useful economic lives of assets are determined by reference to the length of a franchise and matched to the franchise end date. The residual value of assets is determined by their condition at the franchise end date and by the amount of maintenance that has been carried out during the period of operation.
In particular, First Rail has a number of contractual relationships including those with the DfT and Network Rail which given their complexity and duration can be sensitive to changes in future assumptions. Due to the regulated nature of the rail industry, disputes and claims typically arise with such bodies as well as other TOCs where one or more TOCs have access to common infrastructure such as railway lines. Management is required to estimate the amounts receivable and also payable taking account of the information available at the time.
Uncertain tax positionsUncertainties exist in relation to differing interpretations of complex tax law in the jurisdictions in which the Group operates. It may take several years to determine the final tax consequences of certain transactions in some jurisdictions. The tax liabilities and assets recognised by the Group are based on estimates made by management on the application of tax laws and management’s estimate of the future amounts that will be agreed with tax authorities. Further details on the tax on profit on ordinary activities are set out in note 9.
There is a risk that the amounts eventually agreed with tax authorities may differ from the amounts recognised by the Group and would lead to future adjustments to tax assets and liabilities currently recognised, impacting future tax charges.
3 Revenue2018
£m2017
£m
Services rendered 6,398.4 5,653.3Investment income 1.3 1.2
Total revenue as defined by IAS 18 6,399.7 5,654.5
4 Reconciliation to non-GAAP measures and performanceIn measuring the Group and divisional adjusted operating performance, additional financial measures derived from the reported results have been used in order to eliminate factors which distort year-on-year comparisons. The Group’s adjusted performance is used to explain year-on-year changes when the effect of certain items are significant, including restructuring and reorganisation costs, property disposals, aged legal and self-insurance claims, onerous contract provisions, impairment charges and pension settlement gains or losses. In addition, management assess divisional performance before other intangible asset amortisation charges as these are typically a result of Group decisions and therefore the divisions have little or no control over these charges. Management consider that this overall basis more appropriately reflects operating performance and provides a better understanding of the key performance indicators of the business.
Reconciliation of operating (loss)/profit to adjusted operating profit
Year to 31 March
2018 £m
Year to 31 March
2017 £m
Operating (loss)/profit (196.2) 283.6Adjustments for:Other intangible asset amortisation charges 70.9 60.2Greyhound impairment charges 277.3 –TPE onerous contract provision 106.3 –Restructuring and reorganisation costs 26.0 16.8North America insurance reserves 32.7 –Gain on disposal of property – (21.6)
Total operating profit adjustments 513.2 55.4
Adjusted operating profit (note 5) 317.0 339.0
FirstGroup Annual Report and Accounts 2018 113
Financial statements
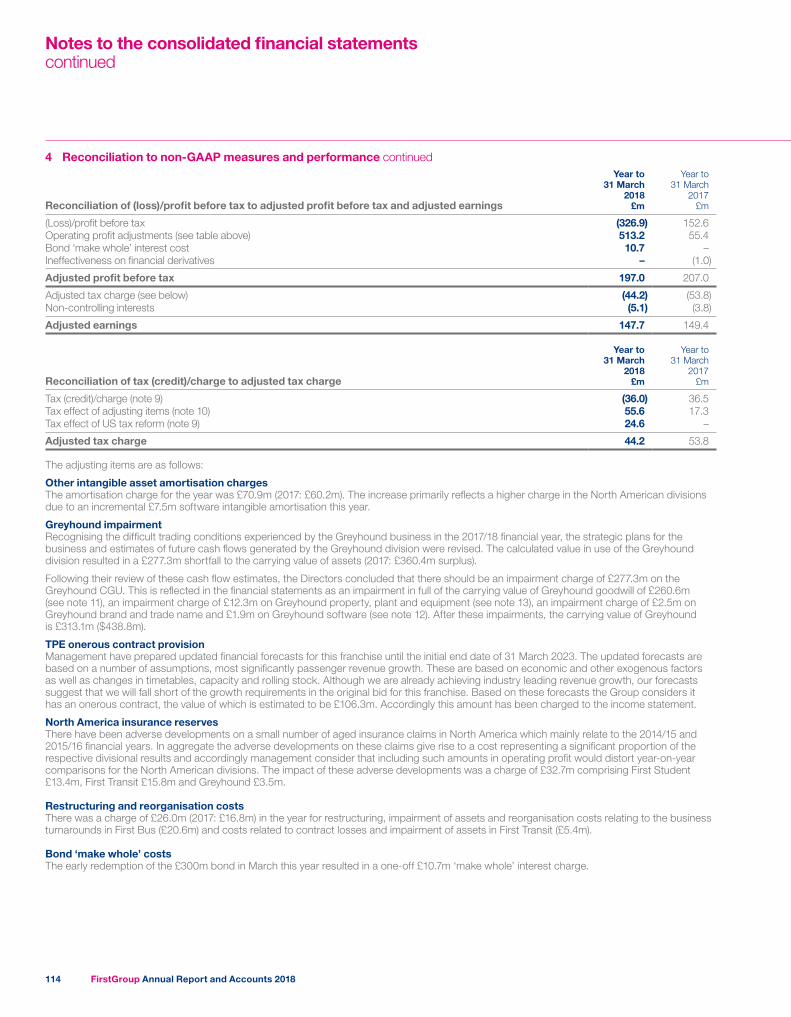
4 Reconciliation to non-GAAP measures and performance continued
Reconciliation of (loss)/profit before tax to adjusted profit before tax and adjusted earnings
Year to 31 March
2018 £m
Year to 31 March
2017 £m
(Loss)/profit before tax (326.9) 152.6Operating profit adjustments (see table above) 513.2 55.4Bond ‘make whole’ interest cost 10.7 –Ineffectiveness on financial derivatives – (1.0)
Adjusted profit before tax 197.0 207.0
Adjusted tax charge (see below) (44.2) (53.8)Non-controlling interests (5.1) (3.8)
Adjusted earnings 147.7 149.4
Reconciliation of tax (credit)/charge to adjusted tax charge
Year to 31 March
2018 £m
Year to 31 March
2017 £m
Tax (credit)/charge (note 9) (36.0) 36.5Tax effect of adjusting items (note 10) 55.6 17.3Tax effect of US tax reform (note 9) 24.6 –
Adjusted tax charge 44.2 53.8
The adjusting items are as follows:
Other intangible asset amortisation chargesThe amortisation charge for the year was £70.9m (2017: £60.2m). The increase primarily reflects a higher charge in the North American divisions due to an incremental £7.5m software intangible amortisation this year.
Greyhound impairmentRecognising the difficult trading conditions experienced by the Greyhound business in the 2017/18 financial year, the strategic plans for the business and estimates of future cash flows generated by the Greyhound division were revised. The calculated value in use of the Greyhound division resulted in a £277.3m shortfall to the carrying value of assets (2017: £360.4m surplus).
Following their review of these cash flow estimates, the Directors concluded that there should be an impairment charge of £277.3m on the Greyhound CGU. This is reflected in the financial statements as an impairment in full of the carrying value of Greyhound goodwill of £260.6m (see note 11), an impairment charge of £12.3m on Greyhound property, plant and equipment (see note 13), an impairment charge of £2.5m on Greyhound brand and trade name and £1.9m on Greyhound software (see note 12). After these impairments, the carrying value of Greyhound is £313.1m ($438.8m).
TPE onerous contract provisionManagement have prepared updated financial forecasts for this franchise until the initial end date of 31 March 2023. The updated forecasts are based on a number of assumptions, most significantly passenger revenue growth. These are based on economic and other exogenous factors as well as changes in timetables, capacity and rolling stock. Although we are already achieving industry leading revenue growth, our forecasts suggest that we will fall short of the growth requirements in the original bid for this franchise. Based on these forecasts the Group considers it has an onerous contract, the value of which is estimated to be £106.3m. Accordingly this amount has been charged to the income statement.
North America insurance reservesThere have been adverse developments on a small number of aged insurance claims in North America which mainly relate to the 2014/15 and 2015/16 financial years. In aggregate the adverse developments on these claims give rise to a cost representing a significant proportion of the respective divisional results and accordingly management consider that including such amounts in operating profit would distort year-on-year comparisons for the North American divisions. The impact of these adverse developments was a charge of £32.7m comprising First Student £13.4m, First Transit £15.8m and Greyhound £3.5m.
Restructuring and reorganisation costsThere was a charge of £26.0m (2017: £16.8m) in the year for restructuring, impairment of assets and reorganisation costs relating to the business turnarounds in First Bus (£20.6m) and costs related to contract losses and impairment of assets in First Transit (£5.4m).
Bond ‘make whole’ costsThe early redemption of the £300m bond in March this year resulted in a one-off £10.7m ‘make whole’ interest charge.
Notes to the consolidated financial statementscontinued
FirstGroup Annual Report and Accounts 2018114
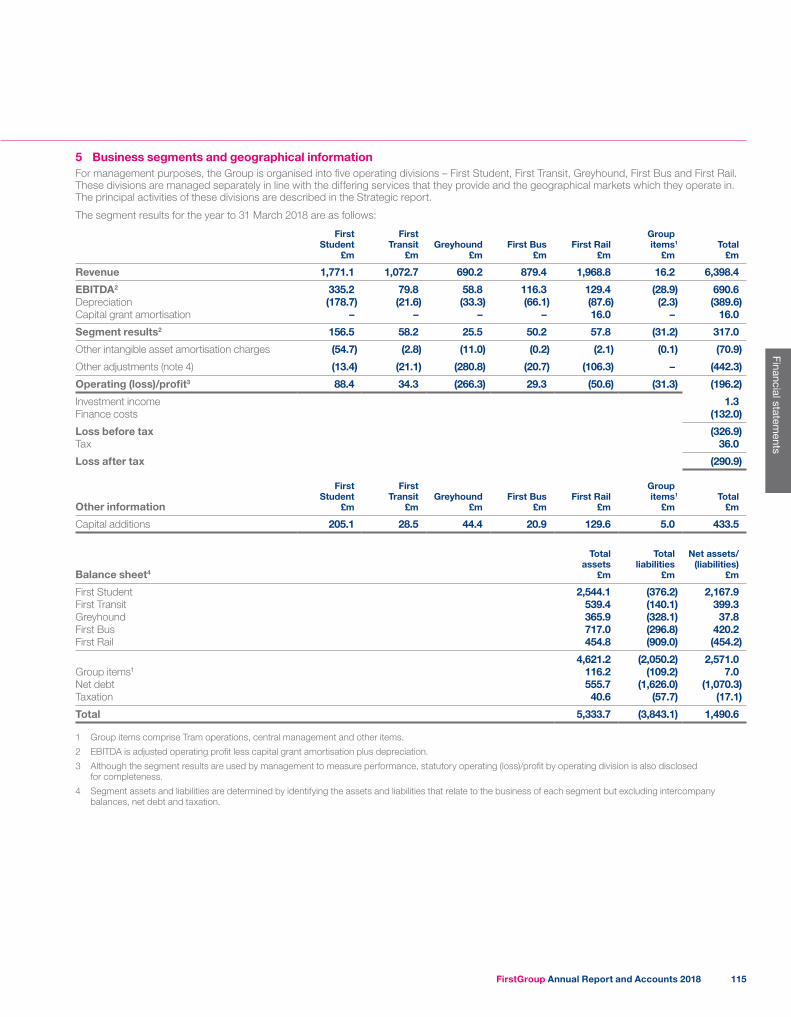
5 Business segments and geographical informationFor management purposes, the Group is organised into five operating divisions – First Student, First Transit, Greyhound, First Bus and First Rail. These divisions are managed separately in line with the differing services that they provide and the geographical markets which they operate in. The principal activities of these divisions are described in the Strategic report.
The segment results for the year to 31 March 2018 are as follows:
First Student
£m
First Transit
£mGreyhound
£mFirst Bus
£mFirst Rail
£m
Group items1
£mTotal
£m
Revenue 1,771.1 1,072.7 690.2 879.4 1,968.8 16.2 6,398.4
EBITDA2 335.2 79.8 58.8 116.3 129.4 (28.9) 690.6Depreciation (178.7) (21.6) (33.3) (66.1) (87.6) (2.3) (389.6)Capital grant amortisation – – – – 16.0 – 16.0
Segment results2 156.5 58.2 25.5 50.2 57.8 (31.2) 317.0
Other intangible asset amortisation charges (54.7) (2.8) (11.0) (0.2) (2.1) (0.1) (70.9)
Other adjustments (note 4) (13.4) (21.1) (280.8) (20.7) (106.3) – (442.3)
Operating (loss)/profit3 88.4 34.3 (266.3) 29.3 (50.6) (31.3) (196.2)
Investment income 1.3Finance costs (132.0)
Loss before tax (326.9)Tax 36.0
Loss after tax (290.9)
Other information
First Student
£m
First Transit
£mGreyhound
£mFirst Bus
£mFirst Rail
£m
Group items1
£mTotal
£m
Capital additions 205.1 28.5 44.4 20.9 129.6 5.0 433.5
Balance sheet4
Total assets
£m
Total liabilities
£m
Net assets/(liabilities)
£m
First Student 2,544.1 (376.2) 2,167.9First Transit 539.4 (140.1) 399.3Greyhound 365.9 (328.1) 37.8First Bus 717.0 (296.8) 420.2First Rail 454.8 (909.0) (454.2)
4,621.2 (2,050.2) 2,571.0Group items1 116.2 (109.2) 7.0Net debt 555.7 (1,626.0) (1,070.3)Taxation 40.6 (57.7) (17.1)
Total 5,333.7 (3,843.1) 1,490.6
1 Group items comprise Tram operations, central management and other items.
2 EBITDA is adjusted operating profit less capital grant amortisation plus depreciation.
3 Although the segment results are used by management to measure performance, statutory operating (loss)/profit by operating division is also disclosed for completeness.
4 Segment assets and liabilities are determined by identifying the assets and liabilities that relate to the business of each segment but excluding intercompany balances, net debt and taxation.
FirstGroup Annual Report and Accounts 2018 115
Financial statements
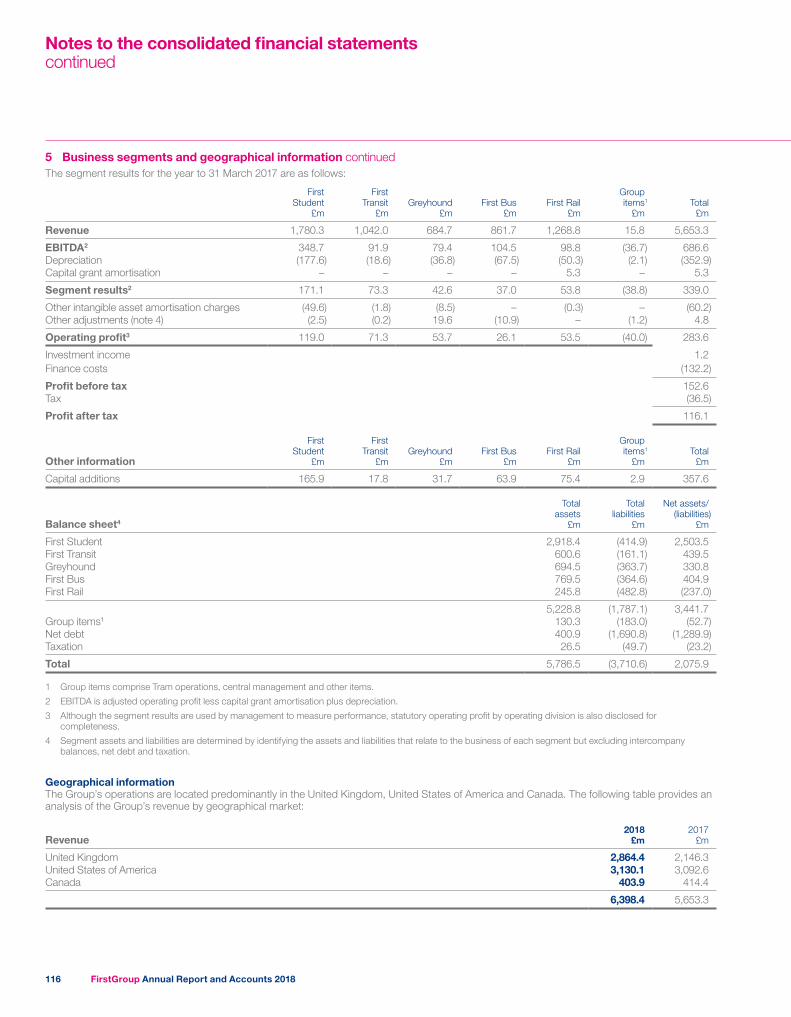
5 Business segments and geographical information continuedThe segment results for the year to 31 March 2017 are as follows:
First Student
£m
First Transit
£mGreyhound
£mFirst Bus
£mFirst Rail
£m
Group items1
£mTotal
£m
Revenue 1,780.3 1,042.0 684.7 861.7 1,268.8 15.8 5,653.3
EBITDA2 348.7 91.9 79.4 104.5 98.8 (36.7) 686.6Depreciation (177.6) (18.6) (36.8) (67.5) (50.3) (2.1) (352.9)Capital grant amortisation – – – – 5.3 – 5.3
Segment results2 171.1 73.3 42.6 37.0 53.8 (38.8) 339.0
Other intangible asset amortisation charges (49.6) (1.8) (8.5) – (0.3) – (60.2)Other adjustments (note 4) (2.5) (0.2) 19.6 (10.9) – (1.2) 4.8
Operating profit3 119.0 71.3 53.7 26.1 53.5 (40.0) 283.6
Investment income 1.2Finance costs (132.2)
Profit before tax 152.6Tax (36.5)
Profit after tax 116.1
Other information
First Student
£m
First Transit
£mGreyhound
£mFirst Bus
£mFirst Rail
£m
Group items1
£mTotal
£m
Capital additions 165.9 17.8 31.7 63.9 75.4 2.9 357.6
Balance sheet4
Total assets
£m
Total liabilities
£m
Net assets/(liabilities)
£m
First Student 2,918.4 (414.9) 2,503.5First Transit 600.6 (161.1) 439.5Greyhound 694.5 (363.7) 330.8First Bus 769.5 (364.6) 404.9First Rail 245.8 (482.8) (237.0)
5,228.8 (1,787.1) 3,441.7Group items1 130.3 (183.0) (52.7)Net debt 400.9 (1,690.8) (1,289.9)Taxation 26.5 (49.7) (23.2)
Total 5,786.5 (3,710.6) 2,075.9
1 Group items comprise Tram operations, central management and other items.
2 EBITDA is adjusted operating profit less capital grant amortisation plus depreciation.
3 Although the segment results are used by management to measure performance, statutory operating profit by operating division is also disclosed for completeness.
4 Segment assets and liabilities are determined by identifying the assets and liabilities that relate to the business of each segment but excluding intercompany balances, net debt and taxation.
Geographical informationThe Group’s operations are located predominantly in the United Kingdom, United States of America and Canada. The following table provides an analysis of the Group’s revenue by geographical market:
Revenue2018
£m2017
£m
United Kingdom 2,864.4 2,146.3United States of America 3,130.1 3,092.6Canada 403.9 414.4
6,398.4 5,653.3
Notes to the consolidated financial statementscontinued
FirstGroup Annual Report and Accounts 2018116

5 Business segments and geographical information continuedThe following is an analysis of non-current assets excluding financial instruments, deferred tax and pensions, the carrying amount of segment assets, and additions to property, plant and equipment and intangible assets, analysed by the geographical area in which the assets are located:
Non-current assets excluding financial instruments
deferred tax and pensions
Additions to property, plant and equipment and intangible assets
Carrying amount of segment total assets
2018 £m
2017 £m
2018 £m
2017 £m
2018 £m
2017 £m
United Kingdom 795.3 803.1 155.5 142.4 1,821.7 1,505.6United States of America 2,620.6 3,270.6 256.8 208.9 3,124.2 3,845.2Canada 291.8 342.8 21.2 6.3 347.2 409.2Unallocated corporate items – – – – 40.6 26.5
3,707.7 4,416.5 433.5 357.6 5,333.7 5,786.5
6 Operating (loss)/profitOperating (loss)/profit has been arrived at after charging/(crediting):
2018 £m
2017 £m
Depreciation of property, plant and equipment (note 13) 389.6 352.9Operating lease charges (note 34) 522.6 300.9Other intangible asset amortisation charges (note 12) 70.9 60.2Capital grant amortisation (16.0) (5.3)Cost of inventories recognised as an expense 575.1 571.6Employee costs (note 7) 3,162.5 2,944.6Loss/(profit) on disposal of property, plant and equipment 8.3 (18.9)Impairment charges 284.8 4.5TPE onerous contract provision (note 4) 106.3 –North America insurance reserves (note 4) 32.7 –Auditor’s remuneration (see below) 2.3 2.0Rail franchise payments 226.9 140.8Other operating costs1 1,228.6 1,016.4
6,594.6 5,369.7
1 Includes £63.5m (2017: £66.1m) received or receivable from government bodies in respect of bus service operator grants and fuel duty rebates.
Amounts payable to Deloitte LLP and its associates by the Company and its subsidiary undertakings in respect of audit and non-audit services are shown below:
2018£m
2017 £m
Fees payable to the Company’s auditor for the audit of the Company’s annual accounts 0.1 0.1Fees payable to the Company’s auditor and its associates for the audit of theCompany’s subsidiaries pursuant to legislation 2.0 1.7
Total audit fees 2.1 1.8
Audit-related assurance services 0.2 0.2
Total non-audit fees 0.2 0.2
Fees payable to Deloitte LLP and its associates for non-audit services to the Company are not required to be disclosed because the consolidated financial statements are required to disclose such fees on a consolidated basis.
Details of the Group’s policy on the use of auditors for non-audit services, the reasons why the auditor was used rather than another supplier and how the auditor’s independence and objectivity was safeguarded are set out in the Corporate governance report on pages 63 to 64. No services were provided pursuant to contingent fee arrangements.
FirstGroup Annual Report and Accounts 2018 117
Financial statements
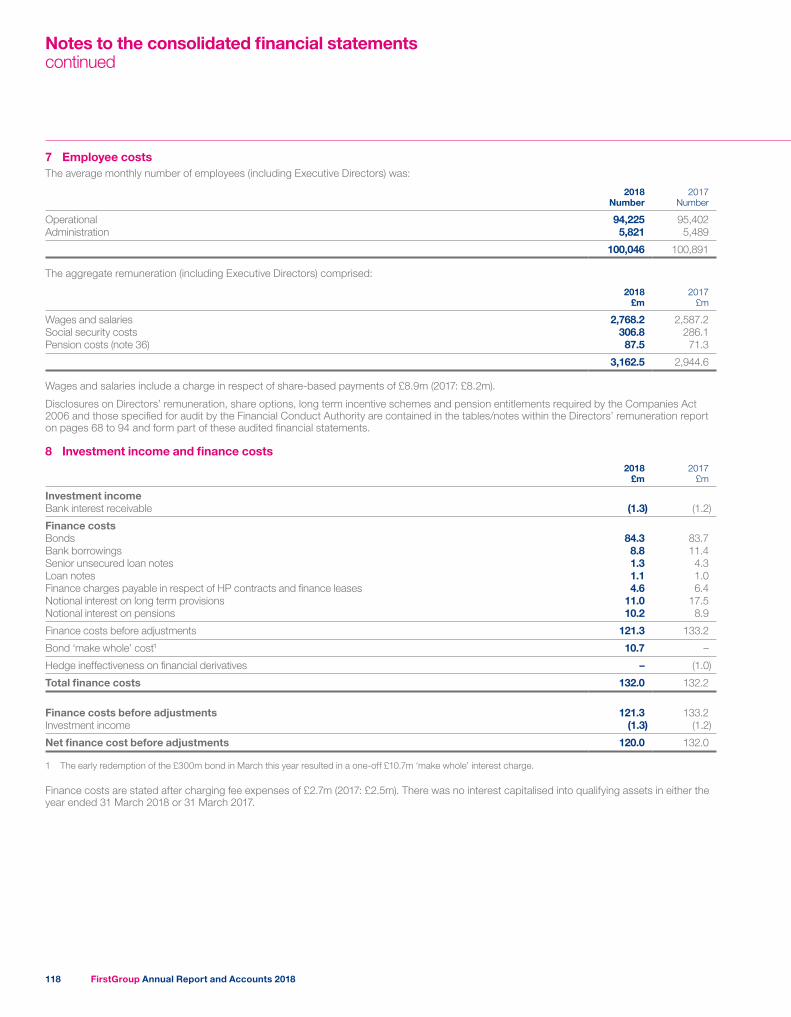
7 Employee costsThe average monthly number of employees (including Executive Directors) was:
2018 Number
2017 Number
Operational 94,225 95,402Administration 5,821 5,489
100,046 100,891
The aggregate remuneration (including Executive Directors) comprised:
2018 £m
2017 £m
Wages and salaries 2,768.2 2,587.2Social security costs 306.8 286.1Pension costs (note 36) 87.5 71.3
3,162.5 2,944.6
Wages and salaries include a charge in respect of share-based payments of £8.9m (2017: £8.2m).
Disclosures on Directors’ remuneration, share options, long term incentive schemes and pension entitlements required by the Companies Act 2006 and those specified for audit by the Financial Conduct Authority are contained in the tables/notes within the Directors’ remuneration report on pages 68 to 94 and form part of these audited financial statements.
8 Investment income and finance costs2018
£m2017
£m
Investment incomeBank interest receivable (1.3) (1.2)
Finance costsBonds 84.3 83.7Bank borrowings 8.8 11.4Senior unsecured loan notes 1.3 4.3Loan notes 1.1 1.0Finance charges payable in respect of HP contracts and finance leases 4.6 6.4Notional interest on long term provisions 11.0 17.5Notional interest on pensions 10.2 8.9
Finance costs before adjustments 121.3 133.2
Bond ‘make whole’ cost1 10.7 –
Hedge ineffectiveness on financial derivatives – (1.0)
Total finance costs 132.0 132.2
Finance costs before adjustments 121.3 133.2Investment income (1.3) (1.2)
Net finance cost before adjustments 120.0 132.0
1 The early redemption of the £300m bond in March this year resulted in a one-off £10.7m ‘make whole’ interest charge.
Finance costs are stated after charging fee expenses of £2.7m (2017: £2.5m). There was no interest capitalised into qualifying assets in either the year ended 31 March 2018 or 31 March 2017.
Notes to the consolidated financial statementscontinued
FirstGroup Annual Report and Accounts 2018118
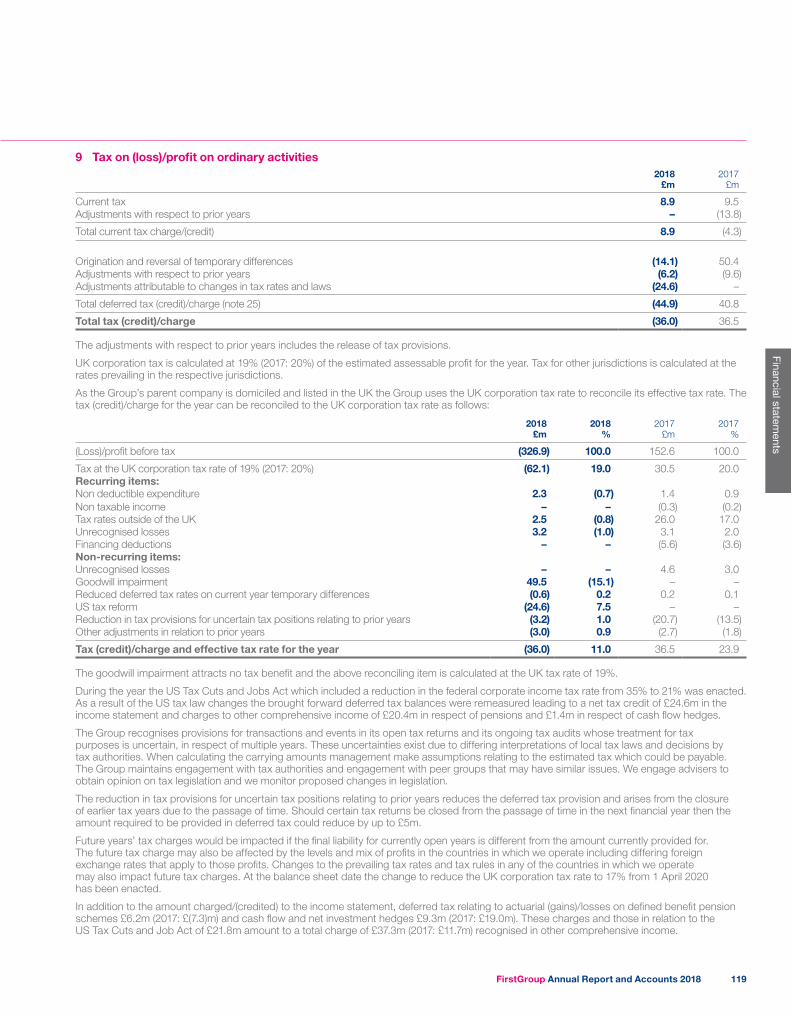
9 Tax on (loss)/profit on ordinary activities2018
£m2017
£m
Current tax 8.9 9.5Adjustments with respect to prior years – (13.8)
Total current tax charge/(credit) 8.9 (4.3)
Origination and reversal of temporary differences (14.1) 50.4Adjustments with respect to prior years (6.2) (9.6)Adjustments attributable to changes in tax rates and laws (24.6) –
Total deferred tax (credit)/charge (note 25) (44.9) 40.8
Total tax (credit)/charge (36.0) 36.5
The adjustments with respect to prior years includes the release of tax provisions.
UK corporation tax is calculated at 19% (2017: 20%) of the estimated assessable profit for the year. Tax for other jurisdictions is calculated at the rates prevailing in the respective jurisdictions.
As the Group’s parent company is domiciled and listed in the UK the Group uses the UK corporation tax rate to reconcile its effective tax rate. The tax (credit)/charge for the year can be reconciled to the UK corporation tax rate as follows:
2018 £m
2018 %
2017 £m
2017 %
(Loss)/profit before tax (326.9) 100.0 152.6 100.0
Tax at the UK corporation tax rate of 19% (2017: 20%) (62.1) 19.0 30.5 20.0Recurring items:Non deductible expenditure 2.3 (0.7) 1.4 0.9Non taxable income – – (0.3) (0.2)Tax rates outside of the UK 2.5 (0.8) 26.0 17.0Unrecognised losses 3.2 (1.0) 3.1 2.0Financing deductions – – (5.6) (3.6)Non-recurring items:Unrecognised losses – – 4.6 3.0Goodwill impairment 49.5 (15.1) – –Reduced deferred tax rates on current year temporary differences (0.6) 0.2 0.2 0.1US tax reform (24.6) 7.5 – –Reduction in tax provisions for uncertain tax positions relating to prior years (3.2) 1.0 (20.7) (13.5)Other adjustments in relation to prior years (3.0) 0.9 (2.7) (1.8)
Tax (credit)/charge and effective tax rate for the year (36.0) 11.0 36.5 23.9
The goodwill impairment attracts no tax benefit and the above reconciling item is calculated at the UK tax rate of 19%.
During the year the US Tax Cuts and Jobs Act which included a reduction in the federal corporate income tax rate from 35% to 21% was enacted. As a result of the US tax law changes the brought forward deferred tax balances were remeasured leading to a net tax credit of £24.6m in the income statement and charges to other comprehensive income of £20.4m in respect of pensions and £1.4m in respect of cash flow hedges.
The Group recognises provisions for transactions and events in its open tax returns and its ongoing tax audits whose treatment for tax purposes is uncertain, in respect of multiple years. These uncertainties exist due to differing interpretations of local tax laws and decisions by tax authorities. When calculating the carrying amounts management make assumptions relating to the estimated tax which could be payable. The Group maintains engagement with tax authorities and engagement with peer groups that may have similar issues. We engage advisers to obtain opinion on tax legislation and we monitor proposed changes in legislation.
The reduction in tax provisions for uncertain tax positions relating to prior years reduces the deferred tax provision and arises from the closure of earlier tax years due to the passage of time. Should certain tax returns be closed from the passage of time in the next financial year then the amount required to be provided in deferred tax could reduce by up to £5m.
Future years’ tax charges would be impacted if the final liability for currently open years is different from the amount currently provided for. The future tax charge may also be affected by the levels and mix of profits in the countries in which we operate including differing foreign exchange rates that apply to those profits. Changes to the prevailing tax rates and tax rules in any of the countries in which we operate may also impact future tax charges. At the balance sheet date the change to reduce the UK corporation tax rate to 17% from 1 April 2020 has been enacted.
In addition to the amount charged/(credited) to the income statement, deferred tax relating to actuarial (gains)/losses on defined benefit pension schemes £6.2m (2017: £(7.3)m) and cash flow and net investment hedges £9.3m (2017: £19.0m). These charges and those in relation to the US Tax Cuts and Job Act of £21.8m amount to a total charge of £37.3m (2017: £11.7m) recognised in other comprehensive income.
FirstGroup Annual Report and Accounts 2018 119
Financial statements
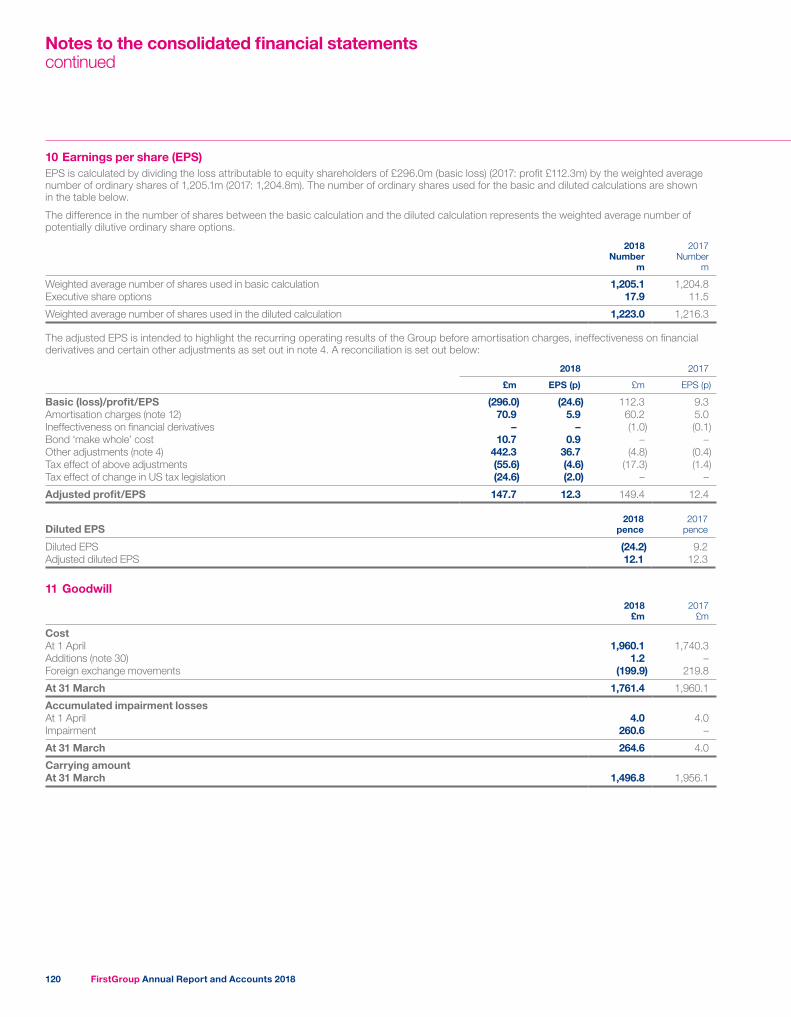
10 Earnings per share (EPS)EPS is calculated by dividing the loss attributable to equity shareholders of £296.0m (basic loss) (2017: profit £112.3m) by the weighted average number of ordinary shares of 1,205.1m (2017: 1,204.8m). The number of ordinary shares used for the basic and diluted calculations are shown in the table below.
The difference in the number of shares between the basic calculation and the diluted calculation represents the weighted average number of potentially dilutive ordinary share options.
2018 Number
m
2017 Number
m
Weighted average number of shares used in basic calculation 1,205.1 1,204.8Executive share options 17.9 11.5
Weighted average number of shares used in the diluted calculation 1,223.0 1,216.3
The adjusted EPS is intended to highlight the recurring operating results of the Group before amortisation charges, ineffectiveness on financial derivatives and certain other adjustments as set out in note 4. A reconciliation is set out below:
2018 2017
£m EPS (p) £m EPS (p)
Basic (loss)/profit/EPS (296.0) (24.6) 112.3 9.3Amortisation charges (note 12) 70.9 5.9 60.2 5.0Ineffectiveness on financial derivatives – – (1.0) (0.1)Bond ‘make whole’ cost 10.7 0.9 – –Other adjustments (note 4) 442.3 36.7 (4.8) (0.4)Tax effect of above adjustments (55.6) (4.6) (17.3) (1.4)Tax effect of change in US tax legislation (24.6) (2.0) – –
Adjusted profit/EPS 147.7 12.3 149.4 12.4
Diluted EPS2018
pence2017
pence
Diluted EPS (24.2) 9.2Adjusted diluted EPS 12.1 12.3
11 Goodwill2018
£m2017
£m
Cost At 1 April 1,960.1 1,740.3Additions (note 30) 1.2 –Foreign exchange movements (199.9) 219.8
At 31 March 1,761.4 1,960.1
Accumulated impairment lossesAt 1 April 4.0 4.0Impairment 260.6 –
At 31 March 264.6 4.0
Carrying amountAt 31 March 1,496.8 1,956.1
Notes to the consolidated financial statementscontinued
FirstGroup Annual Report and Accounts 2018120
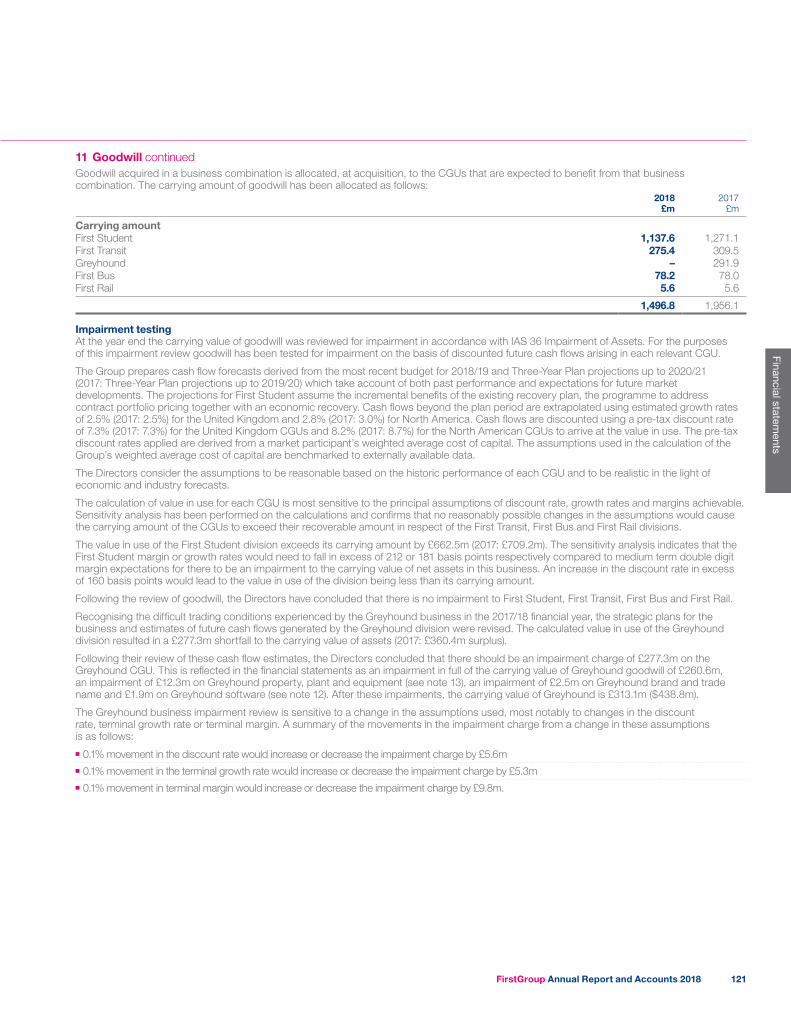
11 Goodwill continuedGoodwill acquired in a business combination is allocated, at acquisition, to the CGUs that are expected to benefit from that business combination. The carrying amount of goodwill has been allocated as follows:
2018 £m
2017 £m
Carrying amount First Student 1,137.6 1,271.1First Transit 275.4 309.5Greyhound – 291.9First Bus 78.2 78.0First Rail 5.6 5.6
1,496.8 1,956.1
Impairment testing At the year end the carrying value of goodwill was reviewed for impairment in accordance with IAS 36 Impairment of Assets. For the purposes of this impairment review goodwill has been tested for impairment on the basis of discounted future cash flows arising in each relevant CGU.
The Group prepares cash flow forecasts derived from the most recent budget for 2018/19 and Three-Year Plan projections up to 2020/21 (2017: Three-Year Plan projections up to 2019/20) which take account of both past performance and expectations for future market developments. The projections for First Student assume the incremental benefits of the existing recovery plan, the programme to address contract portfolio pricing together with an economic recovery. Cash flows beyond the plan period are extrapolated using estimated growth rates of 2.5% (2017: 2.5%) for the United Kingdom and 2.8% (2017: 3.0%) for North America. Cash flows are discounted using a pre-tax discount rate of 7.3% (2017: 7.3%) for the United Kingdom CGUs and 8.2% (2017: 8.7%) for the North American CGUs to arrive at the value in use. The pre-tax discount rates applied are derived from a market participant’s weighted average cost of capital. The assumptions used in the calculation of the Group’s weighted average cost of capital are benchmarked to externally available data.
The Directors consider the assumptions to be reasonable based on the historic performance of each CGU and to be realistic in the light of economic and industry forecasts.
The calculation of value in use for each CGU is most sensitive to the principal assumptions of discount rate, growth rates and margins achievable. Sensitivity analysis has been performed on the calculations and confirms that no reasonably possible changes in the assumptions would cause the carrying amount of the CGUs to exceed their recoverable amount in respect of the First Transit, First Bus and First Rail divisions.
The value in use of the First Student division exceeds its carrying amount by £662.5m (2017: £709.2m). The sensitivity analysis indicates that the First Student margin or growth rates would need to fall in excess of 212 or 181 basis points respectively compared to medium term double digit margin expectations for there to be an impairment to the carrying value of net assets in this business. An increase in the discount rate in excess of 160 basis points would lead to the value in use of the division being less than its carrying amount.
Following the review of goodwill, the Directors have concluded that there is no impairment to First Student, First Transit, First Bus and First Rail.
Recognising the difficult trading conditions experienced by the Greyhound business in the 2017/18 financial year, the strategic plans for the business and estimates of future cash flows generated by the Greyhound division were revised. The calculated value in use of the Greyhound division resulted in a £277.3m shortfall to the carrying value of assets (2017: £360.4m surplus).
Following their review of these cash flow estimates, the Directors concluded that there should be an impairment charge of £277.3m on the Greyhound CGU. This is reflected in the financial statements as an impairment in full of the carrying value of Greyhound goodwill of £260.6m, an impairment of £12.3m on Greyhound property, plant and equipment (see note 13), an impairment of £2.5m on Greyhound brand and trade name and £1.9m on Greyhound software (see note 12). After these impairments, the carrying value of Greyhound is £313.1m ($438.8m).
The Greyhound business impairment review is sensitive to a change in the assumptions used, most notably to changes in the discount rate, terminal growth rate or terminal margin. A summary of the movements in the impairment charge from a change in these assumptions is as follows:
■■ 0.1% movement in the discount rate would increase or decrease the impairment charge by £5.6m■■ 0.1% movement in the terminal growth rate would increase or decrease the impairment charge by £5.3m■■ 0.1% movement in terminal margin would increase or decrease the impairment charge by £9.8m.
FirstGroup Annual Report and Accounts 2018 121
Financial statements
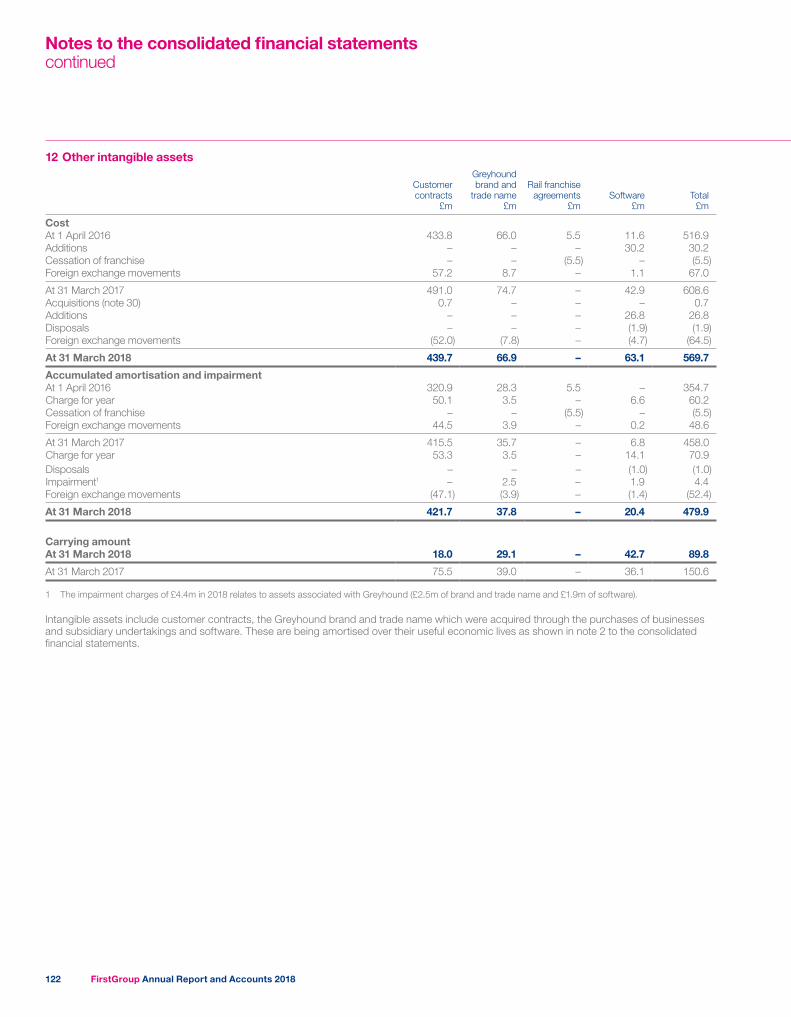
12 Other intangible assets
Customer contracts
£m
Greyhound brand and
trade name £m
Rail franchise agreements
£mSoftware
£mTotal
£m
CostAt 1 April 2016 433.8 66.0 5.5 11.6 516.9Additions – – – 30.2 30.2Cessation of franchise – – (5.5) – (5.5)Foreign exchange movements 57.2 8.7 – 1.1 67.0
At 31 March 2017 491.0 74.7 – 42.9 608.6Acquisitions (note 30) 0.7 – – – 0.7Additions – – – 26.8 26.8Disposals – – – (1.9) (1.9)Foreign exchange movements (52.0) (7.8) – (4.7) (64.5)
At 31 March 2018 439.7 66.9 – 63.1 569.7
Accumulated amortisation and impairmentAt 1 April 2016 320.9 28.3 5.5 – 354.7Charge for year 50.1 3.5 – 6.6 60.2Cessation of franchise – – (5.5) – (5.5)Foreign exchange movements 44.5 3.9 – 0.2 48.6
At 31 March 2017 415.5 35.7 – 6.8 458.0Charge for year 53.3 3.5 – 14.1 70.9Disposals – – – (1.0) (1.0)Impairment1 – 2.5 – 1.9 4.4Foreign exchange movements (47.1) (3.9) – (1.4) (52.4)
At 31 March 2018 421.7 37.8 – 20.4 479.9
Carrying amountAt 31 March 2018 18.0 29.1 – 42.7 89.8
At 31 March 2017 75.5 39.0 – 36.1 150.6
1 The impairment charges of £4.4m in 2018 relates to assets associated with Greyhound (£2.5m of brand and trade name and £1.9m of software).
Intangible assets include customer contracts, the Greyhound brand and trade name which were acquired through the purchases of businesses and subsidiary undertakings and software. These are being amortised over their useful economic lives as shown in note 2 to the consolidated financial statements.
Notes to the consolidated financial statementscontinued
FirstGroup Annual Report and Accounts 2018122
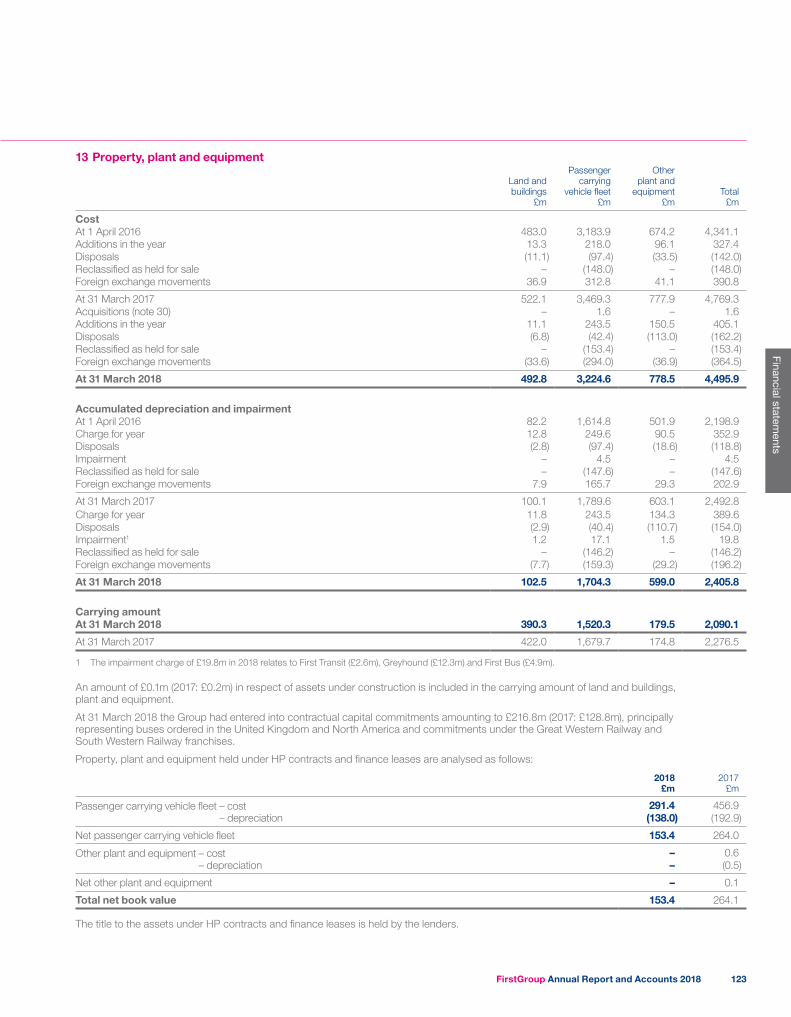
13 Property, plant and equipment
Land and buildings
£m
Passenger carrying
vehicle fleet £m
Other plant and
equipment £m
Total £m
CostAt 1 April 2016 483.0 3,183.9 674.2 4,341.1Additions in the year 13.3 218.0 96.1 327.4Disposals (11.1) (97.4) (33.5) (142.0)Reclassified as held for sale – (148.0) – (148.0)Foreign exchange movements 36.9 312.8 41.1 390.8
At 31 March 2017 522.1 3,469.3 777.9 4,769.3Acquisitions (note 30) – 1.6 – 1.6Additions in the year 11.1 243.5 150.5 405.1Disposals (6.8) (42.4) (113.0) (162.2)Reclassified as held for sale – (153.4) – (153.4)Foreign exchange movements (33.6) (294.0) (36.9) (364.5)
At 31 March 2018 492.8 3,224.6 778.5 4,495.9
Accumulated depreciation and impairmentAt 1 April 2016 82.2 1,614.8 501.9 2,198.9Charge for year 12.8 249.6 90.5 352.9Disposals (2.8) (97.4) (18.6) (118.8)Impairment – 4.5 – 4.5Reclassified as held for sale – (147.6) – (147.6)Foreign exchange movements 7.9 165.7 29.3 202.9
At 31 March 2017 100.1 1,789.6 603.1 2,492.8Charge for year 11.8 243.5 134.3 389.6Disposals (2.9) (40.4) (110.7) (154.0)Impairment1 1.2 17.1 1.5 19.8Reclassified as held for sale – (146.2) – (146.2)Foreign exchange movements (7.7) (159.3) (29.2) (196.2)
At 31 March 2018 102.5 1,704.3 599.0 2,405.8
Carrying amountAt 31 March 2018 390.3 1,520.3 179.5 2,090.1
At 31 March 2017 422.0 1,679.7 174.8 2,276.5
1 The impairment charge of £19.8m in 2018 relates to First Transit (£2.6m), Greyhound (£12.3m) and First Bus (£4.9m).
An amount of £0.1m (2017: £0.2m) in respect of assets under construction is included in the carrying amount of land and buildings, plant and equipment.
At 31 March 2018 the Group had entered into contractual capital commitments amounting to £216.8m (2017: £128.8m), principally representing buses ordered in the United Kingdom and North America and commitments under the Great Western Railway and South Western Railway franchises.
Property, plant and equipment held under HP contracts and finance leases are analysed as follows:
2018 £m
2017 £m
Passenger carrying vehicle fleet – cost – depreciation
291.4 456.9(138.0) (192.9)
Net passenger carrying vehicle fleet 153.4 264.0
Other plant and equipment – cost – depreciation
– 0.6– (0.5)
Net other plant and equipment – 0.1
Total net book value 153.4 264.1
The title to the assets under HP contracts and finance leases is held by the lenders.
FirstGroup Annual Report and Accounts 2018 123
Financial statements
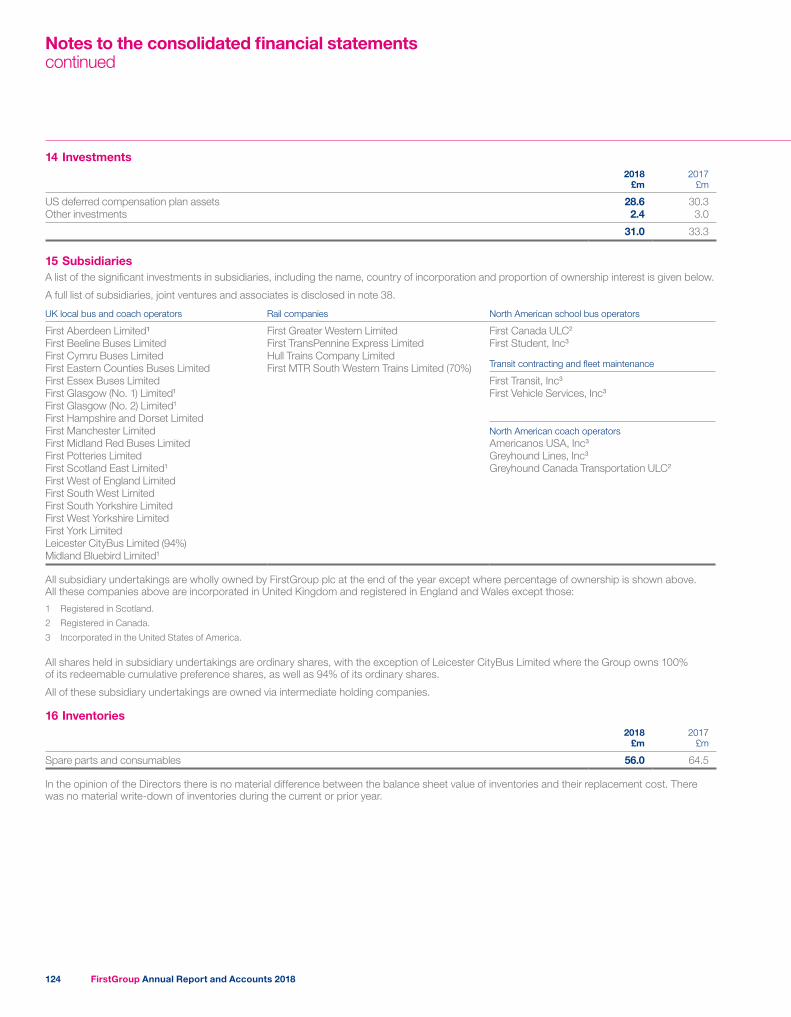
14 Investments2018
£m2017
£m
US deferred compensation plan assets 28.6 30.3Other investments 2.4 3.0
31.0 33.3
15 SubsidiariesA list of the significant investments in subsidiaries, including the name, country of incorporation and proportion of ownership interest is given below.
A full list of subsidiaries, joint ventures and associates is disclosed in note 38.
UK local bus and coach operators Rail companies North American school bus operators
First Aberdeen Limited¹ First Greater Western Limited First Canada ULC2
First Beeline Buses Limited First TransPennine Express Limited First Student, Inc3
First Cymru Buses Limited Hull Trains Company LimitedFirst Eastern Counties Buses Limited First MTR South Western Trains Limited (70%) Transit contracting and fleet maintenance
First Essex Buses Limited First Transit, Inc3
First Glasgow (No. 1) Limited1 First Vehicle Services, Inc3
First Glasgow (No. 2) Limited1
First Hampshire and Dorset LimitedFirst Manchester Limited North American coach operatorsFirst Midland Red Buses Limited Americanos USA, Inc3
First Potteries Limited Greyhound Lines, Inc3
First Scotland East Limited1 Greyhound Canada Transportation ULC2
First West of England LimitedFirst South West LimitedFirst South Yorkshire LimitedFirst West Yorkshire LimitedFirst York LimitedLeicester CityBus Limited (94%)Midland Bluebird Limited1
All subsidiary undertakings are wholly owned by FirstGroup plc at the end of the year except where percentage of ownership is shown above. All these companies above are incorporated in United Kingdom and registered in England and Wales except those:
1 Registered in Scotland.
2 Registered in Canada.
3 Incorporated in the United States of America.
All shares held in subsidiary undertakings are ordinary shares, with the exception of Leicester CityBus Limited where the Group owns 100% of its redeemable cumulative preference shares, as well as 94% of its ordinary shares.
All of these subsidiary undertakings are owned via intermediate holding companies.
16 Inventories2018
£m2017
£m
Spare parts and consumables 56.0 64.5
In the opinion of the Directors there is no material difference between the balance sheet value of inventories and their replacement cost. There was no material write-down of inventories during the current or prior year.
Notes to the consolidated financial statementscontinued
FirstGroup Annual Report and Accounts 2018124
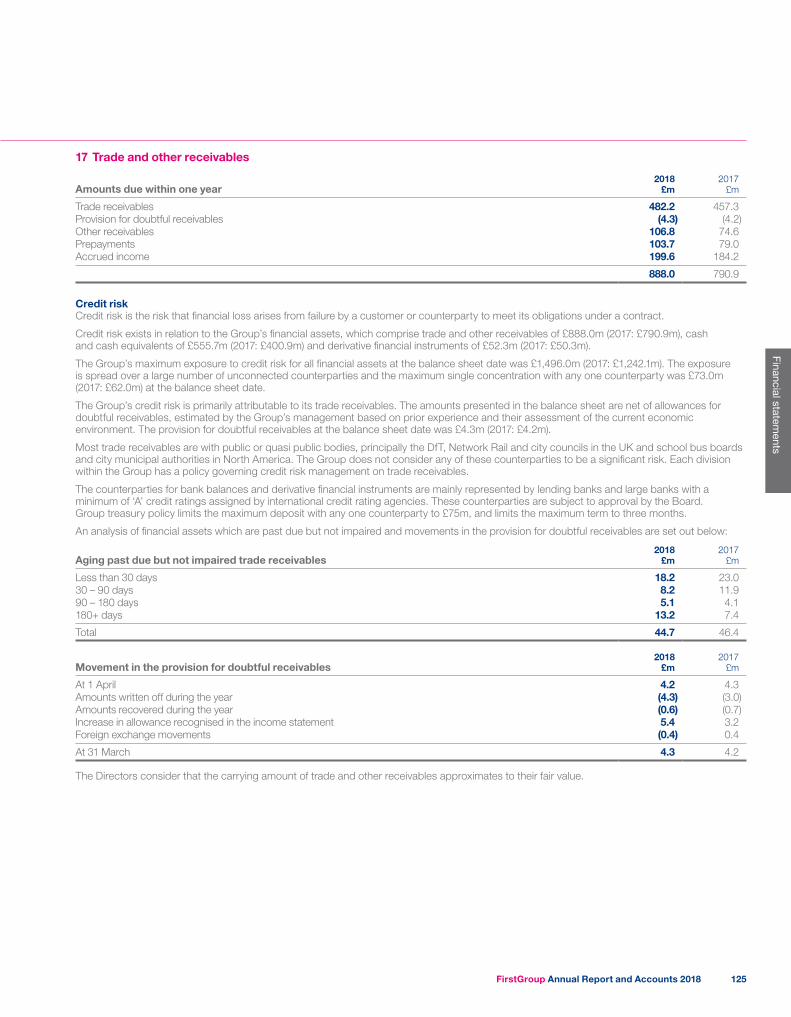
17 Trade and other receivables
Amounts due within one year2018
£m2017
£m
Trade receivables 482.2 457.3Provision for doubtful receivables (4.3) (4.2)Other receivables 106.8 74.6Prepayments 103.7 79.0Accrued income 199.6 184.2
888.0 790.9
Credit riskCredit risk is the risk that financial loss arises from failure by a customer or counterparty to meet its obligations under a contract.
Credit risk exists in relation to the Group’s financial assets, which comprise trade and other receivables of £888.0m (2017: £790.9m), cash and cash equivalents of £555.7m (2017: £400.9m) and derivative financial instruments of £52.3m (2017: £50.3m).
The Group’s maximum exposure to credit risk for all financial assets at the balance sheet date was £1,496.0m (2017: £1,242.1m). The exposure is spread over a large number of unconnected counterparties and the maximum single concentration with any one counterparty was £73.0m (2017: £62.0m) at the balance sheet date.
The Group’s credit risk is primarily attributable to its trade receivables. The amounts presented in the balance sheet are net of allowances for doubtful receivables, estimated by the Group’s management based on prior experience and their assessment of the current economic environment. The provision for doubtful receivables at the balance sheet date was £4.3m (2017: £4.2m).
Most trade receivables are with public or quasi public bodies, principally the DfT, Network Rail and city councils in the UK and school bus boards and city municipal authorities in North America. The Group does not consider any of these counterparties to be a significant risk. Each division within the Group has a policy governing credit risk management on trade receivables.
The counterparties for bank balances and derivative financial instruments are mainly represented by lending banks and large banks with a minimum of ‘A’ credit ratings assigned by international credit rating agencies. These counterparties are subject to approval by the Board. Group treasury policy limits the maximum deposit with any one counterparty to £75m, and limits the maximum term to three months.
An analysis of financial assets which are past due but not impaired and movements in the provision for doubtful receivables are set out below:
Aging past due but not impaired trade receivables2018 £m
2017 £m
Less than 30 days 18.2 23.030 – 90 days 8.2 11.990 – 180 days 5.1 4.1180+ days 13.2 7.4
Total 44.7 46.4
Movement in the provision for doubtful receivables2018 £m
2017 £m
At 1 April 4.2 4.3Amounts written off during the year (4.3) (3.0)Amounts recovered during the year (0.6) (0.7)Increase in allowance recognised in the income statement 5.4 3.2Foreign exchange movements (0.4) 0.4
At 31 March 4.3 4.2
The Directors consider that the carrying amount of trade and other receivables approximates to their fair value.
FirstGroup Annual Report and Accounts 2018 125
Financial statements
18 Assets held for sale2018
£m2017
£m
Assets held for sale 0.9 2.9
The balances primarily relate to First Student yellow school buses which are surplus to requirements and are being actively marketed on the internet. Gains or losses arising on the disposal of such assets are included in arriving at operating profit in the income statement. The Group expects to sell such yellow school buses within 12 months of them going onto the ‘for sale’ list. The value at each balance sheet date represents management’s best estimate of their resale value less cost of disposal. There are no liabilities associated with these held for sale assets at the balance sheet date.
Movement in assets held for sale £m
At 1 April 2017 2.9Net book value of additions 7.2Net book value of disposals (9.0)Foreign exchange movements (0.2)
At 31 March 2018 0.9
19 Trade and other payables
Amounts falling due within one year2018
£m2017
£m
Trade payables 248.8 255.6Other payables 230.2 217.6Accruals 785.6 607.3Deferred income 83.6 49.7Season ticket deferred income 89.2 25.1
1,437.4 1,155.3
Trade payables and accruals principally comprise amounts outstanding for trade purchases and ongoing costs. Also included within accruals are provisions of £203.7m (2017: £169.6m) as disclosed in note 26.
The average credit period taken for trade purchases is 29 days (2017: 32 days). The Group has controls in place to ensure that all payments are paid within the appropriate credit timeframe.
The Directors consider that the carrying amount of trade and other payables approximates to their fair value.
20 Cash and cash equivalents2018
£m2017
£m
Cash and cash equivalents 555.7 400.9
The fair value of cash and cash equivalents approximates to the carrying value. Cash and cash equivalents includes ring-fenced cash of £392.3m (2017: £259.8m). The most significant ring-fenced cash balances are held by the Group’s First Rail subsidiaries. Under the terms of the rail franchise agreements, cash can only be distributed by these subsidiaries up to the lower of the amount of their retained profits or the amount determined by prescribed liquidity ratios. The ring-fenced cash represents cash which is not available for distribution and any additional amounts required to satisfy the liquidity ratios at the balance sheet date. Ring-fenced cash balances of £0.8m (2017: £4.0m) are held outside the First Rail subsidiaries.
Notes to the consolidated financial statementscontinued
FirstGroup Annual Report and Accounts 2018126
21 Borrowings2018
£m2017
£m
On demand or within 1 yearFinance leases (note 22) 47.1 65.3Senior unsecured loan notes – 80.0Bond 8.125% (repayable 2018)1 – 12.9Bond 6.125% (repayable 2019) 261.3 3.0Bond 8.75% (repayable 2021)1 30.1 30.2Bond 5.25% (repayable 2022)1 5.8 5.8Bond 6.875% (repayable 2024)1 7.2 7.2
Total current liabilities 351.5 204.4
Within 1-2 yearsFinance leases (note 22) 39.5 53.5Loan notes (note 23) 9.5 9.5Bond 8.125% (repayable 2018) – 298.8Bond 6.125% (repayable 2019) – 270.0
49.0 631.8
Within 2-5 yearsSyndicated loan facilities 197.0 –Finance leases (note 22) 18.0 64.8Bond 8.75% (repayable 2021) 358.9 369.0Bond 5.25% (repayable 2022) 321.6 –
895.5 433.8
Over 5 yearsFinance leases (note 22) 0.1 0.1Senior unsecured loan notes 195.2 –Bond 5.25% (repayable 2022) – 321.1Bond 6.875% (repayable 2024) 199.8 199.6
395.1 520.8
Total non-current liabilities at amortised cost 1,339.6 1,586.4
1 Relates to accrued interest.
Fair value of bonds and senior unsecured loan notes issued
Par value £m
Interest payable Month
2018 Fair value
£m
2017 Fair value
£m
Bond 8.125% (repayable 2018) 300.0 Annually September – 342.6Bond 6.125% (repayable 2019) 250.0 Annually January 262.2 274.1Bond 8.75% (repayable 2021) 350.0 Annually April 448.0 474.1Bond 5.25% (repayable 2022) 325.0 Annually November 373.4 384.9Bond 6.875% (repayable 2024) 200.0 Annually September 255.2 266.4
$m £m £m
Senior unsecured loan notes 275.0 Semi-annually March & September 194.8 –Senior unsecured loan notes – Semi-annually April & October – 82.0
(2017: $100m)
The fair value of the bonds and senior unsecured loan notes are inclusive of accrued interest. The fair values are calculated by discounting the future cash flow that will arise under the contracts.
FirstGroup Annual Report and Accounts 2018 127
Financial statements
21 Borrowings continuedEffective interest ratesThe effective interest rates at the balance sheet dates were as follows:
2018 Maturity 2017 Maturity
Bank overdraft LIBOR + 1% – LIBOR + 1% –Bank borrowings LIBOR + 0.5% July 2021 LIBOR + 0.6% July 2021Bond 2018 – – 8.32% September 2018Bond 20191 6.18% January 2019 6.18% January 2019Bond 20211 8.87% April 2021 8.87% April 2021Bond 2022 5.49% November 2022 5.49% November 2022Bond 2024 6.95% September 2024 6.95% September 2024Senior unsecured loan notes 4.37% March 2025 / March 2028 4.39% October 2017
HP contracts and finance leasesLIBOR + 0.6% up to
average fixed rate of 4.2% VariousLIBOR + 0.6% up to
average fixed rate of 4.2% Various
Loan notesLIBOR + 1.0% up to
total fixed rate of 11.0% VariousLIBOR + 1.0% up to
total fixed rate of 11.0% Various
1 The 2019 and 2021 bonds have been swapped to floating rates and hence have a lower effective rate net of these swaps.
Carrying amount of gross borrowings by currency2018
£m2017
£m
Pounds Sterling 1,392.4 1,541.5US Dollar 291.7 239.2Canadian Dollar 7.0 10.1
1,691.1 1,790.8
Borrowing facilitiesThe Group had £603.0m (2017: £800.0m) of undrawn committed borrowing facilities as at year end. Total bank borrowing facilities at year end stood at £815.7m (2017: £816.4m) of which £800.0m (2017: £800.0m) was committed and £15.7m (2017: £16.4m) was uncommitted.
Capital managementWe aim to maintain an investment grade credit rating and appropriate balance sheet liquidity headroom. The Group has net debt:EBITDA of 1.5 times as at March 2018 (2017: 1.9 times).
Liquidity within the Group has remained strong. At year end there was £766.4m (2017: £941.1m) of committed headroom and free cash. Largely due to seasonality in the North American school bus business, committed headroom typically reduces during the financial year up to October and increases thereafter. The Group’s Treasury policy requires a minimum of £150m of committed headroom at all times.
The Group’s net debt, excluding accrued bond interest at 31 March 2018, was £1,070.3m (2017: £1,289.9m) as set out on page 43 of the Financial review.
Notes to the consolidated financial statementscontinued
FirstGroup Annual Report and Accounts 2018128
22 HP contracts and finance leasesThe Group had the following obligations under HP contracts and finance leases as at the balance sheet dates:
2018 Minimum payments
£m
2018 Present value of
payments £m
2017 Minimum
payments £m
2017 Present value of
payments £m
Due in less than one year 48.3 47.1 66.9 65.3Due in more than one year but not more than two years 41.6 39.5 56.4 53.5Due in more than two years but not more than five years 19.6 18.0 70.2 64.8Due in more than five years 0.1 0.1 0.1 0.1
109.6 104.7 193.6 183.7Less future financing charges (4.9) – (9.9) –
104.7 104.7 183.7 183.7
HP lease obligationsPounds Sterling denominated fixed rate leases 2018 2017
Pounds Sterling fixed rate leases £1.2m £11.1mAverage remaining lives 1 years 2 yearsEffective borrowing rate 3.68% 2.96%
US Dollar denominated fixed rate leases 2018 2017
US Dollar fixed rate leases £96.5m £159.2mAverage remaining lives 2 years 2 yearsEffective borrowing rate 2.50% 2.57%
Canadian Dollar denominated fixed rate leases 2018 2017
Canadian Dollar fixed rate leases £7.0m £10.1mAverage remaining lives 2 years 2 yearsEffective borrowing rate 4.27% 4.13%
The Group considers there to be no material difference between the fair values of the Pounds Sterling and Canadian Dollar finance leases and the carrying amount in the balance sheet. The US Dollar finance leases have a fair value of £99.1m (2017: £156.8m). The fair value is calculated by discounting future cash flows that will arise under the lease agreements.
23 Loan notesThe Group had the following loan notes issued as at the balance sheet dates:
2018 £m
2017 £m
Due in more than one year but not more than two years 9.5 9.5
The loan notes have been classified by reference to the earliest date on which the loan note holder can request redemption. Loan notes of £8.7m (2017: £8.7m) are supported by unsecured bank guarantees.
The loan notes have an average effective borrowing rate of 10.1% (2017: 10.1%) and an average remaining term of 3 years (2017: 4 years) assuming that the holders do not request redemption. The fair value of the loan notes has been determined to be £11.2m (2017: £12.3m). This has been calculated by discounting future cash flows that will arise under the loan notes.
FirstGroup Annual Report and Accounts 2018 129
Financial statements
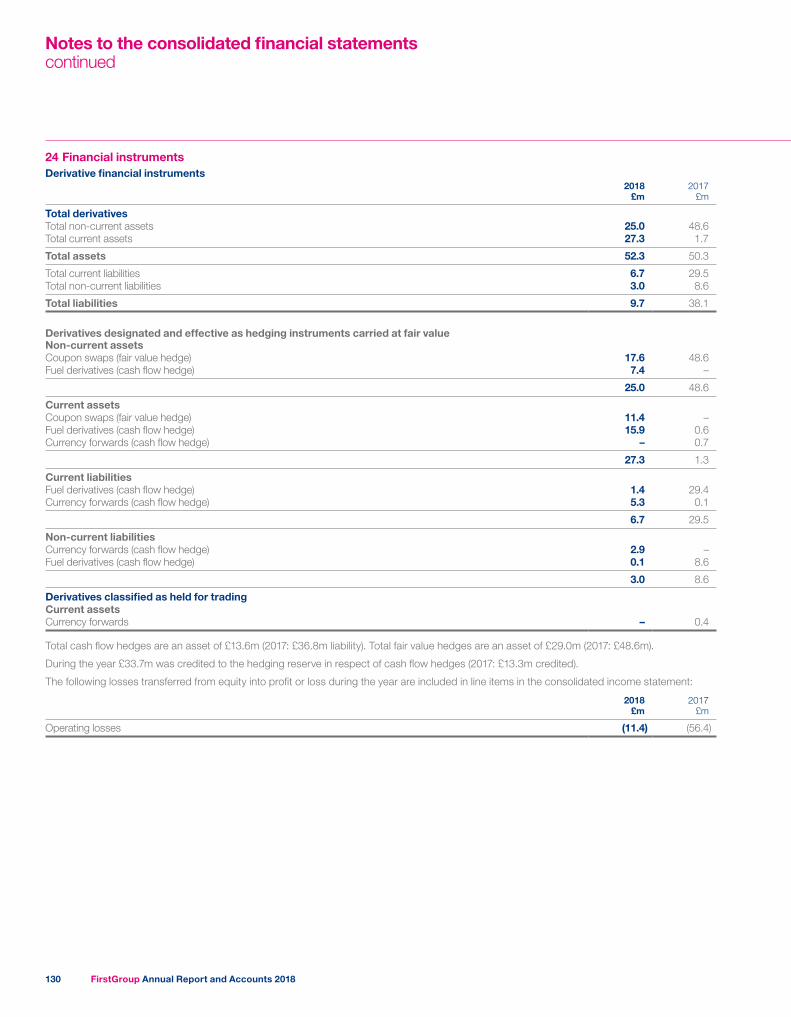
24 Financial instrumentsDerivative financial instruments
2018 £m
2017 £m
Total derivativesTotal non-current assets 25.0 48.6Total current assets 27.3 1.7
Total assets 52.3 50.3
Total current liabilities 6.7 29.5Total non-current liabilities 3.0 8.6
Total liabilities 9.7 38.1
Derivatives designated and effective as hedging instruments carried at fair valueNon-current assetsCoupon swaps (fair value hedge) 17.6 48.6Fuel derivatives (cash flow hedge) 7.4 –
25.0 48.6
Current assetsCoupon swaps (fair value hedge) 11.4 –Fuel derivatives (cash flow hedge) 15.9 0.6Currency forwards (cash flow hedge) – 0.7
27.3 1.3
Current liabilitiesFuel derivatives (cash flow hedge) 1.4 29.4Currency forwards (cash flow hedge) 5.3 0.1
6.7 29.5
Non-current liabilitiesCurrency forwards (cash flow hedge) 2.9 –Fuel derivatives (cash flow hedge) 0.1 8.6
3.0 8.6
Derivatives classified as held for tradingCurrent assetsCurrency forwards – 0.4
Total cash flow hedges are an asset of £13.6m (2017: £36.8m liability). Total fair value hedges are an asset of £29.0m (2017: £48.6m).
During the year £33.7m was credited to the hedging reserve in respect of cash flow hedges (2017: £13.3m credited).
The following losses transferred from equity into profit or loss during the year are included in line items in the consolidated income statement:
2018 £m
2017 £m
Operating losses (11.4) (56.4)
Notes to the consolidated financial statementscontinued
FirstGroup Annual Report and Accounts 2018130
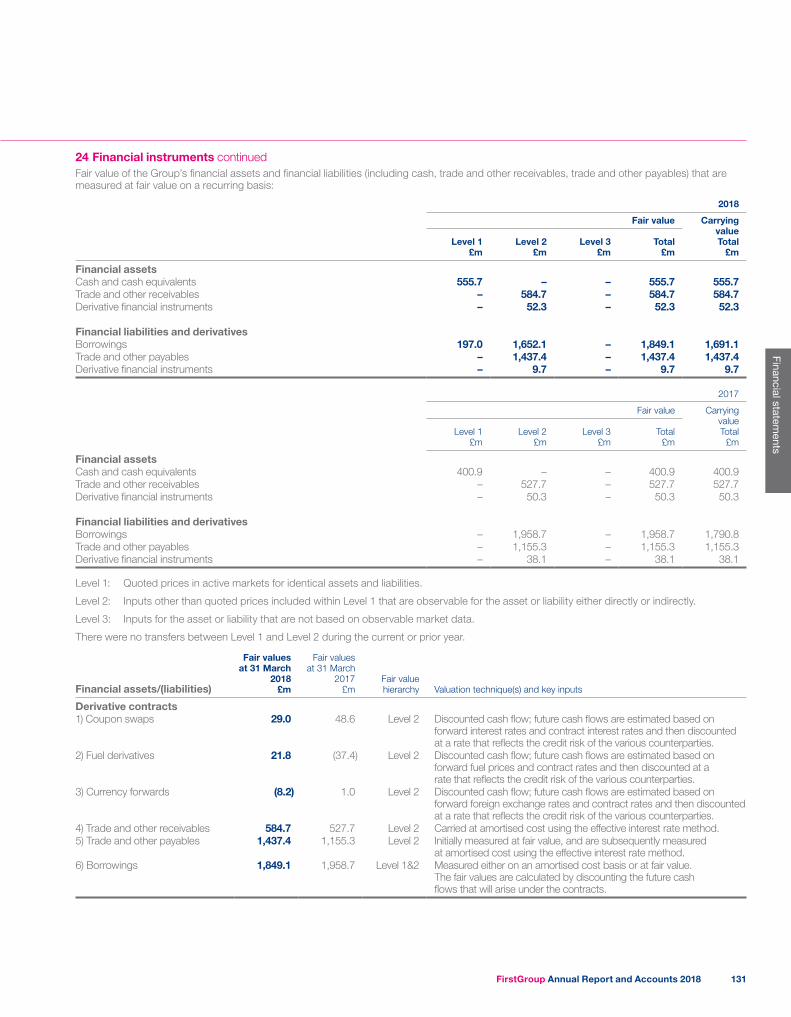
24 Financial instruments continuedFair value of the Group’s financial assets and financial liabilities (including cash, trade and other receivables, trade and other payables) that are measured at fair value on a recurring basis:
2018
Fair value Carrying valueTotal
£mLevel 1
£mLevel 2
£mLevel 3
£mTotal
£m
Financial assetsCash and cash equivalents 555.7 – – 555.7 555.7Trade and other receivables – 584.7 – 584.7 584.7Derivative financial instruments – 52.3 – 52.3 52.3
Financial liabilities and derivativesBorrowings 197.0 1,652.1 – 1,849.1 1,691.1Trade and other payables – 1,437.4 – 1,437.4 1,437.4Derivative financial instruments – 9.7 – 9.7 9.7
2017
Fair value Carrying valueTotal
£mLevel 1
£mLevel 2
£mLevel 3
£mTotal
£m
Financial assetsCash and cash equivalents 400.9 – – 400.9 400.9Trade and other receivables – 527.7 – 527.7 527.7Derivative financial instruments – 50.3 – 50.3 50.3
Financial liabilities and derivativesBorrowings – 1,958.7 – 1,958.7 1,790.8Trade and other payables – 1,155.3 – 1,155.3 1,155.3Derivative financial instruments – 38.1 – 38.1 38.1
Level 1: Quoted prices in active markets for identical assets and liabilities.
Level 2: Inputs other than quoted prices included within Level 1 that are observable for the asset or liability either directly or indirectly.
Level 3: Inputs for the asset or liability that are not based on observable market data.
There were no transfers between Level 1 and Level 2 during the current or prior year.
Financial assets/(liabilities)
Fair values at 31 March
2018 £m
Fair values at 31 March
2017 £m
Fair value hierarchy Valuation technique(s) and key inputs
Derivative contracts1) Coupon swaps 29.0 48.6 Level 2 Discounted cash flow; future cash flows are estimated based on
forward interest rates and contract interest rates and then discounted at a rate that reflects the credit risk of the various counterparties.
2) Fuel derivatives 21.8 (37.4) Level 2 Discounted cash flow; future cash flows are estimated based on forward fuel prices and contract rates and then discounted at a rate that reflects the credit risk of the various counterparties.
3) Currency forwards (8.2) 1.0 Level 2 Discounted cash flow; future cash flows are estimated based on forward foreign exchange rates and contract rates and then discounted at a rate that reflects the credit risk of the various counterparties.
4) Trade and other receivables 584.7 527.7 Level 2 Carried at amortised cost using the effective interest rate method.5) Trade and other payables 1,437.4 1,155.3 Level 2 Initially measured at fair value, and are subsequently measured
at amortised cost using the effective interest rate method.6) Borrowings 1,849.1 1,958.7 Level 1&2 Measured either on an amortised cost basis or at fair value.
The fair values are calculated by discounting the future cash flows that will arise under the contracts.
FirstGroup Annual Report and Accounts 2018 131
Financial statements
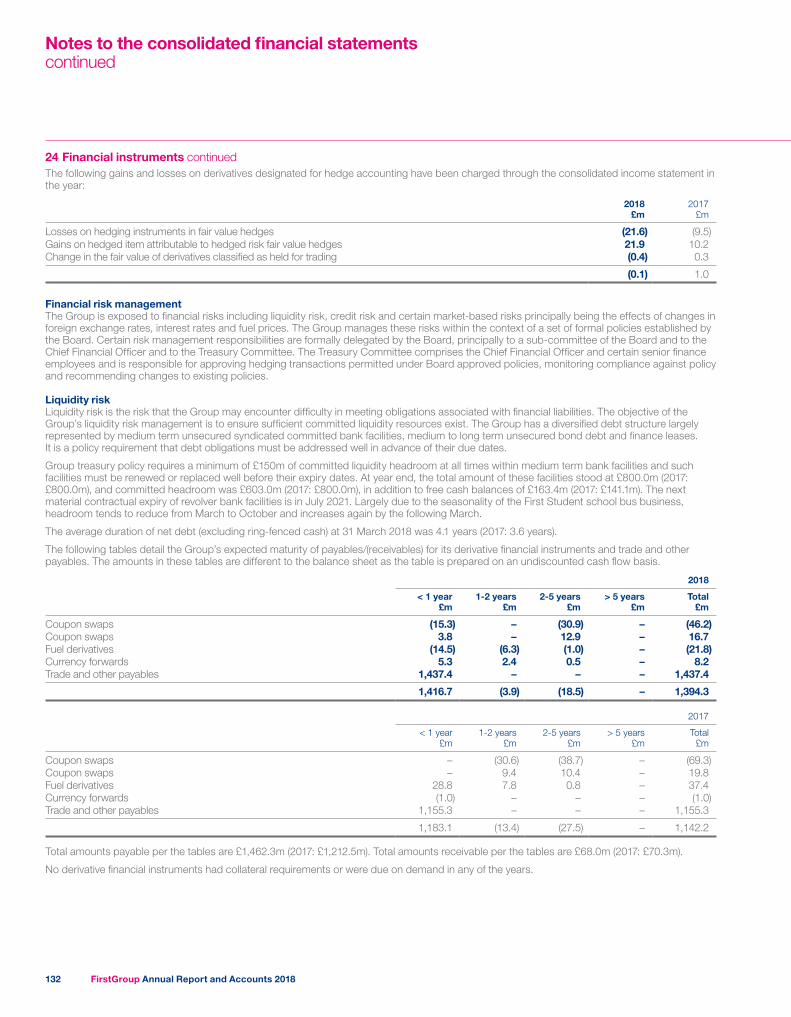
24 Financial instruments continuedThe following gains and losses on derivatives designated for hedge accounting have been charged through the consolidated income statement in the year:
2018 £m
2017 £m
Losses on hedging instruments in fair value hedges (21.6) (9.5)Gains on hedged item attributable to hedged risk fair value hedges 21.9 10.2Change in the fair value of derivatives classified as held for trading (0.4) 0.3
(0.1) 1.0
Financial risk managementThe Group is exposed to financial risks including liquidity risk, credit risk and certain market-based risks principally being the effects of changes in foreign exchange rates, interest rates and fuel prices. The Group manages these risks within the context of a set of formal policies established by the Board. Certain risk management responsibilities are formally delegated by the Board, principally to a sub-committee of the Board and to the Chief Financial Officer and to the Treasury Committee. The Treasury Committee comprises the Chief Financial Officer and certain senior finance employees and is responsible for approving hedging transactions permitted under Board approved policies, monitoring compliance against policy and recommending changes to existing policies.
Liquidity riskLiquidity risk is the risk that the Group may encounter difficulty in meeting obligations associated with financial liabilities. The objective of the Group’s liquidity risk management is to ensure sufficient committed liquidity resources exist. The Group has a diversified debt structure largely represented by medium term unsecured syndicated committed bank facilities, medium to long term unsecured bond debt and finance leases. It is a policy requirement that debt obligations must be addressed well in advance of their due dates.
Group treasury policy requires a minimum of £150m of committed liquidity headroom at all times within medium term bank facilities and such facilities must be renewed or replaced well before their expiry dates. At year end, the total amount of these facilities stood at £800.0m (2017: £800.0m), and committed headroom was £603.0m (2017: £800.0m), in addition to free cash balances of £163.4m (2017: £141.1m). The next material contractual expiry of revolver bank facilities is in July 2021. Largely due to the seasonality of the First Student school bus business, headroom tends to reduce from March to October and increases again by the following March.
The average duration of net debt (excluding ring-fenced cash) at 31 March 2018 was 4.1 years (2017: 3.6 years).
The following tables detail the Group’s expected maturity of payables/(receivables) for its derivative financial instruments and trade and other payables. The amounts in these tables are different to the balance sheet as the table is prepared on an undiscounted cash flow basis.
2018
< 1 year £m
1-2 years £m
2-5 years £m
> 5 years £m
Total £m
Coupon swaps (15.3) – (30.9) – (46.2)Coupon swaps 3.8 – 12.9 – 16.7Fuel derivatives (14.5) (6.3) (1.0) – (21.8)Currency forwards 5.3 2.4 0.5 – 8.2Trade and other payables 1,437.4 – – – 1,437.4
1,416.7 (3.9) (18.5) – 1,394.3
2017
< 1 year £m
1-2 years £m
2-5 years £m
> 5 years £m
Total £m
Coupon swaps – (30.6) (38.7) – (69.3)Coupon swaps – 9.4 10.4 – 19.8Fuel derivatives 28.8 7.8 0.8 – 37.4Currency forwards (1.0) – – – (1.0)Trade and other payables 1,155.3 – – – 1,155.3
1,183.1 (13.4) (27.5) – 1,142.2
Total amounts payable per the tables are £1,462.3m (2017: £1,212.5m). Total amounts receivable per the tables are £68.0m (2017: £70.3m).
No derivative financial instruments had collateral requirements or were due on demand in any of the years.
Notes to the consolidated financial statementscontinued
FirstGroup Annual Report and Accounts 2018132
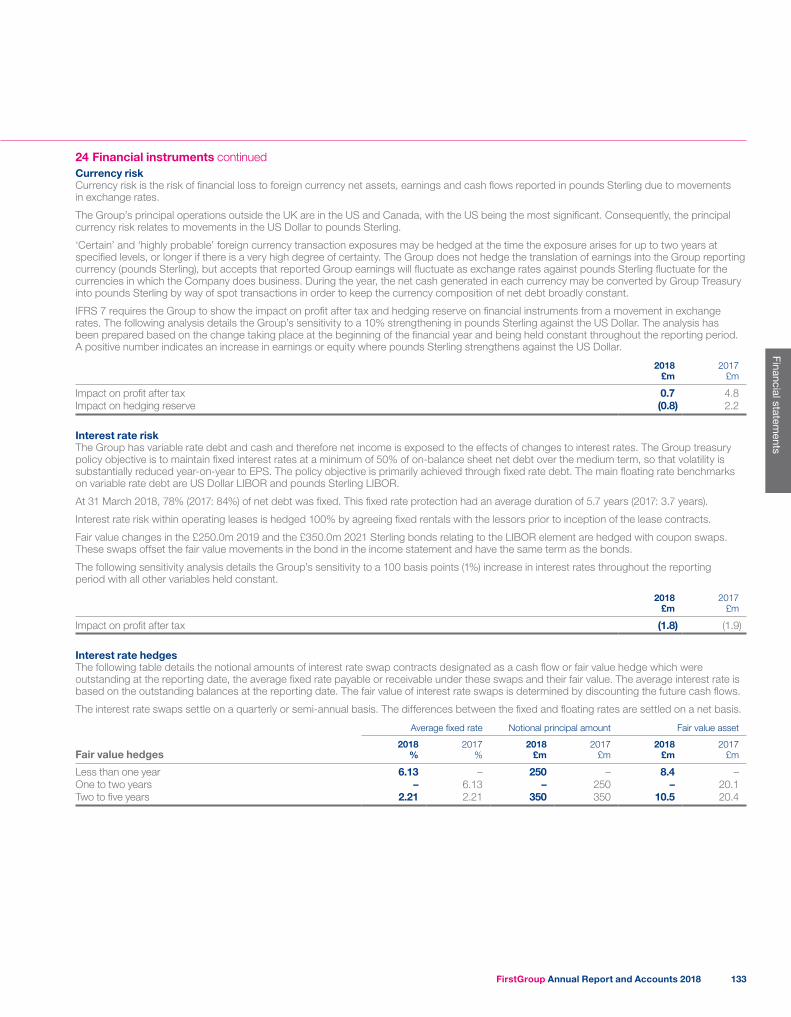
24 Financial instruments continuedCurrency riskCurrency risk is the risk of financial loss to foreign currency net assets, earnings and cash flows reported in pounds Sterling due to movements in exchange rates.
The Group’s principal operations outside the UK are in the US and Canada, with the US being the most significant. Consequently, the principal currency risk relates to movements in the US Dollar to pounds Sterling.
‘Certain’ and ‘highly probable’ foreign currency transaction exposures may be hedged at the time the exposure arises for up to two years at specified levels, or longer if there is a very high degree of certainty. The Group does not hedge the translation of earnings into the Group reporting currency (pounds Sterling), but accepts that reported Group earnings will fluctuate as exchange rates against pounds Sterling fluctuate for the currencies in which the Company does business. During the year, the net cash generated in each currency may be converted by Group Treasury into pounds Sterling by way of spot transactions in order to keep the currency composition of net debt broadly constant.
IFRS 7 requires the Group to show the impact on profit after tax and hedging reserve on financial instruments from a movement in exchange rates. The following analysis details the Group’s sensitivity to a 10% strengthening in pounds Sterling against the US Dollar. The analysis has been prepared based on the change taking place at the beginning of the financial year and being held constant throughout the reporting period. A positive number indicates an increase in earnings or equity where pounds Sterling strengthens against the US Dollar.
2018 £m
2017 £m
Impact on profit after tax 0.7 4.8Impact on hedging reserve (0.8) 2.2
Interest rate riskThe Group has variable rate debt and cash and therefore net income is exposed to the effects of changes to interest rates. The Group treasury policy objective is to maintain fixed interest rates at a minimum of 50% of on-balance sheet net debt over the medium term, so that volatility is substantially reduced year-on-year to EPS. The policy objective is primarily achieved through fixed rate debt. The main floating rate benchmarks on variable rate debt are US Dollar LIBOR and pounds Sterling LIBOR.
At 31 March 2018, 78% (2017: 84%) of net debt was fixed. This fixed rate protection had an average duration of 5.7 years (2017: 3.7 years).
Interest rate risk within operating leases is hedged 100% by agreeing fixed rentals with the lessors prior to inception of the lease contracts.
Fair value changes in the £250.0m 2019 and the £350.0m 2021 Sterling bonds relating to the LIBOR element are hedged with coupon swaps. These swaps offset the fair value movements in the bond in the income statement and have the same term as the bonds.
The following sensitivity analysis details the Group’s sensitivity to a 100 basis points (1%) increase in interest rates throughout the reporting period with all other variables held constant.
2018 £m
2017 £m
Impact on profit after tax (1.8) (1.9)
Interest rate hedgesThe following table details the notional amounts of interest rate swap contracts designated as a cash flow or fair value hedge which were outstanding at the reporting date, the average fixed rate payable or receivable under these swaps and their fair value. The average interest rate is based on the outstanding balances at the reporting date. The fair value of interest rate swaps is determined by discounting the future cash flows.
The interest rate swaps settle on a quarterly or semi-annual basis. The differences between the fixed and floating rates are settled on a net basis.
Average fixed rate Notional principal amount Fair value asset
Fair value hedges2018
%2017
%2018
£m2017
£m2018
£m2017
£m
Less than one year 6.13 – 250 – 8.4 –One to two years – 6.13 – 250 – 20.1Two to five years 2.21 2.21 350 350 10.5 20.4
FirstGroup Annual Report and Accounts 2018 133
Financial statements
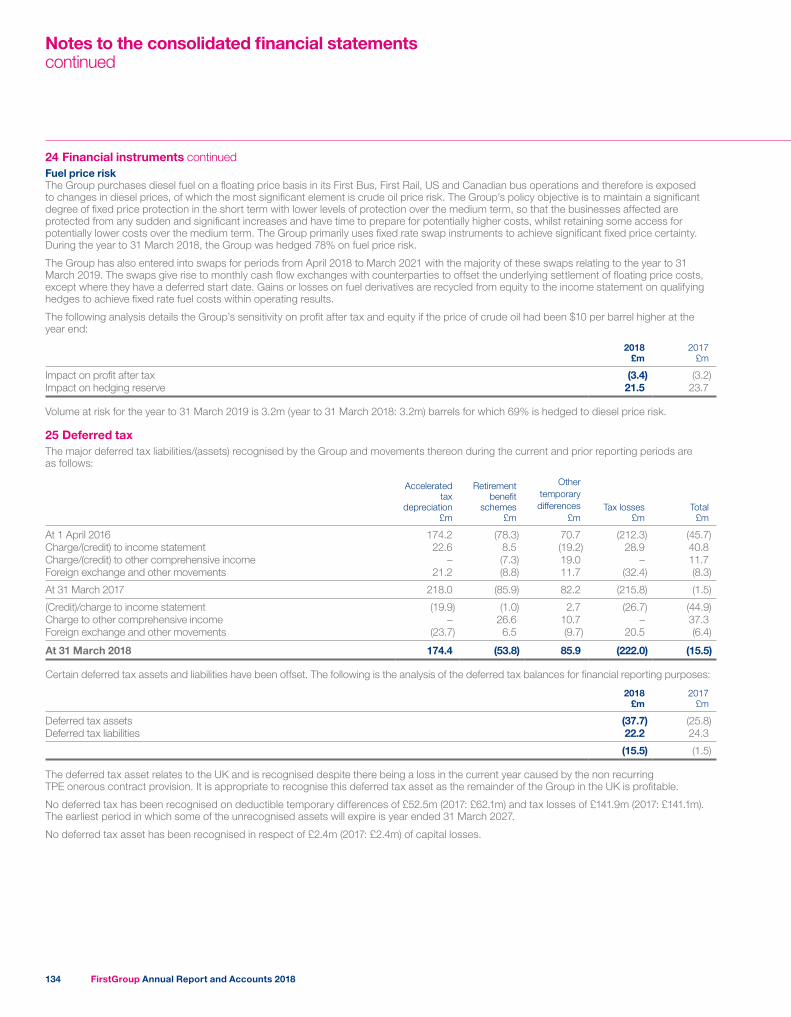
24 Financial instruments continuedFuel price riskThe Group purchases diesel fuel on a floating price basis in its First Bus, First Rail, US and Canadian bus operations and therefore is exposed to changes in diesel prices, of which the most significant element is crude oil price risk. The Group’s policy objective is to maintain a significant degree of fixed price protection in the short term with lower levels of protection over the medium term, so that the businesses affected are protected from any sudden and significant increases and have time to prepare for potentially higher costs, whilst retaining some access for potentially lower costs over the medium term. The Group primarily uses fixed rate swap instruments to achieve significant fixed price certainty. During the year to 31 March 2018, the Group was hedged 78% on fuel price risk.
The Group has also entered into swaps for periods from April 2018 to March 2021 with the majority of these swaps relating to the year to 31 March 2019. The swaps give rise to monthly cash flow exchanges with counterparties to offset the underlying settlement of floating price costs, except where they have a deferred start date. Gains or losses on fuel derivatives are recycled from equity to the income statement on qualifying hedges to achieve fixed rate fuel costs within operating results.
The following analysis details the Group’s sensitivity on profit after tax and equity if the price of crude oil had been $10 per barrel higher at the year end:
2018 £m
2017 £m
Impact on profit after tax (3.4) (3.2)Impact on hedging reserve 21.5 23.7
Volume at risk for the year to 31 March 2019 is 3.2m (year to 31 March 2018: 3.2m) barrels for which 69% is hedged to diesel price risk.
25 Deferred taxThe major deferred tax liabilities/(assets) recognised by the Group and movements thereon during the current and prior reporting periods are as follows:
Accelerated tax
depreciation £m
Retirement benefit
schemes £m
Other temporary differences
£mTax losses
£mTotal
£m
At 1 April 2016 174.2 (78.3) 70.7 (212.3) (45.7)Charge/(credit) to income statement 22.6 8.5 (19.2) 28.9 40.8Charge/(credit) to other comprehensive income – (7.3) 19.0 – 11.7Foreign exchange and other movements 21.2 (8.8) 11.7 (32.4) (8.3)
At 31 March 2017 218.0 (85.9) 82.2 (215.8) (1.5)
(Credit)/charge to income statement (19.9) (1.0) 2.7 (26.7) (44.9)Charge to other comprehensive income – 26.6 10.7 – 37.3Foreign exchange and other movements (23.7) 6.5 (9.7) 20.5 (6.4)
At 31 March 2018 174.4 (53.8) 85.9 (222.0) (15.5)
Certain deferred tax assets and liabilities have been offset. The following is the analysis of the deferred tax balances for financial reporting purposes:
2018 £m
2017 £m
Deferred tax assets (37.7) (25.8)Deferred tax liabilities 22.2 24.3
(15.5) (1.5)
The deferred tax asset relates to the UK and is recognised despite there being a loss in the current year caused by the non recurring TPE onerous contract provision. It is appropriate to recognise this deferred tax asset as the remainder of the Group in the UK is profitable.
No deferred tax has been recognised on deductible temporary differences of £52.5m (2017: £62.1m) and tax losses of £141.9m (2017: £141.1m). The earliest period in which some of the unrecognised assets will expire is year ended 31 March 2027.
No deferred tax asset has been recognised in respect of £2.4m (2017: £2.4m) of capital losses.
Notes to the consolidated financial statementscontinued
FirstGroup Annual Report and Accounts 2018134
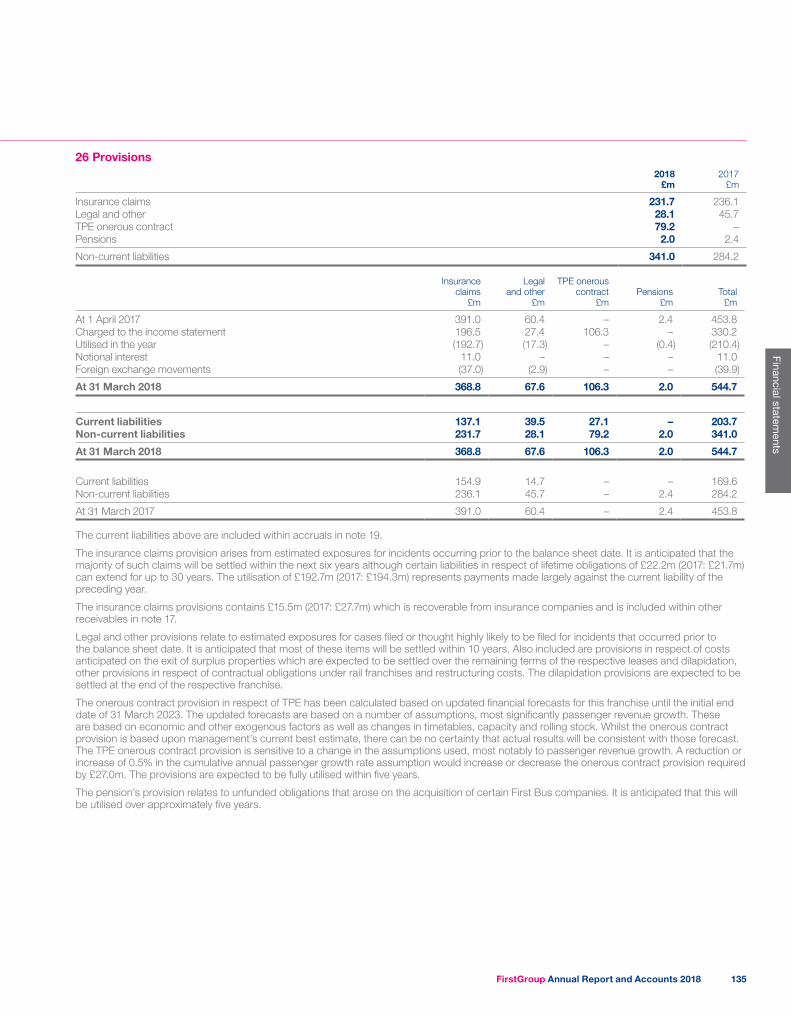
26 Provisions2018
£m2017
£m
Insurance claims 231.7 236.1Legal and other 28.1 45.7TPE onerous contract 79.2 –Pensions 2.0 2.4
Non-current liabilities 341.0 284.2
Insurance claims
£m
Legal and other
£m
TPE onerouscontract
£mPensions
£mTotal
£m
At 1 April 2017 391.0 60.4 – 2.4 453.8Charged to the income statement 196.5 27.4 106.3 – 330.2Utilised in the year (192.7) (17.3) – (0.4) (210.4)Notional interest 11.0 – – – 11.0Foreign exchange movements (37.0) (2.9) – – (39.9)
At 31 March 2018 368.8 67.6 106.3 2.0 544.7
Current liabilities 137.1 39.5 27.1 – 203.7Non-current liabilities 231.7 28.1 79.2 2.0 341.0
At 31 March 2018 368.8 67.6 106.3 2.0 544.7
Current liabilities 154.9 14.7 – – 169.6Non-current liabilities 236.1 45.7 – 2.4 284.2
At 31 March 2017 391.0 60.4 – 2.4 453.8
The current liabilities above are included within accruals in note 19.
The insurance claims provision arises from estimated exposures for incidents occurring prior to the balance sheet date. It is anticipated that the majority of such claims will be settled within the next six years although certain liabilities in respect of lifetime obligations of £22.2m (2017: £21.7m) can extend for up to 30 years. The utilisation of £192.7m (2017: £194.3m) represents payments made largely against the current liability of the preceding year.
The insurance claims provisions contains £15.5m (2017: £27.7m) which is recoverable from insurance companies and is included within other receivables in note 17.
Legal and other provisions relate to estimated exposures for cases filed or thought highly likely to be filed for incidents that occurred prior to the balance sheet date. It is anticipated that most of these items will be settled within 10 years. Also included are provisions in respect of costs anticipated on the exit of surplus properties which are expected to be settled over the remaining terms of the respective leases and dilapidation, other provisions in respect of contractual obligations under rail franchises and restructuring costs. The dilapidation provisions are expected to be settled at the end of the respective franchise.
The onerous contract provision in respect of TPE has been calculated based on updated financial forecasts for this franchise until the initial end date of 31 March 2023. The updated forecasts are based on a number of assumptions, most significantly passenger revenue growth. These are based on economic and other exogenous factors as well as changes in timetables, capacity and rolling stock. Whilst the onerous contract provision is based upon management’s current best estimate, there can be no certainty that actual results will be consistent with those forecast.The TPE onerous contract provision is sensitive to a change in the assumptions used, most notably to passenger revenue growth. A reduction or increase of 0.5% in the cumulative annual passenger growth rate assumption would increase or decrease the onerous contract provision required by £27.0m. The provisions are expected to be fully utilised within five years.
The pension’s provision relates to unfunded obligations that arose on the acquisition of certain First Bus companies. It is anticipated that this will be utilised over approximately five years.
FirstGroup Annual Report and Accounts 2018 135
Financial statements
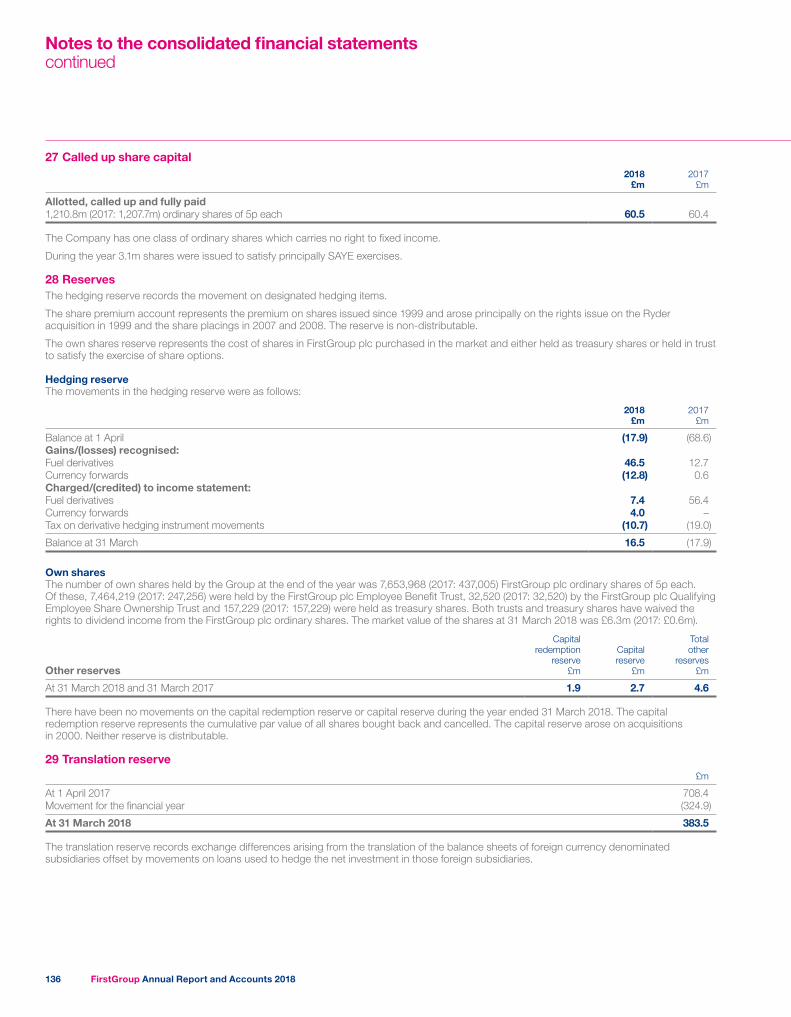
27 Called up share capital2018
£m2017
£m
Allotted, called up and fully paid1,210.8m (2017: 1,207.7m) ordinary shares of 5p each 60.5 60.4
The Company has one class of ordinary shares which carries no right to fixed income.
During the year 3.1m shares were issued to satisfy principally SAYE exercises.
28 ReservesThe hedging reserve records the movement on designated hedging items.
The share premium account represents the premium on shares issued since 1999 and arose principally on the rights issue on the Ryder acquisition in 1999 and the share placings in 2007 and 2008. The reserve is non-distributable.
The own shares reserve represents the cost of shares in FirstGroup plc purchased in the market and either held as treasury shares or held in trust to satisfy the exercise of share options.
Hedging reserveThe movements in the hedging reserve were as follows:
2018 £m
2017 £m
Balance at 1 April (17.9) (68.6)Gains/(losses) recognised:Fuel derivatives 46.5 12.7Currency forwards (12.8) 0.6Charged/(credited) to income statement:Fuel derivatives 7.4 56.4Currency forwards 4.0 –Tax on derivative hedging instrument movements (10.7) (19.0)
Balance at 31 March 16.5 (17.9)
Own sharesThe number of own shares held by the Group at the end of the year was 7,653,968 (2017: 437,005) FirstGroup plc ordinary shares of 5p each. Of these, 7,464,219 (2017: 247,256) were held by the FirstGroup plc Employee Benefit Trust, 32,520 (2017: 32,520) by the FirstGroup plc Qualifying Employee Share Ownership Trust and 157,229 (2017: 157,229) were held as treasury shares. Both trusts and treasury shares have waived the rights to dividend income from the FirstGroup plc ordinary shares. The market value of the shares at 31 March 2018 was £6.3m (2017: £0.6m).
Other reserves
Capital redemption
reserve £m
Capital reserve
£m
Total other
reserves £m
At 31 March 2018 and 31 March 2017 1.9 2.7 4.6
There have been no movements on the capital redemption reserve or capital reserve during the year ended 31 March 2018. The capital redemption reserve represents the cumulative par value of all shares bought back and cancelled. The capital reserve arose on acquisitions in 2000. Neither reserve is distributable.
29 Translation reserve£m
At 1 April 2017 708.4Movement for the financial year (324.9)
At 31 March 2018 383.5
The translation reserve records exchange differences arising from the translation of the balance sheets of foreign currency denominated subsidiaries offset by movements on loans used to hedge the net investment in those foreign subsidiaries.
Notes to the consolidated financial statementscontinued
FirstGroup Annual Report and Accounts 2018136
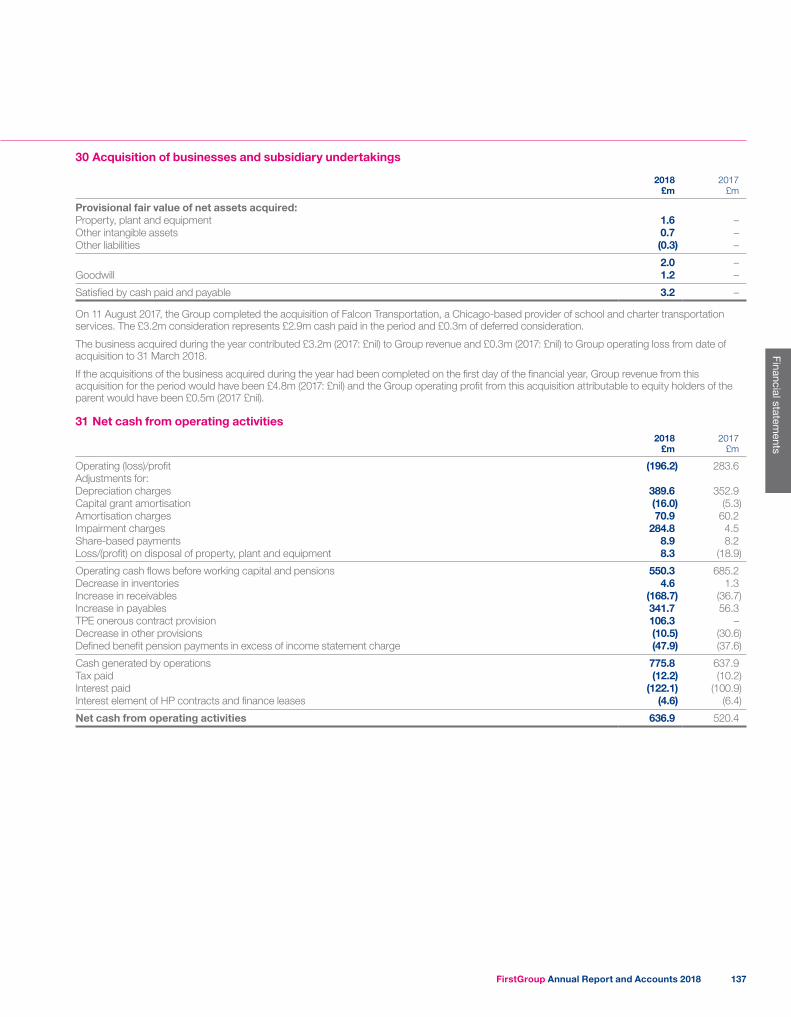
30 Acquisition of businesses and subsidiary undertakings
2018 £m
2017 £m
Provisional fair value of net assets acquired:Property, plant and equipment 1.6 –Other intangible assets 0.7 –Other liabilities (0.3) –
2.0 –Goodwill 1.2 –
Satisfied by cash paid and payable 3.2 –
On 11 August 2017, the Group completed the acquisition of Falcon Transportation, a Chicago-based provider of school and charter transportation services. The £3.2m consideration represents £2.9m cash paid in the period and £0.3m of deferred consideration.
The business acquired during the year contributed £3.2m (2017: £nil) to Group revenue and £0.3m (2017: £nil) to Group operating loss from date of acquisition to 31 March 2018.
If the acquisitions of the business acquired during the year had been completed on the first day of the financial year, Group revenue from this acquisition for the period would have been £4.8m (2017: £nil) and the Group operating profit from this acquisition attributable to equity holders of the parent would have been £0.5m (2017 £nil).
31 Net cash from operating activities2018
£m2017
£m
Operating (loss)/profit (196.2) 283.6Adjustments for:Depreciation charges 389.6 352.9Capital grant amortisation (16.0) (5.3)Amortisation charges 70.9 60.2Impairment charges 284.8 4.5Share-based payments 8.9 8.2Loss/(profit) on disposal of property, plant and equipment 8.3 (18.9)
Operating cash flows before working capital and pensions 550.3 685.2Decrease in inventories 4.6 1.3Increase in receivables (168.7) (36.7)Increase in payables 341.7 56.3TPE onerous contract provision 106.3 –Decrease in other provisions (10.5) (30.6)Defined benefit pension payments in excess of income statement charge (47.9) (37.6)
Cash generated by operations 775.8 637.9Tax paid (12.2) (10.2)Interest paid (122.1) (100.9)Interest element of HP contracts and finance leases (4.6) (6.4)
Net cash from operating activities 636.9 520.4
FirstGroup Annual Report and Accounts 2018 137
Financial statements
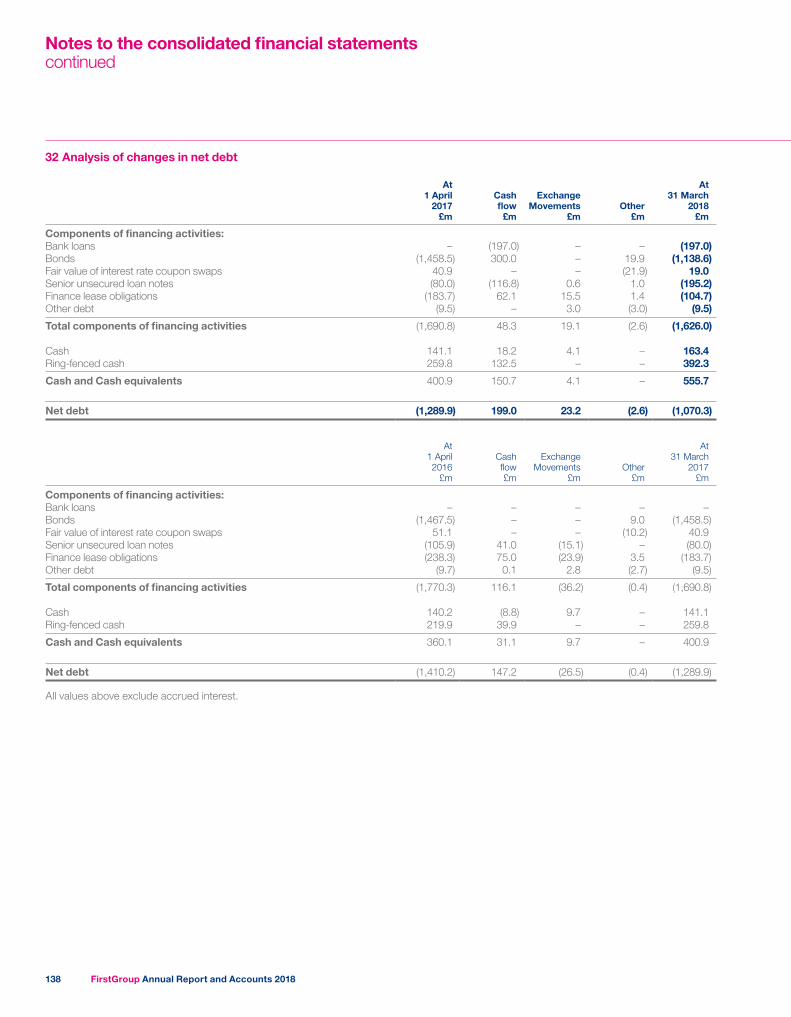
32 Analysis of changes in net debt
At 1 April
2017£m
Cash flow
£m
Exchange Movements
£mOther
£m
At 31 March
2018£m
Components of financing activities:Bank loans – (197.0) – – (197.0) Bonds (1,458.5) 300.0 – 19.9 (1,138.6) Fair value of interest rate coupon swaps 40.9 – – (21.9) 19.0 Senior unsecured loan notes (80.0) (116.8) 0.6 1.0 (195.2) Finance lease obligations (183.7) 62.1 15.5 1.4 (104.7) Other debt (9.5) – 3.0 (3.0) (9.5)
Total components of financing activities (1,690.8) 48.3 19.1 (2.6) (1,626.0)
Cash 141.1 18.2 4.1 – 163.4 Ring-fenced cash 259.8 132.5 – – 392.3
Cash and Cash equivalents 400.9 150.7 4.1 – 555.7
Net debt (1,289.9) 199.0 23.2 (2.6) (1,070.3)
At 1 April 2016
£m
Cash flow
£m
Exchange Movements
£mOther
£m
At 31 March
2017£m
Components of financing activities:Bank loans – – – – – Bonds (1,467.5) – – 9.0 (1,458.5) Fair value of interest rate coupon swaps 51.1 – – (10.2) 40.9 Senior unsecured loan notes (105.9) 41.0 (15.1) – (80.0) Finance lease obligations (238.3) 75.0 (23.9) 3.5 (183.7) Other debt (9.7) 0.1 2.8 (2.7) (9.5)
Total components of financing activities (1,770.3) 116.1 (36.2) (0.4) (1,690.8)
Cash 140.2 (8.8) 9.7 – 141.1 Ring-fenced cash 219.9 39.9 – – 259.8
Cash and Cash equivalents 360.1 31.1 9.7 – 400.9
Net debt (1,410.2) 147.2 (26.5) (0.4) (1,289.9)
All values above exclude accrued interest.
Notes to the consolidated financial statementscontinued
FirstGroup Annual Report and Accounts 2018138
33 Contingent liabilitiesInvestigations into the Croydon tram incident are ongoing and it is uncertain when they will be concluded. The tram was operated by Tram Operations Limited (TOL), a subsidiary of the Company, under a contract with a TfL subsidiary. TOL provides the drivers and management to operate the tram services, whereas the infrastructure and trams are owned and maintained by a TfL subsidiary. No proceedings have been commenced and, as such, it is not possible to assess whether any financial penalties or related costs could be incurred.
To support subsidiary undertakings in their normal course of business, the Company and certain subsidiaries have indemnified certain banks and insurance companies who have issued performance bonds for £783.1m (2017: £710.4m) and letters of credit for £327.7m (2017: £369.0m). The performance bonds relate to the North American businesses of £544.6m (2017: £570.1m) and the First Rail franchise operations of £238.5m (2017: £140.3m). The letters of credit relate substantially to insurance arrangements in the UK and North America. The parent company has committed further support facilities of up to £145.2m to First Rail Train Operating Companies.
The Company is party to certain unsecured guarantees granted to banks for overdraft and cash management facilities provided to itself and subsidiary undertakings. The Company has given certain unsecured guarantees for the liabilities of its subsidiary undertakings arising under certain loan notes, HP contracts, finance leases, operating leases and certain pension scheme arrangements. It also provides unsecured cross guarantees to certain subsidiary undertakings as required by VAT legislation. First Bus subsidiaries have provided unsecured guarantees on a joint and several basis to the Trustees of the First Bus Pension Scheme.
The Group is party to legal proceedings and claims which arise in the normal course of business, including but not limited to employment and safety claims. The Group takes legal advice as to the likelihood of success of claims and counterclaims. No provision is made where due to inherent uncertainties, no accurate quantification of any cost, or timing of such cost, which may arise from any of the legal proceedings can be determined.
In its normal course of business First Rail has ongoing contractual negotiations with government and other organisations.
On 14 November 2017, Reading Borough Council served First Greater Western Limited (GWR), a subsidiary of the Group, and Network Rail Infrastructure Limited (a third party) with a noise abatement notice in respect of the operations at the Reading railway depot. The serving of the notice has been appealed and the related court hearing is currently scheduled to take place in the first quarter of 2019 (unless the matter is settled between the parties before that date). It is not possible at this stage to quantify the implications for the GWR operations, if any, if they are not ultimately successful with respect to this appeal.
34 Operating lease arrangements2018
£m2017
£m
Minimum lease payments made under operating leases recognised in the income statement for the year:Plant and machinery 23.7 22.0Track and station access 154.4 110.1Hire of rolling stock 255.3 89.8Other assets 89.2 79.0
522.6 300.9
At the balance sheet dates, the Group had outstanding commitments for future minimum lease payments under non-cancellable operating leases, which fall due as follows:
2018 £m
2017 £m
Within one year 955.6 405.1In the second to fifth years inclusive 2,158.7 995.6After five years 507.8 70.4
3,622.1 1,471.1
Included in the above commitments are contracts held by the First Rail businesses with Network Rail for access to the railway infrastructure track, stations and depots of £1,027.6m (2017: £348.5m). They also have contracts under which they lease rolling stock of £2,223.6m (2017: £845.4m).
FirstGroup Annual Report and Accounts 2018 139
Financial statements
35 Share-based paymentsEquity-settled share option plansThe Group recognised total expenses of £8.9m (2017: £8.2m) related to equity-settled share-based payment transactions.
(a) Save as you earn (SAYE)The Group operates an HMRC approved savings related share option scheme. Grants were made as set out below. The scheme is based on eligible employees being granted options and their agreement to opening a sharesave account with a nominated savings carrier and to save weekly or monthly over a specified period. Sharesave accounts are held with Computershare. The right to exercise the option is at the employee’s discretion at the end of the period previously chosen for a period of six months.
SAYE Dec 2013
Options Number
SAYE Dec 2014
Options Number
SAYE Dec 2015
Options Number
SAYE Dec 2016
Options Number
SAYE Dec 2017
Options Number
Outstanding at the beginning of the year 1,774,654 5,671,340 6,709,681 7,595,520 –Awarded during the year – – – – 9,954,274Exercised during the year (759,602) (1,299,179) (55,341) (15,375) –Lapsed during the year (1,015,052) (396,939) (774,931) (873,816) (199,161)
Outstanding at the end of the year – 3,975,222 5,879,409 6,706,329 9,755,113
Exercisable at the end of the year – 3,975,222 – – –Weighted average exercise price (pence) 94.1 97.0 85.0 86.0 83.0Weighted average share price at date of exercise (pence) 126.9 102.8 113.5 112.8 N/A
(b) Deferred bonus shares (DBS)DBS 2007
Options Number
DBS 2008 Options Number
DBS 2009 Options
Number
DBS 2010 Options Number
DBS 2011 Options Number
Outstanding at the beginning of the year 18,831 46,761 31,109 63,150 117,835Exercised during the year (17,257) (18,765) (3,616) (8,028) (29,345)
Outstanding at the end of the year 1,574 27,996 27,493 55,122 88,490
Exercisable at the end of the year 1,574 27,996 27,493 55,122 88,490Weighted average exercise price (pence) Nil Nil Nil Nil NilWeighted average share price at date of exercise (pence) 134.6 98.8 140.2 140.9 122.9
DBS 2012 Options Number
DBS 2013 Options Number
DBS 2014 Options Number
DBS 2015 Options Number
DBS 2016 Options Number
DBS 2017 Options Number
Outstanding at the beginning of the year 164,972 708,331 1,960,690 2,503,615 1,586,348 –Granted during the year – – – – – 2,144,862Forfeited during the year – – – (79,639) (46,909) (43,862)Lapsed during the year – – – (8,876) (2,096) –Exercised during the year (45,980) (301,773) (1,598,475) (116,921) (2,765) (1,907)
Outstanding at the end of the year 118,992 406,558 362,215 2,298,179 1,534,578 2,099,093
Exercisable at the end of the year 118,992 406,558 362,215 31,397 2,312 1,673Weighted average exercise price (pence) Nil Nil Nil Nil Nil NilWeighted average share price at date of exercise (pence) 115.3 108.2 130.4 133.4 112.1 112.1
Notes to the consolidated financial statementscontinued
FirstGroup Annual Report and Accounts 2018140
35 Share-based payments continued(c) Buy As You Earn (BAYE)BAYE enables eligible employees to purchase shares from their gross income. The Company provides two matching shares for every three shares bought by employees, subject to a maximum Company contribution of shares to the value of £20 per employee per month. If the shares are held in trust for five years or more, no income tax and national insurance will be payable. The matching shares will be forfeited if the corresponding partnership shares are removed from trust within three years of award.
At 31 March 2018 there were 6,263 (2017: 4,275) participants in the BAYE scheme who have cumulatively purchased 18,817,893 (2017: 16,702,455) shares with the Company contributing 6,218,455 (2017: 5,535,678) matching shares on a cumulative basis.
(d) Long Term Incentive Plan (LTIP)LTIP 2014
Options Number
LTIP 2015 Options Number
LTIP 2016 Options Number
LTIP 2017 Options Number
Outstanding at the beginning of the year 9,145,375 3,367,906 3,584,210 –Granted during the year – – – 6,965,893Forfeited during the year (132,253) (35,438) (38,405) –Lapsed during the year (7,594,201) – – –Exercised during the year (1,414,875) – – –
Outstanding at the end of the year 4,046 3,332,468 3,545,805 6,965,893
Exercisable at the end of the year 4,046 – – –
Weighted average share price at date of exercise (pence) 124.4 Nil Nil Nil
(e) Divisional Incentive Plan (DIP)DIP
Options Number
Outstanding at the beginning of the year 7,781,248Granted during the year 1,125,912Forfeited during the year (18,952)Lapsed during the year (7,781,248)Exercised during the year (6,316)
Outstanding at the end of the year 1,100,644
Exercisable at the end of the year –Weighted average exercise price (pence) NilWeighted average share price at date of exercise (pence) 112.1
(f) Executive Share Plan (ESP)ESP 2015
Options Number
ESP 2016 Options Number
ESP 2017 Options Number
Outstanding at the beginning of the year 1,011,117 1,746,770 –Granted during the year – – 3,432,146Forfeited during the year (40,505) (115,622) (181,847)Lapsed during the year – (15,061) –Exercised during the year (311,372) (376,499) (6,176)
Outstanding at the end of the year 659,240 1,239,588 3,244,123
Exercisable at the end of the year 296,716 203,934 11,163Weighted average exercise price (pence) Nil Nil NilWeighted average share price at date of exercise (pence) 121.0 121.8 112.1
FirstGroup Annual Report and Accounts 2018 141
Financial statements
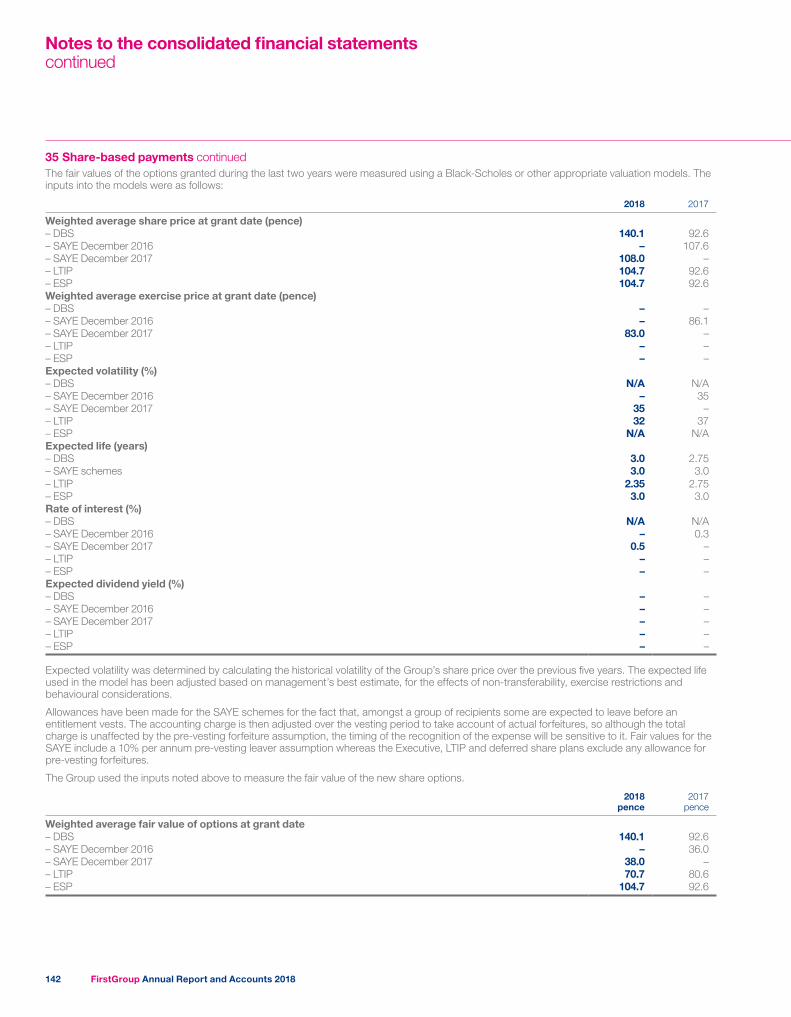
35 Share-based payments continuedThe fair values of the options granted during the last two years were measured using a Black-Scholes or other appropriate valuation models. The inputs into the models were as follows:
2018 2017
Weighted average share price at grant date (pence)– DBS 140.1 92.6– SAYE December 2016 – 107.6– SAYE December 2017 108.0 –– LTIP 104.7 92.6– ESP 104.7 92.6Weighted average exercise price at grant date (pence)– DBS – –– SAYE December 2016 – 86.1– SAYE December 2017 83.0 –– LTIP – –– ESP – –Expected volatility (%)– DBS N/A N/A– SAYE December 2016 – 35– SAYE December 2017 35 –– LTIP 32 37– ESP N/A N/AExpected life (years)– DBS 3.0 2.75– SAYE schemes 3.0 3.0– LTIP 2.35 2.75– ESP 3.0 3.0Rate of interest (%)– DBS N/A N/A– SAYE December 2016 – 0.3– SAYE December 2017 0.5 –– LTIP – –– ESP – –Expected dividend yield (%)– DBS – –– SAYE December 2016 – –– SAYE December 2017 – –– LTIP – –– ESP – –
Expected volatility was determined by calculating the historical volatility of the Group’s share price over the previous five years. The expected life used in the model has been adjusted based on management’s best estimate, for the effects of non-transferability, exercise restrictions and behavioural considerations.
Allowances have been made for the SAYE schemes for the fact that, amongst a group of recipients some are expected to leave before an entitlement vests. The accounting charge is then adjusted over the vesting period to take account of actual forfeitures, so although the total charge is unaffected by the pre-vesting forfeiture assumption, the timing of the recognition of the expense will be sensitive to it. Fair values for the SAYE include a 10% per annum pre-vesting leaver assumption whereas the Executive, LTIP and deferred share plans exclude any allowance for pre-vesting forfeitures.
The Group used the inputs noted above to measure the fair value of the new share options.
2018 pence
2017 pence
Weighted average fair value of options at grant date– DBS 140.1 92.6– SAYE December 2016 – 36.0– SAYE December 2017 38.0 –– LTIP 70.7 80.6– ESP 104.7 92.6
Notes to the consolidated financial statementscontinued
FirstGroup Annual Report and Accounts 2018142
36 Retirement benefit schemes
Non-RailDefined contribution plansPayments to defined contribution plans are charged as an expense as they fall due. There is no legal or constructive obligation to pay additional contributions into a defined contribution plan if the fund has insufficient assets to pay all employees’ benefits relating to employee service in the current and prior periods.
UKThe Group operates defined contribution plans for all Group and First Bus employees who have joined a pension arrangement since April 2013. They receive a company match to their contributions, which varies by salary and/or service.
North AmericaEmployees in the US have been able to join a defined contribution arrangement for many years. They receive a company match which varies by employment status.
All new employees in Canada join a defined contribution arrangement. Union employees join the Eastern or Western plan, whilst managers and supervisors join the Supervisory plan. They receive a company contribution dependent on their personal contribution and the plan they are in.
The total expense recognised in the consolidated income statement of £23.9m (2017: £23.0m) represents contributions payable to these plans by the Group at rates specified in the rules of the plans.
Defined benefit plansThe Group sponsors 10 funded defined benefit plans across its non-rail operations, covering approximately 50,000 former and current employees.
UKThe majority of defined benefit provision is through trust-based schemes. These arrangements are closed to new entrants.
The assets of the trust-based schemes are invested separately from those of the Group, and the schemes are run independently of the Group by trustee boards. There is a requirement for the trustee boards to have some member representation, with the other trustee directors being company appointed. The Trustee is responsible for the investment policy in respect of the assets of the fund, although the Company must be consulted on this, and typically has some input into the investment decisions.
Triennial valuations assess the cost of future service and the funding position. The Company and Trustee are required to agree on assumptions for the valuations and to agree the contributions that result from these. Deficit recovery contributions may be required in addition to future service contributions. In agreeing contribution rates, reference must be made to the affordability of contributions by the employer.
In most arrangements, any surplus after benefits have been paid/secured, can be repaid to the employer.
The First UK Bus Pension SchemeThis provides pension benefits to employees in First Bus. Historically it provided salary related benefits on a shared cost basis, but from April 2013, all new members have been enrolled in the defined contribution section.
The funding level of the scheme on 5 April 2017 failed to reach a pre-agreed funding level, and as such, the scheme closed to defined benefit accrual on 5 April 2018.
A smaller Group scheme provides defined benefit pensions to Group employees. This scheme closed to defined benefit accrual on 5 April 2018.
Local Government Pension SchemesThe Group participates in three Local Government Pension Schemes (LGPS), one in England and two in Scotland, which provide salary related benefits. These differ from trust-based schemes in that their benefits and governance are prescribed by specific legislation, and they are administered by local authorities.
Contribution rates are agreed for the three-year period until the next valuation. The Group only recognises existing surpluses relating to the LGPS when determining the balance sheet position, to the extent that these surpluses could be recouped by the reduction of future Company contributions.
FirstGroup Annual Report and Accounts 2018 143
Financial statements
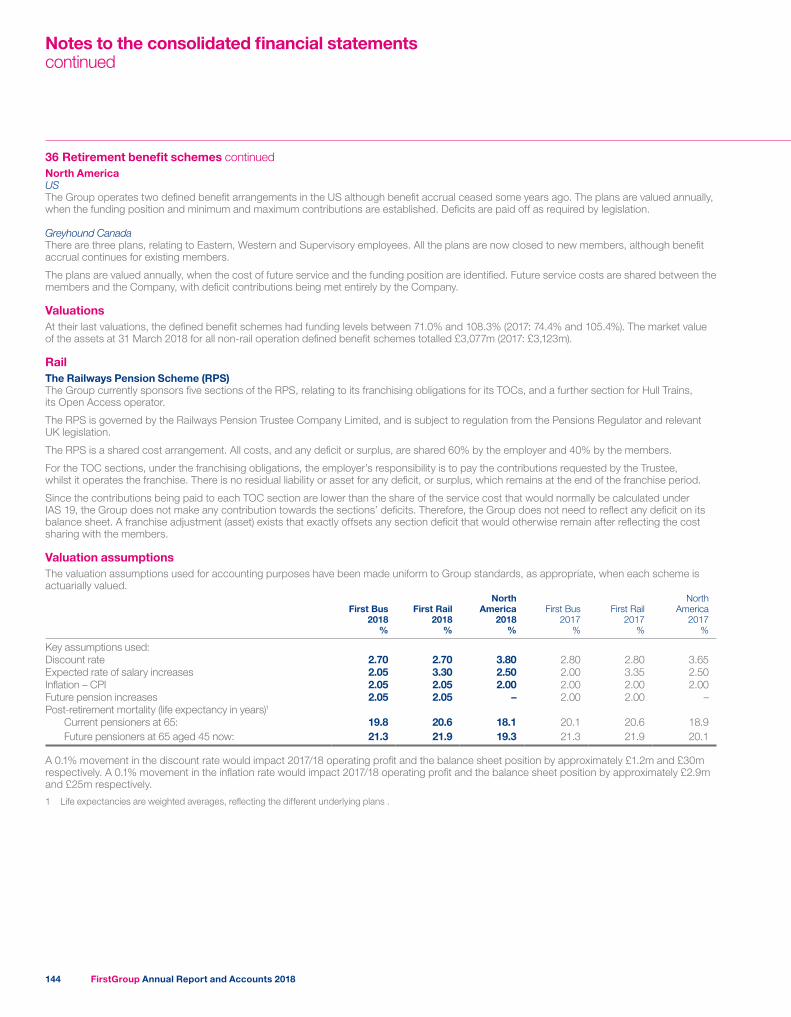
36 Retirement benefit schemes continuedNorth AmericaUSThe Group operates two defined benefit arrangements in the US although benefit accrual ceased some years ago. The plans are valued annually, when the funding position and minimum and maximum contributions are established. Deficits are paid off as required by legislation.
Greyhound CanadaThere are three plans, relating to Eastern, Western and Supervisory employees. All the plans are now closed to new members, although benefit accrual continues for existing members.
The plans are valued annually, when the cost of future service and the funding position are identified. Future service costs are shared between the members and the Company, with deficit contributions being met entirely by the Company.
ValuationsAt their last valuations, the defined benefit schemes had funding levels between 71.0% and 108.3% (2017: 74.4% and 105.4%). The market value of the assets at 31 March 2018 for all non-rail operation defined benefit schemes totalled £3,077m (2017: £3,123m).
RailThe Railways Pension Scheme (RPS)The Group currently sponsors five sections of the RPS, relating to its franchising obligations for its TOCs, and a further section for Hull Trains, its Open Access operator.
The RPS is governed by the Railways Pension Trustee Company Limited, and is subject to regulation from the Pensions Regulator and relevant UK legislation.
The RPS is a shared cost arrangement. All costs, and any deficit or surplus, are shared 60% by the employer and 40% by the members.
For the TOC sections, under the franchising obligations, the employer’s responsibility is to pay the contributions requested by the Trustee, whilst it operates the franchise. There is no residual liability or asset for any deficit, or surplus, which remains at the end of the franchise period.
Since the contributions being paid to each TOC section are lower than the share of the service cost that would normally be calculated under IAS 19, the Group does not make any contribution towards the sections’ deficits. Therefore, the Group does not need to reflect any deficit on its balance sheet. A franchise adjustment (asset) exists that exactly offsets any section deficit that would otherwise remain after reflecting the cost sharing with the members.
Valuation assumptionsThe valuation assumptions used for accounting purposes have been made uniform to Group standards, as appropriate, when each scheme is actuarially valued.
First Bus 2018
%
First Rail 2018
%
North America
2018 %
First Bus 2017
%
First Rail 2017
%
North America
2017 %
Key assumptions used:Discount rate 2.70 2.70 3.80 2.80 2.80 3.65Expected rate of salary increases 2.05 3.30 2.50 2.00 3.35 2.50Inflation – CPI 2.05 2.05 2.00 2.00 2.00 2.00Future pension increases 2.05 2.05 – 2.00 2.00 –Post-retirement mortality (life expectancy in years)1
Current pensioners at 65: 19.8 20.6 18.1 20.1 20.6 18.9
Future pensioners at 65 aged 45 now: 21.3 21.9 19.3 21.3 21.9 20.1
A 0.1% movement in the discount rate would impact 2017/18 operating profit and the balance sheet position by approximately £1.2m and £30m respectively. A 0.1% movement in the inflation rate would impact 2017/18 operating profit and the balance sheet position by approximately £2.9m and £25m respectively.
1 Life expectancies are weighted averages, reflecting the different underlying plans .
Notes to the consolidated financial statementscontinued
FirstGroup Annual Report and Accounts 2018144
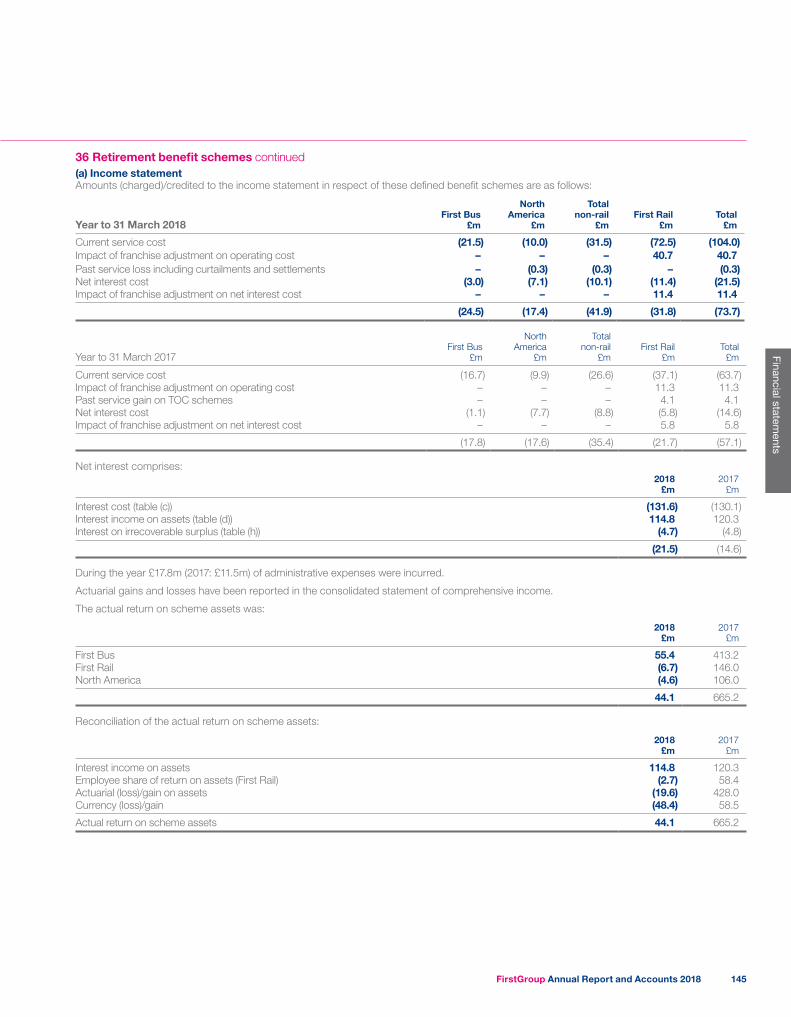
36 Retirement benefit schemes continued(a) Income statementAmounts (charged)/credited to the income statement in respect of these defined benefit schemes are as follows:
Year to 31 March 2018First Bus
£m
North America
£m
Total non-rail
£mFirst Rail
£mTotal
£m
Current service cost (21.5) (10.0) (31.5) (72.5) (104.0)Impact of franchise adjustment on operating cost – – – 40.7 40.7Past service loss including curtailments and settlements – (0.3) (0.3) – (0.3)Net interest cost (3.0) (7.1) (10.1) (11.4) (21.5)Impact of franchise adjustment on net interest cost – – – 11.4 11.4
(24.5) (17.4) (41.9) (31.8) (73.7)
Year to 31 March 2017First Bus
£m
North America
£m
Total non-rail
£mFirst Rail
£mTotal
£m
Current service cost (16.7) (9.9) (26.6) (37.1) (63.7)Impact of franchise adjustment on operating cost – – – 11.3 11.3Past service gain on TOC schemes – – – 4.1 4.1Net interest cost (1.1) (7.7) (8.8) (5.8) (14.6)Impact of franchise adjustment on net interest cost – – – 5.8 5.8
(17.8) (17.6) (35.4) (21.7) (57.1)
Net interest comprises:2018
£m2017
£m
Interest cost (table (c)) (131.6) (130.1)Interest income on assets (table (d)) 114.8 120.3Interest on irrecoverable surplus (table (h)) (4.7) (4.8)
(21.5) (14.6)
During the year £17.8m (2017: £11.5m) of administrative expenses were incurred.
Actuarial gains and losses have been reported in the consolidated statement of comprehensive income.
The actual return on scheme assets was:
2018 £m
2017 £m
First Bus 55.4 413.2First Rail (6.7) 146.0North America (4.6) 106.0
44.1 665.2
Reconciliation of the actual return on scheme assets:
2018 £m
2017 £m
Interest income on assets 114.8 120.3Employee share of return on assets (First Rail) (2.7) 58.4Actuarial (loss)/gain on assets (19.6) 428.0Currency (loss)/gain (48.4) 58.5
Actual return on scheme assets 44.1 665.2
FirstGroup Annual Report and Accounts 2018 145
Financial statements
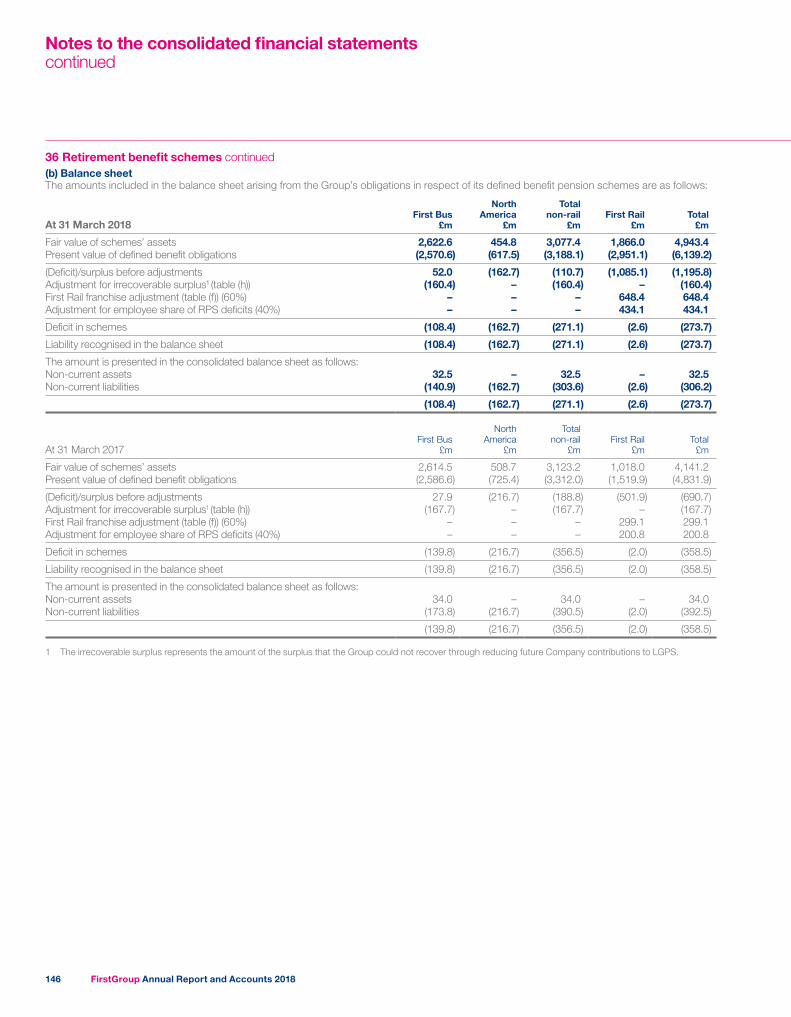
36 Retirement benefit schemes continued(b) Balance sheetThe amounts included in the balance sheet arising from the Group’s obligations in respect of its defined benefit pension schemes are as follows:
At 31 March 2018First Bus
£m
North America
£m
Total non-rail
£mFirst Rail
£mTotal
£m
Fair value of schemes’ assets 2,622.6 454.8 3,077.4 1,866.0 4,943.4Present value of defined benefit obligations (2,570.6) (617.5) (3,188.1) (2,951.1) (6,139.2)
(Deficit)/surplus before adjustments 52.0 (162.7) (110.7) (1,085.1) (1,195.8)Adjustment for irrecoverable surplus1 (table (h)) (160.4) – (160.4) – (160.4)First Rail franchise adjustment (table (f)) (60%) – – – 648.4 648.4Adjustment for employee share of RPS deficits (40%) – – – 434.1 434.1
Deficit in schemes (108.4) (162.7) (271.1) (2.6) (273.7)
Liability recognised in the balance sheet (108.4) (162.7) (271.1) (2.6) (273.7)
The amount is presented in the consolidated balance sheet as follows:Non-current assets 32.5 – 32.5 – 32.5Non-current liabilities (140.9) (162.7) (303.6) (2.6) (306.2)
(108.4) (162.7) (271.1) (2.6) (273.7)
At 31 March 2017First Bus
£m
North America
£m
Total non-rail
£mFirst Rail
£mTotal
£m
Fair value of schemes’ assets 2,614.5 508.7 3,123.2 1,018.0 4,141.2Present value of defined benefit obligations (2,586.6) (725.4) (3,312.0) (1,519.9) (4,831.9)
(Deficit)/surplus before adjustments 27.9 (216.7) (188.8) (501.9) (690.7)Adjustment for irrecoverable surplus1 (table (h)) (167.7) – (167.7) – (167.7)First Rail franchise adjustment (table (f)) (60%) – – – 299.1 299.1Adjustment for employee share of RPS deficits (40%) – – – 200.8 200.8
Deficit in schemes (139.8) (216.7) (356.5) (2.0) (358.5)
Liability recognised in the balance sheet (139.8) (216.7) (356.5) (2.0) (358.5)
The amount is presented in the consolidated balance sheet as follows:Non-current assets 34.0 – 34.0 – 34.0Non-current liabilities (173.8) (216.7) (390.5) (2.0) (392.5)
(139.8) (216.7) (356.5) (2.0) (358.5)
1 The irrecoverable surplus represents the amount of the surplus that the Group could not recover through reducing future Company contributions to LGPS.
Notes to the consolidated financial statementscontinued
FirstGroup Annual Report and Accounts 2018146
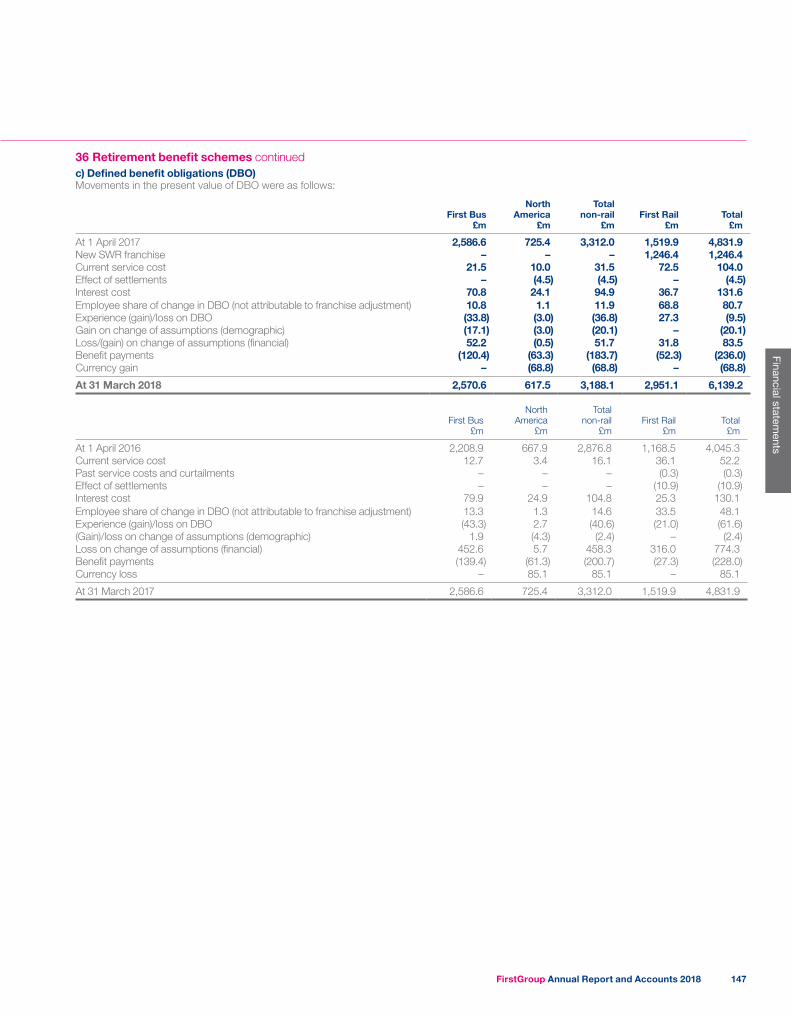
36 Retirement benefit schemes continuedc) Defined benefit obligations (DBO)Movements in the present value of DBO were as follows:
First Bus £m
North America
£m
Total non-rail
£mFirst Rail
£mTotal
£m
At 1 April 2017 2,586.6 725.4 3,312.0 1,519.9 4,831.9New SWR franchise – – – 1,246.4 1,246.4Current service cost 21.5 10.0 31.5 72.5 104.0Effect of settlements – (4.5) (4.5) – (4.5)Interest cost 70.8 24.1 94.9 36.7 131.6Employee share of change in DBO (not attributable to franchise adjustment) 10.8 1.1 11.9 68.8 80.7Experience (gain)/loss on DBO (33.8) (3.0) (36.8) 27.3 (9.5)Gain on change of assumptions (demographic) (17.1) (3.0) (20.1) – (20.1)Loss/(gain) on change of assumptions (financial) 52.2 (0.5) 51.7 31.8 83.5Benefit payments (120.4) (63.3) (183.7) (52.3) (236.0)Currency gain – (68.8) (68.8) – (68.8)
At 31 March 2018 2,570.6 617.5 3,188.1 2,951.1 6,139.2
First Bus £m
North America
£m
Total non-rail
£mFirst Rail
£mTotal
£m
At 1 April 2016 2,208.9 667.9 2,876.8 1,168.5 4,045.3Current service cost 12.7 3.4 16.1 36.1 52.2Past service costs and curtailments – – – (0.3) (0.3)Effect of settlements – – – (10.9) (10.9)Interest cost 79.9 24.9 104.8 25.3 130.1Employee share of change in DBO (not attributable to franchise adjustment) 13.3 1.3 14.6 33.5 48.1Experience (gain)/loss on DBO (43.3) 2.7 (40.6) (21.0) (61.6)(Gain)/loss on change of assumptions (demographic) 1.9 (4.3) (2.4) – (2.4)Loss on change of assumptions (financial) 452.6 5.7 458.3 316.0 774.3Benefit payments (139.4) (61.3) (200.7) (27.3) (228.0)Currency loss – 85.1 85.1 – 85.1
At 31 March 2017 2,586.6 725.4 3,312.0 1,519.9 4,831.9
FirstGroup Annual Report and Accounts 2018 147
Financial statements
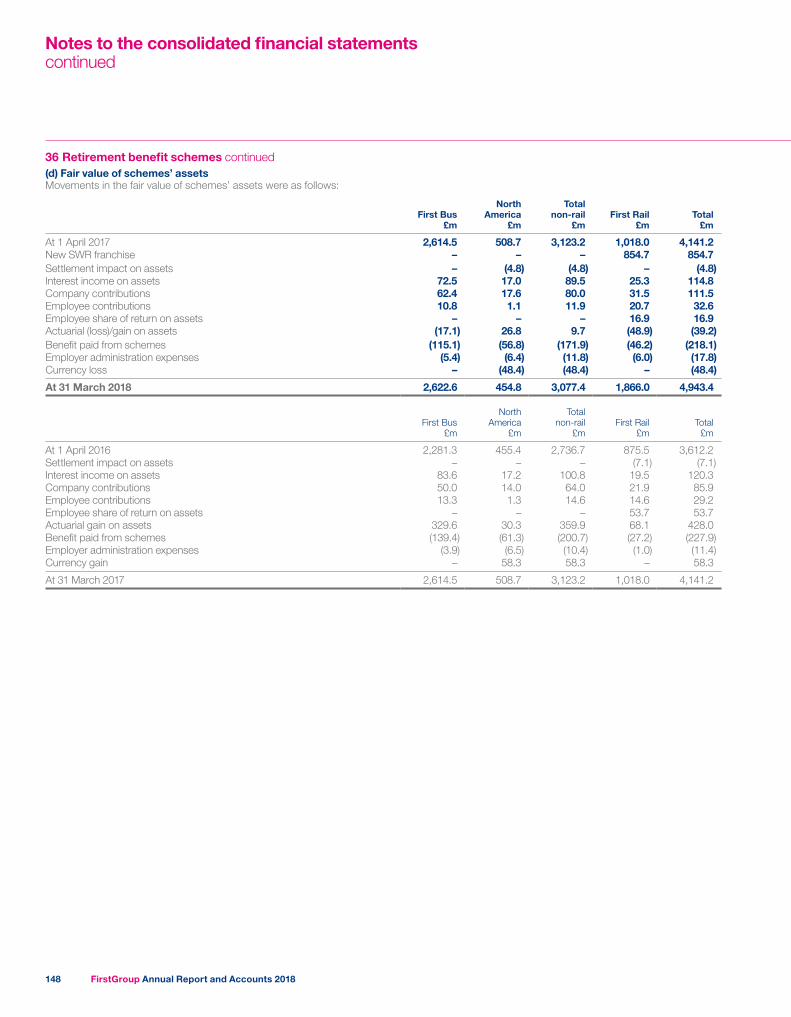
36 Retirement benefit schemes continued(d) Fair value of schemes’ assetsMovements in the fair value of schemes’ assets were as follows:
First Bus £m
North America
£m
Total non-rail
£mFirst Rail
£mTotal
£m
At 1 April 2017 2,614.5 508.7 3,123.2 1,018.0 4,141.2New SWR franchise – – – 854.7 854.7Settlement impact on assets – (4.8) (4.8) – (4.8)Interest income on assets 72.5 17.0 89.5 25.3 114.8Company contributions 62.4 17.6 80.0 31.5 111.5Employee contributions 10.8 1.1 11.9 20.7 32.6Employee share of return on assets – – – 16.9 16.9Actuarial (loss)/gain on assets (17.1) 26.8 9.7 (48.9) (39.2)Benefit paid from schemes (115.1) (56.8) (171.9) (46.2) (218.1)Employer administration expenses (5.4) (6.4) (11.8) (6.0) (17.8)Currency loss – (48.4) (48.4) – (48.4)
At 31 March 2018 2,622.6 454.8 3,077.4 1,866.0 4,943.4
First Bus £m
North America
£m
Total non-rail
£mFirst Rail
£mTotal
£m
At 1 April 2016 2,281.3 455.4 2,736.7 875.5 3,612.2Settlement impact on assets – – – (7.1) (7.1)Interest income on assets 83.6 17.2 100.8 19.5 120.3Company contributions 50.0 14.0 64.0 21.9 85.9Employee contributions 13.3 1.3 14.6 14.6 29.2Employee share of return on assets – – – 53.7 53.7Actuarial gain on assets 329.6 30.3 359.9 68.1 428.0Benefit paid from schemes (139.4) (61.3) (200.7) (27.2) (227.9)Employer administration expenses (3.9) (6.5) (10.4) (1.0) (11.4)Currency gain – 58.3 58.3 – 58.3
At 31 March 2017 2,614.5 508.7 3,123.2 1,018.0 4,141.2
Notes to the consolidated financial statementscontinued
FirstGroup Annual Report and Accounts 2018148
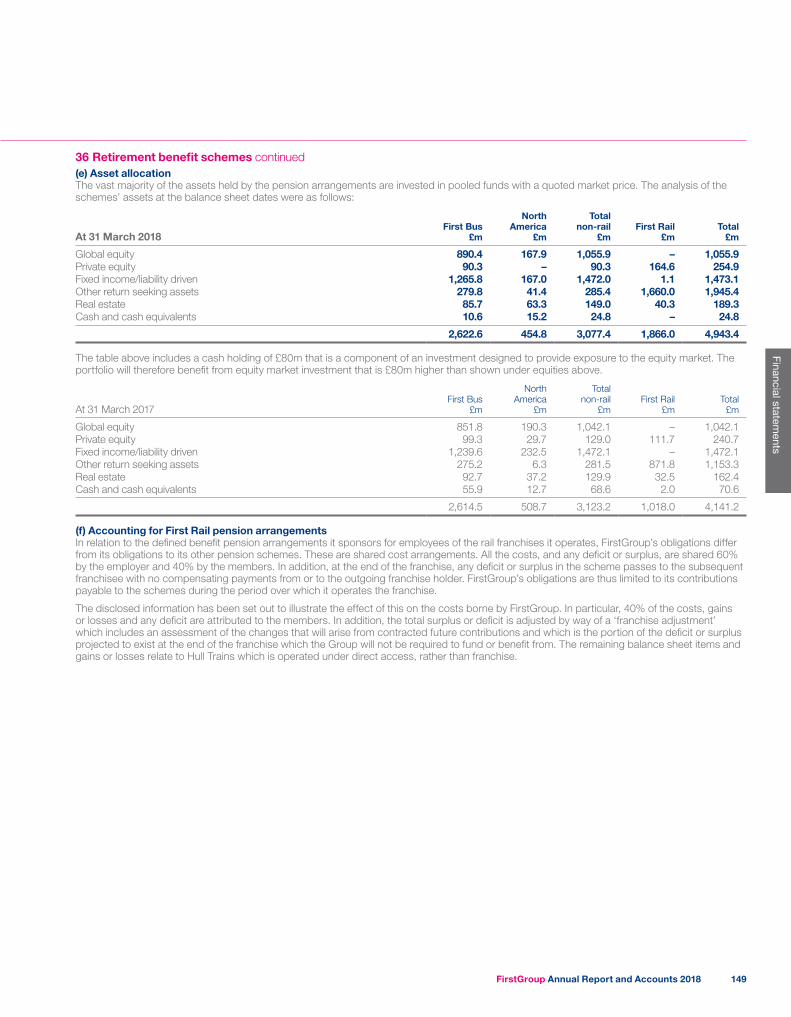
36 Retirement benefit schemes continued(e) Asset allocationThe vast majority of the assets held by the pension arrangements are invested in pooled funds with a quoted market price. The analysis of the schemes’ assets at the balance sheet dates were as follows:
At 31 March 2018First Bus
£m
North America
£m
Total non-rail
£mFirst Rail
£mTotal
£m
Global equity 890.4 167.9 1,055.9 – 1,055.9Private equity 90.3 – 90.3 164.6 254.9Fixed income/liability driven 1,265.8 167.0 1,472.0 1.1 1,473.1Other return seeking assets 279.8 41.4 285.4 1,660.0 1,945.4Real estate 85.7 63.3 149.0 40.3 189.3Cash and cash equivalents 10.6 15.2 24.8 – 24.8
2,622.6 454.8 3,077.4 1,866.0 4,943.4
The table above includes a cash holding of £80m that is a component of an investment designed to provide exposure to the equity market. The portfolio will therefore benefit from equity market investment that is £80m higher than shown under equities above.
At 31 March 2017First Bus
£m
North America
£m
Total non-rail
£mFirst Rail
£mTotal
£m
Global equity 851.8 190.3 1,042.1 – 1,042.1Private equity 99.3 29.7 129.0 111.7 240.7Fixed income/liability driven 1,239.6 232.5 1,472.1 – 1,472.1Other return seeking assets 275.2 6.3 281.5 871.8 1,153.3Real estate 92.7 37.2 129.9 32.5 162.4Cash and cash equivalents 55.9 12.7 68.6 2.0 70.6
2,614.5 508.7 3,123.2 1,018.0 4,141.2
(f) Accounting for First Rail pension arrangementsIn relation to the defined benefit pension arrangements it sponsors for employees of the rail franchises it operates, FirstGroup’s obligations differ from its obligations to its other pension schemes. These are shared cost arrangements. All the costs, and any deficit or surplus, are shared 60% by the employer and 40% by the members. In addition, at the end of the franchise, any deficit or surplus in the scheme passes to the subsequent franchisee with no compensating payments from or to the outgoing franchise holder. FirstGroup’s obligations are thus limited to its contributions payable to the schemes during the period over which it operates the franchise.
The disclosed information has been set out to illustrate the effect of this on the costs borne by FirstGroup. In particular, 40% of the costs, gains or losses and any deficit are attributed to the members. In addition, the total surplus or deficit is adjusted by way of a ‘franchise adjustment’ which includes an assessment of the changes that will arise from contracted future contributions and which is the portion of the deficit or surplus projected to exist at the end of the franchise which the Group will not be required to fund or benefit from. The remaining balance sheet items and gains or losses relate to Hull Trains which is operated under direct access, rather than franchise.
FirstGroup Annual Report and Accounts 2018 149
Financial statements

36 Retirement benefit schemes continuedReconciliation of Rail franchises:
Assets£m
Liabilities£m
Adjustment for employee share of RPSdeficits (40%)
£m
Franchise adjustment
£mNet £m
At 1 April 2017 1,018.0 (1,519.9) 200.8 299.1 (2.0)New SWR franchise 854.7 (1,246.4) 156.7 235.0 –Income statementOperating– Service cost – (110.8) 44.3 40.7 (25.8)– Admin cost – (6.0) – – (6.0)
Total Operating – (116.8) 44.3 40.7 (31.8)
Financing 42.2 (61.2) 7.6 11.4 –
Total Income statement 42.2 (178.0) 51.9 52.1 (31.8)
Amounts paid to/(from) schemeEmployer contributions 31.5 – (12.6) 12.5 31.4Employee contributions 20.8 – (8.3) (12.3) 0.2Benefit paid (52.3) 52.3 – – –
Total – 52.3 (20.9) 0.2 31.6
Expected closing position 1,914.9 (2,892.0) 388.5 586.4 (2.2)Change in financial assumptions – (31.8) 12.7 18.8 (0.3)Return on assets in excess of discount rate (48.9) – 19.6 29.2 (0.1)Experience – (27.3) 13.3 14.0 –
Total (48.9) (59.1) 45.6 62.0 (0.4)
At 31 March 2018 1,866.0 (2,951.1) 434.1 648.4 (2.6)
Notes to the consolidated financial statementscontinued
FirstGroup Annual Report and Accounts 2018150
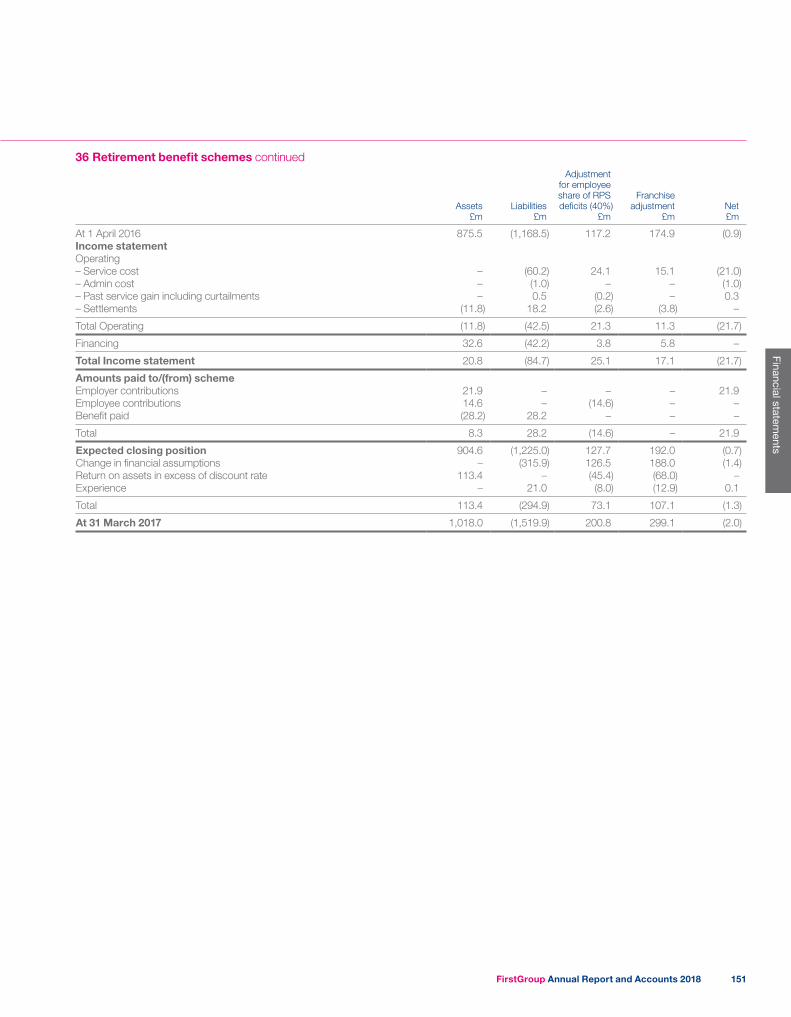
36 Retirement benefit schemes continued
Assets£m
Liabilities£m
Adjustment for employee share of RPSdeficits (40%)
£m
Franchise adjustment
£mNet £m
At 1 April 2016 875.5 (1,168.5) 117.2 174.9 (0.9)Income statementOperating– Service cost – (60.2) 24.1 15.1 (21.0)– Admin cost – (1.0) – – (1.0)– Past service gain including curtailments – 0.5 (0.2) – 0.3– Settlements (11.8) 18.2 (2.6) (3.8) –
Total Operating (11.8) (42.5) 21.3 11.3 (21.7)
Financing 32.6 (42.2) 3.8 5.8 –
Total Income statement 20.8 (84.7) 25.1 17.1 (21.7)
Amounts paid to/(from) schemeEmployer contributions 21.9 – – – 21.9Employee contributions 14.6 – (14.6) – –Benefit paid (28.2) 28.2 – – –
Total 8.3 28.2 (14.6) – 21.9
Expected closing position 904.6 (1,225.0) 127.7 192.0 (0.7)Change in financial assumptions – (315.9) 126.5 188.0 (1.4)Return on assets in excess of discount rate 113.4 – (45.4) (68.0) –Experience – 21.0 (8.0) (12.9) 0.1
Total 113.4 (294.9) 73.1 107.1 (1.3)
At 31 March 2017 1,018.0 (1,519.9) 200.8 299.1 (2.0)
FirstGroup Annual Report and Accounts 2018 151
Financial statements
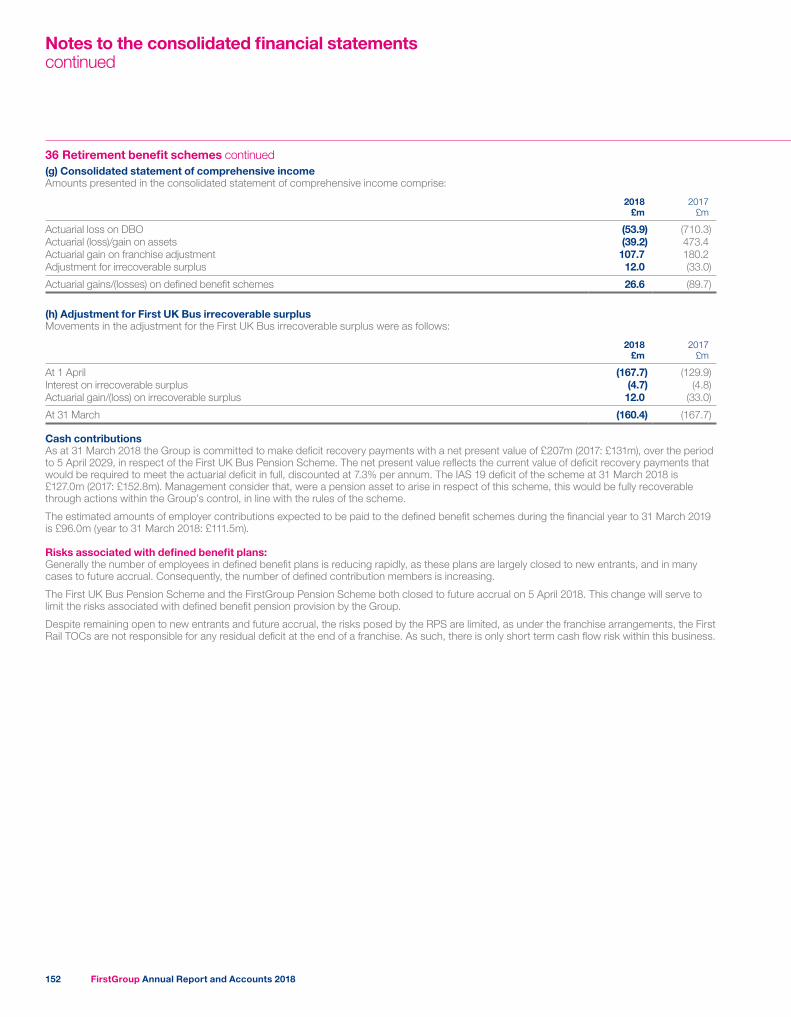
36 Retirement benefit schemes continued(g) Consolidated statement of comprehensive incomeAmounts presented in the consolidated statement of comprehensive income comprise:
2018 £m
2017 £m
Actuarial loss on DBO (53.9) (710.3)Actuarial (loss)/gain on assets (39.2) 473.4Actuarial gain on franchise adjustment 107.7 180.2Adjustment for irrecoverable surplus 12.0 (33.0)
Actuarial gains/(losses) on defined benefit schemes 26.6 (89.7)
(h) Adjustment for First UK Bus irrecoverable surplusMovements in the adjustment for the First UK Bus irrecoverable surplus were as follows:
2018 £m
2017 £m
At 1 April (167.7) (129.9)Interest on irrecoverable surplus (4.7) (4.8)Actuarial gain/(loss) on irrecoverable surplus 12.0 (33.0)
At 31 March (160.4) (167.7)
Cash contributionsAs at 31 March 2018 the Group is committed to make deficit recovery payments with a net present value of £207m (2017: £131m), over the period to 5 April 2029, in respect of the First UK Bus Pension Scheme. The net present value reflects the current value of deficit recovery payments that would be required to meet the actuarial deficit in full, discounted at 7.3% per annum. The IAS 19 deficit of the scheme at 31 March 2018 is £127.0m (2017: £152.8m). Management consider that, were a pension asset to arise in respect of this scheme, this would be fully recoverable through actions within the Group’s control, in line with the rules of the scheme.
The estimated amounts of employer contributions expected to be paid to the defined benefit schemes during the financial year to 31 March 2019 is £96.0m (year to 31 March 2018: £111.5m).
Risks associated with defined benefit plans:Generally the number of employees in defined benefit plans is reducing rapidly, as these plans are largely closed to new entrants, and in many cases to future accrual. Consequently, the number of defined contribution members is increasing.
The First UK Bus Pension Scheme and the FirstGroup Pension Scheme both closed to future accrual on 5 April 2018. This change will serve to limit the risks associated with defined benefit pension provision by the Group.
Despite remaining open to new entrants and future accrual, the risks posed by the RPS are limited, as under the franchise arrangements, the First Rail TOCs are not responsible for any residual deficit at the end of a franchise. As such, there is only short term cash flow risk within this business.
Notes to the consolidated financial statementscontinued
FirstGroup Annual Report and Accounts 2018152
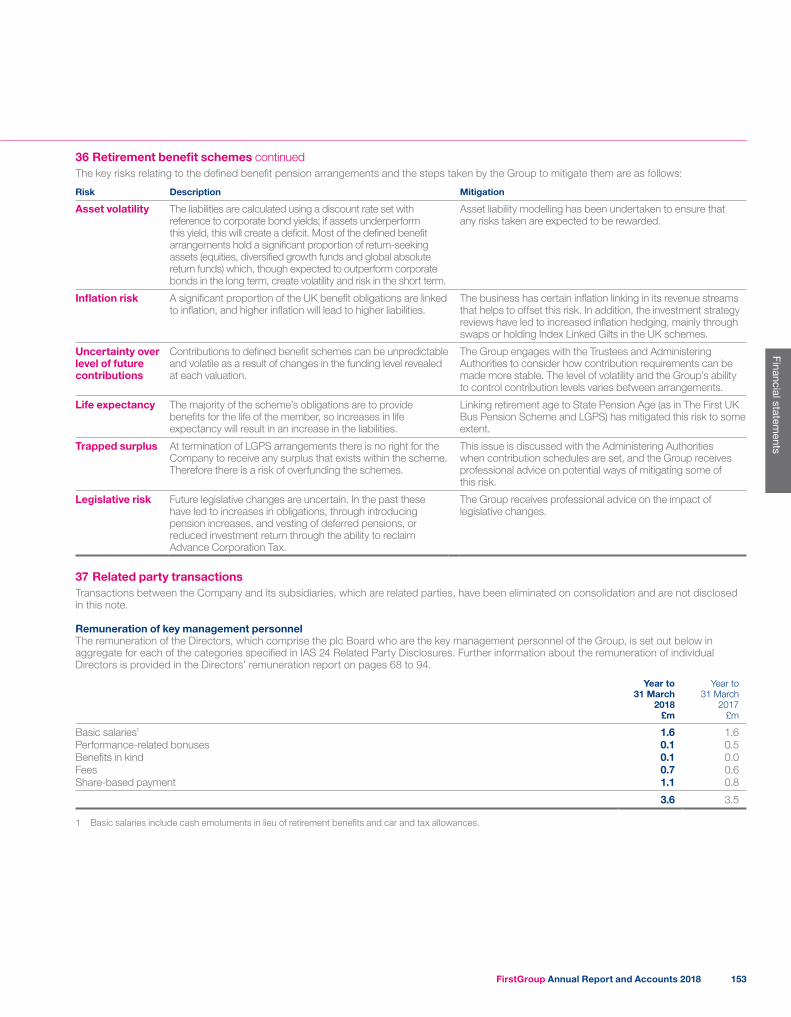
36 Retirement benefit schemes continuedThe key risks relating to the defined benefit pension arrangements and the steps taken by the Group to mitigate them are as follows:
Risk Description Mitigation
Asset volatility The liabilities are calculated using a discount rate set with reference to corporate bond yields; if assets underperform this yield, this will create a deficit. Most of the defined benefit arrangements hold a significant proportion of return-seeking assets (equities, diversified growth funds and global absolute return funds) which, though expected to outperform corporate bonds in the long term, create volatility and risk in the short term.
Asset liability modelling has been undertaken to ensure that any risks taken are expected to be rewarded.
Inflation risk A significant proportion of the UK benefit obligations are linked to inflation, and higher inflation will lead to higher liabilities.
The business has certain inflation linking in its revenue streams that helps to offset this risk. In addition, the investment strategy reviews have led to increased inflation hedging, mainly through swaps or holding Index Linked Gilts in the UK schemes.
Uncertainty over level of future contributions
Contributions to defined benefit schemes can be unpredictable and volatile as a result of changes in the funding level revealed at each valuation.
The Group engages with the Trustees and Administering Authorities to consider how contribution requirements can be made more stable. The level of volatility and the Group’s ability to control contribution levels varies between arrangements.
Life expectancy The majority of the scheme’s obligations are to provide benefits for the life of the member, so increases in life expectancy will result in an increase in the liabilities.
Linking retirement age to State Pension Age (as in The First UK Bus Pension Scheme and LGPS) has mitigated this risk to some extent.
Trapped surplus At termination of LGPS arrangements there is no right for the Company to receive any surplus that exists within the scheme. Therefore there is a risk of overfunding the schemes.
This issue is discussed with the Administering Authorities when contribution schedules are set, and the Group receives professional advice on potential ways of mitigating some of this risk.
Legislative risk Future legislative changes are uncertain. In the past these have led to increases in obligations, through introducing pension increases, and vesting of deferred pensions, or reduced investment return through the ability to reclaim Advance Corporation Tax.
The Group receives professional advice on the impact of legislative changes.
37 Related party transactionsTransactions between the Company and its subsidiaries, which are related parties, have been eliminated on consolidation and are not disclosed in this note.
Remuneration of key management personnelThe remuneration of the Directors, which comprise the plc Board who are the key management personnel of the Group, is set out below in aggregate for each of the categories specified in IAS 24 Related Party Disclosures. Further information about the remuneration of individual Directors is provided in the Directors’ remuneration report on pages 68 to 94.
Year to 31 March
2018 £m
Year to 31 March
2017 £m
Basic salaries1 1.6 1.6Performance-related bonuses 0.1 0.5Benefits in kind 0.1 0.0Fees 0.7 0.6Share-based payment 1.1 0.8
3.6 3.5
1 Basic salaries include cash emoluments in lieu of retirement benefits and car and tax allowances.
FirstGroup Annual Report and Accounts 2018 153
Financial statements
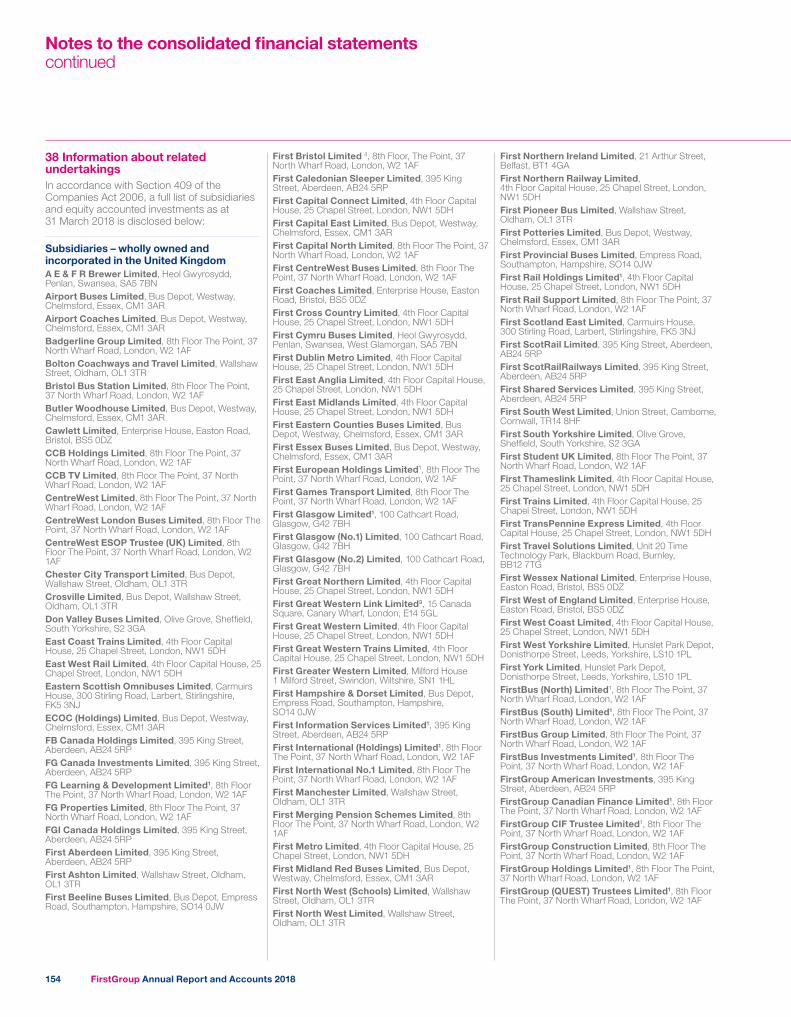
38 Information about related undertakingsIn accordance with Section 409 of the Companies Act 2006, a full list of subsidiaries and equity accounted investments as at 31 March 2018 is disclosed below:
Subsidiaries – wholly owned and incorporated in the United KingdomA E & F R Brewer Limited, Heol Gwyrosydd, Penlan, Swansea, SA5 7BNAirport Buses Limited, Bus Depot, Westway, Chelmsford, Essex, CM1 3ARAirport Coaches Limited, Bus Depot, Westway, Chelmsford, Essex, CM1 3ARBadgerline Group Limited, 8th Floor The Point, 37 North Wharf Road, London, W2 1AFBolton Coachways and Travel Limited, Wallshaw Street, Oldham, OL1 3TRBristol Bus Station Limited, 8th Floor The Point, 37 North Wharf Road, London, W2 1AFButler Woodhouse Limited, Bus Depot, Westway, Chelmsford, Essex, CM1 3ARCawlett Limited, Enterprise House, Easton Road, Bristol, BS5 0DZCCB Holdings Limited, 8th Floor The Point, 37 North Wharf Road, London, W2 1AFCCB TV Limited, 8th Floor The Point, 37 North Wharf Road, London, W2 1AFCentreWest Limited, 8th Floor The Point, 37 North Wharf Road, London, W2 1AFCentreWest London Buses Limited, 8th Floor The Point, 37 North Wharf Road, London, W2 1AFCentreWest ESOP Trustee (UK) Limited, 8th Floor The Point, 37 North Wharf Road, London, W2 1AFChester City Transport Limited, Bus Depot, Wallshaw Street, Oldham, OL1 3TRCrosville Limited, Bus Depot, Wallshaw Street, Oldham, OL1 3TRDon Valley Buses Limited, Olive Grove, Sheffield, South Yorkshire, S2 3GAEast Coast Trains Limited, 4th Floor Capital House, 25 Chapel Street, London, NW1 5DHEast West Rail Limited, 4th Floor Capital House, 25 Chapel Street, London, NW1 5DHEastern Scottish Omnibuses Limited, Carmuirs House, 300 Stirling Road, Larbert, Stirlingshire, FK5 3NJECOC (Holdings) Limited, Bus Depot, Westway, Chelmsford, Essex, CM1 3ARFB Canada Holdings Limited, 395 King Street, Aberdeen, AB24 5RPFG Canada Investments Limited, 395 King Street, Aberdeen, AB24 5RPFG Learning & Development Limited1, 8th Floor The Point, 37 North Wharf Road, London, W2 1AFFG Properties Limited, 8th Floor The Point, 37 North Wharf Road, London, W2 1AFFGI Canada Holdings Limited, 395 King Street, Aberdeen, AB24 5RPFirst Aberdeen Limited, 395 King Street, Aberdeen, AB24 5RPFirst Ashton Limited, Wallshaw Street, Oldham, OL1 3TRFirst Beeline Buses Limited, Bus Depot, Empress Road, Southampton, Hampshire, SO14 0JW
First Bristol Limited 4, 8th Floor, The Point, 37 North Wharf Road, London, W2 1AFFirst Caledonian Sleeper Limited, 395 King Street, Aberdeen, AB24 5RPFirst Capital Connect Limited, 4th Floor Capital House, 25 Chapel Street, London, NW1 5DHFirst Capital East Limited, Bus Depot, Westway, Chelmsford, Essex, CM1 3ARFirst Capital North Limited, 8th Floor The Point, 37 North Wharf Road, London, W2 1AFFirst CentreWest Buses Limited, 8th Floor The Point, 37 North Wharf Road, London, W2 1AFFirst Coaches Limited, Enterprise House, Easton Road, Bristol, BS5 0DZFirst Cross Country Limited, 4th Floor Capital House, 25 Chapel Street, London, NW1 5DHFirst Cymru Buses Limited, Heol Gwyrosydd, Penlan, Swansea, West Glamorgan, SA5 7BNFirst Dublin Metro Limited, 4th Floor Capital House, 25 Chapel Street, London, NW1 5DHFirst East Anglia Limited, 4th Floor Capital House, 25 Chapel Street, London, NW1 5DHFirst East Midlands Limited, 4th Floor Capital House, 25 Chapel Street, London, NW1 5DHFirst Eastern Counties Buses Limited, Bus Depot, Westway, Chelmsford, Essex, CM1 3ARFirst Essex Buses Limited, Bus Depot, Westway, Chelmsford, Essex, CM1 3ARFirst European Holdings Limited1, 8th Floor The Point, 37 North Wharf Road, London, W2 1AFFirst Games Transport Limited, 8th Floor The Point, 37 North Wharf Road, London, W2 1AFFirst Glasgow Limited1, 100 Cathcart Road, Glasgow, G42 7BHFirst Glasgow (No.1) Limited, 100 Cathcart Road, Glasgow, G42 7BHFirst Glasgow (No.2) Limited, 100 Cathcart Road, Glasgow, G42 7BHFirst Great Northern Limited, 4th Floor Capital House, 25 Chapel Street, London, NW1 5DHFirst Great Western Link Limited3, 15 Canada Square, Canary Wharf, London, E14 5GLFirst Great Western Limited, 4th Floor Capital House, 25 Chapel Street, London, NW1 5DHFirst Great Western Trains Limited, 4th Floor Capital House, 25 Chapel Street, London, NW1 5DHFirst Greater Western Limited, Milford House 1 Milford Street, Swindon, Wiltshire, SN1 1HLFirst Hampshire & Dorset Limited, Bus Depot, Empress Road, Southampton, Hampshire, SO14 0JWFirst Information Services Limited1, 395 King Street, Aberdeen, AB24 5RPFirst International (Holdings) Limited1, 8th Floor The Point, 37 North Wharf Road, London, W2 1AFFirst International No.1 Limited, 8th Floor The Point, 37 North Wharf Road, London, W2 1AFFirst Manchester Limited, Wallshaw Street, Oldham, OL1 3TRFirst Merging Pension Schemes Limited, 8th Floor The Point, 37 North Wharf Road, London, W2 1AFFirst Metro Limited, 4th Floor Capital House, 25 Chapel Street, London, NW1 5DHFirst Midland Red Buses Limited, Bus Depot, Westway, Chelmsford, Essex, CM1 3ARFirst North West (Schools) Limited, Wallshaw Street, Oldham, OL1 3TRFirst North West Limited, Wallshaw Street, Oldham, OL1 3TR
First Northern Ireland Limited, 21 Arthur Street, Belfast, BT1 4GAFirst Northern Railway Limited, 4th Floor Capital House, 25 Chapel Street, London, NW1 5DHFirst Pioneer Bus Limited, Wallshaw Street, Oldham, OL1 3TRFirst Potteries Limited, Bus Depot, Westway, Chelmsford, Essex, CM1 3ARFirst Provincial Buses Limited, Empress Road, Southampton, Hampshire, SO14 0JWFirst Rail Holdings Limited1, 4th Floor Capital House, 25 Chapel Street, London, NW1 5DHFirst Rail Support Limited, 8th Floor The Point, 37 North Wharf Road, London, W2 1AFFirst Scotland East Limited, Carmuirs House, 300 Stirling Road, Larbert, Stirlingshire, FK5 3NJFirst ScotRail Limited, 395 King Street, Aberdeen, AB24 5RPFirst ScotRailRailways Limited, 395 King Street, Aberdeen, AB24 5RPFirst Shared Services Limited, 395 King Street, Aberdeen, AB24 5RPFirst South West Limited, Union Street, Camborne, Cornwall, TR14 8HFFirst South Yorkshire Limited, Olive Grove, Sheffield, South Yorkshire, S2 3GAFirst Student UK Limited, 8th Floor The Point, 37 North Wharf Road, London, W2 1AFFirst Thameslink Limited, 4th Floor Capital House, 25 Chapel Street, London, NW1 5DHFirst Trains Limited, 4th Floor Capital House, 25 Chapel Street, London, NW1 5DHFirst TransPennine Express Limited, 4th Floor Capital House, 25 Chapel Street, London, NW1 5DHFirst Travel Solutions Limited, Unit 20 Time Technology Park, Blackburn Road, Burnley, BB12 7TGFirst Wessex National Limited, Enterprise House, Easton Road, Bristol, BS5 0DZFirst West of England Limited, Enterprise House, Easton Road, Bristol, BS5 0DZFirst West Coast Limited, 4th Floor Capital House, 25 Chapel Street, London, NW1 5DHFirst West Yorkshire Limited, Hunslet Park Depot, Donisthorpe Street, Leeds, Yorkshire, LS10 1PLFirst York Limited, Hunslet Park Depot, Donisthorpe Street, Leeds, Yorkshire, LS10 1PLFirstBus (North) Limited1, 8th Floor The Point, 37 North Wharf Road, London, W2 1AFFirstBus (South) Limited1, 8th Floor The Point, 37 North Wharf Road, London, W2 1AFFirstBus Group Limited, 8th Floor The Point, 37 North Wharf Road, London, W2 1AFFirstBus Investments Limited1, 8th Floor The Point, 37 North Wharf Road, London, W2 1AFFirstGroup American Investments, 395 King Street, Aberdeen, AB24 5RPFirstGroup Canadian Finance Limited1, 8th Floor The Point, 37 North Wharf Road, London, W2 1AFFirstGroup CIF Trustee Limited1, 8th Floor The Point, 37 North Wharf Road, London, W2 1AFFirstGroup Construction Limited, 8th Floor The Point, 37 North Wharf Road, London, W2 1AFFirstGroup Holdings Limited1, 8th Floor The Point, 37 North Wharf Road, London, W2 1AFFirstGroup (QUEST) Trustees Limited1, 8th Floor The Point, 37 North Wharf Road, London, W2 1AF
Notes to the consolidated financial statementscontinued
FirstGroup Annual Report and Accounts 2018154
38 Information about related undertakings continuedFirstGroup US Finance Limited1, 395 King Street, Aberdeen, AB24 5RPFirstGroup US Holdings, 395 King Street, Aberdeen, AB24 5RPFleetrisk Management Limited, Olive Grove, Sheffield, South Yorkshire, S2 3GAG.E. Mair Hire Services Limited, 395 King Street, Aberdeen, AB24 5RPG.A.G. Limited1, Enterprise House, Easton Road, Bristol, BS5 0DZGB Extended Ventures Limited, 4th Floor Capital House, 25 Chapel Street, London, NW1 5DHGB Railways Group Limited1, 4th Floor Capital House, 25 Chapel Street, London, NW1 5DHGB Railways Limited, 4th Floor Capital House, 25 Chapel Street, London, NW1 5DHGMBN Employees’ Share Scheme Trustee Limited, Bus Depot, Wallshaw Street, Oldham, Lancashire, OL1 3TRGreat Western Holdings Limited1, Milford House, 1 Milford Street, Swindon, SN1 1HLGreat Western Trains Company Limited3, 15 Canada Square, Canary Wharf, London, E14 5GLGreat Western Trustees Limited, Milford House, 1 Milford Street, Swindon, SN1 1HLGrenville Motors Limited, 8th Floor The Point, 37 North Wharf Road, London, W2 1AFGreyhound Limited, 8th Floor The Point, 37 North Wharf Road, London, W2 1AFGreyhound UK Limited, 8th Floor The Point, 37 North Wharf Road, London, W2 1AFGRT Bus Group Limited1, 395 King Street, Aberdeen, AB24 5RPGurna Limited, Bus Depot, Westway, Chelmsford, Essex, CM1 3ARHalesworth Transit Limited, Bus Depot, Westway, Chelmsford, Essex, CM1 3ARHampshire Books Limited, Empress Road, Southampton, Hampshire, SO14 0JWHorizon Trains Limited, 4th Floor Capital House, 25 Chapel Street, London, NW1 5DHHull Trains Company Limited, 4th Floor Europa House, 184 Ferensway, Hull, HU1 3UTIndexbegin Limited, Hunslet Park Depot, Donisthorpe Street, Leeds, Yorkshire, LS10 1PLKCB Limited, 100 Cathcart Road, Glasgow, G42 7BHKelvin Central Buses Limited, 100 Cathcart Road, Glasgow, G42 7BHKelvin Scottish Omnibuses Limited, 100 Cathcart Road, Glasgow, G42 7BHKirkpatrick of Deeside Limited, 395 King Street, Aberdeen, AB24 5RPLynton Bus & Coach Limited, Bus Depot, Westway, Chelmsford, Essex, CM1 3ARLynton Company Services Limited, Bus Depot, Westway, Chelmsford, Essex, CM1 3ARMainline ESOP Trustees (No 1) Limited, Olive Grove, Sheffield, South Yorkshire, S2 3GAMainline ESOP Trustees (No 2) Limited, Olive Grove, Sheffield, South Yorkshire, S2 3GAMainline Partnership Limited1, Olive Grove, Sheffield, South Yorkshire, S2 3GAMainline Partnership Pension Trustees Limited, 8th Floor The Point, 37 North Wharf Road, London, W2 1AFMainline Employees’ Shareholding Trustees Limited, Olive Grove, Sheffield, South Yorkshire, S2 3GA
Midland Bluebird Limited, Carmuirs House, 300 Stirling Road Larbert, Stirlingshire, FK5 3NJMidland Travellers Limited, Hunslet Park Depot, Donisthorpe Street, Leeds, Yorkshire, LS10 1PLNorth Devon Limited, 8th Floor The Point, 37 North Wharf Road, London, W2 1AFNorth Western Trains Company Limited3, 15 Canada Square Canary Wharf, London, E14 5GLNorthampton Transport Limited, Bus Depot, Westway, Chelmsford, Essex, CM1 3ARPortsmouth Transit Limited, Empress Road, Southampton, Hampshire, SO14 0JWQuickstep Travel Limited, Hunslet Park Depot, Donisthorpe Street, Leeds, Yorkshire, LS10 1PLReiver Ventures Properties Limited, Carmuirs House, 300 Stirling Road, Larbert, Stirlingshire, FK5 3NJReiver Ventures Limited, Carmuirs House, 300 Stirling Road, Larbert, Stirlingshire, FK5 3NJReynard Buses Limited, Hunslet Park Depot, Donisthorpe Street, Leeds, Yorkshire, LS10 1PLRider Holdings Limited, Hunslet Park Depot, Donisthorpe Street, Leeds, Yorkshire, LS10 1PLRider Travel Limited, Hunslet Park Depot, Donisthorpe Street, Leeds, Yorkshire, LS10 1PLS Turner & Sons Limited, Bus Depot, Westway, Chelmsford, Essex, CM1 3ARScott’s Hospitality Limited, 8th Floor The Point, 37 North Wharf Road, London, W2 1AFSheafline (S.U.T.) Limited, Olive Grove, Sheffield, South Yorkshire, S2 3GASheffield & District Traction Company Limited, Olive Grove, Sheffield, South Yorkshire, S2 3GASheffield United Transport Limited,Olive Grove, Sheffield, South Yorkshire, S2 3GASkillplace Training Limited, Heol Gwyrosydd, Penlan, Swansea, West Glamorgan, SA5 7BNSmiths of Portland Limited, Enterprise House, Easton Road, Bristol, BS5 0DZSMT Omnibuses Limited, Carmuirs House, 300 Stirling Road, Larbert, Stirlingshire, FK5 3NJSouthampton CityBus Limited, Empress Road, Southampton, Hampshire, SO14 0JWSouthampton City Transport Company Limited, Empress Road, Southampton, Hampshire, SO14 0JWSovereign Quay Limited, 8th Floor The Point, 37 North Wharf Road, London, W2 1AFStrathclyde Buses Limited, 100 Cathcart Road, Glasgow, G42 7BHStreamline Buses (Bath) Limited1, Enterprise House, Easton Road, Bristol, BS5 0DZTaylors Coaches Limited, Enterprise House, Easton Road, Bristol, BS5 0DZThe FirstGroup Pension Scheme Trustee Limited, 8th Floor The Point, 37 North Wharf Road, London, W2 1AFThe FirstGroup Scottish Pension Scheme Trustee Limited, 8th Floor The Point, 37 North Wharf Road, London, W2 1AFThe First South & Wales Pension Scheme Trustee Limited, 8th Floor The Point, 37 North Wharf Road, London, W2 1AFThe First UK Bus Pension Scheme Trustee Limited, 8th Floor The Point, 37 North Wharf Road, London, W2 1AFThe New Great Eastern Railway Company Limited1, 4th Floor Capital House, 25 Chapel Street, London, NW1 5DHTotaljourney Limited1, 4th Floor Capital House, 25 Chapel Street, London, NW1 5DH
Tram Operations Limited, Tramlink Depot, Coomber Way, Croydon, CR0 4TQTransportation Claims Limited, 8th Floor The Point, 37 North Wharf Road, London, W2 1AFTruronian Limited, 8th Floor The Point, 37 North Wharf Road, London, W2 1AFWessex of Bristol Limited, Enterprise House, Easton Road, Bristol, BS5 0DZWest Dorset Coaches Limited, Enterprise House, Easton Road, Bristol, BS5 0DZWestern National Holdings Limited, 8th Floor The Point, 37 North Wharf Road, London, W2 1AF
Subsidiaries – wholly owned and incorporated in the United States of AmericaAmericanos USA, LLC, 350 N. St. Paul Street, Dallas, TX 75201ATE Management of Duluth, 600 Vine Street, Suite 1400, Cincinnati, Ohio 45202Atlantic Greyhound Lines of Virginia, Inc. 350 N. St. Paul Street, Dallas, TX 75201Berkshire Transit Management, Inc. 600 Vine Street, Suite 1400, Cincinnati, Ohio 45202Central Mass Transit Management Co, Inc. 287 Grove St, Worcester, MA 01606Central Virginia Transit Management, Inc. 600 Vine Street, Suite 1400, Cincinnati, Ohio 45202Champion City Transit Management, Inc. 600 Vine Street, Suite 1400, Cincinnati, Ohio 45202Durham City Transit Company, 600 Vine Street, Suite 1400, Cincinnati, Ohio 45202 First DG, Inc. 600 Vine Street, Suite 1400, Cincinnati, Ohio 45202FirstGroup Investment Corporation, 600 Vine Street, Suite 1400, Cincinnati, Ohio 45202First Management Services LLC, 600 Vine Street, Suite 1400, Cincinnati, Ohio 45202First Mile Square LLC, 600 Vine Street, Suite 1400, Cincinnati, Ohio 45202First Student Management Services LLC, 600 Vine Street, Suite 1400, Cincinnati, Ohio 45202First Student, Inc. 600 Vine Street, Suite 1400, Cincinnati, Ohio 45202First Transit, Inc. 600 Vine Street, Suite 1400, Cincinnati, Ohio 45202First Transit Rail Services of MD, LLC. 600 Vine Street, Suite 1400, Cincinnati, Ohio 45202First Transit Rail Services of TX, LLC. 600 Vine Street, Suite 1400, Cincinnati, Ohio 45202First Vehicle Services, Inc. 600 Vine Street, Suite 1400, Cincinnati, Ohio 45202FirstGroup America Holdings, Inc. 600 Vine Street, Suite 1400, Cincinnati, Ohio 45202FirstGroup America, Inc. 600 Vine Street, Suite 1400, Cincinnati, Ohio 45202FirstGroup International, Inc. 2221 E Lamar Blvd, Suite 500, Arlington, TX, 76007Franklin Transit Management, Inc. 600 Vine Street, Suite 1400, Cincinnati, Ohio 45202GLI Corporate Risk Solutions, Inc. 350 N. St. Paul Street, Dallas, TX 75201Greyhound Lines, Inc. 350 N. St. Paul Street, Dallas, TX 75201H.N.S. Management Company, Inc. 600 Vine Street, Suite 1400, Cincinnati, Ohio 45202Laidlaw International Finance, Inc. 600 Vine Street, Suite 1400, Cincinnati, Ohio 45202
FirstGroup Annual Report and Accounts 2018 155
Financial statements
38 Information about related undertakings continuedLaidlaw Medical Holdings, Inc. 600 Vine Street, Suite 1400, Cincinnati, Ohio 45202Laidlaw Transportation Holdings, Inc. 600 Vine Street, Suite 1400, Cincinnati, Ohio 45202Laidlaw Transportation Management, Inc. 600 Vine Street, Suite 1400, Cincinnati, Ohio 45202Laidlaw Transportation, Inc. 600 Vine Street, Suite 1400, Cincinnati, Ohio 45202Laidlaw Two, Inc. Corporation Trust Center, 1209 Orange Street, Wilmington, DE 19801Laredo Transit Management, Inc. 2221 E Lamar Blvd, Suite 500, Arlington, TX, 76007LSX Delivery, LLC, 350 N. St. Paul Street, Dallas, TX 75201Merrimack Valley Area Transportation, Inc. 600 Vine Street, Suite 1400, Cincinnati, Ohio 45202 MidSouth Transportation Management, Inc. 600 Vine Street, Suite 1400, Cincinnati, Ohio 45202National Insurance and Indemnity Corporation, 30 Main Street, Suite 330, Burlington, VT 05401On Time Delivery Service, Inc. 350 N. St. Paul Street, Dallas, TX 75201Paratransit Brokerage Services TM, Inc. 287 Grove Street, Worchester, MA 01606Paratransit Management of Berkshire, Inc. 600 Vine Street, Suite 1400, Cincinnati, Ohio 45202Safe Ride Services, Inc. 600 Vine Street, Suite 1400, Cincinnati, Ohio 45202Shuttle Services M.I.A., Inc. 600 Vine Street, Suite 1400, Cincinnati, Ohio 45202South Coast Transit Management, Inc. 600 Vine Street, Suite 1400, Cincinnati, Ohio 45202Southwestern Virginia Transit Management, Inc. 600 Vine Street, Suite 1400, Cincinnati, Ohio 45202Special Transportation Services, Inc. 600 Vine Street, Suite 1400, Cincinnati, Ohio 45202Springfield Area Transit Company, Inc. 600 Vine Street, Suite 1400, Cincinnati, Ohio 45202SuTran, Inc. 600 Vine Street, Suite 1400, Cincinnati, Ohio 45202Transit Management of Abilene, Inc. 600 Vine Street, Suite 1400, Cincinnati, Ohio 45202Transit Management of Ada County, Inc. 600 Vine Street, Suite 1400, Cincinnati, Ohio 45202Transit Management of Alexandria, Inc. 600 Vine Street, Suite 1400, Cincinnati, Ohio 45202Transit Management of Ashville, Inc. 600 Vine Street, Suite 1400, Cincinnati, Ohio 45202Transit Management of Canyon County, Inc. 600 Vine Street, Suite 1400, Cincinnati, Ohio 45202Transit Management of Central Maryland, Inc. 600 Vine Street, Suite 1400, Cincinnati, Ohio 45202Transit Management of Denton, Inc. 600 Vine Street, Suite 1400, Cincinnati, Ohio 45202Transit Management of Dutchess County, Inc. 600 Vine Street, Suite 1400, Cincinnati, Ohio 45202Transit Management of Montgomery, Inc. 600 Vine Street, Suite 1400, Cincinnati, Ohio 45202
Transit Management of Racine, Inc. 600 Vine Street, Suite 1400, Cincinnati, Ohio 45202Transit Management of Richland, Inc. 600 Vine Street, Suite 1400, Cincinnati, Ohio 45202Transit Management of Rocky Mount, Inc. 600 Vine Street, Suite 1400, Cincinnati, Ohio 45202Transit Management of Sherman, Inc. 600 Vine Street, Suite 1400, Cincinnati, Ohio 45202
Transit Management of Spartanburg, Inc. 600 Vine Street, Suite 1400, Cincinnati, Ohio 45202Transit Management of St Joseph, Inc. 600 Vine Street, Suite 1400, Cincinnati, Ohio 45202Transit Management of Wilmington, Inc. 600 Vine Street, Suite 1400, Cincinnati, Ohio 45202Valley Area Transit Company, Inc. 350 N. St. Paul Street, Dallas, TX 75201Valley Garage Co, 350 N. St. Paul Street, Dallas, TX 75201Valley Transit Co, Inc. 350 N. St. Paul Street, Dallas, TX 75201
Subsidiaries – not wholly owned but incorporated in the United States of AmericaDG 21 LLC (51%), 600 Vine Street, Suite 1400, Cincinnati, Ohio 45202SYPS LLC (87.5%), 600 Vine Street, Suite 1400, Cincinnati, Ohio 45202Transportation Realty Income Partners Limited Partnership (50%), 600 Vine Street Suite 1400, Cincinnati, Ohio 45202
Subsidiary – wholly owned and incorporated in US Virgin IslandsPrimaisla, Inc. 1 Estate Hope, St. Croix, Virgin Islands
Subsidiaries – wholly owned and incorporated in IrelandAeroporto Limited, 25-28 North Wall Quay, Dublin FirstGroup Treasury Finance (Ireland) DAC, Airport Business Park, Dublin Airport, Dublin Last Passive Limited, 25–28 North Wall Quay, Dublin
Subsidiary – wholly owned and incorporated in IndiaTransit Operations India Private Limited, Lentin Chambers, 2nd Floor, Dalal Street, Fort Mumbai 400023
Subsidiary – wholly owned and incorporated in PanamaFirst Transit de Panama, Inc. Morgan & Morgan, Costa del Este, MMG Tower, 23rd Floor, Panama City
Subsidiaries – wholly owned and incorporated in CanadaAutobus Transco (1988) Limited, Blake, Cassels & Graydon LLP, 1 Place Ville Marie, Suite 3000, Montreal, QCFC Investment Limited, Blake, Cassels & Graydon LLP, 3500, 855 – 2 Street SW, Calgary, Alberta, T2P 4J8FirstCanada ULC, Blake, Cassels & Graydon LLP, 3500, 855 – 2 Street SW, Calgary, AB, T2P 4J8GCT Holdings Limited, Blake, Cassels & Graydon LLP, 3500, 855 – 2 Street SW, Calgary, Alberta, T2P 4J8GCT Investment Limited Partnership, Blake, Cassels & Graydon LLP, 3500, 855 – 2 Street SW, Calgary, Alberta, T2P 4J8Gray Coach Travel, Inc. 600 Vine Street, Suite 1400, Cincinnati, Ohio 45202Greyhound Canada Transportation ULC, Blake, Cassels & Graydon LLP, 595 Burrard Street, P.O. Box 49314, Suite 2600, Three Bentall Centre, Vancouver, BC V7X 1L3
Greyhound Courier Express Limited, Blake, Cassels & Graydon LLP, 595 Burrard Street, P.O. Box 49314, Suite 2600, Three Bentall Centre, Vancouver, BC V7X 1L3Manhattan Equipment Supply Company Limited, 1111 International Blvd, Suite 700, Burlington, ON, L7L 6W1
Subsidiary not wholly owned but incorporated in CanadaGreyhound and Coach Canada Terminal Operation Limited (50%), 130 King Street West, #1600, Toronto, ON, M5X 1J5
Subsidiaries – wholly owned and incorporated in Puerto RicoFirst Transit of Puerto Rico, Inc. 600 Vine Street, Suite 1400, Cincinnati, Ohio 45202First Transit Rail of Puerto Rico, Inc. 361 San Francisco Street, San Juan, Puerto Rico
Subsidiary – wholly owned and incorporated in MexicoGreyhound Lines Mexico, S.A. de R.L. de C.V. 350 N. St. Paul Street, Dallas, TX 75201
Subsidiaries not wholly owned but incorporated in the United KingdomCareroute Limited (80%), Empress Road, Southampton, Hampshire, SO14 0JWFirst/Keolis Holdings Limited (55%)1, 4th Floor Capital House, 25 Chapel Street, London, NW1 5DHFirst/Keolis TransPennine Holdings Limited (55%), 4th Floor Capital House, 25 Chapel Street, London, NW1 5DHFirst/Keolis TransPennine Limited (55%), 4th Floor Capital House, 25 Chapel Street, London, NW1 5DHFirst MTR South Western Trains Limited (70%), 4th Floor Capital House, 25 Chapel Street, London, NW1 5DHFirst Trenitalia East Midlands Rail Limited (70%), 4th Floor Capital House, 25 Chapel Street, London, NW1 5DHFirst Trenitalia West Coast Rail Limited (70%), 4th Floor Capital House, 25 Chapel Street, London, NW1 5DHPTI Website Limited (20%)1, 8th Floor The Point, 37 North Wharf Road, London, W2 1AFLeicester CityBus Limited (94%)2, Bus Depot, Westway, Chelmsford, Essex, CM1 3ARLCB Engineering Limited (94%), Bus Depot, Westway, Chelmsford, Essex, CM1 3ARLeicester CityBus Benefits Limited (94%), Bus Depot, Westway, Chelmsford, Essex, CM1 3ARNicecon Limited (50%), 395 King Street, Aberdeen, AB24 5RPSomerset Passenger Solutions Limited (50%), Somerset Energy Innovation Centre, Woodlands Business Park, Bristol Road, Bridgwater, Somerset, TA6 4FJ
1 Directly owned by FirstGroup plc.
2 All shares held in subsidiary undertakings are ordinary shares, with the exception of Leicester CityBus Limited where the Group owns 100% of its redeemable cumulative preference shares and 94% of its ordinary shares.
3 In liquidation.
4 On 11 May 2018 First Bristol Limited changed its name to First Bus Central Services Limited.
Notes to the consolidated financial statementscontinued
FirstGroup Annual Report and Accounts 2018156
OpinionIn our opinion:
■■ the financial statements give a true and fair view of the state of the Group’s and of the Parent Company’s affairs as at 31 March 2018 and of the Group’s loss for the year then ended;
■■ the Group financial statements have been properly prepared in accordance with International Financial Reporting Standards (IFRSs) as adopted by the European Union;
■■ the Parent Company financial statements have been properly prepared in accordance with United Kingdom Generally Accepted Accounting Practice, including FRS 101 “Reduced Disclosure Framework”; and
■■ the financial statements have been prepared in accordance with the requirements of the Companies Act 2006 and, as regards the Group financial statements, Article 4 of the IAS Regulation.
We have audited the financial statements of FirstGroup plc (the ‘Parent Company’) and its subsidiaries (the ‘Group’) which comprise:
■■ the Consolidated income statement;■■ the Consolidated statement of comprehensive income;■■ the Consolidated and Parent Company balance sheets;■■ the Consolidated cash flow statement;■■ the Consolidated and Parent Company statements of changes in equity; and■■ the related notes 1 to 38 of the Consolidated results and 1 to 10 of the Parent Company results.
The financial reporting framework that has been applied in the preparation of the Group financial statements is applicable law and IFRSs as adopted by the European Union. The financial reporting framework that has been applied in the preparation of the Parent Company financial statements is applicable law and United Kingdom Accounting Standards (United Kingdom Generally Accepted Accounting Practice), including FRS 101 “Reduced Disclosure Framework”.
Basis for opinionWe conducted our audit in accordance with International Standards on Auditing (UK) (ISAs (UK)) and applicable law. Our responsibilities under those standards are further described in the auditor’s responsibilities for the audit of the financial statements section of our report.
We are independent of the Group and the Parent Company in accordance with the ethical requirements that are relevant to our audit of the financial statements in the UK, including the Financial Reporting Council’s (FRC’s) Ethical Standard as applied to listed public interest entities, and we have fulfilled our other ethical responsibilities in accordance with these requirements. We confirm that the non-audit services prohibited by the FRC’s Ethical Standard were not provided to the Group or the Parent Company.
We believe that the audit evidence we have obtained is sufficient and appropriate to provide a basis for our opinion.
Independent auditor’s report to the members of FirstGroup plc
FirstGroup Annual Report and Accounts 2018 157
Financial statements
Summary of our audit approach
Key audit matters The key audit matters that we identified in the current year were:
■■ Accounting for rail franchise contracts, including the forecast profitability of the TransPennine Express (“TPE”) and Great Western Railway (“GWR”) franchises, and the recognition of certain performance related amounts at GWR and South Western Railway (“SWR”) receivable under the franchise contracts.
■■ The assessment of the carrying value of First Student and Greyhound goodwill;
■■ Valuation and completeness of individually material and incurred but not reported claims forming part of the self-insurance provision in North America;
■■ Valuation of pension scheme liabilities; and
■■ Accuracy of material manual adjustments to revenue recognition at First Student and First Transit.
Materiality The materiality that we used for the Group financial statements was £7.5 million which was determined on the basis of 5.4% of loss before tax adjusted for intangible amortisation, bond ‘make whole’ costs, impairment charges and TPE onerous contract provisioning.
Scoping We performed full scope audit procedures at each of the five operating divisions as well as certain Group central functions. These components account for over 95% of the Group’s net assets, revenue, and operating profit.
Significant changes in our approach
Our audit approach for the current year included the following changes, as compared to our audit of the prior year:
■■ The inclusion of SWR within the scope of our audit following the commencement of the franchise in August 2017.
■■ The key audit matter relating to the carrying value of goodwill was expanded at the planning stage of our audit to include Greyhound due to reduced forecast performance. This key audit matter was also specifically focused on the forecast cash flows in the current year.
■■ The key audit matter relating to the self-insurance provision in North America was focused on the valuation of individually material claims, and the incurred but not reported claims as well as the discount rate applied.
■■ The revenue recognition key audit matter in the current year is specific to the accuracy of material manual adjustments to revenue in First Student and First Transit, as opposed to the whole group as in the prior year.
■■ In the current year we have revisited our materiality calculation as the forecast results of the Group were revised. We have also updated our approach to exclude the impact of bond make whole costs, impairments and TPE onerous contract provisioning.
Independent auditor’s report to the members of FirstGroup plccontinued
FirstGroup Annual Report and Accounts 2018158
Conclusions relating to going concern, principal risks and viability statement
Going concernWe have reviewed the directors’ statement on page 44 about whether they considered it appropriate to adopt the going concern basis of accounting in preparing them and their identification of any material uncertainties to the Group’s and Parent Company’s ability to continue to do so over a period of at least twelve months from the date of approval of the financial statements.
We are required to state whether we have anything material to add or draw attention to in relation to that statement required by Listing Rule 9.8.6R(3) and report if the statement is materially inconsistent with our knowledge obtained in the audit.
We confirm that we have nothing material to report, add or draw attention to in respect of these matters.
Principal risks and viability statementBased solely on reading the directors’ statements and considering whether they were consistent with the knowledge we obtained in the course of the audit, including the knowledge obtained in the evaluation of the directors’ assessment of the Group’s and the Parent Company’s ability to continue as a going concern, we are required to state whether we have anything material to add or draw attention to in relation to:
■■ the disclosures on pages 34-39 that describe the principal risks and explain how they are being managed or mitigated;■■ the directors’ confirmation on page 44 that they have carried out a robust assessment of the principal risks facing the Group, including those that would threaten its business model, future performance, solvency or liquidity; or
■■ the directors’ explanation on page 44 as to how they have assessed the prospects of the Group, over what period they have done so and why they consider that period to be appropriate, and their statement as to whether they have a reasonable expectation that the Group will be able to continue in operation and meet its liabilities as they fall due over the period of their assessment, including any related disclosures drawing attention to any necessary qualifications or assumptions.
We are also required to report whether the directors’ statement relating to the prospects of the Group required by Listing Rule 9.8.6R(3) is materially inconsistent with our knowledge obtained in the audit.
We confirm that we have nothing material to report, add or draw attention to in respect of these matters.
FirstGroup Annual Report and Accounts 2018 159
Financial statements
Key audit mattersKey audit matters are those matters that, in our professional judgement, were of most significance in our audit of the financial statements of the current period and include the most significant assessed risks of material misstatement (whether or not due to fraud) that we identified. These matters included those which had the greatest effect on: the overall audit strategy, the allocation of resources in the audit; and directing the efforts of the engagement team.
These matters were addressed in the context of our audit of the financial statements as a whole, and in forming our opinion thereon, and we do not provide a separate opinion on these matters.
Accounting for rail franchise contracts
Key audit matter description
The Group operates a number of complex rail franchise contracts. Judgement is required in the evaluation of the overall profitability of the franchise contracts and whether they are onerous and as such require provision for future losses.
GWR and TPE franchise profitabilityThis judgement includes consideration of the key assumptions regarding passenger revenue growth, costs, the impact of major infrastructure work, electrification and resignalling, introduction of new trains and negotiations with industry partners.
GWR and SWR Performance related amountsJudgement is also required in relation to the timing of recognition of certain performance related amounts the Group is entitled to receive under franchise contracts but the valuation of which was not finalised as at the year end.
Management has highlighted contract and franchise accounting as a key source of estimation uncertainty in note 2 to the consolidated financial statements and the Audit Committee has identified this as a Significant Issue or Judgement in their report.
How the scope of our audit responded to the key audit matter
The audit procedures we performed in respect of the key audit matter included:
GWR and TPE franchise profitability
■■ Walking through the process undertaken by Management in estimating the forecast profitability and the design and implementation of key controls;
■■ Challenging Management to understand the key drivers forming the basis of the franchise profitability forecasts; ■■ Reviewing and challenging Management’s key assumptions by reference to independent industry sources and relevant supporting evidence and sensitising the impact these have on management’s assessment of the profitability of the two contracts;
■■ Recalculating the relevant forecasts;■■ Assessing and challenging Management’s expected range of possible outcomes; and■■ Reviewing the related financial statement disclosures.
Performance related amounts in GWR and SWR
■■ Gaining an understanding of Management’s process for recognising performance related amounts and the calculation of any amount to be deferred and assessing the design and implementation of key controls;
■■ Reviewing the calculations performed by Management and the correspondence with industry partners;■■ Assessing the appropriateness of the treatment of performance regime compensation recognised in the income statement and deferred on the balance sheet.
Key observations The results of our procedures were satisfactory and we concur with the judgements made and the resulting accounting for rail franchise contracts, noting the following observations:
GWR and TPE franchise profitabilityWe concluded based on the available evidence that:
■■ Management’s assessment that the GWR franchise contract will remain profitable, and that no onerous contract provision is required is reasonable;
■■ The onerous contract provision of £106.3 million recorded by Management in respect of TPE is reasonable.
Performance related amounts in GWR and SWR
We concluded that performance related amounts recognised in the income statement during the year and deferred on the balance sheet at year end are reasonable.
Independent auditor’s report to the members of FirstGroup plccontinued
FirstGroup Annual Report and Accounts 2018160
Forecast margin used in the valuation of First Student and Greyhound goodwill (£1,138 million)
Key audit matter description
The assessment of the carrying value of goodwill, as described in note 2, involves judgement in relation to forecasting future cash flows. At the planning stage of our audit we identified the Cash Generating Units (CGU) most sensitive to variation in future cash flows to be the First Student CGU (£1,137.6 million; 2017: £1,271.1 million) and Greyhound CGU (£nil; 2017: £291.9 million), as disclosed in note 11 to the financial statements.
In the current year we focused on the forecast margin within Management’s discounted cash flow model given this is the area where the most significant judgement is required.
Headroom for First Student has decreased in reported sterling from £709.2 million at 31 March 2017 to £662.5 million at 31 March 2018.
An impairment loss of £277.3 million has been recognised as the recoverable amount calculated by Management was less than the carrying value of the Greyhound CGU. The impairment loss of £260.6 million was first allocated to Goodwill, which has been fully written down, and the remaining impairment loss of £16.7 million was allocated to the other tangible and intangible assets of the CGU on a pro rata basis according to the carrying amount of each asset in the CGU.
Management has highlighted impairment of intangible assets (including goodwill) as a key source of estimation uncertainty in note 2.
The Audit Committee report on page 65 refers to the carrying value of First Student and Greyhound goodwill as one of the significant issues and judgements considered by the Audit Committee.
How the scope of our audit responded to the key audit matter
The audit procedures we performed in respect of this key audit matter included:
■■ gaining an understanding of Management’s process for developing their impairment models and assessing the design and implementation of key controls;
■■ agreeing the underlying forecasts to the Board approved three year plan;■■ meeting with Divisional Management teams to understand and challenge forecasts in detail;■■ testing the underlying assumptions within the cash flow projections impacting the forecast margin including estimates around contract retention at First Student and passenger revenue growth and cost assumptions at Greyhound by reference to third party data;
■■ challenging the terminal growth and discount rate assumptions used within the impairment models by reference to market data;
■■ assessing cash flow projections with reference to historical trading performance and forecasting accuracy;■■ considering the reasonableness of, and recalculating, the sensitivity assessment applied by Management;■■ performing further independent sensitivity analysis on the impairment model; and■■ considering the appropriateness of the disclosure on reasonably possible changes.
Key observations We concluded that taken together the assumptions applied in the final impairment models are reasonable. We consider the disclosure around the sensitivity to be proportionate to the level of judgement.
FirstGroup Annual Report and Accounts 2018 161
Financial statements
Valuation of the self-insurance provision in North America (£311 million)
Key audit matter description
The underlying calculation of the North American self-insurance reserves is subject to judgement based on the volume and severity of claims. We have identified a key audit matter in relation to the valuation of the individually material claims within the North American self-insurance provision and the estimated value of incurred but not reported (“IBNR”) claims as well as the discount rate applied.
Management has highlighted self-insurance provisioning as a key source of estimation uncertainty in note 2 to the consolidated financial statements.
The Audit Committee report on page 65 refers to North America self-insurance provisions as one of the significant issues and judgements considered by the Audit Committee. The provision is disclosed in note 26 to the consolidated financial statements.
How the scope of our audit responded to the key audit matter
The audit procedures we performed in respect of this key audit matter included:
■■ gaining an understanding of Management’s process for developing the North American self-insurance reserves, including how Management ensures the completeness of IBNR claims, and assessing the design and implementation of key controls;
■■ meeting with the Management and their external actuary to challenge key assumptions;■■ working with our actuarial specialists in North America to independently develop an actuarial calculation and comparing the provision recorded to the actuarial range calculated by Management and their external actuary, considering the methodologies employed and comparing assumptions used to the Group’s historical experience; and
■■ challenging the appropriateness of the discount rate used through comparison to market rates.
Key observations We are satisfied that the assumptions used are reasonable and that the valuation of the North American self-insurance reserve is reasonable.
Valuation of pension scheme liabilities (£6,139 million)
Key audit matter description
The Group operates in a labour intensive industry with large membership to a number of defined benefit pension schemes. The valuation of gross pension liabilities, as disclosed in note 36 is materially sensitive to changes in the underlying assumptions adopted in respect of the discount, inflation, and mortality rates.
Management has highlighted defined benefit pension arrangements as a key source of estimation uncertainty in note 2 to the consolidated financial statements.
The Audit Committee report on page 65 refers to Pensions as one of the significant issues and judgements considered by the Audit Committee.
How the scope of our audit responded to the key audit matter
The audit procedures we performed in respect of this key audit matter included:
■■ gaining an understanding of Management’s process for determining the underlying assumptions and assessing the design and implementation of key controls;
■■ working with our actuarial specialists to test the estimates determined by Management and its external actuary considering the methodologies employed and comparing assumptions used to the Group’s historical experience and to listed and industry benchmarks; and
■■ challenging the appropriateness of the discount, inflation and mortality rates used through comparison to those used by similar entities.
Key observations We are satisfied that taken together the assumptions applied in respect of the valuation of the liabilities are reasonable and that the valuation of the pension scheme liabilities is reasonable. We consider the disclosure around the sensitivity of the liabilities to reasonably possible change to be proportionate to the level of judgement.
Independent auditor’s report to the members of FirstGroup plccontinued
FirstGroup Annual Report and Accounts 2018162
Accuracy of material manual adjustments to revenue recognition processes
Key audit matter description
As described in the Significant accounting policies in note 2 revenue transactions across the Group are predominantly high volume and low value. In some instances, revenue recorded may be subject to manual adjustments to reflect the timing and valuation of revenue recognised, for example where amounts are unbilled at the year end.
The accuracy of recording any such material manual adjustments to revenue represents a key risk of material misstatement to revenue due to fraud. This includes manual adjustments to accrued or deferred income balance sheet items that impact revenue in the income statement.
The key audit matter applies to the First Student and First Transit divisions, due to the judgement required in assessing the level of unbilled revenue accrued on contracts in those divisions at year end. We focus on these divisions as we have not identified such unbilled balances in the other divisions of the Group.
The Audit Committee report on page 65 refers to Revenue recognition as one of the significant issues and judgements considered by the Audit Committee.
How the scope of our audit responded to the key audit matter
The audit procedures we performed in respect of this risk included:
■■ gaining an understanding of Management’s process for ensuring the accuracy of manual adjustments to revenue and assessing the design and implementation of key controls;
■■ understanding the judgements taken by Management in determining material manual adjustments at First Student and First Transit, their accuracy and the associated deferred and accrued income;
■■ recalculating the accuracy of material accrued income balances and reviewing supporting documentation on a sample basis; and
■■ auditing revenue related journal entries by selecting items that demonstrated characteristics of being manual in nature by agreeing them to supporting documentation to determine the rationale for the entries.
Key observations The results of our procedures were satisfactory and we did not identify inappropriate manual adjustments to revenue.
FirstGroup Annual Report and Accounts 2018 163
Financial statements
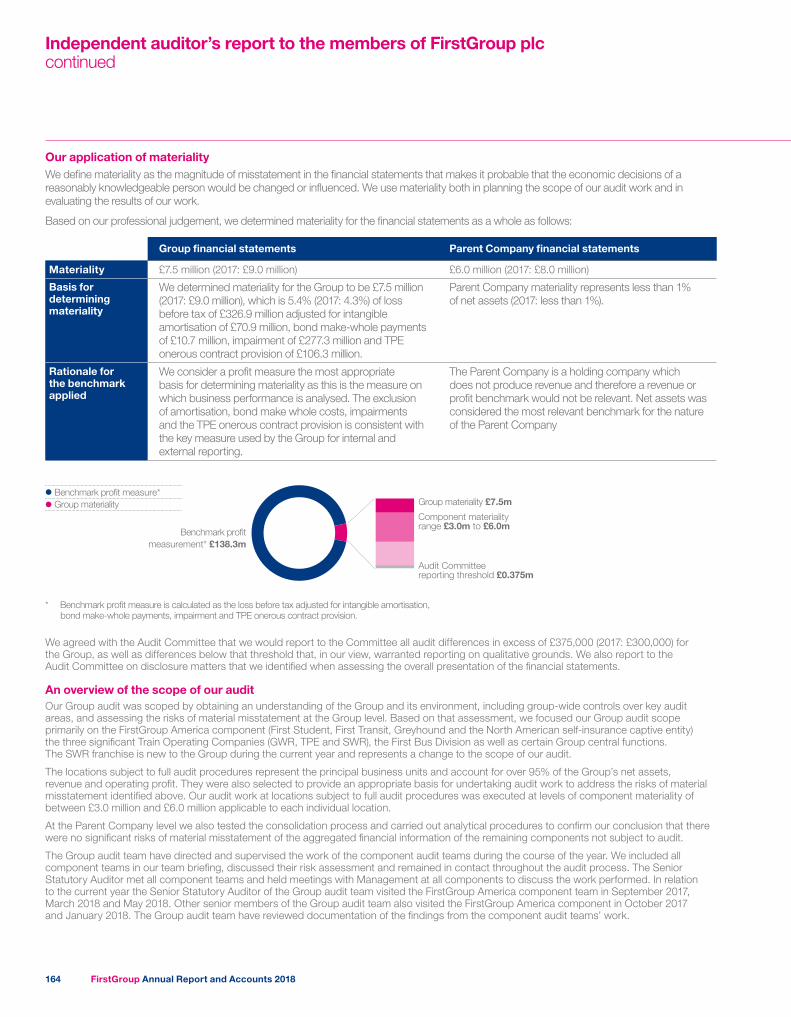
Our application of materialityWe define materiality as the magnitude of misstatement in the financial statements that makes it probable that the economic decisions of a reasonably knowledgeable person would be changed or influenced. We use materiality both in planning the scope of our audit work and in evaluating the results of our work.
Based on our professional judgement, we determined materiality for the financial statements as a whole as follows:
Group financial statements Parent Company financial statements
Materiality £7.5 million (2017: £9.0 million) £6.0 million (2017: £8.0 million)
Basis for determining materiality
We determined materiality for the Group to be £7.5 million (2017: £9.0 million), which is 5.4% (2017: 4.3%) of loss before tax of £326.9 million adjusted for intangible amortisation of £70.9 million, bond make-whole payments of £10.7 million, impairment of £277.3 million and TPE onerous contract provision of £106.3 million.
Parent Company materiality represents less than 1% of net assets (2017: less than 1%).
Rationale for the benchmark applied
We consider a profit measure the most appropriate basis for determining materiality as this is the measure on which business performance is analysed. The exclusion of amortisation, bond make whole costs, impairments and the TPE onerous contract provision is consistent with the key measure used by the Group for internal and external reporting.
The Parent Company is a holding company which does not produce revenue and therefore a revenue or profit benchmark would not be relevant. Net assets was considered the most relevant benchmark for the nature of the Parent Company
Group materiality £7.5mBenchmark profit measure*Group materiality
Benchmark profitmeasurement* £138.3m
Audit Committee reporting threshold £0.375m
Component materiality range £3.0m to £6.0m
* Benchmark profit measure is calculated as the loss before tax adjusted for intangible amortisation, bond make-whole payments, impairment and TPE onerous contract provision.
We agreed with the Audit Committee that we would report to the Committee all audit differences in excess of £375,000 (2017: £300,000) for the Group, as well as differences below that threshold that, in our view, warranted reporting on qualitative grounds. We also report to the Audit Committee on disclosure matters that we identified when assessing the overall presentation of the financial statements.
An overview of the scope of our auditOur Group audit was scoped by obtaining an understanding of the Group and its environment, including group-wide controls over key audit areas, and assessing the risks of material misstatement at the Group level. Based on that assessment, we focused our Group audit scope primarily on the FirstGroup America component (First Student, First Transit, Greyhound and the North American self-insurance captive entity) the three significant Train Operating Companies (GWR, TPE and SWR), the First Bus Division as well as certain Group central functions. The SWR franchise is new to the Group during the current year and represents a change to the scope of our audit.
The locations subject to full audit procedures represent the principal business units and account for over 95% of the Group’s net assets, revenue and operating profit. They were also selected to provide an appropriate basis for undertaking audit work to address the risks of material misstatement identified above. Our audit work at locations subject to full audit procedures was executed at levels of component materiality of between £3.0 million and £6.0 million applicable to each individual location.
At the Parent Company level we also tested the consolidation process and carried out analytical procedures to confirm our conclusion that there were no significant risks of material misstatement of the aggregated financial information of the remaining components not subject to audit.
The Group audit team have directed and supervised the work of the component audit teams during the course of the year. We included all component teams in our team briefing, discussed their risk assessment and remained in contact throughout the audit process. The Senior Statutory Auditor met all component teams and held meetings with Management at all components to discuss the work performed. In relation to the current year the Senior Statutory Auditor of the Group audit team visited the FirstGroup America component team in September 2017, March 2018 and May 2018. Other senior members of the Group audit team also visited the FirstGroup America component in October 2017 and January 2018. The Group audit team have reviewed documentation of the findings from the component audit teams’ work.
Independent auditor’s report to the members of FirstGroup plccontinued
FirstGroup Annual Report and Accounts 2018164
Other information
The directors are responsible for the other information. The other information comprises the information included in the annual report, other than the financial statements and our auditor’s report thereon.
Our opinion on the financial statements does not cover the other information and, except to the extent otherwise explicitly stated in our report, we do not express any form of assurance conclusion thereon.
In connection with our audit of the financial statements, our responsibility is to read the other information and, in doing so, consider whether the other information is materially inconsistent with the financial statements or our knowledge obtained in the audit or otherwise appears to be materially misstated.
If we identify such material inconsistencies or apparent material misstatements, we are required to determine whether there is a material misstatement in the financial statements or a material misstatement of the other information. If, based on the work we have performed, we conclude that there is a material misstatement of this other information, we are required to report that fact.
In this context, matters that we are specifically required to report to you as uncorrected material misstatements of the other information include where we conclude that:
■■ Fair, balanced and understandable – the statement given by the directors that they consider the annual report and financial statements taken as a whole is fair, balanced and understandable and provides the information necessary for shareholders to assess the Group’s position and performance, business model and strategy, is materially inconsistent with our knowledge obtained in the audit; or
■■ Audit committee reporting – the section describing the work of the audit committee does not appropriately address matters communicated by us to the audit committee; or
■■ Directors’ statement of compliance with the UK Corporate Governance Code – the parts of the directors’ statement required under the Listing Rules relating to the company’s compliance with the UK Corporate Governance Code containing provisions specified for review by the auditor in accordance with Listing Rule 9.8.10R(2) do not properly disclose a departure from a relevant provision of the UK Corporate Governance Code.
We have nothing to report in respect of these matters.
Responsibilities of directorsAs explained more fully in the directors’ responsibilities statement, the directors are responsible for the preparation of the financial statements and for being satisfied that they give a true and fair view, and for such internal control as the directors determine is necessary to enable the preparation of financial statements that are free from material misstatement, whether due to fraud or error.
In preparing the financial statements, the directors are responsible for assessing the Group’s and the Parent Company’s ability to continue as a going concern, disclosing as applicable, matters related to going concern and using the going concern basis of accounting unless the directors either intend to liquidate the Group or the Parent Company or to cease operations, or have no realistic alternative but to do so.
Auditor’s responsibilities for the audit of the financial statementsOur objectives are to obtain reasonable assurance about whether the financial statements as a whole are free from material misstatement, whether due to fraud or error, and to issue an auditor’s report that includes our opinion. Reasonable assurance is a high level of assurance, but is not a guarantee that an audit conducted in accordance with ISAs (UK) will always detect a material misstatement when it exists. Misstatements can arise from fraud or error and are considered material if, individually or in the aggregate, they could reasonably be expected to influence the economic decisions of users taken on the basis of these financial statements.
A further description of our responsibilities for the audit of the financial statements is located on the Financial Reporting Council’s website at: www.frc.org.uk/auditorsresponsibilities. This description forms part of our auditor’s report.
Use of our reportThis report is made solely to the Parent Company’s members, as a body, in accordance with Chapter 3 of Part 16 of the Companies Act 2006. Our audit work has been undertaken so that we might state to the Parent Company’s members those matters we are required to state to them in an auditor’s report and for no other purpose. To the fullest extent permitted by law, we do not accept or assume responsibility to anyone other than the Parent Company and the Parent Company’s members as a body, for our audit work, for this report, or for the opinions we have formed.
FirstGroup Annual Report and Accounts 2018 165
Financial statements
Report on other legal and regulatory requirementsOpinions on other matters prescribed by the Companies Act 2006In our opinion the part of the directors’ remuneration report to be audited has been properly prepared in accordance with the Companies Act 2006.
In our opinion, based on the work undertaken in the course of the audit:
■■ the information given in the strategic report and the directors’ report for the financial year for which the financial statements are prepared is consistent with the financial statements; and
■■ the strategic report and the directors’ report have been prepared in accordance with applicable legal requirements.
In the light of the knowledge and understanding of the Group and the Parent Company and their environment obtained in the course of the audit, we have not identified any material misstatements in the strategic report or the directors’ report.
Matters on which we are required to report by exception
Adequacy of explanations received and accounting recordsUnder the Companies Act 2006 we are required to report to you if, in our opinion:
■■ we have not received all the information and explanations we require for our audit; or■■ adequate accounting records have not been kept by the Parent Company, or returns adequate for our audit have not been received from branches not visited by us; or
■■ the Parent Company financial statements are not in agreement with the accounting records and returns.
We have nothing to report in respect of these matters.
Directors’ remunerationUnder the Companies Act 2006 we are also required to report if in our opinion certain disclosures of directors’ remuneration have not been made or the part of the directors’ remuneration report to be audited is not in agreement with the accounting records and returns.
We have nothing to report in respect of these matters.
Other mattersAuditor tenureFollowing the recommendation of the audit committee, we were appointed on 2 March 1999 to audit the financial statements for the year ending 31 March 1999 and subsequent financial periods. The period of total uninterrupted engagement including previous renewals and reappointments of the firm is 20 years, covering the years ending 31 March 1999 to 31 March 2018.
Consistency of the audit report with the additional report to the audit committeeOur audit opinion is consistent with the additional report to the audit committee we are required to provide in accordance with ISAs (UK).
Mark Mullins, FCA (Senior Statutory Auditor)for and on behalf of Deloitte LLP Statutory Auditor London31 May 2018
Independent auditor’s report to the members of FirstGroup plccontinued
FirstGroup Annual Report and Accounts 2018166
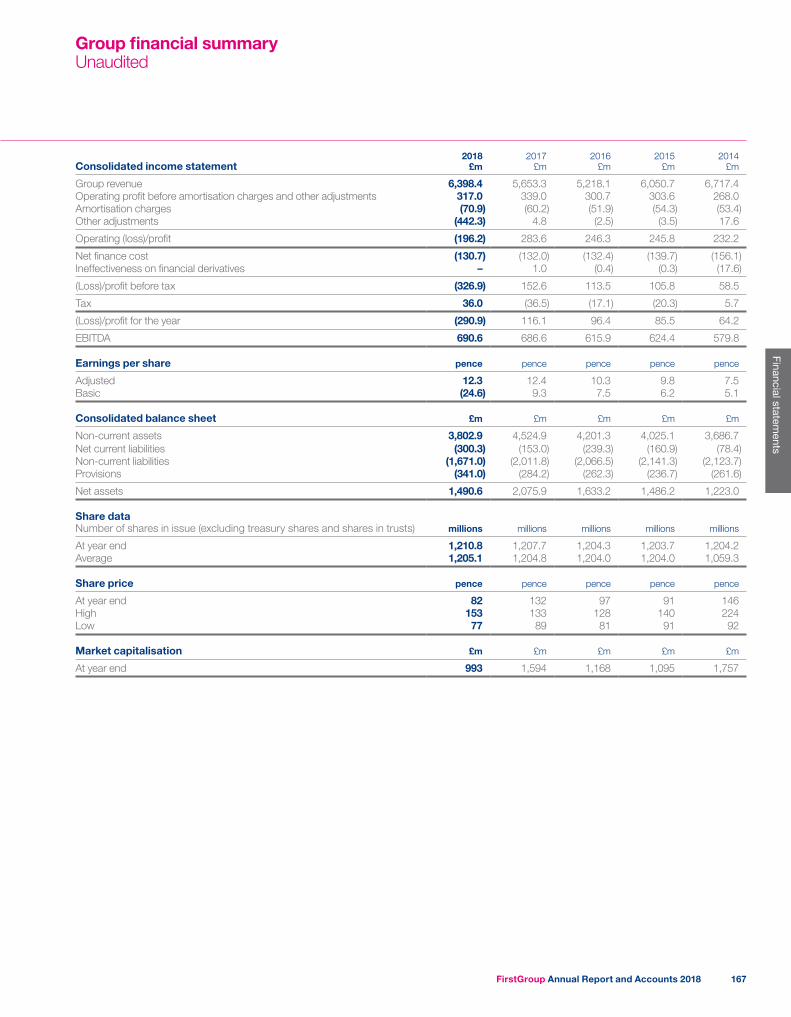
Consolidated income statement 2018
£m2017
£m2016
£m2015
£m2014
£m
Group revenue 6,398.4 5,653.3 5,218.1 6,050.7 6,717.4Operating profit before amortisation charges and other adjustments 317.0 339.0 300.7 303.6 268.0Amortisation charges (70.9) (60.2) (51.9) (54.3) (53.4)Other adjustments (442.3) 4.8 (2.5) (3.5) 17.6
Operating (loss)/profit (196.2) 283.6 246.3 245.8 232.2
Net finance cost (130.7) (132.0) (132.4) (139.7) (156.1)Ineffectiveness on financial derivatives – 1.0 (0.4) (0.3) (17.6)
(Loss)/profit before tax (326.9) 152.6 113.5 105.8 58.5
Tax 36.0 (36.5) (17.1) (20.3) 5.7
(Loss)/profit for the year (290.9) 116.1 96.4 85.5 64.2
EBITDA 690.6 686.6 615.9 624.4 579.8
Earnings per share pence pence pence pence pence
Adjusted 12.3 12.4 10.3 9.8 7.5Basic (24.6) 9.3 7.5 6.2 5.1
Consolidated balance sheet £m £m £m £m £m
Non-current assets 3,802.9 4,524.9 4,201.3 4,025.1 3,686.7Net current liabilities (300.3) (153.0) (239.3) (160.9) (78.4)Non-current liabilities (1,671.0) (2,011.8) (2,066.5) (2,141.3) (2,123.7)Provisions (341.0) (284.2) (262.3) (236.7) (261.6)
Net assets 1,490.6 2,075.9 1,633.2 1,486.2 1,223.0
Share dataNumber of shares in issue (excluding treasury shares and shares in trusts) millions millions millions millions millions
At year end 1,210.8 1,207.7 1,204.3 1,203.7 1,204.2Average 1,205.1 1,204.8 1,204.0 1,204.0 1,059.3
Share price pence pence pence pence pence
At year end 82 132 97 91 146High 153 133 128 140 224Low 77 89 81 91 92
Market capitalisation £m £m £m £m £m
At year end 993 1,594 1,168 1,095 1,757
Group financial summaryUnaudited
FirstGroup Annual Report and Accounts 2018 167
Financial statements
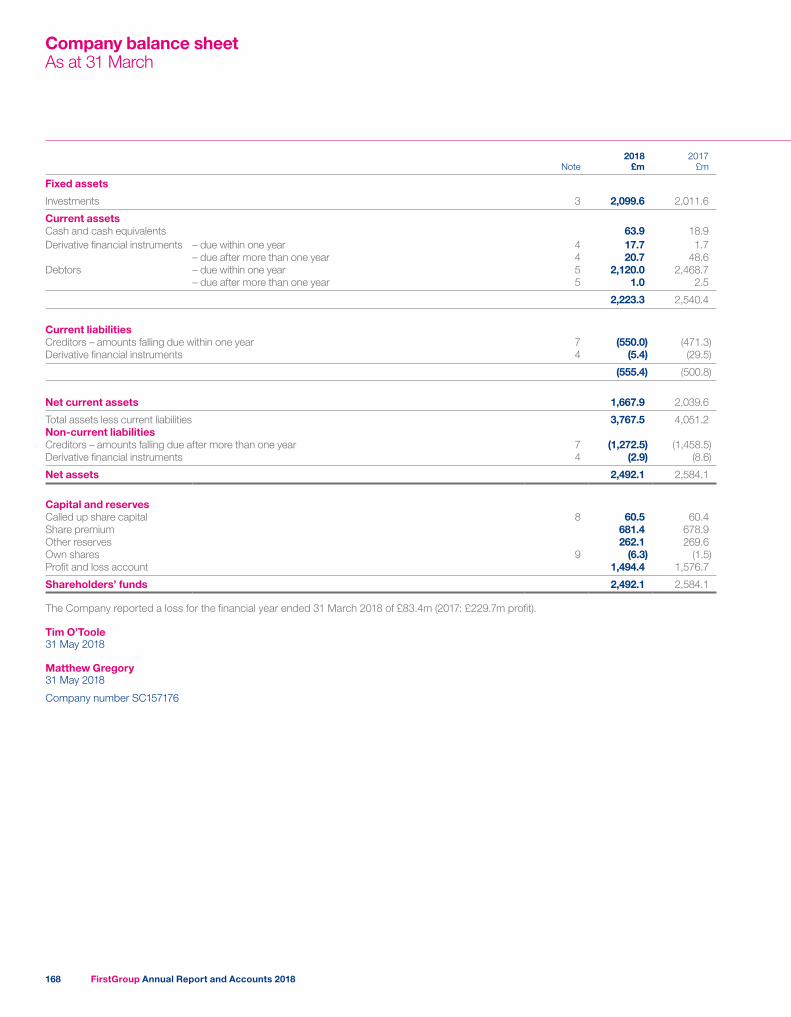
Note2018
£m2017
£m
Fixed assets
Investments 3 2,099.6 2,011.6
Current assetsCash and cash equivalents 63.9 18.9Derivative financial instruments – due within one year 4 17.7 1.7
– due after more than one year 4 20.7 48.6Debtors – due within one year 5 2,120.0 2,468.7
– due after more than one year 5 1.0 2.5
2,223.3 2,540.4
Current liabilitiesCreditors – amounts falling due within one year 7 (550.0) (471.3)Derivative financial instruments 4 (5.4) (29.5)
(555.4) (500.8)
Net current assets 1,667.9 2,039.6
Total assets less current liabilities 3,767.5 4,051.2Non-current liabilitiesCreditors – amounts falling due after more than one year 7 (1,272.5) (1,458.5)Derivative financial instruments 4 (2.9) (8.6)
Net assets 2,492.1 2,584.1
Capital and reservesCalled up share capital 8 60.5 60.4Share premium 681.4 678.9Other reserves 262.1 269.6Own shares 9 (6.3) (1.5)Profit and loss account 1,494.4 1,576.7
Shareholders’ funds 2,492.1 2,584.1
The Company reported a loss for the financial year ended 31 March 2018 of £83.4m (2017: £229.7m profit).
Tim O’Toole31 May 2018
Matthew Gregory31 May 2018
Company number SC157176
Company balance sheetAs at 31 March
FirstGroup Annual Report and Accounts 2018168
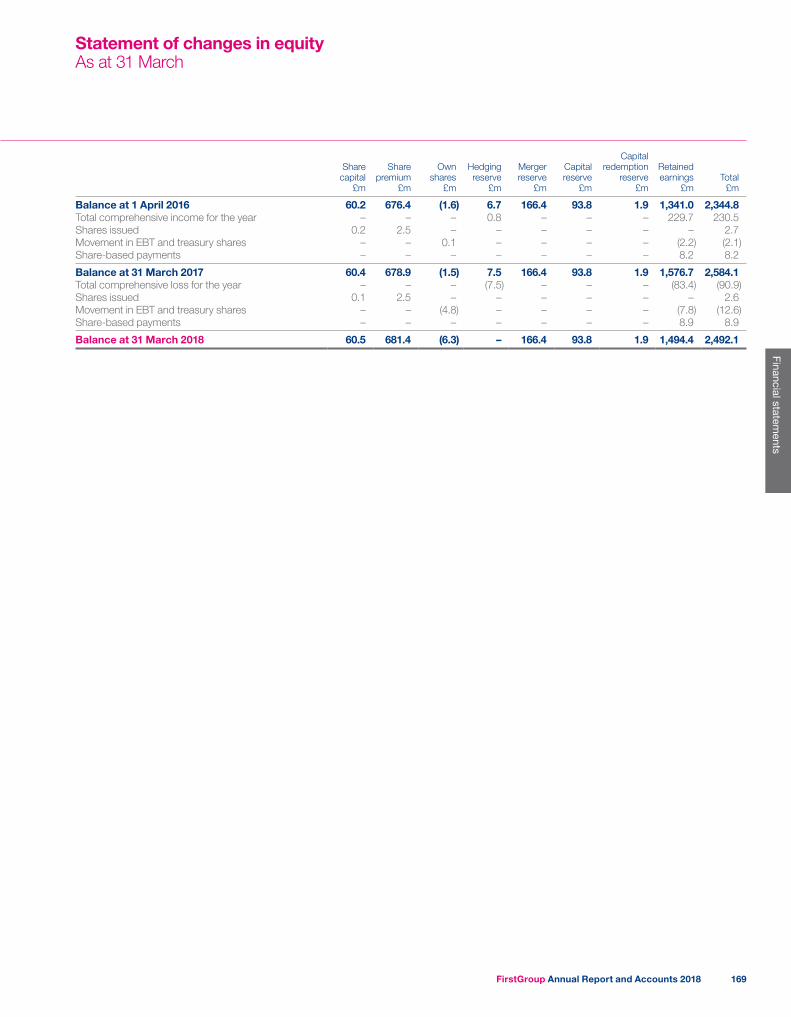
Share capital
£m
Share premium
£m
Own shares
£m
Hedging reserve
£m
Merger reserve
£m
Capital reserve
£m
Capital redemption
reserve £m
Retained earnings
£mTotal
£m
Balance at 1 April 2016 60.2 676.4 (1.6) 6.7 166.4 93.8 1.9 1,341.0 2,344.8Total comprehensive income for the year – – – 0.8 – – – 229.7 230.5Shares issued 0.2 2.5 – – – – – – 2.7Movement in EBT and treasury shares – – 0.1 – – – – (2.2) (2.1)Share-based payments – – – – – – – 8.2 8.2
Balance at 31 March 2017 60.4 678.9 (1.5) 7.5 166.4 93.8 1.9 1,576.7 2,584.1Total comprehensive loss for the year – – – (7.5) – – – (83.4) (90.9)Shares issued 0.1 2.5 – – – – – – 2.6Movement in EBT and treasury shares – – (4.8) – – – – (7.8) (12.6)Share-based payments – – – – – – – 8.9 8.9
Balance at 31 March 2018 60.5 681.4 (6.3) – 166.4 93.8 1.9 1,494.4 2,492.1
Statement of changes in equityAs at 31 March
FirstGroup Annual Report and Accounts 2018 169
Financial statements
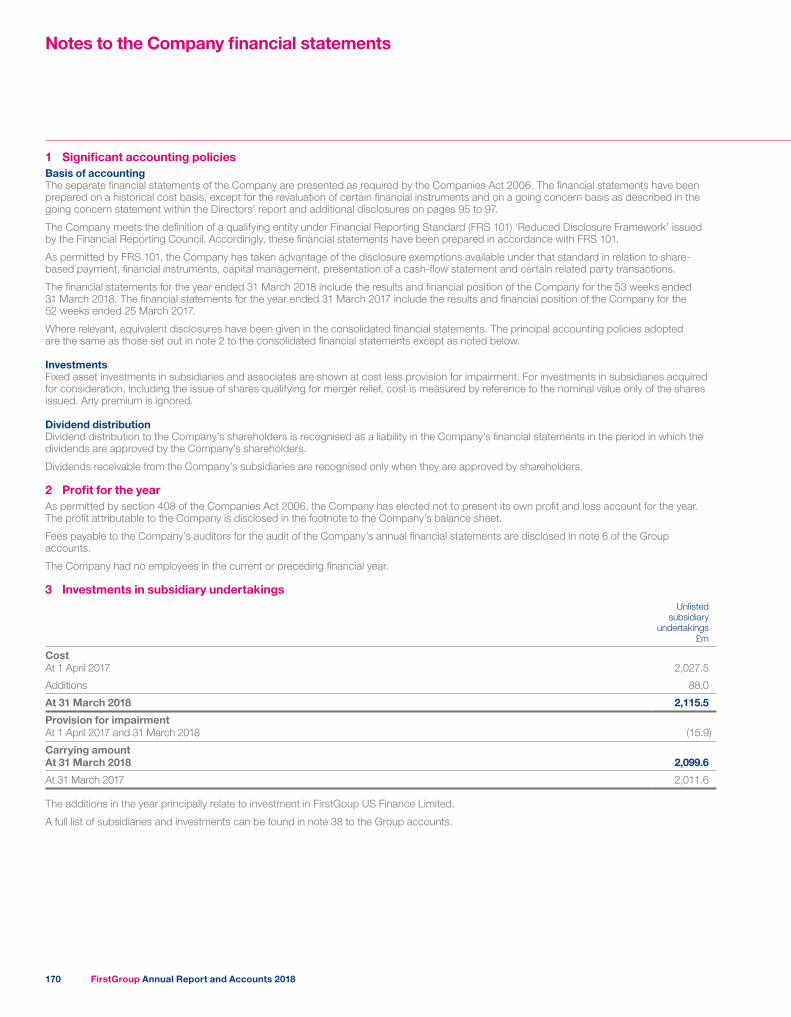
1 Significant accounting policiesBasis of accountingThe separate financial statements of the Company are presented as required by the Companies Act 2006. The financial statements have been prepared on a historical cost basis, except for the revaluation of certain financial instruments and on a going concern basis as described in the going concern statement within the Directors’ report and additional disclosures on pages 95 to 97.
The Company meets the definition of a qualifying entity under Financial Reporting Standard (FRS 101) ‘Reduced Disclosure Framework’ issued by the Financial Reporting Council. Accordingly, these financial statements have been prepared in accordance with FRS 101.
As permitted by FRS 101, the Company has taken advantage of the disclosure exemptions available under that standard in relation to share-based payment, financial instruments, capital management, presentation of a cash-flow statement and certain related party transactions.
The financial statements for the year ended 31 March 2018 include the results and financial position of the Company for the 53 weeks ended 31 March 2018. The financial statements for the year ended 31 March 2017 include the results and financial position of the Company for the 52 weeks ended 25 March 2017.
Where relevant, equivalent disclosures have been given in the consolidated financial statements. The principal accounting policies adopted are the same as those set out in note 2 to the consolidated financial statements except as noted below.
InvestmentsFixed asset investments in subsidiaries and associates are shown at cost less provision for impairment. For investments in subsidiaries acquired for consideration, including the issue of shares qualifying for merger relief, cost is measured by reference to the nominal value only of the shares issued. Any premium is ignored.
Dividend distributionDividend distribution to the Company’s shareholders is recognised as a liability in the Company’s financial statements in the period in which the dividends are approved by the Company’s shareholders.
Dividends receivable from the Company’s subsidiaries are recognised only when they are approved by shareholders.
2 Profit for the yearAs permitted by section 408 of the Companies Act 2006, the Company has elected not to present its own profit and loss account for the year. The profit attributable to the Company is disclosed in the footnote to the Company’s balance sheet.
Fees payable to the Company’s auditors for the audit of the Company’s annual financial statements are disclosed in note 6 of the Group accounts.
The Company had no employees in the current or preceding financial year.
3 Investments in subsidiary undertakingsUnlisted
subsidiary undertakings
£m
Cost At 1 April 2017 2,027.5
Additions 88.0
At 31 March 2018 2,115.5
Provision for impairmentAt 1 April 2017 and 31 March 2018 (15.9)
Carrying amountAt 31 March 2018 2,099.6
At 31 March 2017 2,011.6
The additions in the year principally relate to investment in FirstGoup US Finance Limited.
A full list of subsidiaries and investments can be found in note 38 to the Group accounts.
Notes to the Company financial statements
FirstGroup Annual Report and Accounts 2018170
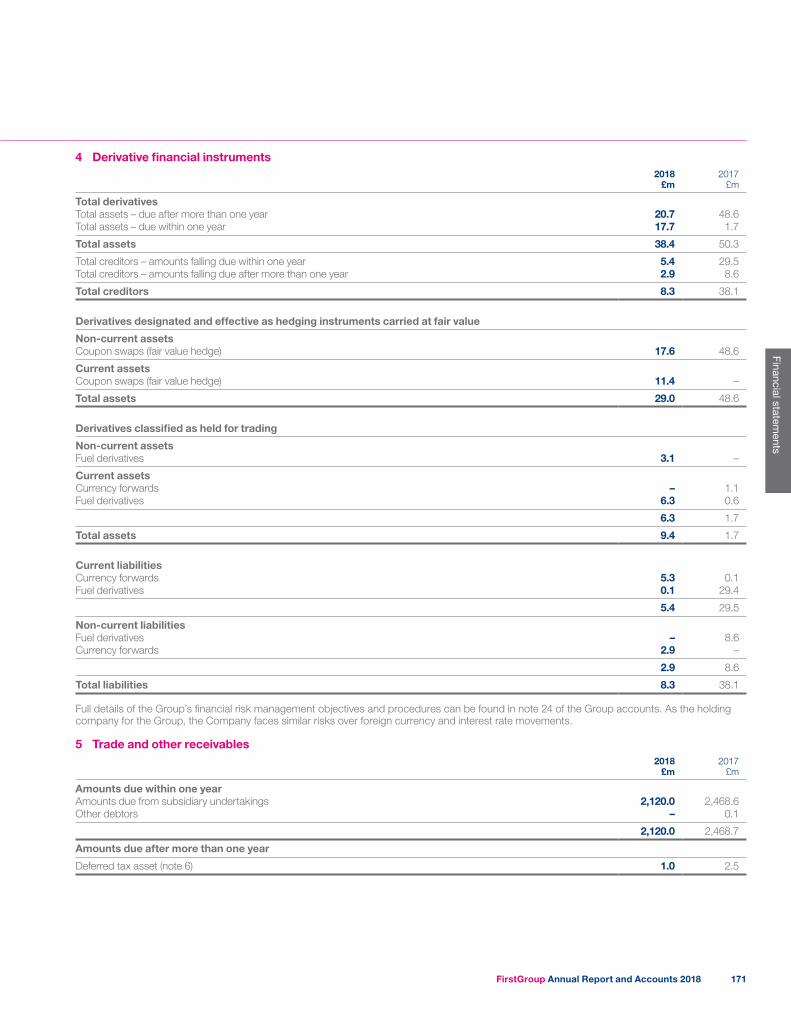
4 Derivative financial instruments2018
£m2017
£m
Total derivativesTotal assets – due after more than one year 20.7 48.6Total assets – due within one year 17.7 1.7
Total assets 38.4 50.3
Total creditors – amounts falling due within one year 5.4 29.5Total creditors – amounts falling due after more than one year 2.9 8.6
Total creditors 8.3 38.1
Derivatives designated and effective as hedging instruments carried at fair value
Non-current assetsCoupon swaps (fair value hedge) 17.6 48.6
Current assetsCoupon swaps (fair value hedge) 11.4 –
Total assets 29.0 48.6
Derivatives classified as held for trading
Non-current assetsFuel derivatives 3.1 –
Current assetsCurrency forwards – 1.1Fuel derivatives 6.3 0.6
6.3 1.7
Total assets 9.4 1.7
Current liabilitiesCurrency forwards 5.3 0.1Fuel derivatives 0.1 29.4
5.4 29.5
Non-current liabilitiesFuel derivatives – 8.6Currency forwards 2.9 –
2.9 8.6
Total liabilities 8.3 38.1
Full details of the Group’s financial risk management objectives and procedures can be found in note 24 of the Group accounts. As the holding company for the Group, the Company faces similar risks over foreign currency and interest rate movements.
5 Trade and other receivables2018
£m2017
£m
Amounts due within one yearAmounts due from subsidiary undertakings 2,120.0 2,468.6Other debtors – 0.1
2,120.0 2,468.7
Amounts due after more than one year
Deferred tax asset (note 6) 1.0 2.5
FirstGroup Annual Report and Accounts 2018 171
Financial statements
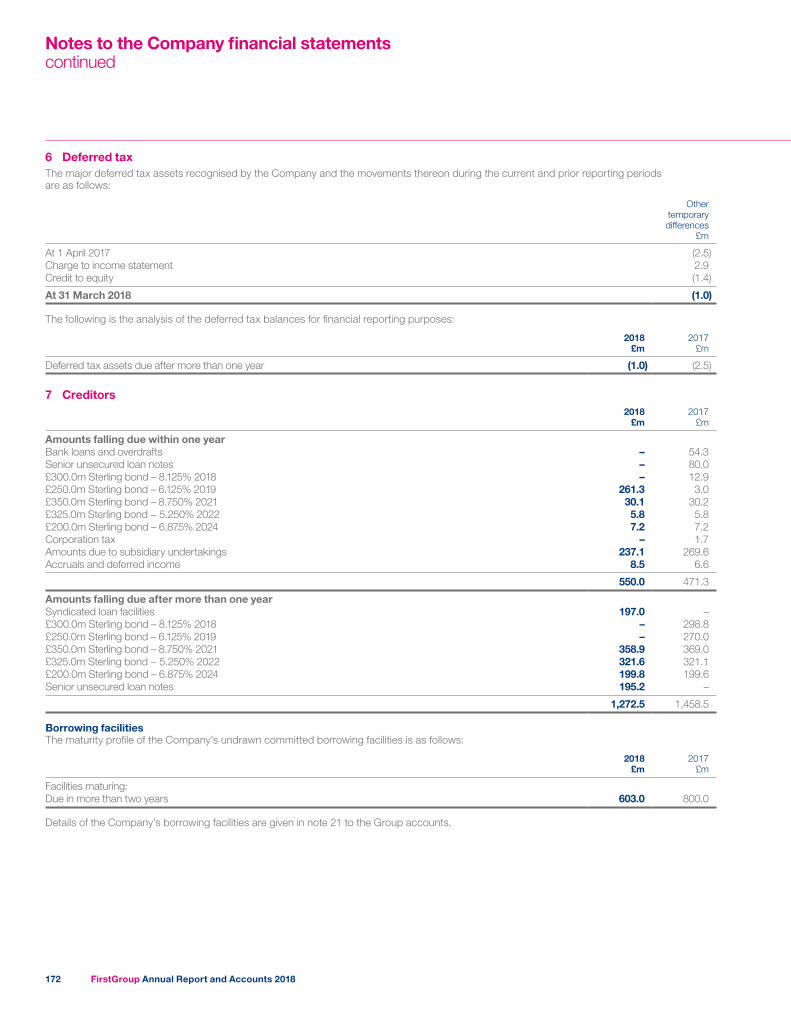
6 Deferred taxThe major deferred tax assets recognised by the Company and the movements thereon during the current and prior reporting periods are as follows:
Other temporary differences
£m
At 1 April 2017 (2.5)Charge to income statement 2.9Credit to equity (1.4)
At 31 March 2018 (1.0)
The following is the analysis of the deferred tax balances for financial reporting purposes:
2018 £m
2017 £m
Deferred tax assets due after more than one year (1.0) (2.5)
7 Creditors2018
£m2017
£m
Amounts falling due within one yearBank loans and overdrafts – 54.3Senior unsecured loan notes – 80.0£300.0m Sterling bond – 8.125% 2018 – 12.9£250.0m Sterling bond – 6.125% 2019 261.3 3.0£350.0m Sterling bond – 8.750% 2021 30.1 30.2£325.0m Sterling bond − 5.250% 2022 5.8 5.8£200.0m Sterling bond – 6.875% 2024 7.2 7.2Corporation tax – 1.7Amounts due to subsidiary undertakings 237.1 269.6Accruals and deferred income 8.5 6.6
550.0 471.3
Amounts falling due after more than one yearSyndicated loan facilities 197.0 –£300.0m Sterling bond – 8.125% 2018 – 298.8£250.0m Sterling bond – 6.125% 2019 – 270.0£350.0m Sterling bond – 8.750% 2021 358.9 369.0£325.0m Sterling bond − 5.250% 2022 321.6 321.1£200.0m Sterling bond – 6.875% 2024 199.8 199.6Senior unsecured loan notes 195.2 –
1,272.5 1,458.5
Borrowing facilitiesThe maturity profile of the Company’s undrawn committed borrowing facilities is as follows:
2018 £m
2017 £m
Facilities maturing:Due in more than two years 603.0 800.0
Details of the Company’s borrowing facilities are given in note 21 to the Group accounts.
Notes to the Company financial statementscontinued
FirstGroup Annual Report and Accounts 2018172
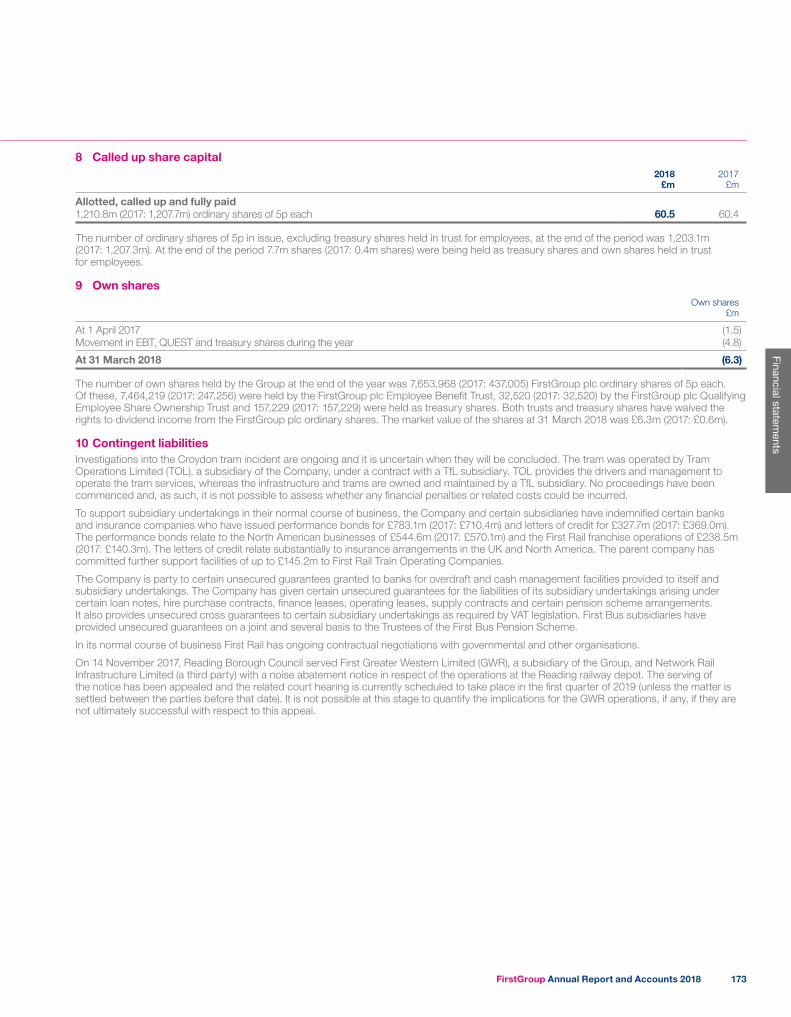
8 Called up share capital2018
£m2017
£m
Allotted, called up and fully paid1,210.8m (2017: 1,207.7m) ordinary shares of 5p each 60.5 60.4
The number of ordinary shares of 5p in issue, excluding treasury shares held in trust for employees, at the end of the period was 1,203.1m (2017: 1,207.3m). At the end of the period 7.7m shares (2017: 0.4m shares) were being held as treasury shares and own shares held in trust for employees.
9 Own sharesOwn shares
£m
At 1 April 2017 (1.5)Movement in EBT, QUEST and treasury shares during the year (4.8)
At 31 March 2018 (6.3)
The number of own shares held by the Group at the end of the year was 7,653,968 (2017: 437,005) FirstGroup plc ordinary shares of 5p each. Of these, 7,464,219 (2017: 247,256) were held by the FirstGroup plc Employee Benefit Trust, 32,520 (2017: 32,520) by the FirstGroup plc Qualifying Employee Share Ownership Trust and 157,229 (2017: 157,229) were held as treasury shares. Both trusts and treasury shares have waived the rights to dividend income from the FirstGroup plc ordinary shares. The market value of the shares at 31 March 2018 was £6.3m (2017: £0.6m).
10 Contingent liabilitiesInvestigations into the Croydon tram incident are ongoing and it is uncertain when they will be concluded. The tram was operated by Tram Operations Limited (TOL), a subsidiary of the Company, under a contract with a TfL subsidiary. TOL provides the drivers and management to operate the tram services, whereas the infrastructure and trams are owned and maintained by a TfL subsidiary. No proceedings have been commenced and, as such, it is not possible to assess whether any financial penalties or related costs could be incurred.
To support subsidiary undertakings in their normal course of business, the Company and certain subsidiaries have indemnified certain banks and insurance companies who have issued performance bonds for £783.1m (2017: £710.4m) and letters of credit for £327.7m (2017: £369.0m). The performance bonds relate to the North American businesses of £544.6m (2017: £570.1m) and the First Rail franchise operations of £238.5m (2017: £140.3m). The letters of credit relate substantially to insurance arrangements in the UK and North America. The parent company has committed further support facilities of up to £145.2m to First Rail Train Operating Companies.
The Company is party to certain unsecured guarantees granted to banks for overdraft and cash management facilities provided to itself and subsidiary undertakings. The Company has given certain unsecured guarantees for the liabilities of its subsidiary undertakings arising under certain loan notes, hire purchase contracts, finance leases, operating leases, supply contracts and certain pension scheme arrangements. It also provides unsecured cross guarantees to certain subsidiary undertakings as required by VAT legislation. First Bus subsidiaries have provided unsecured guarantees on a joint and several basis to the Trustees of the First Bus Pension Scheme.
In its normal course of business First Rail has ongoing contractual negotiations with governmental and other organisations.
On 14 November 2017, Reading Borough Council served First Greater Western Limited (GWR), a subsidiary of the Group, and Network Rail Infrastructure Limited (a third party) with a noise abatement notice in respect of the operations at the Reading railway depot. The serving of the notice has been appealed and the related court hearing is currently scheduled to take place in the first quarter of 2019 (unless the matter is settled between the parties before that date). It is not possible at this stage to quantify the implications for the GWR operations, if any, if they are not ultimately successful with respect to this appeal.
FirstGroup Annual Report and Accounts 2018 173
Financial statements
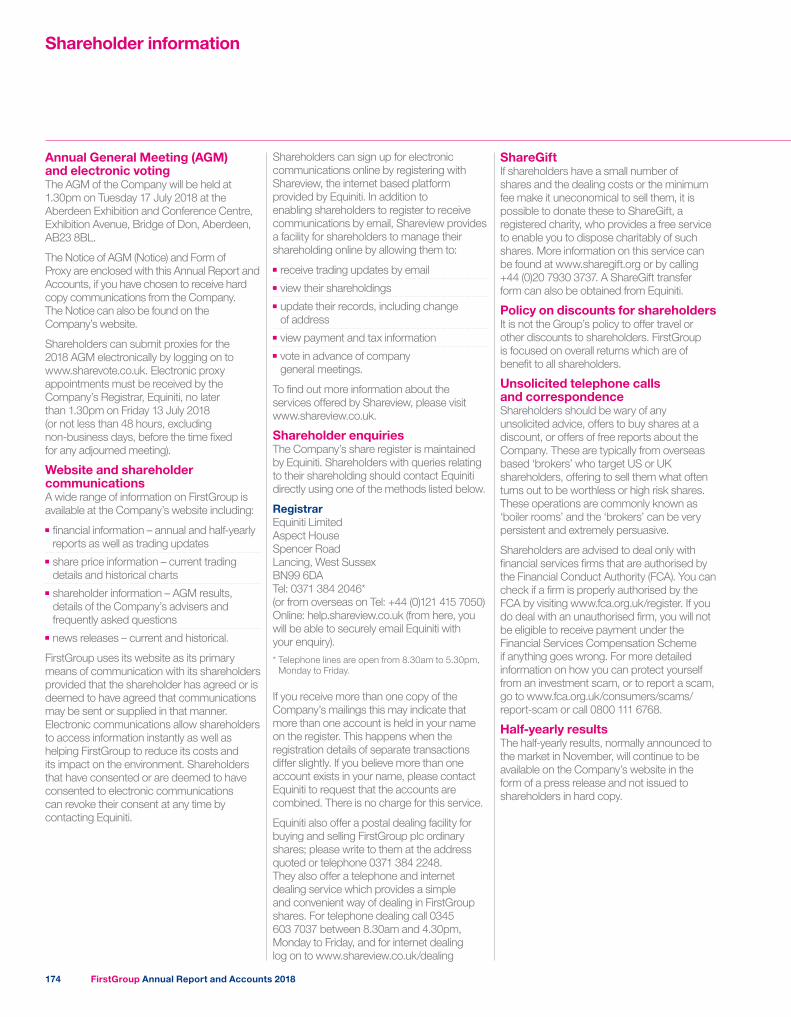
Shareholder information
Annual General Meeting (AGM) and electronic votingThe AGM of the Company will be held at 1.30pm on Tuesday 17 July 2018 at the Aberdeen Exhibition and Conference Centre, Exhibition Avenue, Bridge of Don, Aberdeen, AB23 8BL.
The Notice of AGM (Notice) and Form of Proxy are enclosed with this Annual Report and Accounts, if you have chosen to receive hard copy communications from the Company. The Notice can also be found on the Company’s website.
Shareholders can submit proxies for the 2018 AGM electronically by logging on to www.sharevote.co.uk. Electronic proxy appointments must be received by the Company’s Registrar, Equiniti, no later than 1.30pm on Friday 13 July 2018 (or not less than 48 hours, excluding non-business days, before the time fixed for any adjourned meeting).
Website and shareholder communicationsA wide range of information on FirstGroup is available at the Company’s website including:
■■ financial information – annual and half-yearly reports as well as trading updates
■■ share price information – current trading details and historical charts
■■ shareholder information – AGM results, details of the Company’s advisers and frequently asked questions
■■ news releases – current and historical.
FirstGroup uses its website as its primary means of communication with its shareholders provided that the shareholder has agreed or is deemed to have agreed that communications may be sent or supplied in that manner. Electronic communications allow shareholders to access information instantly as well as helping FirstGroup to reduce its costs and its impact on the environment. Shareholders that have consented or are deemed to have consented to electronic communications can revoke their consent at any time by contacting Equiniti.
Shareholders can sign up for electronic communications online by registering with Shareview, the internet based platform provided by Equiniti. In addition to enabling shareholders to register to receive communications by email, Shareview provides a facility for shareholders to manage their shareholding online by allowing them to:
■■ receive trading updates by email■■ view their shareholdings■■ update their records, including change of address
■■ view payment and tax information■■ vote in advance of company general meetings.
To find out more information about the services offered by Shareview, please visit www.shareview.co.uk.
Shareholder enquiriesThe Company’s share register is maintained by Equiniti. Shareholders with queries relating to their shareholding should contact Equiniti directly using one of the methods listed below.
RegistrarEquiniti LimitedAspect HouseSpencer RoadLancing, West Sussex BN99 6DATel: 0371 384 2046* (or from overseas on Tel: +44 (0)121 415 7050)Online: help.shareview.co.uk (from here, you will be able to securely email Equiniti with your enquiry).
* Telephone lines are open from 8.30am to 5.30pm, Monday to Friday.
If you receive more than one copy of the Company’s mailings this may indicate that more than one account is held in your name on the register. This happens when the registration details of separate transactions differ slightly. If you believe more than one account exists in your name, please contact Equiniti to request that the accounts are combined. There is no charge for this service.
Equiniti also offer a postal dealing facility for buying and selling FirstGroup plc ordinary shares; please write to them at the address quoted or telephone 0371 384 2248. They also offer a telephone and internet dealing service which provides a simple and convenient way of dealing in FirstGroup shares. For telephone dealing call 0345 603 7037 between 8.30am and 4.30pm, Monday to Friday, and for internet dealing log on to www.shareview.co.uk/dealing
ShareGiftIf shareholders have a small number of shares and the dealing costs or the minimum fee make it uneconomical to sell them, it is possible to donate these to ShareGift, a registered charity, who provides a free service to enable you to dispose charitably of such shares. More information on this service can be found at www.sharegift.org or by calling +44 (0)20 7930 3737. A ShareGift transfer form can also be obtained from Equiniti.
Policy on discounts for shareholdersIt is not the Group’s policy to offer travel or other discounts to shareholders. FirstGroup is focused on overall returns which are of benefit to all shareholders.
Unsolicited telephone calls and correspondenceShareholders should be wary of any unsolicited advice, offers to buy shares at a discount, or offers of free reports about the Company. These are typically from overseas based ‘brokers’ who target US or UK shareholders, offering to sell them what often turns out to be worthless or high risk shares. These operations are commonly known as ‘boiler rooms’ and the ‘brokers’ can be very persistent and extremely persuasive.
Shareholders are advised to deal only with financial services firms that are authorised by the Financial Conduct Authority (FCA). You can check if a firm is properly authorised by the FCA by visiting www.fca.org.uk/register. If you do deal with an unauthorised firm, you will not be eligible to receive payment under the Financial Services Compensation Scheme if anything goes wrong. For more detailed information on how you can protect yourself from an investment scam, or to report a scam, go to www.fca.org.uk/consumers/scams/report-scam or call 0800 111 6768.
Half-yearly resultsThe half-yearly results, normally announced to the market in November, will continue to be available on the Company’s website in the form of a press release and not issued to shareholders in hard copy.
FirstGroup Annual Report and Accounts 2018174
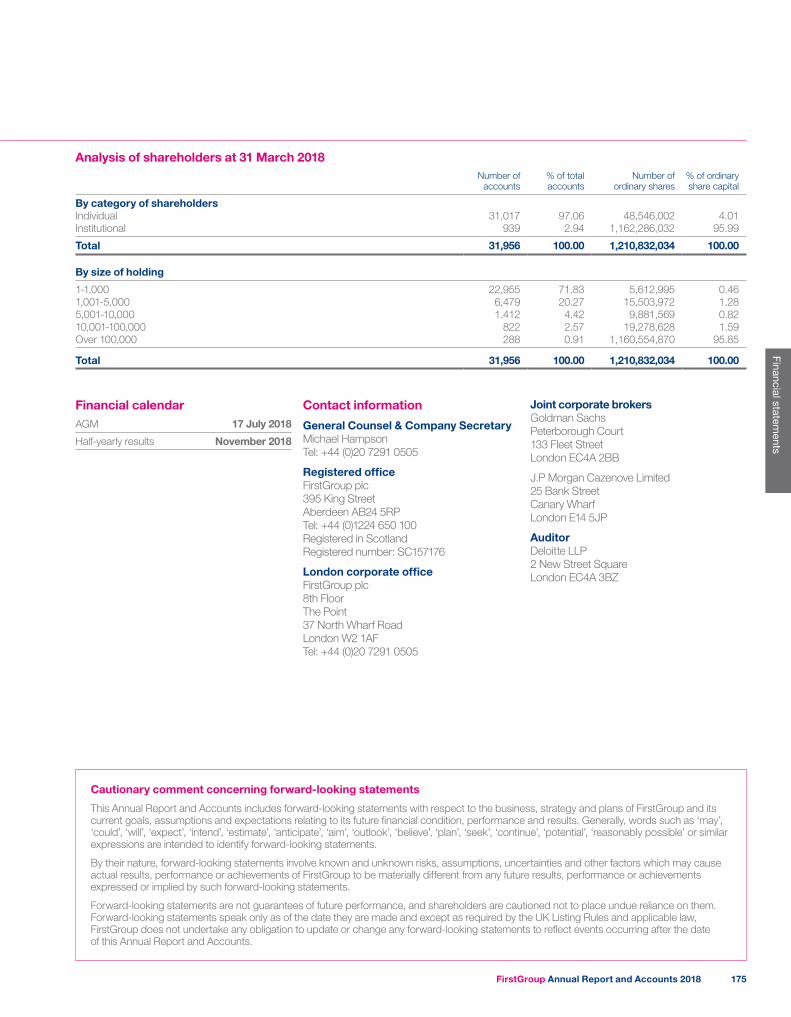
Analysis of shareholders at 31 March 2018Number of
accounts% of total accounts
Number of ordinary shares
% of ordinary share capital
By category of shareholdersIndividual 31,017 97.06 48,546,002 4.01Institutional 939 2.94 1,162,286,032 95.99
Total 31,956 100.00 1,210,832,034 100.00
By size of holding
1-1,000 22,955 71.83 5,612,995 0.461,001-5,000 6,479 20.27 15,503,972 1.285,001-10,000 1.412 4.42 9,881,569 0.8210,001-100,000 822 2.57 19,278,628 1.59Over 100,000 288 0.91 1,160,554,870 95.85
Total 31,956 100.00 1,210,832,034 100.00
Financial calendarAGM 17 July 2018
Half-yearly results November 2018
Contact information
General Counsel & Company SecretaryMichael HampsonTel: +44 (0)20 7291 0505
Registered officeFirstGroup plc395 King StreetAberdeen AB24 5RPTel: +44 (0)1224 650 100Registered in ScotlandRegistered number: SC157176
London corporate officeFirstGroup plc8th Floor The Point 37 North Wharf Road London W2 1AFTel: +44 (0)20 7291 0505
Joint corporate brokersGoldman SachsPeterborough Court133 Fleet StreetLondon EC4A 2BB
J.P Morgan Cazenove Limited25 Bank StreetCanary WharfLondon E14 5JP
AuditorDeloitte LLP2 New Street SquareLondon EC4A 3BZ
Cautionary comment concerning forward-looking statements
This Annual Report and Accounts includes forward-looking statements with respect to the business, strategy and plans of FirstGroup and its current goals, assumptions and expectations relating to its future financial condition, performance and results. Generally, words such as ‘may’, ‘could’, ‘will’, ‘expect’, ‘intend’, ‘estimate’, ‘anticipate’, ‘aim’, ‘outlook’, ‘believe’, ‘plan’, ‘seek’, ‘continue’, ‘potential’, ‘reasonably possible’ or similar expressions are intended to identify forward-looking statements.
By their nature, forward-looking statements involve known and unknown risks, assumptions, uncertainties and other factors which may cause actual results, performance or achievements of FirstGroup to be materially different from any future results, performance or achievements expressed or implied by such forward-looking statements.
Forward-looking statements are not guarantees of future performance, and shareholders are cautioned not to place undue reliance on them. Forward-looking statements speak only as of the date they are made and except as required by the UK Listing Rules and applicable law, FirstGroup does not undertake any obligation to update or change any forward-looking statements to reflect events occurring after the date of this Annual Report and Accounts.
FirstGroup Annual Report and Accounts 2018 175
Financial statements

Glossary
Set out below is a guide to commonly used financial, industry and Group related terms in the Annual Report and Accounts. These are not precise definitions and are included to provide readers with a guide to the general meaning of the terms.
AGMAnnual General Meeting
APBAuditing Practices Board, part of the Financial Reporting Council
BAYEBuy As You Earn
The BoardThe Board of Directors of the Company
CGUCash Generating Unit
CO2(e)Carbon dioxide equivalent, allowing other greenhouse gas emissions to be expressed in terms of carbon dioxide based on their relative global warming potential. Usually expressed as per kilometre or per passenger kilometre
CompanyFirstGroup plc, a company registered in Scotland with number SC157176 whose registered office is at 395 King Street, Aberdeen AB24 5RP
CPIConsumer price index, an inflation measure that excludes certain housing related costs
DefraDepartment for Environment, Food and Rural Affairs (UK Government)
DfTDepartment for Transport
DividendAmount payable per ordinary share on an interim and final basis
EABPExecutive Annual Bonus Plan
EBITDAEarnings before interest, tax, depreciation and amortisation, calculated as adjusted operating profit less capital grant amortisation plus depreciation
EBTEmployee benefit trust
EPAUnited States Environmental Protection Agency
EPSEarnings per share
GHGGreenhouse gas emissions
GPSGlobal positioning system
GroupFirstGroup plc and its subsidiaries
GWRGreat Western Railway franchise
IASInternational Accounting Standards
IFRSInternational Financial Reporting Standards
KPIsKey performance indicators, financial and non-financial metrics used to define and measure progress towards our strategic objectives
LBG London Benchmarking Group, an organisation that has created a framework for measuring community impact
LGPSLocal Government Pension Scheme
Like-for-like revenueRevenue adjusted for changes in the composition of a divisional portfolio, holiday timing, 53rd week, severe weather and other factors, for example engineering possessions in First Rail, that distort the year-on-year trends in our passenger revenue businesses
Local authorityLocal government organisations in the UK, including unitary, metropolitan, district and county councils
LTIPLong Term Incentive Plan
Net debtThe value of Group external borrowings excluding the fair value adjustment for coupon swaps designated against certain bonds, excluding accrued interest, less cash balances
Network RailOwner and operator of Britain’s rail infrastructure
NOxA generic term for the nitrogen oxides that are most relevant for air pollution
Ordinary sharesFirstGroup plc ordinary shares of 5p each
PLCPublic limited company
PPMThe rail industry’s Public Performance Measure reflects punctuality and reliability. Trains are deemed punctual if they arrive at their destination, having made all timetabled stops, within five minutes of scheduled time for London and South East and regional/commuter services and ten minutes for long distance trains
Road divisionsReferences to the ‘Road’ divisions combine First Student, First Transit, Greyhound, First Bus and Group items
ROCEReturn on capital employed is a measure of capital efficiency and is calculated by dividing adjusted operating profit after tax by all assets and liabilities excluding debt items
SAYESave As You Earn
SWRSouth Western Railway franchise
TfLTransport for London, the local government organisation responsible for most aspects of London’s transport system
TOCTrain operating company
TPETransPennine Express rail franchise
TSRTotal shareholder return, the growth in value of a shareholding over a specified period assuming that dividends are reinvested to purchase additional shares
WRI/WBCSDThe Greenhouse Gas Protocol was developed by World Resources Institute and World Business Council on Sustainable Development
FirstGroup Annual Report and Accounts 2018176
Designed and produced by MerchantCantos www.merchantcantos.com
Printed by Park Communications on FSC® certified paper.
Park is an EMAS certified company and its Environmental Management System is certified to ISO 14001.
100% of the inks used are vegetable oil based, 95% of press chemicals are recycled for further use and, on average 99% of any waste associated with this production will be recycled.
This document is printed on Amadeus Offset 100, a paper containing 100% post consumer recycled fibre certified by the FSC®. The pulp used in this product is bleached using an elemental chlorine free (ECF) process.
Principal and registered officeFirstGroup plc 395 King Street Aberdeen AB24 5RP Tel. +44 (0)1224 650100 Fax. +44 (0)1224 650140
Registered in Scotland number SC157176
London corporate officeFirstGroup plc 8th floor, The Point 37 North Wharf Road Paddington London W2 1AF Tel. +44 (0)20 7291 0505 Fax. +44 (0)20 7636 1338
www.firstgroupplc.com
FirstGroup
plc A
nnual Rep
ort and A
ccounts 2018