capital market presentation, may 2021
TRANSCRIPT

Capital Market Presentation, May 2021

Disclaimer
2
This presentation is not the Company’s offer of securities
to the public and should not be interpreted as an offer of
securities to the public. The presentation constitutes the
Company’s principal and marketing presentation. The
information included in this presentation and any other
information that shall be delivered during this
presentation (hereinafter: “the Information”) does not
constitute a recommendation or an opinion of an
investment consultant or a tax consultant. The Information
is only condensed information. Investment in securities, in
general, and in the Company, carries risk. You should take
into account that past data does not necessarily indicate
future performance. The purchase of the Company’s
securities requires an in-depth review of the information
published by the Company and a legal, accounting,
taxation and economic analysis thereof.
Data regarding: (i) distribution of hotels that are open by
months; (ii) a summary of the number of hotels and hotel
rooms according to ownership/ rent/ management,
divided by sectors as of March 2021-which are shown in
slides No. 4, 8 are provided in this presentation for the
first time as additional information.

Fattal Group Business Card
3Including future hotels.
Over 42,000rooms
219hotels
19countries
The Company was established in 1998by Mr. David Fattal
Israel’s largest and leading hotel chain
Fast growth in Europe. More than 100 destinations across Europe
NIS 1.5billion
Cash balances at May 31, 2021

SIGNIFICANT EVENTS DURING AND AFTER THE REPORTING PERIOD
4
COVID 19 Pandemic2020-2021
April May June July August Sept Oct Nov Dec Jan Feb March April May Active
March April May June July Aug Sept Oct Nov Dec Jan- Feb- Mar- Apr- May-
21 21 21 21 21
31.1%26.7%
18.5%
11.1%9.7%
15.9%13.3%
23.9%
35.9%
48.6%
28.9%
14.8%
4.9%2.3%
25.7%
Distribution of chain occupancy rates by months
187
168158
148
1069494
132128132
157142
86
67
15
Distribution of hotels open over recent months

The Corona pandemic –actions by the Company to adapt cash flow expenses to the expected material decrease in revenues:
5
The Company estimates that the performance of the following actions (insofar as these have not yet been performed and / or completed as of the date of signing the report) may result in additional financial resources estimated in approximately over NIS 1.7 billion.Management and the Board of Directors estimate that these operations, together with cash and cash equivalents, in the amount of NIS 1.5 billion, which the Group have on the date of signing this report, will enable the Company to meet all its obligations during the next 12 months at least, after the date of approval of these financial statements and will allow a gradual return to activity routine without the need for additional steps.
Operational optimizationCompany is negotiating postponement or waiving payment of rents
Management fees of controlling shareholder
Receipt of grants • Putting employees on unpaid leave
during the lockdown period and rehiring concurrent with opening of the hotels.
• Salaries reductions and job reduction.• Closing hotels during the lockdown
period and reopening them according to demand. At the time of signing the report, about 168 hotels out of 187 active hotels reopened.
• Operating expenses: reduction of marketing expenses and receiving discounts from suppliers.
• Deferring most of investments and renovations.
The Company received government participations as reimbursement of operating expenses in Europe mainly, about NIS 291 million in 2020 and about NIS 83 million for the period from January to March 2021.
The Company received a grant from the German government in respect of a decrease in revenue turnover of about EUR 48 million.
David Fattal waived his 2019 bonus – about NIS 5.8 million.In addition he waived his management fees for the second quarter of 2020 and about 30% of his management fees from the third quarter of 2020 until the end of the second quarter of 2021.
The Company received deferrals and write offs (to future years) in connection with rent payments of about NIS 260 million for 2020,and about NIS 48 million for the period of January to March 2021.
In addition, the Company is conducting advanced negotiations for deferrals and write offs for the rent of the second quarters of 2021 as well as for rent not yet paid for 2020.

The Corona pandemic –actions by the Company to adapt cash flow expenses to the expected material decrease in revenues (cont.):
6
Possibility of selling hotels in Europe
Financing – banking corporations and issuing bondsRaising of equity Receipt of government
guaranteed loans in significant amounts
August 2020 - Sale of Leonardo Royal Berlin Alexanderplatz hotel (net cash flow for the Company about EUR 17.3 million).
March 2021 - Sale of two hotels in Munich , Germany ( net cash flow amounted to approximately EUR 33 million)
As of date of the financial statements , the following loans were received:Europe: about EUR 67 million.Israel: about NIS 134 million.
Banks in Israel and some European countries deferred Q2-Q4 principals payments of loans for 2020 in total amount of about NIS 280millionas well as Q1 principal payments of loans for 2021 in total amount of about NIS 50 million.
Year of 2020 – Issue of debentures (in a subsidiary) amounting to about NIS 250 million.November 2020 – Issue of convertible bonds amounting to about NIS 315 million.April 2021- Issue of debentures amounting to about NIS 192 million
July 2020 - Raising equity by way of a rights issue of about NIS 99 million (David Fattal’sparticipated by about NIS 57 million).
October 2020 – Completion of private placement of shares for about NIS 50 million.
.

7
Vaccination campaign in the UK: About 57% of the population has been vaccinated.
Occupancy rates in the summer in Israel is expected to be much higher than in previous year.
Broad government support in European countries together with progress in the vaccination campaign.
Business tourism is expected to return gradually in the second half of the year.
2021
Signs of recovery
Opening of the sky and free traveling in the Mediterranean basin (Cyprus and Greece).
Over 60% of the population in Israel has been vaccinated.
A diverse range of hotels adapted to the recovery of the economy in Israel and Europe.
Occupancy rates are rising each month in accordance with the opening of the businesses in Israel and Europe.
Opening of the businesses in Israel (in mid-February 2021) and in UK (in mid-May 2021) .

Number of Hotels1 - Fattal Group
29
28
44
45
11
11
7
7
18
15
59
63
42
41
1
1
4
5
4
4
0
1
1
0
03.21
03.20
03.21
03.20
03.21
03.20
03.21
03.20
אלשר
יפה
רואי
נדרל
איה ו
טנירי
בחר
א
בעלות שכירות ניהול
9
9
52
53
112
48
51
107
May 2021
168Open hotels
Other
UK &
Ireland
Europe
Israel
Ownership Lease Management
81 As of March 31, 2021, including 9 future hotels in Israel (996 rooms), 14 future hotels in Europe (3,685 rooms), 5 future hotels in the United Kingdom (1,140 rooms) and 4 future hotels in Greece and Cyprus
(715 rooms).
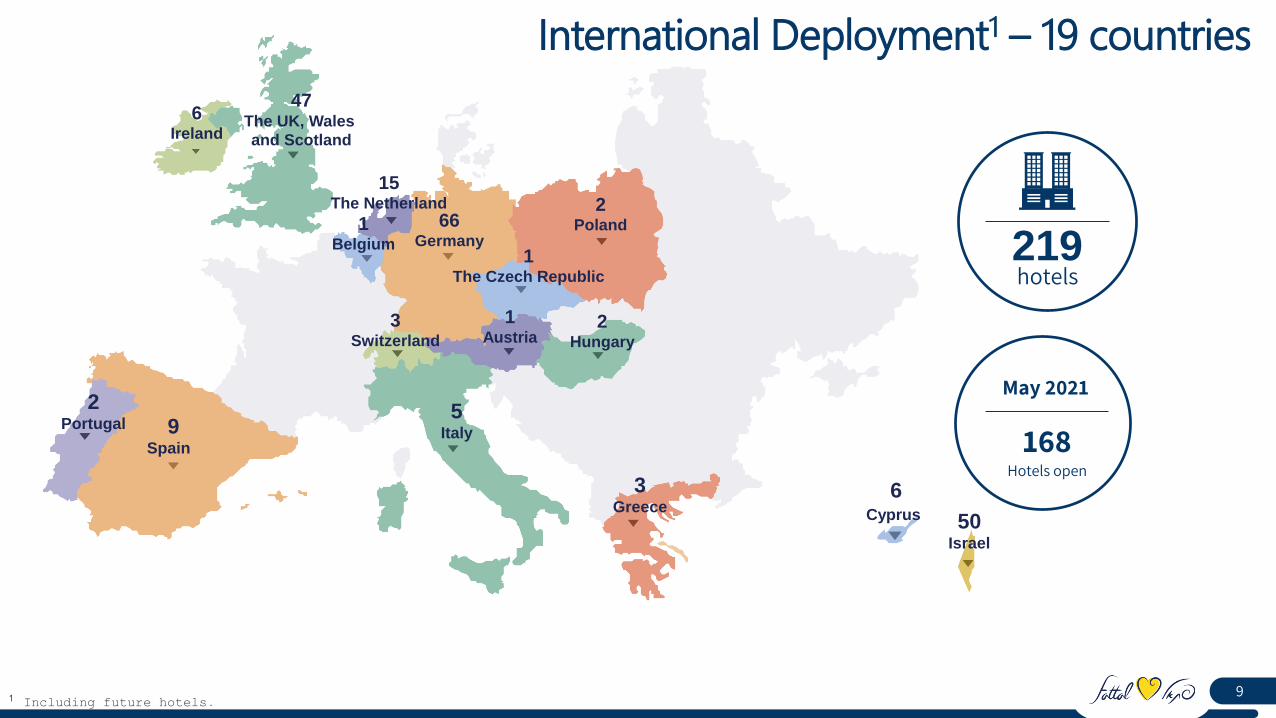
9
International Deployment1 – 19 countries
5Italy
3Greece
6Cyprus 50
Israel
2Hungary
3Switzerland
1Austria
1The Czech Republic
2Poland66
Germany1
Belgium
15The Netherland
6Ireland
1 Including future hotels.
219hotels
168Hotels open
May 2021
9Spain
2Portugal
47The UK, Wales
and Scotland

Company Occupancy Data
10
74%
79%
83%
20192019ספט -ינו
Average Chain Occupancy Rates
(2019)
Israel Europe UK and Ireland
51.0%
45.9%
31.0%
5.1%
3.1%
19.4%
7.6%6.4%
27.0%
60.6%
36.2%
23.0%
3.4%0.9%
21.8% 19.2%17.3%
14.9%13.9%11.6%13.4%
16.0%
30.4%
38.4%
42.6%
32.1%
18.1%
7.3%3.6%
23.8%
30.0%
24.0%
13.0%
16.2%16.4%19.1%
18.3%
35.8%
46.9%45.9%
17.7%
2.6%2.2%
2.2%
37.0%
מרץאפרילמאייונייוליאוגוסטספטמבראוקטוברנובמברדצמברינוארפברואר21-מרץ21-אפר21-מאי
Distribution of Occupancy Rates by Months in 2020/21
March April May June July Aug Sept Oct Nov Dec Jan Feb March April May

11
1 UNWTO is the United Nations World Tourism Organization. It should be noted that the Company did not contact the UNWTO who published the said information for receipt of its consent to the inclusion of the following information, which was publicly
available information announced in March 2021.
2 CBS data
Forecasts and / or scenarios of UNWTO on the manner and duration of recovery of the global hotel industry from the Corona crisis 1
764 809855
911 930 892952 997
10431095
11411193
12411329
14031461
No. of international tourist (millions)1
Tourist arrivals in Israel (millions)2
1.5
1.9 1.82.1
2.62.3
2.8 2.8 2.9 3 2.9 2.8 2.9
3.6
4.1
4.6
2004 2005 2006 2007 2008 2009 2010 2011 2012 2013 2014 2015 2016 2017 2018 2019
49.8 55.4
2004 2019
Rooms in hotels in Israel (thousands)
+11.2%

Main Financial Data
121 Including the relative part of hotels under 50% ownership.
Fattal Chain Revenues (NIS millions) 1
UK and IrelandIsrael Europe Other
1,70
9
709
241
84
1,89
9
674
316
66
1,70
1
498
282 42
137
62
13 10
2019 2020 Jan - Mar 2020 Jan - Mar 2021
202852
1,943
5,446

Main Financial Data (continued)
13
1Including the relative part of hotels under 50% ownership.
EBITDAR (NIS millions) 1
UK and IrelandIsrael Europe Other
13
431
136
33
-16
735
77
74
-31
623
9
56
-26
52
18
-1
2
2019 2020 Jan - Mar 2020
162
Jan – Mar 2021
71-
240
1,841
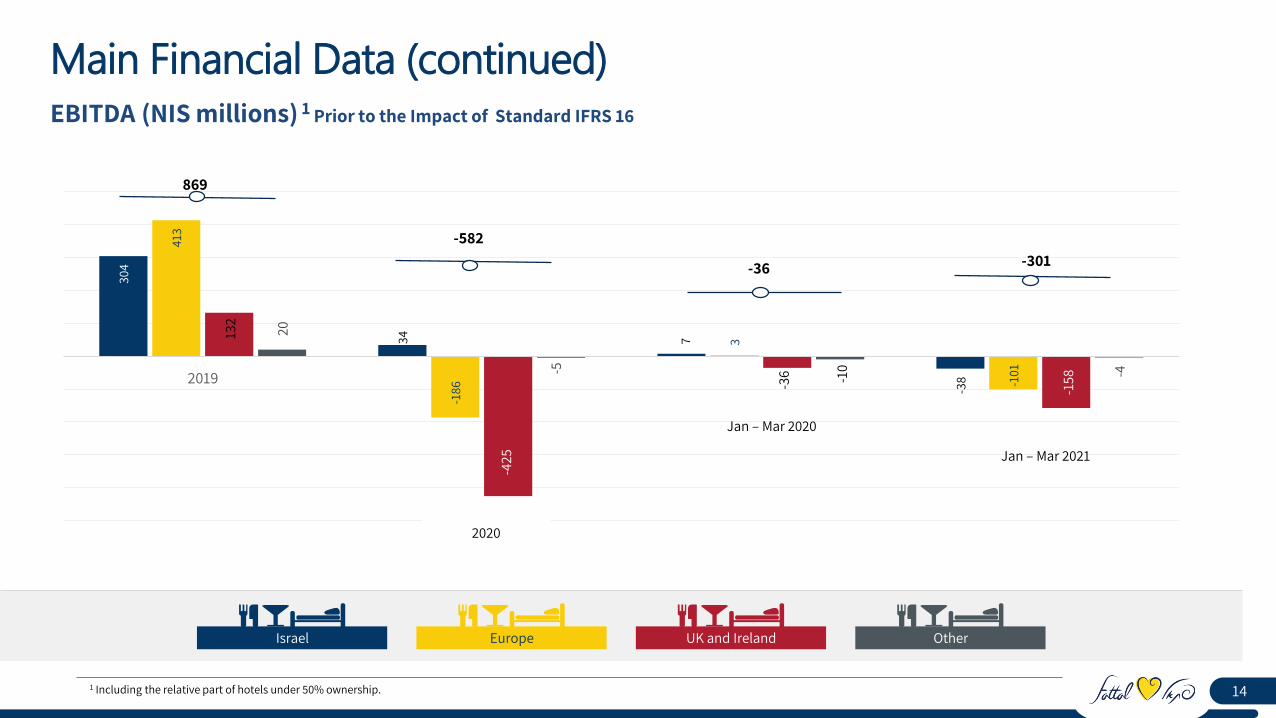
Main Financial Data (continued)14
1 Including the relative part of hotels under 50% ownership.
EBITDA (NIS millions) 1 Prior to the Impact of Standard IFRS 16
UK and IrelandIsrael Europe Other
14
304
34
7
-38
413
-186
3
-101
132
-425
-36
-158
20
-5
-10 -4
2019
2020
-36
Jan – Mar 2020
Jan – Mar 2021
-301-582
869

15
Hotels with Future Opening Date1
1 Future transactions that were signed up to the date of approval of the financial statements
Expected Costs1
DateRomsLocation
(M.EURO)
22021204Owned (50%)Barcelona, Spain152022175Owned (50%)Dublin, Ireland12202274OwnedTel Aviv, Israel
172022217LeasedAthens, Greece7.52022135Owned (50%)Thessaloniki , Greece7.52022165Owned (50%)Limassol, Cyprus18202290OwnedEdinburgh, Scotland
262023207OwnedLiverpool, England
102023198Owned (50%)Nicosia, Cyprus392023236OwnedHamburg, Germany342023275OwnedManchester, England242023144OwnedLisbon, Portugal
232024560Owned (33%)Porto, Portugal 302024218OwnedDead sea, Israel
2,898Total ( 14 Hotels )
DateRoomsLocation
2021200LeasedBristol, England
2021238LeasedNürnberg, Germany
2021234LeasedEschborn, Germany
2021235LeasedAugsburg, Germany
202256LeasedTel Aviv, Israel
202288ManagedJerusalem, Israel
202278LeasedTel Aviv, Israel
2022336LeasedKoln, Germany
2023191LeasedHamburg, Germany
2023209LeasedHamburg, Germany
2023238LeasedKoln, Germany
202390LeasedJerusalem, Israel
202372LeasedJerusalem, Israel
2023152LeasedKibbutz Tzuba, Israel
2023250LeasedKoln, Germany
2023374LeasedBerlin, Germany
2023236LeasedLeipzig, Germany
2024168LeasedJerusalem, Israel
2024283LeasedLiverpool, England
3,728Total ( 19 Hotels )

CONSOLIDATED BALANCE SHEET (NIS millions)
16
Mar 2021 Mar 2020 Dec 2020
Data prior to implementation
of IFRS16Impacts of
IFRS16
As shown in the Financial
Statements
Current Assets 1,737 )58( 1,679 1,633 2,062
Long Term Investments and Other Assets 2,509 12,193 14,702 13,995 14,030
Fixed Assets 5,330 - 5,330 5,868 5,383
Total Properties 9,576 12,135 21,711 21,496 21,475
Short Term Credit 536 - 536 483 526
Other Current Liabilities 1,121 354 1,475 1,242 1,408
Loans and Bonds – Long Term
4,891 - 4,891 4,515 4,932
Deferred taxes 216 - 216 316 263
Others 555 12,477 13,032 12,238 12,396
Total Liabilities 7,319 12,831 20,150 18,794 19,525
Shareholders’ Equity 2,257 (696) 1,561 2,702 1,950
Total Liabilities and Equity
9,576 12,135 21,711 21,496 21,475

Profit and Loss Statement (NIS million)
17
1-3/21 1-3/2020 1-12/2020
Data prior to implementation
of IFRS16Impacts of
IFRS16
As shown in the Financial
Statements
Revenues from Hospitality Services and Others 195 - 195 839 1,904
Total Operating Expenses 265 - 265 674 1,657
Operating income before rent, depreciation and reductions (EBITDAR)
(70) - (70) 165 247
Total Rent 238 (238) 0 2 3
Operating income before depreciation and amortization (EBITDA)
(308) 238 (70) 163 244
Depreciation (75) (160) (235) (238) (961)
Other Expenses, Net (4) 29 25 (87) (41)
Profit before Financing (387) 107 (280) (162) (758)
Financing Expenses, Net (66) (162) (228) (222) (807)
Group’s Share in the Subsidiaries’ Earnings (Losses)
(10) 1 (9) (9) (34)
Tax Benefit 123 14 137 86 275
Net loss (340) (40) (380) (307) (1,324)
Net Earnings Attributed to Shareholders of the company
(339) (40) (379) (307) (1,314)
Net Earnings Attributed to Non-controlling Interests
(1) - (1) - (10)
Real FFO (377) - (377) (79) 543

Cash Flow Statement (NIS millions)
18
1-12/201-3/201-3/21
(254)79)223)Cash flows from operating activities
(327)(265)232Cash flows for investing activities
966366(211)Cash flows from financing activities

Financial
Ratios to Repayment1
19
Debentures (Series C) 1,2
Debentures (Series B) 1,2
1 As of March 31, 2021, the Company meets all the standards to which it is obligated pursuant to review of the proforma as stated in section 11.3.1 in the Directors’ Report .2 For the definition of the terms "net financial debt", "EBITDA" and net CAP, see section 11.3 of the Company's Board of Directors' Report as of March 31, 2021 which is included in the Company’s annual report at that date.
(*) The financial standards in connection with the EBITDA data will not be reviewed from the date ofpublication of the Company's quarterly report as of March 31, 2020 until (inclusive) the date ofpublication of theCompany's quarterlyreport as at March31, 2021
03/2021 As per Trust Deed
Shareholders’ equity2,257 (NIS
million)
Not less than 1,250
(NIS million)
Ratio of equity to total assets 23.6% Not less than 22.5%
Ratio of net financial adjusted
debt to adjusted EBITDA(*) Not more than 8
03/2021 As per Trust Deed
Shareholders’ equity1,561 (NIS
million)
Not less than 1,400
(NIS million)
EBITDA (*)Not less than 700
(NIS million)
Ratio of net financial debt to net CAP 72.6% Not more than 76%
03/2021 As per Trust Deed
Shareholders’ equity1,561 (NIS
million)
Not less than 1,400
(NIS million)
Ratio of net financial debt to net CAP 72.6% Not more than 76%
Convertible Bonds (Series 1) 1,2

Thank you for your attention!