capital markets day - hydro
TRANSCRIPT

Capital Markets DayLondonNovember 30, 2017

Table of contents
Hydro 6
Finance 38
Market Outlook 66
Extruded Solutions 102
Strategic direction – Better, Bigger, Greener 117
Bauxite & Alumina 120
Primary Metal 126
Rolled Products 134
Sustainability 142
2

Safety information at The Andaz
• There are no scheduled fire alarm tests today, so if the fire alarms go off please listen to theannouncements and follow the instructions
• The Fire Assembly point is over in Exchange Square by the Fat Lady statue
• The Event Management Team will be on hand to assist
• The nearest fire exits to this location are:− Out of the entrance doors at the side, and turn to your left or right, the fire exits are indicated by the Green
Running Man sign
• In the event of a medical emergency please inform the Event Management Team, who are trained firstaiders, or where required, can contact the relevant services
3

Cautionary note in relation to certain forward-looking statements
Certain statements included in this announcement contain forward-looking information, including, without limitation, information relating to (a) forecasts, projections and estimates, (b) statements of Hydro management concerning plans, objectives and strategies, such asplanned expansions, investments, divestments, curtailments or other projects, (c) targeted production volumes and costs, capacities orrates, start-up costs, cost reductions and profit objectives, (d) various expectations about future developments in Hydro’s markets,particularly prices, supply and demand and competition, (e) results of operations, (f) margins, (g) growth rates, (h) risk management, and(i) qualified statements such as “expected”, “scheduled”, “targeted”, “planned”, “proposed”, “intended” or similar.
Although we believe that the expectations reflected in such forward-looking statements are reasonable, these forward-looking statements are based on a number of assumptions and forecasts that, by their nature, involve risk and uncertainty. Various factors could cause our actual results to differ materially from those projected in a forward-looking statement or affect the extent to which a particular projection is realized. Factors that could cause these differences include, but are not limited to: our continued ability to reposition and restructure our upstream and downstream businesses; changes in availability and cost of energy and raw materials; global supply and demand for aluminium and aluminium products; world economic growth, including rates of inflation and industrial production; changes in the relative value of currencies and the value of commodity contracts; trends in Hydro’s key markets and competition; and legislative, regulatory and political factors.
No assurance can be given that such expectations will prove to have been correct. Hydro disclaims any obligation to update or revise any forward-looking statements, whether as a result of new information, future events or otherwise.
4
Agenda
07:30 – 08:00 Light breakfast and registration
08:00 – 08:05 Welcome
08:05 – 08:45 Hydro
08:45 – 09:15 Finance
09:15 – 09:30 Q&A
09:30 – 09:50 Break
09:50 – 10:35 Market outlook
10:35 – 11:00 Extruded Solutions
11:00 – 11:15 Q&A
11:15 – 11:35 Break
11:35 – 12:40 Hydro’s strategic direction
Bauxite & AluminaPrimary Metal Rolled ProductsSustainability
12:40 – 12:55 Q&A
12:55 – 13:00 Summary
13:00 – 14:00 Lunch
5

Svein Richard Brandtzæg, President and CEO
Adding value across the value chain
The leading force in aluminium

Lifting the bar for responsibility and sustainability
7
Good for our people, great for business
*Own employees until end-October, including Extruded Solutions**From a life-cycle perspective
Aiming for an injury-freework environment
Part of the solutionImplementing the industry’s most
ambitious climate strategy
Safety first Good citizen Making a positive difference, beinga partner for social development
TRI2.7*
YTD 2017
Makinga positivedifference
Carbon-neutral by
2020**On track

Main developments during 2017
* 1.65 TWh from 2021-2039
Start-up of new state-of-the art dry disposal of bauxite residue using press filter
Developing solution to secure continued RSK production
Completed modifications at UBC recycling facilty
Record-high bauxite & alumina production
Inauguration of Automotive line 3
Karmøy technology pilot on track for first metal Q4 2017
1.65 TWh wind-basedpower sourcing*
Launch of low-carbon aluminium products 4.0 and 75R
Becoming 100% owner in Sapa
Record Sapa results through 2017
8
Bauxite &Alumina
PrimaryMetal
RolledProducts
Energy Extruded Solutions

Integration of Extruded Solutions on track
9
The Hydro model allows all business areas to be run according to their specific business drivers and needs
• New corporate management board forHydro and management group forExtruded Solutions established
• All corporate staffs of former Sapaincorporated into Hydro or re-assignedinto Extruded Solutions
• Extruded Solutions included inHydro’s decentralized operating model
Organizational structure in place
• Confirmed synergies of MNOK 200per year
• Integration costs estimated at MNOK400 over the next two-year period
• Further synergy potentials beingdeveloped, including innovation andR&D
Initial synergypotential confirmed
• Emergency preparedness in placefrom Day 1
• Mapping of all IS/IT systems on trackand integration roadmaps established
• Reporting routines established forHSE, finance and viability
Systems integration on track

10
Aluminium gaining momentum on favorable fundamentals

Source: Global Insight
Geopolitical uncertainty, robust global growth
11
2.4%North-
America
6.5%China
2.1%Europe
Global gross domesticproduct growth 2018% y-o-y
3.2%
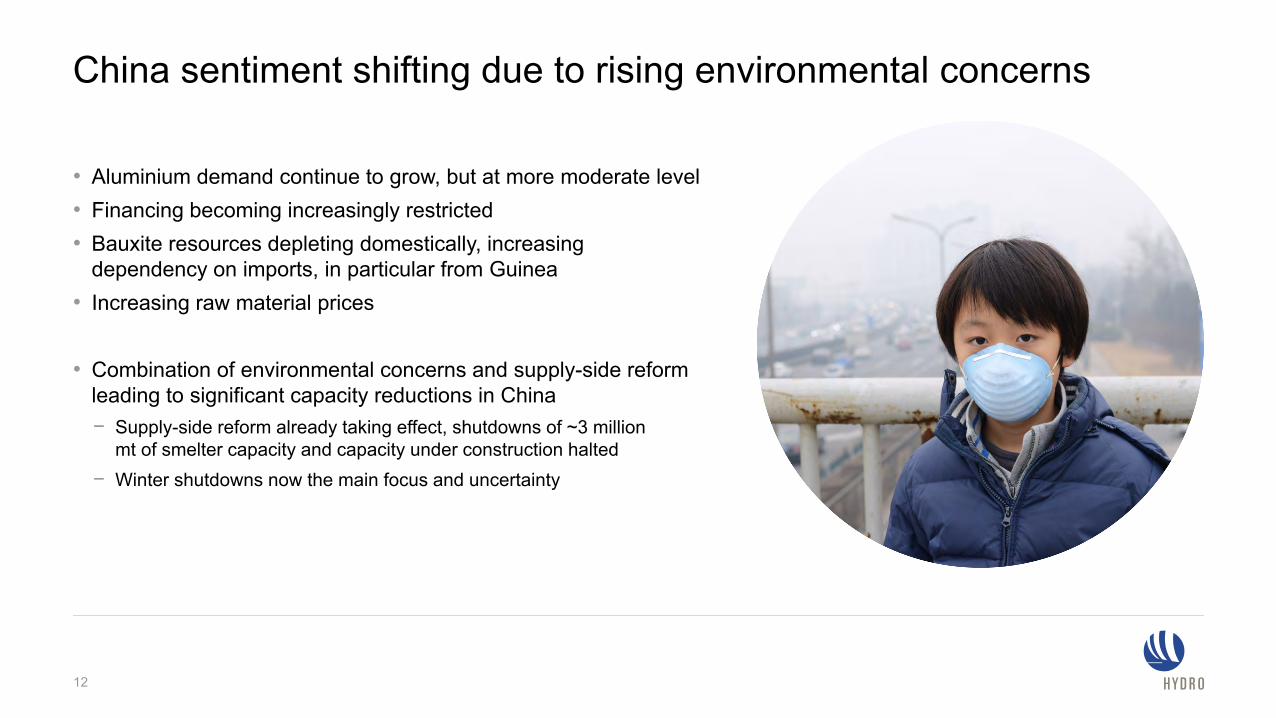
China sentiment shifting due to rising environmental concerns
• Aluminium demand continue to grow, but at more moderate level• Financing becoming increasingly restricted• Bauxite resources depleting domestically, increasing
dependency on imports, in particular from Guinea• Increasing raw material prices
• Combination of environmental concerns and supply-side reformleading to significant capacity reductions in China− Supply-side reform already taking effect, shutdowns of ~3 million
mt of smelter capacity and capacity under construction halted− Winter shutdowns now the main focus and uncertainty
12

Global aluminium market expected to be largely balanced in 2018
13
Inventories trending towards historical levels
Source: CRU, Hydro analysis
Inventory levels, reported and unreported
-2 000
-1 000
0
1 000
2 000
Expect largely balanced primary market in 2018Global, in thousand tonnes
0
20
40
60
80
100
120
140
-1000
1000
3000
5000
7000
9000
11000
13000
15000
2006 2007 2008 2009 2010 2011 2012 2013 2014 2015 2016 2017E2018E
Total stocks Total inventory days
Historical average before financial crisis
Global
China
World ex. China

Continued strong long-term outlook for aluminiumCAGR 2017-2027
Source: CRU, Hydro analysis* Process and post-consumer scrap
Semis~3%
Primary2-3%
Recycling3-4%*
14

15
Delivering on Hydro’s overall strategic direction

Fully integrated across the aluminium value chain and marketsBroad products and solutions offering from bauxite to end-user products
16
Machinery &equipment
Transport &automotive
Building &construction
Packaging Electronics & electrical
Consumerdurables
Bauxite
Alumina
Energy
Primary Metal
Rolled Products
Extrusion
Recycling

Bauxite
Alumina
Energy
Primary Metal
Rolled Products
Extrusion
Recycling
Hydro – differentiating through the integrated model
Source: graphical illustration based on company websites/reports, CRU
17

Strong global presence throughout the aluminium value chain
Top 3positions in
3rd-party bauxite& alumina
marketglobally1
#2 positionin rolledproducts
#1 positionextruded solutions
10 TWh in the Nordic
power market
#1 positionextruded solutions
#1 positions
foil and lithoglobally
#1 position
precision tubing
globally
#1positionin value
added metal products2
#3 position extrusion
ingot
Top 3positions in extrusion ingot and
PFA3Bauxite & Alumina
Extruded Solutions
Primary Metal
Energy
Rolled Products
Built on market understanding, customer closeness and competence
18
Europe
#2 positionbuilding systems
North America
AsiaGlobally
1 Outside China 2 Extrusion ingot, sheet ingot, primary foundry alloys and wire rod 3 Primary Foundry Alloys
The complete aluminium company• High-quality bauxite and alumina production in Brazil
• Primary production in Norway, Germany, Qatar,Slovakia, Brazil, Canada, Australia
• 10 TWh captive hydropower production
• European #2 in rolled products
• World leader in aluminium extruded profiles
• Remelting in the US, European recycling network
• Unparalleled technology and R&D organization

Better, Bigger, Greener
19
Raise performance andimprove customer offering
• Extend Hydro’s leadership in advancedtechnology and product innovation
• Create value through raw materials access,customer collaboration and integrated model
• Continue benchmark performance andensure attractive returns over the cycle
Expand the use of aluminium and strengthen Hydro’s platform for growth
• Promote Hydro and aluminium through value-adding products and solutions for our customers
• Be the preferred partner and mosttrusted voice of the aluminium industry
• Pursue selective growth from raw materialsto products, solutions and recycling
Lead the transitiontowards sustainable solutions
• Advocate aluminium as a building blockfor the low-carbon, circular economy
• Continue to improve footprint from ownproduction, recycling and sustainable solutions
• Making a positive difference by strengtheninglocal communities and our business partners
Better Bigger Greener
Hydro’s aspiration for higher value creation

20
Creating value across the aluminium value chain

Leading the industry in innovation, R&D and product developmentDriving technological development to support customers, increase market share and lift efficiency
21
Low-carbon, circular
solutions
Digitalizationand Industry
4.0
Next-generationelectrolysis
Automotivelightweighting

PVC
Lightness and formability
Corrosion resistance
Price
Climate footprint
Recyclability
Durability
Steel Copper
Why aluminium?Hydro’s strategic direction aims to realize full potential of aluminium’s strong qualities and versatility
22
For illustrative purposes only
Aluminium Composites
Lightness and strength
Durability and formability
Corrosion resistance
Conductivity
Recyclability
Energy-intensity
Strength and durability
Recyclability
Price
Weight
Corrosion
Energy-intensity
Conductivity
Corrosion resistance
Recyclability
Price
Weight
Energy-intensity
Lightness
Strength
Price
Recyclability
Climate footprint
Energy-intensity

Hydro launches its first certified sustainable products
23
Converting our industry-leading climate position into products for the low-carbon, circular economy
4.0 has a guaranteed maximum carbon footprint of 4 kg CO2/ kg aluminium
75R has a guaranteed minimum post-consumer
scrap content of 75%

Operational and commercial excellence
24
Bauxite & Alumina Energy Primary Metal Rolled Products Extruded Solutions• Increased and stabilized
production at Alunorte and Paragominas
• Raw material efficiency
• Commercial and procurement improvements
• Highly competitive operational costs
• Strong effort on global sourcing activities
• Commercial excellence
• Increased productivity and improved consumption factors
• Continued move towards higher-margin segments
• High-grading portfolio
• Roadmaps to solve operational and ramp-up challenges
• Strong customer collaboration and satisfaction
• Succesfull value-over-volume strategy
• Strong customer collaboration and satisifaction
Raw materials, processing and energy Primary production, marketing and recycling Products and solutions
Metal Markets
Focus on cost efficiency and process technologyCentralized business model
Focus on margin management and product innovationDecentralized business model
• High share of value-added products
• Increased use of post-consumer scrap
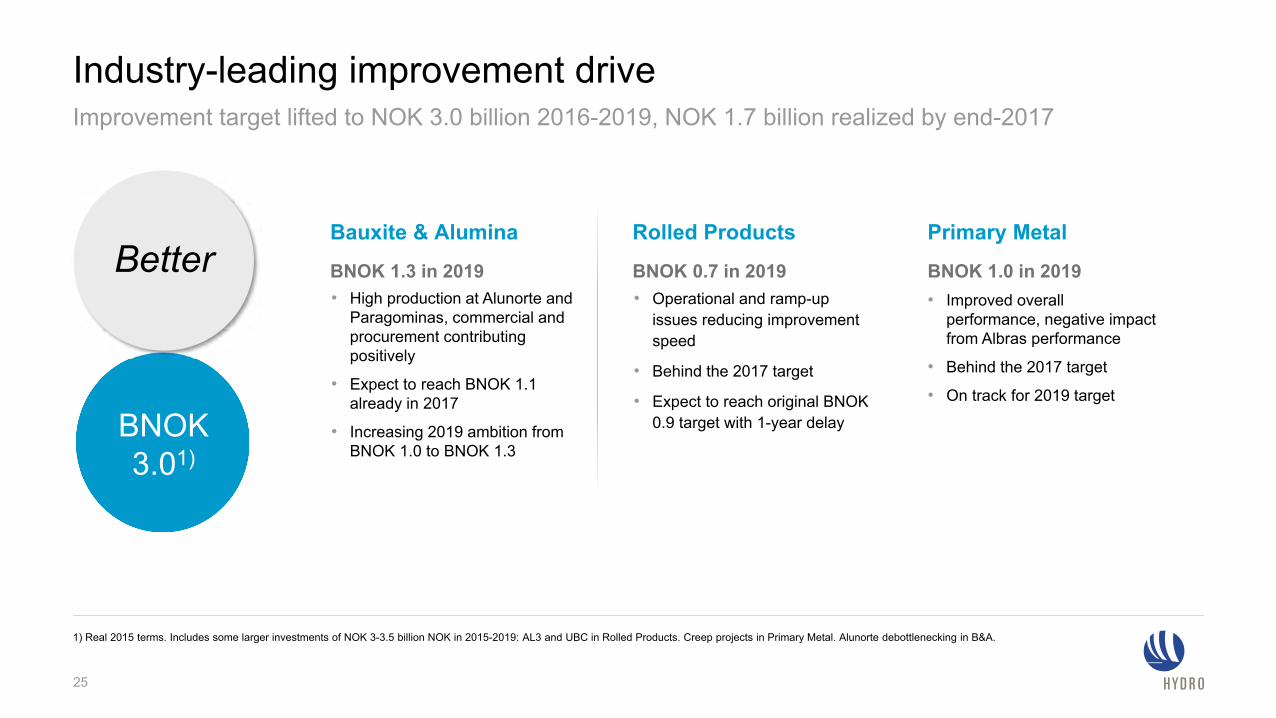
• Improved overall performance, negative impact from Albras performance
• Behind the 2017 target
• On track for 2019 target
• High production at Alunorte and Paragominas, commercial and procurement contributing positively
• Expect to reach BNOK 1.1 already in 2017
• Increasing 2019 ambition from BNOK 1.0 to BNOK 1.3
Industry-leading improvement driveImprovement target lifted to NOK 3.0 billion 2016-2019, NOK 1.7 billion realized by end-2017
• Operational and ramp-up issues reducing improvement speed
• Behind the 2017 target
• Expect to reach original BNOK 0.9 target with 1-year delay
1) Real 2015 terms. Includes some larger investments of NOK 3-3.5 billion NOK in 2015-2019: AL3 and UBC in Rolled Products. Creep projects in Primary Metal. Alunorte debottlenecking in B&A.
25
Primary MetalBauxite & Alumina Rolled Products
BNOK 1.3 in 2019 BNOK 0.7 in 2019 BNOK 1.0 in 2019
BNOK 3.01)
Better

Among the best positioned in the industry upstream
26
Source: Republished under license from CRU International LtdAssumptions: Aluminium cost curve: LME USD 2 100, alumina USD 465, NOK/USD 8.2. Alumina cost curve: caustic soda USD 600, USD/BRL 3.26
Smelter BOC curve by company (2017)Alumina BOC curve by company (2017)
0
100
200
300
400
0 30 000 60 000 90 000 120 000
USD/mt
0
400
800
1 200
1 600
2 000
2 400
0 15 000 30 000 45 000 60 000
USD/mt
mt mt

Primary aluminium in premium segment for casthouse products
27
Extrusion ingots customer value survey 2017*
*2017 Customer satisfaction survey for Europe performed by Malik (PIMS)
Bubble size indicates market share
poor customer value
Premium segment
good customer
valueCommodity segment
Rel
ativ
e pe
rcei
ved
pric
e
Relative perceived quality
Hydro extrusion ingot
Competitors extrusion ingot
25% 50%10%

92
96
100
104
108
112
2014 2015 2016
Strong and improving customer satisfaction downstream
92
96
100
104
108
112
2009-2011 2012-2014 2015-2017
28
Competence, flexibility and advanced products are key success factors
* Customer survey measuring satisfaction level for customers of Rolled Products. Survey is performed by external company (Skopos) and results are based on answers to a standard set of questions. Rating between 0-100 and indexed in the graph. ** Customer survey measuring satisfaction level for customers of Extruded Solutions Europe. Percentage of customers being «very pleased» or «pleased» are indexed in the graph
Rolled Products customer satisfaction survey* Extruded Solutions Europe customer satisfaction survey** Satisfaction level indexed Satisfaction level indexed

Securing long-term competitive power sourcing for smelter portfolio1.65 TWh/year from 2021 sourced for the Norwegian smelter portfolio since last CMD
* Net 8 TWh captive assumed available for smelters
0
5
10
15
20
2017
2018
2019
2020
2021
2022
2023
2024
2025
2026
2027
2028
2029
2030
2031
2032
2033
TWh
Statkraft 6.4 TWh New contract since last CMDOther contracts RSK volumesCurrent captive Total consumption at full capacity incl. Karmøy pilot
Sourcing platform for fully-owned smelters, Norway*
29
Utilizing wind power to strengthen Hydro’s renewables
base in Norway

0
5
10
15
20
2015
2016
2017
2018
2019
2020
2021
2022
2023
2024
2025
2026
2027
2028
2029
2030
2031
2032
2033
TWh
Securing long-term competitive power sourcing for smelter portfolio
* Albras and Slovalco on 100% basis
30
TextProviding Hydro’sglobal assets withcompetitive power
sourcing
Sourcing platform for JVs and Neuss smelter*
Alouette

31
Our financial framework for increased value-creation

Driving long-term shareholder valuePriorities for cash over the cycle
M&A
Distribution to shareholders
Organic growth
32
Predictable dividend
Sustaining capex and selective growth
Strong balance sheet and cash generation

14% 11%
28%
0%
10%
20%
30%
40%
50%
60%
2016 Q3 2017
Hydro Hydro incl Sapa*
33
* Estimate including Sapa** Cash flow from operations; directly from cash flow statement Hydro/Sapa
Adjusted net debt / Equity
Funds from operations / Adjusted net debt
95%
150%
65%
0%
40%
80%
120%
160%
2016 Annualized Q3 2017
Strong balance sheet and cash generation
Target >40%
Target <55%Operating cash flow, in NOK billion
Cash flow generation strengthened by Sapa-acquisition**
12.2
10.0
14.415.0
13.0
16.2
LTM 3Q1720162015
Hydro Hydro incl Sapa*

Capital allocation - sustaining capex
• Long-term sustaining capex BNOK 5.5 – 6, including Extruded Solutions
• Main sustaining projects 2018-2020: − Bauxite residue disposal area− Opening of new bauxite mining area− Pipeline replacement− Primary rectifiers and asset integrity Albras− Smelter relining
34
Sustaining capital expendituresIn NOK million
6.8
5.6
0
1
2
3
4
5
6
7
8
2019E / 2020E2018E2017E
6.5 – 7.0
Long-term sustaining capex

• Presence in full value chain and all market segments gives increased growth opportunities
• Projects evaluated on strategic and economic merit− Differentiated cost of capital between business areas
• Incremental growth projects 2018 – 2020 includes smaller creep and productivity improvements
• Capex related to specific growth projects will be announced when decision is made
35
Capital allocation – selective growth

-1.0
-0.5
0.0
0.5
1.0
1.5
2.0
2.5
3.0
3.5
2012 2013 2014 2015 2016
EPS* Dividend
Dividend policy
• Aiming for competitive shareholder returns compared to alternative investments in peers
• Dividend policy: − Ordinary dividend: 40% of net income over the cycle
− Floor of NOK 1.25 per share, committed to a predictable dividend level
• Five-year average ordinary payout ratio 2012-2016of 133%
• Share buybacks and extraordinary dividends as supplement in periods with strong financials and earnings outlook
36
* Earnings per share
133% Average
payout ratio2012-2016
256% 101%
40%Payout ratio, in NOK/share

37
Hydro 2018Lifting performance, driving value creation, extending industry leadership
• Maintaining financial strength and flexibility,providing attractive returns over the cycle
• Strengthening competitiveness andresolving operational challenges
• Differentiating through the integrated modeland integrating Extruded Solutions

Eivind Kallevik, CFO
FinanceMaximizing the potentialfor value creation

Prudent financial framework
39

Prudent financial frameworkManaging industry cyclicality, driving long-term shareholder value
1) Real 2015 terms2) Funds from operations / adjusted net debt3) Adjusted net debt / Equity4) With Karmøy Technology Pilot net investment, after ENOVA support and including Extruded Solutions
Improving efficiency, strengthening margins
Improvement efforts• 5.9 BNOK 2009-2016 • 0.3 BNOK 2017E• 1.3 BNOK 2018-2019E 1)
Managing working capital
Lifting cash flow potential
Effective risk management
Volatility mitigated by strong balance sheet and relative positioning
Hedging policy• Operational LME and
currency hedging• Limited financial hedging
Diversified business
Disciplined capital
allocation
Long-term sustaining capex below depreciation • 5.5 – 6.0 BNOK per year
Total capex incl. growth• 2017E BNOK 7.74)
Selective value-add growth
Attractive organic growth prospects and M&A optionality
Reliable shareholder
remuneration policy
Sector competitive TSR
Dividend policy since 2016• Dividend 1.25 NOK/share
(floor)• 40% payout ratio of Net
income over the cycle
Special dividends and share buybacks in the toolbox
Financial strength
and flexibility
Investment grade credit rating
Financial ratio targets over the cycle• FFO/aND 2) > 40%• aND/E 3) < 55%
Strong liquidity

Supporting earnings with industry-leading improvement ambitions
Hydro UEBIT including Hydro Extrusions before 2013 and 50% of Sapa Net Income after 2013. * YTD Q3-2017 annualized** Sapa 100% Underlying EBIT less 50% underlying net income - Q3 2017 annualized incl. excess value depreciation*** Remaining improvement programs in real 2015 terms
NOK billion
Underlying EBIT development Better improvement ambition by category, 3.0 BNOK 2016-2019
LIFTING CASH FLOW POTENTIAL
Volume/capacityFixed costProcess improvementCommercial improvements/high-gradingOther
13.11.311.81.6
10.2
4.0
6.2
UEBIT E2019
Improvements 2018-2019***
UEBIT 2017E incl 100% Sapa
100% Sapa**
UEBIT 2017*
Improvements
6.2
UEBIT 2017* excl.
Improvements
Less USD 300 2009-
2011
Inflation and other
Net product price
Raw materials
Net Currency
UEBIT 2011
Better ambition 2016-2019Improvements 2011-2015Improvements 2009-2011

Sapa adds significant operating cash flow from day 1, with further improvement potential and growth opportunities
42
* From cash flow statements Hydro and Sapa** Estimate including Sapa
12.2
10.0
14.415.0
13.0
16.2
LTM Q3 1720162015
Hydro incl Sapa**Hydro
NOK billion
Cash flow from operations*
CAGR+28%
LTM Q3 17
2 874
2016
2 563
2015
2 002
2014
1 370
Sapa (100%) Underlying EBITDA per mt NOK
• BNOK 1 restructuring on annual basis delivered ahead of plan
• Further potential for value-creation− Increasing share of value-added sales
− Simplification and collaboration drive for continued profitability improvement
− Selective investments in capabilities and capacity to support value-over-volume strategy
• Estimated synergies 200 MNOK per year
LIFTING CASH FLOW POTENTIAL
CAGR+28%

Rolled Products: Challenging 2017, investing for future growth
Rolled Products Underlying EBIT per mt
LIFTING CASH FLOW POTENTIAL
NOK
43
376
783
305
777738
1 014
2015
1 2041 248
2014 LTM Q3 172016
UEBIT/mt incl NeussUEBIT/mt ex Neuss
• Operational issues reducing cash flow in 2017− Production performance at Alunorf and Hamburg have been stabilized
− Technical issues related to the UBC line mitigated, full ramp-up to>40 000 mt expected by year-end 2018
− Qualification process ongoing for the Automotive Line 3, technicalissues have been identified and are currently being resolved
• Gradual improvement during the next years− Negative effect from the Neuss smelter to be mitigated with a more
competitive power contract from 2018, positive effect of MNOK 350-400/year
− Offsetting negative effect of MNOK ~ 250/year in Energy
− Product mix improvement and further high-grading through ramp-up ofUBC and AL3

Increasing margins upstream, raw material cost push
1) Realized alumina price minus underlying EBITDA for B&A, per mt alumina sales2) Realized all-in aluminium price minus underlying EBITDA margin, including Qatalum, per mt aluminium sold. Implied primary cost and margin rounded to the nearest “25” 3) Realized LME plus realized premium, including Qatalum
All-in implied primary cost and margin, USD/mt 2)
350 500475
300425
2 179
1 725
2014 LTM Q3 17
2 125
1 7001 925
2016
1 838
1 550
2015
2 353
1 875
2013
2 271
Implied margin Implied cost
Realizedall-in price 3)
LIFTING CASH FLOW POTENTIAL
3 700 2 5003 0752 100
44
3 625
USD/NOK 5.9 6.3 8.0 8.4 8.4
Impliedmargin in NOK
Implied alumina cost and margin, USD/mt 1)
259 250215 197
234
3461
43
66
LTM Q3 17
300
2016
240
2015
276
2014
284
2013
27516
Impliedmargin in NOK
485 36021394 555
Realizedalumina price
USD/BRL 2.1 2.4 3.3 3.5 3.2

Optimizing working capital remains key priorityLIFTING CASH FLOW POTENTIAL
45
17 17 17 1820
2122 22 22 21 20 20 20 20 21
57 5653 52 53 54 56 57 57 56 55 54 52 51 52
20
30
40
50
60
70
80
0
5
10
15
20
25
Q1-
2014
Q2-
2014
Q3-
2014
Q4-
2014
Q1-
2015
Q2-
2015
Q3-
2015
Q4-
2015
Q1-
2016
Q2-
2016
Q3-
2016
Q4-
2016
Q1-
2017
Q2-
2017
Q3-
2017
* Last twelve months moving average
• Net operating capital generally follows LME
• Extruded Solutions average working capital around 5 BNOK
• Extruded Solutions reducing overall net operating capital days due to shorter lead times between suppliers and customers
• Reduced net operating capital days in 2016 and 2017 from the high inventory build-up throughout 2015
DaysNOK Billion
Net operating capital (NOC)* Hydro Net operating capital (NOC)* Sapa NOC days, incl. Sapa

Maintaining a solid balance sheet and investment-grade credit ratingStrong liquidity, also following the Sapa acquisition
1) 2015 FFO/aND ratio has been restated due to change of definition2) Estimate including Sapa
11 %14 %20 %
26 %22 %19 %
24 %
11 %
32 %
0 %
10 %
20 %
30 %
40 %
50 %
60 %
201120102009 20162015201420132012
<55 %
Q3 2017
28 %2
150 %
95 %84 %
42 %33 %39 %42 %
118 %
1 %0 %
50 %
100 %
150 %
2014201320102009 201620151
>40 %
LTM Q3-17
65 %2
20122011
Funds from operations1 / Adjusted net debt
Adjusted net debt / Equity
(4.2)
(4.1)
(7.6)
(6.9)
(6.9)
(6.5)
(5.5)
6.0
7.7
(7.5)(6.9) (4.7)
(12.8)
(9.9)
(24.6)
Debt in EAI
Operating leases and other
Net cash
Net pension liability
Adjusted net debtNOK billion
Sep 30, 2017
46
Jun 30, 2017
Hydro incl SapaHydro
Sep 30, 2017 (estimate incl. Sapa)
FINANCIAL STRENGTH AND FLEXIBILITY

Successful financing of the Sapa-transaction in the Norwegian and Swedish bond markets
47
• Successful placement of bonds in Norway and Sweden
• Very strong interest and highly competitive terms achieved
• Total amount: NOK 3 billion and SEK 3 billion − 2Y SEK 1 billion fixed rate note with a coupon of 0.125% p.a.
− 3Y SEK 1 billion floating rate note with a coupon of 3m Stibor + 0.75% p.a.
− 5Y SEK 1 billion fixed rate note with a coupon of 1.00% p.a.
− 5Y NOK 2 billion floating rate note with a coupon of 3m Nibor + 0.75% p.a.
− 7Y NOK 1 billion fixed rate note with a coupon of 2.5% p.a.
• DNB, Nordea and Handelsbanken Joint Lead Managers
FINANCIAL STRENGTH AND FLEXIBILITY

Long-term sustaining capex around NOK 5.5-6.0 billionHigher than average sustaining capex 2018-2020 mainly driven by sustaining investments in Brazil
* Real 2017 figures** Red mud disposal area at Alunorte, tailing dam investments at Paragominas and opening of a new mining area at Paragominas
0
1
2
3
4
5
6
7
8
2017E 2018E
6.5 – 7.0~6.8
2019E / 2020E
~5.6
8
7
6
5
4
3
2
1
0
4.2
2016
5.7
20152014
5.8
NOK billion
48
B&A sustaining projects** Sustaining ES Sustaining excl. ESSustaining excl. ESSustaining ESB&A sustaining projects**
LT sustaining capex
DISCIPLINED CAPITAL ALLOCATION

Growth capex focused on high-grading, recycling and technology Majority of sustaining capex allocated upstream
• Sustaining projects for 2018-2020:− Bauxite residue disposal area− Opening of new bauxite mining area− Pipeline replacement− Primary rectifiers and asset integrity Albras− Smelter relining
• Ongoing organic growth projects:− Productivity improvements across the portfolio
• Karmøy technology pilot 2015-2018:− Gross investment 4.3 BNOK− Of which Enova support 1.6 BNOK− Net investment 2.7 BNOK
• Capex related to specific growth projects will be announced when decision is made
NOK billion
0
2
4
6
8
10
2015
6.2
2014
4.3
2017E
~7.7
2016
7.9
2019E / 2020E
7.5 – 8.0
2018E
~8.1
DISCIPLINED CAPITAL ALLOCATION
49
Sustaining capex*Growth projects and incremental growth*Karmøy technology pilot (net of Enova support)
* Includes Extruded Solutions

Capital allocated across the value chain, based on estimated premium above cost of capital
50
* Real after tax** Hydro Extruded Products 2010-2012, 50% of underlying EBITDA Sapa JV 2013-2017 (pro forma figures until closing 2013)Upstream: Bauxite & Alumina, Primary Metal. Downstream: Extruded Solutions, Rolled Products, Metal Markets
Underlying EBITDABNOK
Return requirements dependent on project specific risk assessments
• Increased growth opportunities through presence in full valuechain and all market segments
• Upstream− Cost of capital reflecting higher capital intensity and expected volatility− Focus: creep projects, cost efficiency and debottlenecking
• Downstream− Lower required cost of capital, more stable margins− Focus: high grading portfolio, increasing exposure in higher-margin
segments
• Energy− Stable cash flows from high-quality hydro power assets in Norway− Focus: securing RSK volumes and values, new hydropower projects
Hydro Cost of capital
7.5 %*
8-9%*
5-6%*
4-5%*
0
2
4
6
8
10
12
14
16
18
2010 2011 2012 2013 2014 2015 2016 2017 YTDQ3
annualizedEnergy Downstream** Upstream
DISCIPLINED CAPITAL ALLOCATION

51
Hydro before transaction:Capital employed by end Q3-17
BNOK ~80
B&A PM MM RP Sapa Energy
Capital employed pie-charts excludes other & eliminations of negative ~7.7 BNOK* Indicative estimate
Hydro after transaction:Capital employed by end Q3-17
BNOK ~96
B&A PM MM RP Extruded Solutions Energy
Downstreamup from
23% to ~35% of capital employed
Hydro depreciation after transaction: In BNOK
~5.8
Sapa depreciation LTM Q3 17
Hydro depreciation LTM Q3 17
~1.3
Excess value depreciation
Extruded Solutions*
~0.4~7.5
Depreciation Hydro after transaction
Increasing relative share of downstream exposureDISCIPLINED CAPITAL ALLOCATION

52
Hydro before transaction:Underlying EBITDA LTM Q3-17
BNOK 15
B&A PM MM RP Sapa Energy
Underlying EBITDA pie-charts excludes other & eliminations of negative ~0.5 BNOK* Indicative estimate
Hydro after transaction:Underlying EBITDA LTM Q3-17
BNOK 18
B&A PM MM RP Extruded Solutions Energy
Downstreamup from
14% to ~27% of underlying
EBITDA
~5.8
Sapa depreciation LTM Q3 17
Hydro depreciation LTM Q3 17
~1.3
Excess value depreciation
Extruded Solutions*
~0.4~7.5
Depreciation Hydro after transaction
Increasing relative share of downstream exposure
Hydro depreciation after transaction: In BNOK
DISCIPLINED CAPITAL ALLOCATION

Limited financial hedging, flexible business modelHistorical correlations between commodities and currencies indicate a natural earnings hedge
Source: Thomson Reuters, Hydro analysis
• Hedging strategy− Fluctuating with the market: revenues primarily exposed to LME, PAX and USD− Volatility mitigated by strong balance sheet− Strengthening relative position to ensure competitiveness
• Diversified business− Upstream cyclicality balanced with more stable earnings downstream− Exposed to different markets and cycles
• Bauxite & Alumina− Currency exposure, mainly USD and BRL− Exposed to LME and Platts alumina index prices
• Primary Metal− Operational LME hedging - one-month forward sales− Currency exposure, mainly USD, NOK and BRL
• Metal Markets, Rolled Products, Extruded Solutions− Operational LME and currency hedging to secure margin
• Flexibility to hedge LME or currency in certain cases
• Long-term debt in currencies reflecting underlying exposures and cash generation, also considering attractiveness in main financial markets
EFFECTIVE RISK MANAGEMENT
LME
USD/NOK
Brent blend
- 74 % - 74 %
71 %
Monthly correlations 1994-2016
Cross-correlations between currencies and commodities
53

Sensitivities and scenarios
54

Significant exposure to commodity and currency fluctuations
* Including Extruded Solutions** 2018 Platts alumina index exposure*** Europe duty paid standard ingot premium
Currency sensitivities +10%*Aluminium price sensitivity +10%*NOK million
• Annual sensitivities based on normal annual business volumes, LME USD 1 925 per mt, fuel oilUSD 420 per mt, petroleum coke USD 325 per mt, caustic soda USD 510 per mt, coal USD 80 per mt,USD/NOK 8.10, BRL/NOK 2.50, EUR/NOK 9.40
• Aluminium price sensitivity is net of aluminium price indexed costs and excluding unrealized effects relatedto operational hedging
• BRL sensitivity calculated on a long-term basis with fuel oil assumed in USD. In the short-term, fuel oil isBRL-denominated
• Excludes effects of priced contracts in currencies different from underlying currency exposure(transaction exposure)
• Currency sensitivity on financial items includes effects from intercompany positions• 2018 Platts alumina index (PAX) exposure used
NOK million USD BRL EUR
UEBIT 3 450 (1 210) (220)
UEBITDA 3 540 (900) (80)
UEPS 1.17 (0.37) (0.07)
Sustainable effect:
One-off reevaluation effect:
Financial items (70) 610 (1 890)
Underlying Net Income
3 5002 700
UEBIT
UEPS+1.18
NOK/share
Other commodity prices, sensitivity +10%*NOK million
(50)(90)(240)(230)(240)
410270
Standard ingot
premium***
Realized PAX**
Pet coke Fuel oil CoalCaustic soda
Pitch
USD 310 per mt
USD 510per mt
USD 80per mt
USD 140 per mt
USD 420per mt
USD 325per mt
EUR 540per mt
55

Bauxite & Alumina sensitivities
* 2018 Platts alumina index exposureCurrency rates used: USD/NOK 8.10, BRL/NOK 2.50, EUR/NOK 9.40
Revenue impact• ~14.5% of 3-month LME price per tonne alumina− ~One month lag
• Realized alumina price lags PAX by one month
Cost impactBauxite• ~2.45 tonnes bauxite per tonne alumina• Pricing partly LME-linked for bauxite from MRN
Caustic soda• ~0.1 tonnes per tonne alumina• Prices based on IHS Chemical, pricing mainly monthly per shipment
Energy• ~0.11 tonnes coal per tonne alumina, Platts prices, one year volume
contracts, weekly per shipment pricing• ~0.11 tonnes heavy fuel oil per tonne alumina, prices set by
ANP/Petrobras in Brazil, weekly pricing (ANP) or anytime (Petrobras)• Increased use of coal as energy source in Alunorte
USD 1 925per mt
USD 420 per mt
USD 510per mt
USD 80per mt
USD 310 per mt
Annual sensitivities on underlying EBIT if +10% in priceNOK million
(50)(240)(230)
1,230
180
CoalCaustic sodaFuel oilRealized PAX*Aluminium
Currency sensitivities +10%
NOK million USD BRL EUR
UEBIT 990 (820) -
56
1 230

Primary Metal sensitivities
* Europe duty paid. Hydro Q3’17 realized premium USD 261 per mt** 2018 Platts alumina index exposureCurrency rates used: USD/NOK 8.10, BRL/NOK 2.50, EUR/NOK 9.40
Revenue impact• Realized price lags LME spot by ~1-2 months• Realized premium lags market premium by ~1-2 months
Cost impactAlumina• ~1.9 tonnes per tonne aluminium• ~14.5% of 3-month LME price per tonne alumina, increasing volumes
priced on Platts index− ~ 1-3 months lag
Carbon• ~0.35 tonnes petroleum coke per tonne aluminium,
Pace Jacobs Consultancy, 2-3 year volume contracts, quarterly pricing• ~0.08 tonnes pitch per tonne aluminium, CRU, 2-3 year volume
contracts, quarterly pricing
Power• 13.7 MWh per tonne aluminium• Long-term power contracts with indexations
USD 1 925per mt
USD 325per mt
EUR 540per mt
USD 140per mt*
USD 310per mt
Annual sensitivities on underlying EBIT if +10% in priceNOK million
(90)(230)(750)
250
3,090
Standard ingot premium
Aluminium Realized PAX ** PitchPet coke
Currency sensitivities +10%
NOK million USD BRL EUR
UEBIT 2 060 (390) (230)
57
3 090

Commodities and currencies need to be seen in tandem Spot prices and currency rates indicate earnings upside
* Run rate – market rates as of November 23, 2017
Change in LME price
Cha
nge
in U
SD
/NO
K
Underlying EBIT sensitivity to changes in LME and USD/NOK
Key variables “run-rate”* vs Q3-17 realized
Q3-17 realized Run-rate* % change
LME 1 925 2 100 9 %
PAX 310 450 45 %
USD/NOK 8.1 8.1 0 %
BRL/NOK 2.5 2.5 0 %
Total 5.0
0.0
0.0
1.8
3.2
0.0
0.0
2.1
1.0
1.1
Impact onUEBIT (BNOK)
Impact on UEPS (NOK/share)
Annual effect
58
Change in UEBIT
(BNOK) - 10% 0 + 10%
+10% (0.4) 3.5 7.3
0 (3.5) 0 3.5
-10% (6.6) (3.5) (0.3)

Improvement efforts lift UEBITDA potentialScenarios are not forecasts, but represent earnings potential based on sensitivities
Last 4 quarters underlying EBITDA as basis. USD/NOK 8.0, BRL/NOK 2.5, realized premium above LME 260 USD/mt, PAX 350 USD/mt assumed for all scenarios. Other assumptions unchanged.Improvements used for scenarios exclude Extruded Solutions* Future improvement efforts in real 2015 terms, before depreciation.
Additional factors influencing earnings (not included in the scenarios):Production volumes, alumina sales pricing on PAX, energy prices, downstream margin developments, raw material cost development, premiums, inflation, currency, depreciation, other
Indicative UEBITDA-range in 3 scenariosNOK billion
Incl. 1.3 BNOK* in remaining improvement ambitions 2018 - 2019
59
0
5
10
15
20
25
30
35
LME 1 800USDNOK 8.0
LME 2 100USDNOK 8.0
LME 2 400USDNOK 8.0
As is, incl. 2017 improvement achievements

Improvement efforts and capital discipline contribute to FCF growth…Scenarios are not forecasts, but represent earnings potential based on sensitivities
Last 4 quarters underlying EBITDA as basis. USD/NOK 8.0, BRL/NOK 2.5, realized premium above LME 260 USD/mt, PAX 350 USD/mt assumed for all scenarios. Long-term capex 5.5 - 6 BNOK per yearOther assumptions unchanged. Improvements used for scenarios exclude Extruded Solutions * Future improvement efforts in real 2015 terms, before depreciation.
Indicative Free cash flow (FCF) range in 3 scenariosNOK billion
Additional factors influencing earnings (not included in the scenarios):Production volumes, alumina sales pricing on PAX, energy prices, downstream margin developments, raw material cost development, premiums, inflation, currency, taxes, investments, interest expense, depreciation, other
Incl. 1.3 BNOK* in remaining improvement ambitions 2018 - 2019
60
0
5
10
15
LME 1 800USDNOK 8.0
LME 2 100USDNOK 8.0
LME 2 400USDNOK 8.0
As is, incl. 2017 improvement achievements

…and lift potential for competitive returnsScenarios are not forecasts, but represent earnings potential based on sensitivities
Last 4 quarters underlying EBITDA as basis. USD/NOK 8.0, BRL/NOK 2.5, realized premium above LME 260 USD/mt, PAX 350 USD/mt assumed for all scenarios. Other assumptions unchanged.Improvements used for scenarios exclude Extruded Solutions* Future improvement efforts in real 2015 terms, before depreciation.
Indicative RoaCE range in 3 scenarios
Additional factors influencing earnings (not included in the scenarios):Production volumes, alumina sales pricing on PAX, energy prices, downstream margin developments, raw material cost development, premiums, inflation, currency, taxes,interest expense, other
61
-3%
0%
3%
6%
9%
12%
15%
18%
LME 1 800USDNOK 8.0
LME 2 100USDNOK 8.0
LME 2 400USDNOK 8.0
Incl. 1.3 BNOK* in remaining improvement ambitions 2018 - 2019
As is, incl. 2017 improvement achievements

Financial targets and aspiration
62

Long-term shareholder value
• Reinvest inprofitable growth
or• Return to
shareholders
Allocation based on best risk-adjusted returnsDeliver competitive
cash returns to shareholders
Predictabledividend
Driving long-term shareholder valueBalancing capital allocation and financial strength
M&ADistribution
to share-holders
Organic growth
Sustaining capex to ensure operational excellence
Investments to keep market share, reduce costs, strengthen margins
Capital expenditures
Solid balance sheet and liquidity
Maintain financial flexibilityEnable access to capital markets
Navigate through the cyclesManage business risks
Act on opportunities
63

Timeframe CMD 2017 status
Hydro’s aspiration underpinned by firm financial targetsMedium and long-term
1) Payout ratio 5 year average – dividend per share divided by earnings per share from continuing operations for the last 5 years2) FFO – funds from operations3) Estimate incl Sapa4) Measured against a relevant peer group5) Underlying return on average capital employed after tax (RoACE)
Better improvement ambition 2016-2019 1.7 BNOK2017E
Long-term sustaining capex Over the cycle 5.6 BNOK2017E
Dividend payout ratio
Ambition
3.0 BNOK
~ 5.5 - 6.0 BNOK
40% of net income Over the cycle ~133% 1)
2012-2016
FFO/adjusted net debt 2) > 40% Over the cycle 65%LTM Q3-17 3)
Adjusted net debt/Equity < 55% Over the cycle 28%Q3-17 3)
RoACE Competitive 4) Over the cycle 7.4% 3,5)
LTM Q3-17

(65)
Maximizing long-term value creation potential
• Continuous cost and marginimprovements
• Financial strength and flexibility• Disciplined capital allocation• Reliable shareholder remuneration
policy• Working capital management• Effective risk management

Kathrine Fog, SVP Corporate Strategy & Analyses
Market Outlook

Macro and downstream
67

Improving macro environment evident in aluminium demand
68
Semis demand at or above GDP in key regions
Source: Thomson Reuters, Republished under license from CRU International Ltd
Semis demand annual growth, key regions(%)
0%
2%
4%
6%
8%
10%
China North America Western Europe World ex. China
2016 2017
40
45
50
55
60
65S
ep-1
1
Apr-1
2
Nov
-12
Jun-
13
Jan-
14
Aug
-14
Mar
-15
Oct
-15
May
-16
Dec
-16
Jul-1
7USA ISM Eurozone China NBS China Caixin
Increasing production
Contractingproduction
Manufacturing PMI’s

Substitution trend in automotive progressing
69
US semis demand in automotive remains positive although car sales have overall moderated in 2017
Source: Thomson Reuters, Republished under license from CRU International Ltd
Semis demand in transport, annual growth(%)
0%
2%
4%
6%
8%
10%
US Western Europe
2016 2017 E 2018 E
50
60
70
80
90
100
110
120
130
Jan-08 Jan-09 Jan-10 Jan-11 Jan-12 Jan-13 Jan-14 Jan-15 Jan-16 Jan-17
US light vehicle sales Eurozone car registration
US and European automotive indicators(Index, Jan. 2008=100)

Automotive demand for aluminium supporting several semis productsCar makers utilizing aluminium to reduce weight and increase fuel-efficiency
70
Source: Hydro analysis, Republished under license from CRU International Ltd*Other includes e.g wire
0
5
10
15
20
25
30
2010 2011 2012 2013 2014 2015 2016 2017 2018 2019 2020
Castings Extrusions Other* Rolled products
7 %
7 %
4 %
Global semis demand for transport sector by product form(Mill t)
CAGR 2016-20
Level ofsubstitution
High-growth automotive segment with substantial further potential due to aluminium’s superior inherent properties

New segments and applications supporting aluminium demand
71
Marine / Offshore applications Zero-emission electrical car ferries in 100% aluminium for light-weighting
Industrial applications, ex. furnitures
B&C, ex. Supertall buildings
Middle and high voltage cables, wireand cables for electrical applications
Transportation, truck & trailer applications
Automotive, stong drive towards EV Aluminium in solar panels

Rolled products demand driven by transport segment
72
Transport share increasing in total rolled products demand
General rolled products demand, selected regions • Continued substitution trend in transport main
demand driver• Growth in packaging driven by can stock and
foil in emerging markets
0%
2%
4%
6%
2014 2015 2016 2017 E 2018 E
North America Europe*
Source: Hydro Analysis, Republished under license from CRU International Ltd*Total EU27+EFTA
YoY-growth
Expected market development
50%
17%
14%
8%
5%4% 2%
PackagingTransportConstructionMachinery & EquipmentConsumer durablesElectricalOther
Global segment composition, rolled products(2017)

Extrusion market supported by continued momentum in B&C market and improving demand in transport
73
Source: Thomson Reuters, Hydro Analysis, Republished under license from CRU International Ltd
62%14%
12%
5%4%
3%
Construction TransportMachinery & equipment ElectricalConsumer durables Other
Global segment composition, extrusion(2017)
Housing market indicatorsIndex, Jan 2010=100
80
100
120
140
160
180
200
220
240
Jan-
10Ju
l-10
Jan-
11Ju
l-11
Jan-
12Ju
l-12
Jan-
13Ju
l-13
Jan-
14Ju
l-14
Jan-
15Ju
l-15
Jan-
16Ju
l-16
Jan-
17Ju
l-17
US Building permitsUS Housing startsEU construction order book
US truck and trailer marketMonthly shipments, annual growth
-50%
-30%
-10%
10%
30%
50%
70%
90%
Jan-
10Ju
l-10
Jan-
11Ju
l-11
Jan-
12Ju
l-12
Jan-
13Ju
l-13
Jan-
14Ju
l-14
Jan-
15Ju
l-15
Jan-
16Ju
l-16
Jan-
17Ju
l-17
Light trucks Heavy duty trucks

Solid extrusion demand growth in several key regions
74
Gradual improvement expected in Europe, Chinese demand growth estimated to moderate
Source: Hydro Analysis, Republished under license from CRU International Ltd
• US housing market still sustaining positive momentum
• Construction activity in Europe continues to improve from low levels
• South America returning to positive demand growth
• Softer construction growth impactingChinese demand
Expected market development
0%
5%
10%
2016 2017E 2018E
Asia ex. China
Extrusion demand, selected regionsYoY-growth
0%
5%
10%
2016 2017E 2018E
Western Europe
-15%
-10%
-5%
0%
5%
10%
2016 2017E 2018E
South America
0%
5%
10%
2016 2017E 2018E
China
0%
5%
10%
2016 2017E 2018E
North America

0%
2%
4%
6%
8%
10%
12%
0
50
100
150
200
250
300
350
Jan-10 Jan-11 Jan-12 Jan-13 Jan-14 Jan-15 Jan-16 Jan-17
Foil Sheet & strip Extrusions* Net semis exports as share of semis production (RHS)
Largely stable Chinese semis exports last yearLimited extrusion exports to Europe and North America, extrusion stocks transferred from Mexico to Vietnam
Source: CRU, Antaike, Hydro Analysis*Mainly extrusions, but also including some smaller semis categories such as wire**US extrusion duties imposed in 2010, impacting volumes from 2011
Monthly Chinese net semis exports (12-month moving average)Thousand tonnes
0
200
400
600
800
1000
1200
1400
2007 2008 2009 2010 2011 2012 2013 2014 2015 2016
Asia North America Europe Oceania Latin America Middle East Africa
Annual Chinese extrusion exports, by regionThousand tonnes
**
75

Source: Hydro Analysis, Antaike
Trade flows partly impacted by trade measures
76
Chinese semis exports by destination – Asia key region
(2016)
AsiaAfricaNorth AmericaEuropeMiddle EastLatin AmericaOceania
US• Import duties
on semis• Dumping cases• Signals on
more protection
Europe• Import duties
on semis• Dumping cases
44%
9%
15%
11%
10%
8%3%
Asia• Some import
duties• India introducing
duties

Primary metal market
77

Recap CMD 2016: Global primary market expected to be largely balanced also in 2017
78
Source: CRU, Hydro Analysis
30 000
35 000
40 000
45 000
50 000
55 000
60 000
65 000
2006 2007 2008 2009 2010 2011 2012 2013 2014 2015 2016E 2017E
Supply Demand
Global (’000 mt)
Supply influences 2017
Chinese restarts
Chinese curtailments
Key regions in China adding capacity
Indian projects
Demand influences 2017
Momentum in Chinese construction and transport sector
Continued strong transport segment
Steady development US and Eurozone
Global growth expectations 2017
Demand: 3-5 %Supply: 4-6 %

Global primary market for 2017 in small deficit
79
Both supply and demand higher than expected
Source: CRU, Hydro Analysis
30 000
35 000
40 000
45 000
50 000
55 000
60 000
65 000
2006 2007 2008 2009 2010 2011 2012 2013 2014 2015 2016E 2017E
Supply Demand
Global (’000 mt)
Supply influences 2017
Chinese restarts
Chinese curtailments
Key regions in China adding capacity
Indian projects
Demand influences 2017
Momentum in Chinese construction and transport sector
Continued strong transport segment
Steady development US and Eurozone
Global growth 2017Demand: ~6.0 %Supply: ~7.0 %
Happened to a limited extent Happened to a large extent

Global primary market expected to be largely balanced in 2018
80
Primary supply and demand growth expected to be largely similar
Source: CRU, Hydro Analysis
30 000
35 000
40 000
45 000
50 000
55 000
60 000
65 000
70 000
2006 2007 2008 2009 2010 2011 2012 2013 2014 2015 2016E 2017E 2018E
Supply Demand
Global (’000 mt)
Supply influences 2018Winter shutdowns
SOE projects in China
Limited growth for privatecompanies in China
US restarts
Indian projects
Demand influences 2018
Gradual slowdown in Chinese construction and transport sector
Continued strong transport segment
European and US growth continues
Global growth expectations 2018
Supply and demand: 4-5 %

Supply-side reform and environmental shutdowns moderating Chinese primary supply growth
81
Xinfa
Weiqiao
500
1 300
1 800
2+26 affected area for environmental shutdowns
Xinjiang Jiarun 200
1 000
East Hope 800
300
Inner Mongolia Jinlian
• Several industries, including steel, cement, coal and aluminium have been ordered to halt production during the winter heating from November 15th and March 15th
• The winter season shutdowns are also impacting carbon anode and alumina production• The primary shutdowns in Shandong are related to Xinfa, as Weiqiao is not estimated
to further cut its aluminium production during the winter season due to largely overlap with supply-side reform
• Due to lack of approvals several operational smelters have been forced to shut down production
• Private companies such as Weiqiao, East Hope and Xinfahave been most affected to date
• Planned and potential projects have also been affected by the policy, subduing production growth going forward
Supply side reformEnvironmental shutdowns
Supply-side reform Environmental shutdowns
Annual production effect (‘000t)
Shandong Regions impacted by winter
shutdowns
Henan
Shanxi
Shandong
Source: CRU, Hydro Analysis
~500

Key drivers for China’s aluminium expansion losing momentum
82
PastDrivers for aluminium capacity
Demand growth
Lack of environmental restrictions
Energy availability
Access to financing
Raw material access
• Continued strong growth short-term, but expected to slow longer term• Export market impacted by trade restrictions
• From softer to harder constraints: strong enforcement of environmentalshutdowns during winter shutdown
• Competitive advantage of coal-rich regions moderating, combined withrising coal prices
• Environmental issues will further challenge coal-based production
• Tighter financial liquidity perceived as constraint for potential capacitynew-builds and restarts
• Supply-side reform limiting new projects, especially by private players
• Depleting domestic bauxite reserves, more dependent on imports• Carbon producers also impacted by environmental shutdowns
Present
Supportive of capacityexpansions
Moderating capacityexpansions

Chinese energy market reforms impacting aluminium smelter cost
-
100
200
300
400
500
600
700
800
Jan-
15
Mar
-15
May
-15
Jul-1
5
Sep
-15
Nov
-15
Jan-
16
Mar
-16
May
-16
Jul-1
6
Sep
-16
Nov
-16
Jan-
17
Mar
-17
May
-17
Jul-1
7
Sep
-17
Datong 5,500 NAR Qinhuangdao FOB price
Bohai-Rim steam-coal price index, 5,500 NAR
Source: IHS
Implement power pricing mechanisms
reflecting market fundamentals
Remove cross-subsidization
and regulate T&D tariffs at cost-plus levels
Promote direct power purchase and
power trading
Standardize andstrengthen supervisionof captive power plants
Chinese Power Market Reform:Key objectives
Chinese Steam Coal Price BandRMB/t
Reforms expected to even out power prices across the specter of Chinese aluminium producers
83

500
750
1 000
1 250
1 500
1 750
2 000
2 250
2 500
0 10 000 20 000 30 000 40 000 50 000 60 000
2016 Spot curve, Nov. 2017
Higher and steeper cost curve in 2017 compared to 2016
84
Higher end of the cost curve dominated by Chinese smelters
Source: Hydro analysis, IHS, Platts, Republished under license from CRU International Ltd
Cost pressure in 2017Higher coal prices
Higher alumina pricesHigher carbon costs
Business operating cost (BOC)USD/t
Index: Jan 2016 = 100
0
50
100
150
200
250
Q1-16 Q2-16 Q3-16 Q4-16 Q1-17 Q2-17 Q3-17 Q4-17
Chinese steam coal Alumina PAX Pet coke FOB US Gulf

Primary aluminium market to be largely balanced in 2018
85
Market balances largely similar compared to 2017
Source: CRU, Hydro analysis
~28.0 – 28.3
~30.1 – 30.4 ProductionDemand
~37.5 – 38.3
~35.7 – 36.4
ProductionDemand
3-4 %
3-4 %
4-6 %
4-6 %-3 000
-2 000
-1 000
0
1 000
2 000
China World ex. China Global
World ex. China 2018
China 2018
Primary market balance 2018(‘000t)
% Growth from 2017 to 2018
(mill t.)
(mill t.)

Stocks outside China continue to decrease, while Chinese stocks have moved higher
86
Chinese exports not fully filling up deficits outside China
Source: CRU, Hydro analysis
0
20
40
60
80
100
120
140
160
180
0
2000
4000
6000
8000
10000
12000
2005 2006 2007 2008 2009 2010 2011 2012 2013 2014 2015 2016 2017E
Reported Unreported Total inventory days
China
0
20
40
60
80
100
120
140
160
180
0
2000
4000
6000
8000
10000
12000
2005 2006 2007 2008 2009 2010 2011 2012 2013 2014 2015 2016 2017E
Reported Unreported Total inventory days
World ex. China(‘000t) (‘000t)
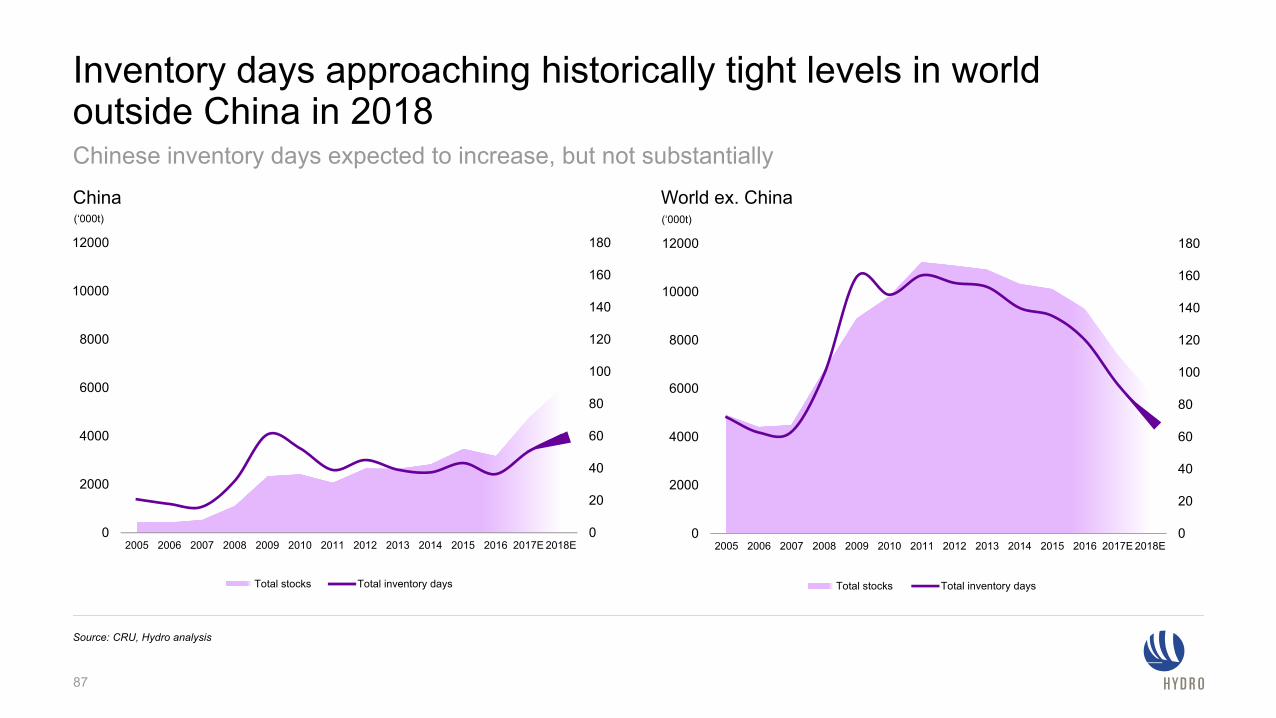
Inventory days approaching historically tight levels in world outside China in 2018
87
Chinese inventory days expected to increase, but not substantially
Source: CRU, Hydro analysis
0
20
40
60
80
100
120
140
160
180
0
2000
4000
6000
8000
10000
12000
2005 2006 2007 2008 2009 2010 2011 2012 2013 2014 2015 2016 2017E 2018E
Total stocks Total inventory days
0
20
40
60
80
100
120
140
160
180
0
2000
4000
6000
8000
10000
12000
2005 2006 2007 2008 2009 2010 2011 2012 2013 2014 2015 2016 2017E 2018E
Total stocks Total inventory days
China World ex. China(‘000t) (‘000t)

All-in price level supported by higher LME and premiums in 2017, prices in NOK supported by continued weak NOK vs USD
88
Source: Metal Bulletin, MW/MJP: Platts, Reuters Ecowin, Hydro analysis
0
100
200
300
400
500
600
700
800
900
Jan-
08
Jul-0
8
Jan-
09
Jul-0
9
Jan-
10
Jul-1
0
Jan-
11
Jul-1
1
Jan-
12
Jul-1
2
Jan-
13
Jul-1
3
Jan-
14
Jul-1
4
Jan-
15
Jul-1
5
Jan-
16
Jul-1
6
Jan-
17
Jul-1
7
Extrusion ingot over standard ingot Standard ingot duty paidExtrusion ingot duty paid
USD/mt
10 000
12 000
14 000
16 000
18 000
20 000
1 400
1 800
2 200
2 600
3 000
Jan 11 Oct 11 Jul 12 Apr 13 Jan 14 Oct 14 Jul 15 Apr 16 Jan 17 Oct 17
LME cash LME cash + Europe duty paidLME cash + US Midwest LME Cash + Europe dutypaid NOK (RHS)
USD/mt NOK/mt

Bauxite and alumina market
89

Chinese primary production dependent on imported resources
90
Around 37% based on imported raw material (average 2013-2017)
Source: CRU, China customs, 2017 forecast Hydro analysis
0
10
20
30
40
50
60
70
80
90
100
Primary production Alumina Bauxite
100 % 93.7 %
6.3 %
63.3 %
30.4 %
% of Primary Production
Imported
Imported
Domestic
Domestic
2017f40%

Bauxite production in China to decline, triggering more imports
• Depleting resources not sufficient to sustain operations in key provinces:− inland refineries may convert to imported
bauxite or relocate to southern provinces
− new refinery capacity in coastal region, dependent on imported bauxite
− refinery capacity outside of China
• Bauxite (equivalent) imports could increase from ~70 Mtpy in 2017 to ~150 Mtpy in 2025
Chinese bauxite imports set to increase
91
Source: CM Group (ept 2017, $50/t cif bauxite scenario) * alumina imports as bauxite equivalent
Chinese bauxite production and importsMtpy
0
50
100
150
200
250
2006 2007 2008 2009 2010 2011 2012 2013 2014 2015 2016 2017 2018 2019 2020 2021 2022 2023 2024 2025
hist domestic production forecast domestic prod alumina import * imports

Guinea’s bauxite production is rising
• Committed capacity increasing to ~70 Mtpy by 2020
• Substantial bauxite resources available− 20+ billion mt within 150 km of coast
− Low reactive silica
• Chinese SOE bauxite and alumina projects more likely following USD20bn loan to Guinea
• Social instability could hamper investments − Higher HSE and community standards required
0
10
20
30
40
50
60
70
80
2015 2016 2017e 2018e 2019e 2020e
Guinea bauxite production (million mt)
CBG Kindia Dian-Dian SMB/WAP EGA (GAC) Alufer
92
Projects to add 25-30 Mtpa of bauxite export capacity, resource base could support additional volumes
Source: CRU, Hydro analysis

Altantic
Pacific
2013 2017
Chinese bauxite imports increasingly exposed to freight
93
Freight represents ~20 to 60% of the CIF price, freight rates increasing from low levels
Source: China customs, Bloomberg, Hydro analysisNote: 2017 is Jan-Sep annualized
0
1000
2000
3000
Feb-
13
Jun-
13
Oct
-13
Feb-
14
Jun-
14
Oct
-14
Feb-
15
Jun-
15
Oct
-15
Feb-
16
Jun-
16
Oct
-16
Feb-
17
Jun-
17
Oct
-17
Origin of Chinese bauxite imports
Baltic Dry Index
20
30
40
50
60
70
80
90
Jul-09 Jul-10 Jul-11 Jul-12 Jul-13 Jul-14 Jul-15 Jul-16 Jul-17
Indonesia Australia India Brazil Guinea Malaysia
CIF China, USD/t

100
150
200
250
300
350
400
0 20 000 40 000 60 000 80 000 100 000 120 000 140 000
2016 Spot curve, Nov. 2017
Higher alumina cost curve in 2017 compared to 2016
94
Higher end of the cost curve dominated by Chinese refineries
Source: Bloomberg, IHS, CM, CRU
USD/tShandong
average$302
Index: Jan 2016 = 100
0
50
100
150
200
250
300
Jan-16 Apr-16 Jul-16 Oct-16 Jan-17 Apr-17 Jul-17 Oct-17
Fuel Oil, US Gulf Caustic ChinaCaustic US Gulf Bauxite Henan
Cost pressure in 2017Higher caustic prices
Higher Chinese bauxite pricesHigher freight costs

Chinese winter shutdowns affecting alumina supply Overall alumina impact likely to exceed smelter winter shutdowns
0
500
1000
1500
2000
2500
Shanxi HenanShandong - other Shandong - Weiqiao
Source: CM, CRU
(’000kt)
Alumina production lost to winter cuts(annualized production effect)
Current Extended Scope of 2+26City Policy
Beijing, Tianjin
Rest of 2+26
2+26+3
Henan Blanket cut
Shanxi Lvliang
Shanxi Jinzhong
2+26 affected area for environmental shutdowns
Inner Mongolia
LiaoningHebei
Shanxi
Henan
Shandong
Guizhou
Guangxi
Chalco`s Hebei refinery project relocated to Guangxi coast due to environmental policy
95

Alumina market balancing, Chinese additions also outside China
96
Limited capacity increases outside China
Source: Hydro analysis
Curtailed 2015 - 16
Capacity additions ex. China
Bubble size represents capacity 1 Mt
Point Comfort (2.3)
Paranam (2.25)
Chinese additions
Chinese refineries outside China
Atlantic curtailments• Atlantic market rebalancing
through curtailments• Corpus Christi and Paranam
restarts unlikely
Capacity additions ex. China• Middle East and India adding
capacity to supply own value chain
• Friguia restart in Guinea
Ras Al Khair (1.8)Al Taweelah (2.0)
Chinese additons• Chinese companies increasing
alumina production in Jamaica and Indonesa
• Domestic capacity additions, of which half located coastal
Alpart (1.65)Nhan Co (0.65)
Kendawangan (1.0)
Chinese additions2018: ~4.0 Mt
Friguia (0.65)India (1.0)Corpus Christi (1.63)
Being dismantled

Alumina prices rise amid policy implementation uncertainty
97
Market tightness, high metal prices, and increasing costs support prices
Source: Platts, Bloomberg
Market balances• New smelter projects ramping up in China• Re-stocking ahead of winter• Tighter market balance in China, less volumes
available outside China
Cost inflation• Higher caustic soda costs• Higher transport costs in China (road & rail)• Higher Chinese domestic bauxite prices
Other factors• Environmental inspections, shut down of
unsafe and small bauxite mines• Uncertainty regarding upcoming winter
heating season cuts
Recent alumina price drivers Platts alumina index (PAX, to 22 Nov 2017))PercentUSD/t
12%
14%
16%
18%
20%
22%
24%
150
200
250
300
350
400
450
500
550
Aug
201
0
Jan
2011
Jun
2011
Nov
201
1
Apr
201
2
Aug
201
2
Jan
2013
June
201
3
Nov
201
3
Apr
201
4
Aug
201
4
Jan
2015
June
201
5
Nov
201
5
Mar
201
6
Aug
201
6
Jan
2017
June
201
7
Nov
201
7
PAX % of LME 3M

Long-term outlook and summary
98
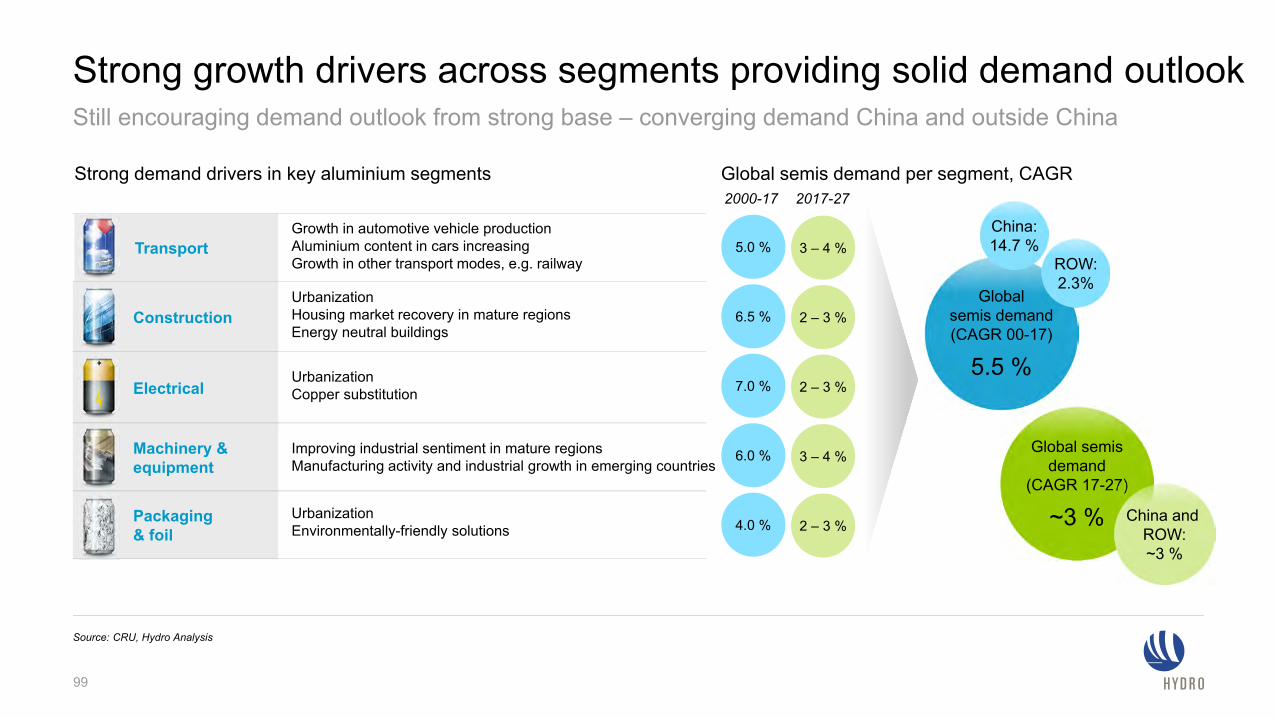
Strong demand drivers in key aluminium segments
Strong growth drivers across segments providing solid demand outlook
99
Source: CRU, Hydro Analysis
UrbanizationCopper substitution
UrbanizationHousing market recovery in mature regionsEnergy neutral buildings
Improving industrial sentiment in mature regionsManufacturing activity and industrial growth in emerging countries
UrbanizationEnvironmentally-friendly solutions
Transport
Construction
Electrical
Machinery & equipment
Packaging& foil
Growth in automotive vehicle productionAluminium content in cars increasingGrowth in other transport modes, e.g. railway
3 – 4 %
2 – 3 %
2 – 3 %
3 – 4 %
2 – 3 %
2000-17Global semis demand per segment, CAGR
5.0 %
6.5 %
7.0 %
6.0 %
4.0 %
2017-27
Global semis demand(CAGR 00-17)
5.5 %
Global semis demand
(CAGR 17-27)
~3 %
China:14.7 %
ROW:2.3%
China and ROW:~3 %
Still encouraging demand outlook from strong base – converging demand China and outside China

Growth in global semis demand creates opportunities for both primary and recycled material
100
Solid growth for semis, primary and recycling
Source: CRU, Hydro Analysis* Post-consumer and fabrication scrap** Unallocated creep estimated at same level as unallocated disruptions
CAGR 2017 – 2027
Semis
~3 %Primary
2-3 %Recycling*
3-4 %

• Solid long-term demand outlook supported bystrong growth drivers across segments
• Chinese primary supply moderating due to policy reform
• Global primary market largely balanced this year and next
• Cost curve pressured upwards by rising alumina and coal prices, with regional differences
• Recycling growth accelerating with increased generation of post-consumer scrap
• Chinese bauxite import dependency continues to increase
• Alumina market impacted by cost push and tightermarket balances
101

Egil Hogna, EVP Extruded Solutions
From extrusions to solutions

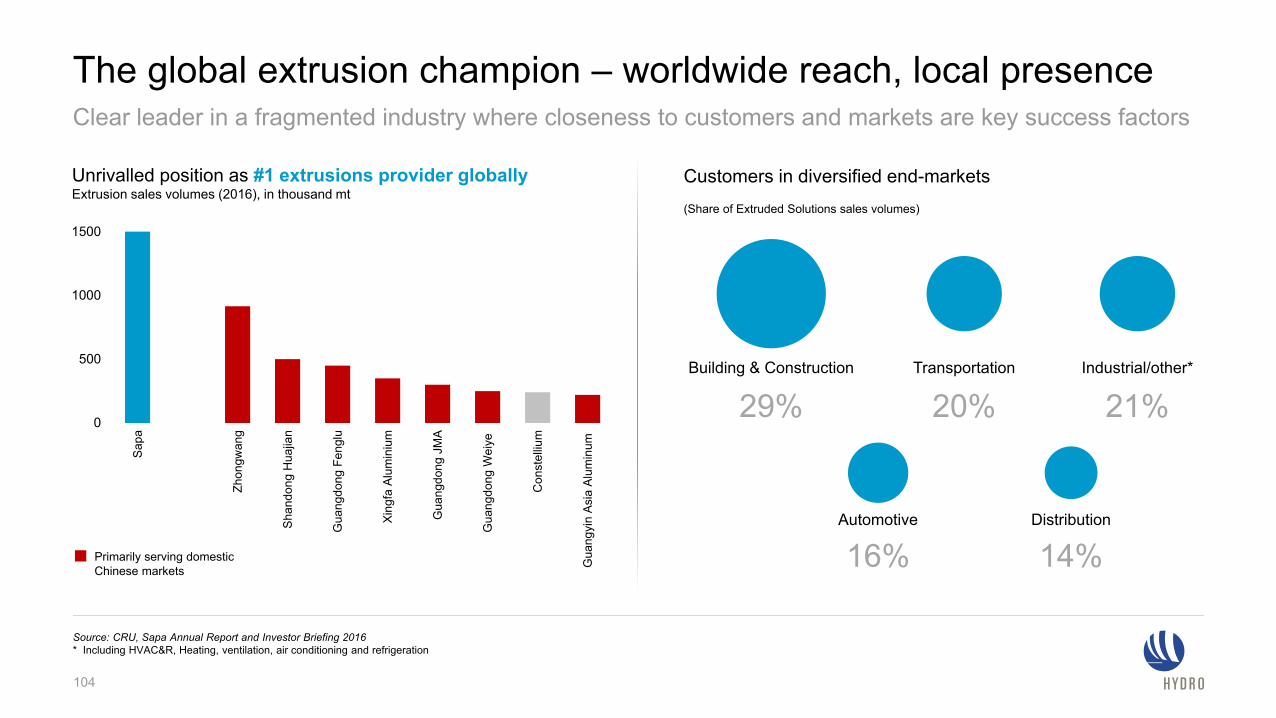
Extruded Solutions – #1 in the global aluminium extrusion industry
103
* As of end-2016** Rolling 12 months Q3 2017
22,400 people*
BNOK 56 in turnover**
Present in ~ 40 countries
>50% of production using remelted aluminium
0
500
1000
1500
Sap
a
Zhon
gwan
g
Sha
ndon
g H
uajia
n
Gua
ngdo
ng F
engl
u
Xin
gfa
Alu
min
ium
Gua
ngdo
ng J
MA
Gua
ngdo
ng W
eiye
Con
stel
lium
Gua
ngyi
n A
sia
Alu
min
um
The global extrusion champion – worldwide reach, local presenceClear leader in a fragmented industry where closeness to customers and markets are key success factors
Customers in diversified end-markets(Share of Extruded Solutions sales volumes)
104
Building & Construction Transportation
Distribution
Industrial/other*
Automotive
29% 20%
14%
21%
16%Primarily serving domesticChinese markets
Unrivalled position as #1 extrusions provider globallyExtrusion sales volumes (2016), in thousand mt
Source: CRU, Sapa Annual Report and Investor Briefing 2016* Including HVAC&R, Heating, ventilation, air conditioning and refrigeration

Unique market positions, built on European and US strongholds22,400 highly competent people across the world
Extrusion Europe Extrusion North America Precision Tubing Building Systems
• Market leader focusing on value-added products
• 22% market share
• 40 locations, 9,400 people
• Uniquely positioned as the only coast-to-coast supplier
• 24% market share
• 23 locations, 6,300 people
• Technology leader in selected market niches
• 35% market share globally
• 17 locations, 3,100 people
• Leading European player with multi-brand portfolio
• 18% market share in Europe
• Presence in 29 countries, 2,800 people
EBITDA BNOK 1.3
Revenue BNOK 21.6
105
EBITDA BNOK 1.5
Revenue BNOK 21.3
EBITDA BNOK 0.7
Revenue BNOK 6.5
EBITDA BNOK 0.6
Revenue BNOK 7.4
All revenue and EBITDA figures are last twelve months as per Q3 2017

100
125
136 138
10097 98 97
2014 2015 2016 Q3 2017
NAV
0
2
4
6
8
10
12
14
0
500
1000
1500
2000
2500
3000
3500
4000
Q114
Q314
Q115
Q315
Q116
Q316
Q117
Q317
After-tax ROACE (100%)
* Net Added Value: calculated as operating revenues less cost of material, including freight costs out
Last 12 months underlying EBITDA
106
EBITDA in MNOK ROACE in %
EBITDA (LHS) ROACE historically (RHS)
Estimate ROACE Extruded Solutions after acquisition (RHS)
Successful value-over-volume strategy
Proven track-record of value creation with further potential
Net added value* per kg (NOK, indexed to 2014)
Sales volume in mt

Strategic principles in Extruded Solutions
• Make a decent profit decently – safety, quality and compliance
• Positive dissatisfaction – be happy, but not satisfied
• Fail fast – and learn from it
• Value over volume – and the power of available capacity
• Develop unique niches – with Extruded Solutions offering
• “Self-playing piano” – benchmarking across all units
• Earn your right to grow = safety, quality and compliance + ROACE above cost of capital
• Profitable growth – through innovation and consolidation
107
Units managed primarily by
bottom line and ROACE

Our competitive advantages are strengthened as part of Hydro
Unmatched technology competence
Value chain width and depth
Global reach and local presence
1
2
3
108

Increase value-added to our customers
109
Simplify and collaborate
Grow to lift margins and profitability
Our strategy is about “value over volume” with simplification and collaboration to avoid waste of resources
1 2 3

Moving from simple extrusions to more advanced solutions
110
Surface treatment for long life and low maintenance costs
Extrusions are often cut and joinedMore than half of our billets are remelted from scrap in our own cast houses
Fabrication and assembly to customer specific products or modules

Targeting the high-tech, high-competence segments of extrusion
Tailored solutions Finished products Service
111
Increased focus on value-add, specialized and advanced product niches

Increasing our capabilities also through sustaining investments
• Sustaining capex BNOK 1.3-1.5
• Includes productivity and reliability improvements, safety investments and replacement projects
• Replacing parts that are worn-out increases reliability and drives stability and quality in the processes
• New presses, paint lines and more are part of the sustaining investments
112
The new press in Hungary is being installed

Profitable growth and sustainability combined
• Bedwas will supply the automotive industry, focusing on electrical vehicles
• A key customer is the London Electrical Vehicle Company, with its new zero-emissions capable black cab
• Investment of £9.6 million in plant refurbishment and new equipment
• Investment backed by £0.55 million from the Welsh government
113
Re-opening the Bedwas factory in Wales

Shaping the furniture of future with IKEA
• From extrusions to solutions
• IKEA purchasing:Got a problem? Ask Hydro – they will solve it
• Innovation support from the beginning− Strong product development− Fast and flexible in-house prototyping− Superior surface finish− One-stop shop
114

Shaping the furniture of future with IKEA
115
The soon-to-be launched Delaktig sofa
• Complete base frame in extruded aluminium
• Knocked down in a cardboard box
• Assembled by the customers
• Sales start Feb 2018
• 100% of the aluminium (frame, legs, feet) is recyclable

Priorities as Extruded Solutions
• Further improve within safety, quality and compliance
• Increase share of value-added solutions to customersthrough commercial excellence and innovation
• Continue simplification drive to reduce complexity andnon-value adding activities
• Lift margins and create more customer value throughselective growth
116

Strategic direction Better, Bigger, Greener

Better, Bigger, Greener
118
Raise performance andimprove customer offering
Expand the use of aluminium and strengthen Hydro’s platform for growth
Lead the transition towards sustainable solutions
Better Bigger Greener
Hydro’s aspiration for higher value creation

Ambitious mid-term strategic goals within the Hydro aspiration*
*) All targets and progress are Hydro excluding Extruded Solutions 1) Based on 2017 estimate unless stated otherwise2) YTD Oct-2017, own employees3) 1.65 Twh power sourcing since CMD 20164) YTD Q3 2017 annualized5) Based on sourcing volume of ~ 2.3 million tonnes per annum
6) Based on sourcing volume of ~ 2.3 million tonnes for 20177) Provided the acquisition of a 40% stake in MRN from Vale8) 1:1 rehabilitation of areas available for rehabilitation within twohydrological seasons after release. Revised definition of target takes intoaccount the nature of the mining cycle, and the time lag is necessary toensure quality rehabilitation to restore biodiversity
Ambition on track and on target
Ambition behind plan, but on target
Ambition will not meet the target
Ambitions TimeframeTarget
• Improve safety performance, strive for injury free environment
• Realize ongoing improvement efforts Better
• Secure new competitive sourcing contracts in Norway post 2020
• Lift bauxite production at Paragominas
• Lift alumina production at Alunorte
• Shift alumina sales to PAX-based pricing
• Extend technology lead with Karmøy technology pilot
TRI<2
BNOK 3.04-6 TWh
11 mill mt/yr
7.0 mill t/yr
85% PAX5
Start production
2020
2019
2020
2018
2021
2020
2H 2017
• Realize technology-driven smelter capacity creep
• Lift equity bauxite production
• Increase nominal automotive Body-in-White capacity
• Complete ramp-up of UBC recycling line
200,000 mt/yr
19 mill t/yr7
200,000 mt/yr
>40 000 mt/yr
2025
Long-term
2017
2017
• Become carbon-neutral from a life-cycle perspective
• Increase recycling of post-consumed scrap
• 1:1 rehabilitation target
Zero
>250,000 mt/yr
1:1
2020
2020
2020
Progress¹ Status
2.82
1.7 BNOK
2.65 TWh3
11.2 mill mt/yr4
6.3 mill mt/yr4
~65% PAX6
First metal Q4 2017
On track
146,000 mt/yr
On track8
34,000 mt
NA
Delayed ramp-up
Delayed output-speed
Silvio Porto, EVP Bauxite & Alumina
Bauxite & AluminaBetter than ever through operational excellence

8 000
9 000
10 000
11 000
12 000
2014 2015 2016 LTM Q3 2017
Paragominas: New production record achieved
LTM* Q3 2017 production up 3% from strong 2016
• 11.4 million mt production LTM Q3 2017
• Successfully implemented Bauxite & Alumina Business System
• Improved equipment condition, operating standards and process control
New mining plateau in operation since mid-2017 Zero rehabilitation gap by 2020
• Reforestation progressing according to plan
• Research partnerships creates basis for state-of-the-art approach to mining rehabilitation
• Closing rehabilitation gap by 2020
• BRL 600 million investment - on time and budget
• Improved safety of disposal areas, reduced environmental footprint and cost due to higher solid concentration of tailings
121
Bauxite production in thousand mt
* Last twelve months
Nameplate capacity

MRN – important part of Alunorte’s bauxite sourcing strategy
Strategic Importance Long-term issues Short-term issues Update
• Secures strong relative cost position with high quality bauxite
• Reduces operational risk by providing second source of supply
• Need to move to new mining area in central / western plateaus
• Mine life extension being discussed with the other partners
• Lower production at the bauxite mine
• MRN experiencing problems with its tailing systems
• Bauxite supply to Alunortesecured
• B&A working diligently with all bauxite customers to find solutions
• High attention from B&A management and all shareholders
122
* Alumina volumes, bauxite conversion factor 2.5
11.0 11.0 11.0
4.8 5.5 6.5
6.3* Mtpy 6.6* Mtpy 7.0* Mtpy
Paragominas MRNMtpy Bauxite

5 500
5 750
6 000
6 250
6 500
2014 2015 2016 LTM Q3 2017
Significantly improved production stability
• 6.3 million mt production LTM* Q3 2017
• Improved equipment effectiveness and process stability based on Bauxite & Alumina Business System
• Further debottlenecking needed for 7.0 million mt target
• High quality alumina – preferred by customers
123
• State-of-the-art dry disposal of bauxite residue using press filtration
• Reduced required storage area and environmental footprint
• Modifications in 2017/18
• Energy consumption improved in 2017
• Target improving boiler energy consumption to 7.6 GJ/mt in 2020
• Evaluating potential for usage of gas8.08.18.18.28.28.3
2014 2015 2016 2017 E
Total consumption (Gj/mt)
Alunorte 7.0: On the way to extended capacity
Bauxite residue deposit investment in startup phase Lower total energy consumption
* Last twelve months
Alumina production in thousand mt
Nameplate capacity

0%
20%
40%
60%
80%
100%
2015 2016 2017 2018 2019 2020
Internal index Intenal LME External index External LME Index exposure
Improved alumina & bauxite margins • New alumina contracts: 100% sold on index
• Continued focus on CIF terms & end-users
• External bauxite sales of ~2.5-3 million mt – pricing mostly linked to Platts alumina index
Commercial: Successful implementation of strategy
124
• Hydrate prices more stable compared to alumina – partly fixed annually
• New long-term sales contracts established in the US
• Shipments to US & Japan in 2017: 750-800,000 mt*
• Taking advantage of price arbitrage between China and rest of the world
• Warehousing capability and increased flexibility
• 2017 alumina sales to China: 5-600,000 mt
..
* In alumina equivalent tons. Total sales of hydrate: 750-800,000 tons, equivalent to 490-525,000 tons of alumina using a factor of 0.654
Hydro alumina sales exposure to index pricing increased
Strengthen our position in the hydrate market Getting closer to the Chinese market
35% 50% 65% 75% 75% 85%

Improvements in NOK million Improvement categories
0
200
400
600
800
1000
1200
2016 2017 2018 2019 ImprovementsEstimate
Original plan Updated target
Lifting 2019-target from BNOK 1.0 to BNOK 1.3
Operational costs• Optimize purchase conditions for raw
materials • Reduce fixed costs
Process improvements• Improve energy consumption and matrix• Support production above nameplate
capacity
Alumina & Hydrate margins• Reduce demurrage costs • Lift optimization margin
Processimprovements
Operational costs
Optimizemargins
125
Improvement program ahead of plan BetterBauxite &Alumina
BNOK 1.3

Hilde M. Aasheim, EVP Primary Metal
Primary Metal Better, bigger and greener with technology and digitization

Primary Metal continues ambitious improvement efforts
1) All figures based on public accounting data, not verified by Hydro. Data not adjusted for different accounting principles and non-specified underlying items. Hydro makes no representation as to the accuracy or completeness of such information. The analyses are based on assumptions subject to uncertainty and therefore intended only for general comparisons across companies and should not be used to support any individual investment decision. All results are provided for information purposes only. Hydro figures includes Primary Metal, Metal Markets and attributable share of EBITDA and production in Qatalum. 2) Companies included in the graph: Hydro, Rio Tinto Alcan, South 32 (BHP), Rusal, Chalco, Alba, AlcoaNOTE: Chalco has not published own production data for 2016 and 2017. Estimates based on information available from CRU
0
200
400
600
800
1000
1200
2016 2017E 2018E 2019E Totalprogram
Other
Fixed costreduction
Processimprovements
BNOK 0.5 to be delivered 2018-2019
Strengthened relative position
-
100
200
300
400
500
600
700
800
2011 1h2017
Underlying EBITDA per mt in USD for respective aluminium divisions1,2
In million NOK
Long history of improvement effortsBNOK 3 delivered 2010-2016
Delivered
0
50
100
150
200
250
300
350
400
2010 2011 2012 2013 2014 2015 2016
‘USD 300+ program’
JVUSD 180program
In USD per mt in real terms
Will deliver BNOK ~0.5 in period 2018-2019Better
PrimaryMetal
BNOK 1.0

Initiatives in place to lift Albras performance
2017 improvement efforts behind plan at Albras due to asset integrity issues
• Reduced amperage to relieve high rectifier load
• Higher maintenance costs due to asset integrity issues in carbon plant and with pot tending machines
• Solid cash flow contributor despite setbacks
Initiatives to lift performance
• Investment in new rectifier
• Carbon plant upgrade
• Major overhaul project of pot tending machines177.6 177.6 178.4 179.1 179.4
174.5
165
168
171
174
177
180
183
2012 2013 2014 2015 2016 YTD2017
Amperage (kA)
Lower improvement speed than planned in Primary Metal for 2017 primarily due to Albras performance
128

Known technologies and enablers
Technology spin-offs
-25
0
25
50
75
100
125
150
175
200
2014 2015 2016 2017E 2018E 2019E 2020 2021 2022 2023 2024 2025E
Fully owned Joint ventures Albras reduction
Delivered
Karmøy Technology Pilot enabling spin-offs to existing smelters
129
* Calculation based on actual EBITDA margin YTD Q3 2017
Production at fully owned and joint venture plants 2014-2025 (Ktpy)
Spin-off effects
• ~50% of 200 000 mt creep ambitions – estimated annual EBITDA effect of MNOK ~300*
• Technology implementation program established to tailor-make spin-off packages/solutions for other electrolysis lines
Volumetric increases dependent on positive business cases

Driving innovation to further strengthen our position in the market
130
* Europe only. Forward view based on current outlook for market development and production capacities
Continue to capture strong growth in automotive segments
Mt per year
Sales to automotive in Europe
0
100
200
300
400
500
600
2014 2015 2016 2017 2018 2019 2020 2021
Extrusion ingot Foundry alloys Sheet ingot

Growing in recycling
131
* RFA: Recycling friendly alloys
Investing in the leading recycling capabilities and technology
Hydro scrap sorting technology
Facility upgrades with production and environmental benefits
42%
44%
46%
48%
50%
52%
54%
56%
58%
0
50
100
150
200
250
300
350
2014 2015 2016 2017 2018 2019 2020
ACT EST RFA-%
Targeting 30% increase in RFA Sales
Sales of Recycling Friendly Alloys* from remelters to increase by ~80 000 mt from 2014 to 2020 (more than 50% of total)
RFA sales for EI remelters, in mt
131
Targeting 100% increase in post-consumer scrap usage
Usage of post-consumer scrap to increase from ~75 000 mt in 2014 to ~150 000 mt in 2020 (~23% of total)
0%
5%
10%
15%
20%
25%
0
40
80
120
160
200
2014 2015 2016 2017 2018 2019 2020
ACT EST WMR 3rd Party PC-%
Post-consumer scrap usage, in mt

Industry 4.0 enabling further improvements
132
Digitized support functions
Advanced analytics
Autonomous processes
Connected operator
Automation, robotics and AGV
Digital and predictive maintenance
Industry 4.0 stretching furtherKarmøy Technology Pilot scope
Virtual supply chain

Better, bigger and greener with technology and digitization Strengthening our competitive position further
133
Recycling
Taking advantage of increased
scrap availability
KarmøyTechnology Pilot
Enabling ambitious creep program
75 + 200 kt
Industry 4.0
Enabling further improvements
Productdifferentiation
Driving demand growth for aluminium
Better GreenerBigger

Kjetil Ebbesberg, EVP Rolled Products
Rolled Products Expanding in higher-margin and fast-growing segments

Ambition
Marketgrowth1
Portfolio high-grading, recycling and cost efficiency are key
135
Automotive with the highest growth ambitions, recycling of used beverage cans of strategic importance
1) Market growth as compound annual growth rate 2016 – 2021 in %2) UBC = Used Beverage CanSource: CRU/Hydro
AutomotiveGain No.2 position in Europe
• World ~11%• Europe ~9%• Steel substitution
• Successful ramp-up of AL3
FoilFostering No.1 position in high-end plain foil Europe
• World ~3%• Europe ~1%• Follows population
• Broaden customer base • Increase technical foil
Beverage canGrow No.2 position in Europe
• World ~4-5%• Europe ~2-3%• Steel substitution
• Successful ramp-up of UBC2 line
• Growth in Europe
LithographyDefend global No.1 position
• World ~0%• Europe ~ - 3%• Declining printing
• Focus on quality, service and innovation
Special productsStrengthen No.1positions in Europe
• Europe ~2-3%• Batteries, renewables
and other new potentials
• Grow strategic product volumes
C O S T E F F I C I E N C YA L U N O R F P E R F O R M A N C E
Focusareas

2017 result influenced by operational issues
136
AluNorf and Hamburg mainly solved, UBC and AL3 with clear measures in place
AL3 – automotive Line 3
Four main performance issues - measures being implemented
• AluNorf – production performance stabilized
• Hamburg – production performance stabilized
• Used beverage can recycling line – actions implemented to solve technical issues
• Automotive line 3 – actions implemented to ramp-up production and qualify products
RP Underlying EBIT - YTD Q3 2017 vs YTD Q3 2016

Ramp up of used beverage can recycling line in progressHighly advanced sorting technology, closing the loop for our can customers
* from a lifecycle perspective
• Ramp-up delayed due to equipment design issues –production performance negatively impacted
• Main actions taken: • Main design modifications completed in October 2017• Reinforced organization• Line now technically ready to reach targeted output
• Focus now: • Further optimizing of production processes and overall
recovery rate – this has priority over volume output
• Output speed of targeted >40 000 mt/yr liquid aluminium expected by year-end 2018
• Efficiently operated, UBC line offer attractive returns and support target of being carbon neutral by 2020*
137

Automotive line 3 qualification process ongoing
• Line installed within planned investment frame and with good safety performance
• Ramp-up process delayed due to technical issues, impacting qualification process towards customers
• Qualifications delayed by approx. 6-9 months
• Mitigating actions taken already showing good improvements
• Overall supplies to customers are balanced by automotive lines AL1 and AL2
• Contracted volumes on track, in line with targeted margins
Potential of the line is well perceived by customers as future technology in automotive
BiW = Body in White
Original plan Updated plan
2017 2021
Indicative BiW ramp-up plan vs original plan
138

Doubling of automotive share with ramp-up of Automotive line 3
139
Automotive to support high-grading ambitions
Sales by segment
15%
10%
2016
Auto Can Europe Can overseas Litho Foil Special
24%
16%
2021
11%
8%
2010

Innovation as strong driver for increased competitiveness Customer surveys outline Hydro as the preferred innovation partner
LIBS = Laser induced breakdown spectroscopy
140
LIBS System for sorting of
automotive scrap successfully installed at R&D center Bonn –
optimizing scrap loop and supporting automotive
growth ambitions
HPSplusThe next generation of lithographic sheet
brought to the market by Hydro -improving surface for higher process
speed in offset plate printing
HPS = Hydro pre-treated surface

Way forward on NOK 900 million improvement ambition
141
Challenging to meet ambition in 2019, risk of 1 year delay due to operational issues
0
100
200
300
400
500
600
700
800
900
1000
2016 2017E 2018E 2019E 2020E Total program
MNOK
Improvement ambition Rolled Products
Improvements driven by
• Automotive growth• Recycling• Operational performance• Supply chain management• Product high-grading• Margin and portfolio mix • Open and engaged culture
High-grading, volumes & margins
Operationalperformance
Recycling
BetterRolled Products
700 MNOK

Arvid Moss, EVP Energy and Corporate Business Development
The future belongs to sustainable businesses

Technology drivingsolutions for the future
143
Resource depletion Climate challenge
The world of aluminium is greatly influenced by key long-term trendsProducers, consumers, regulators and end-users
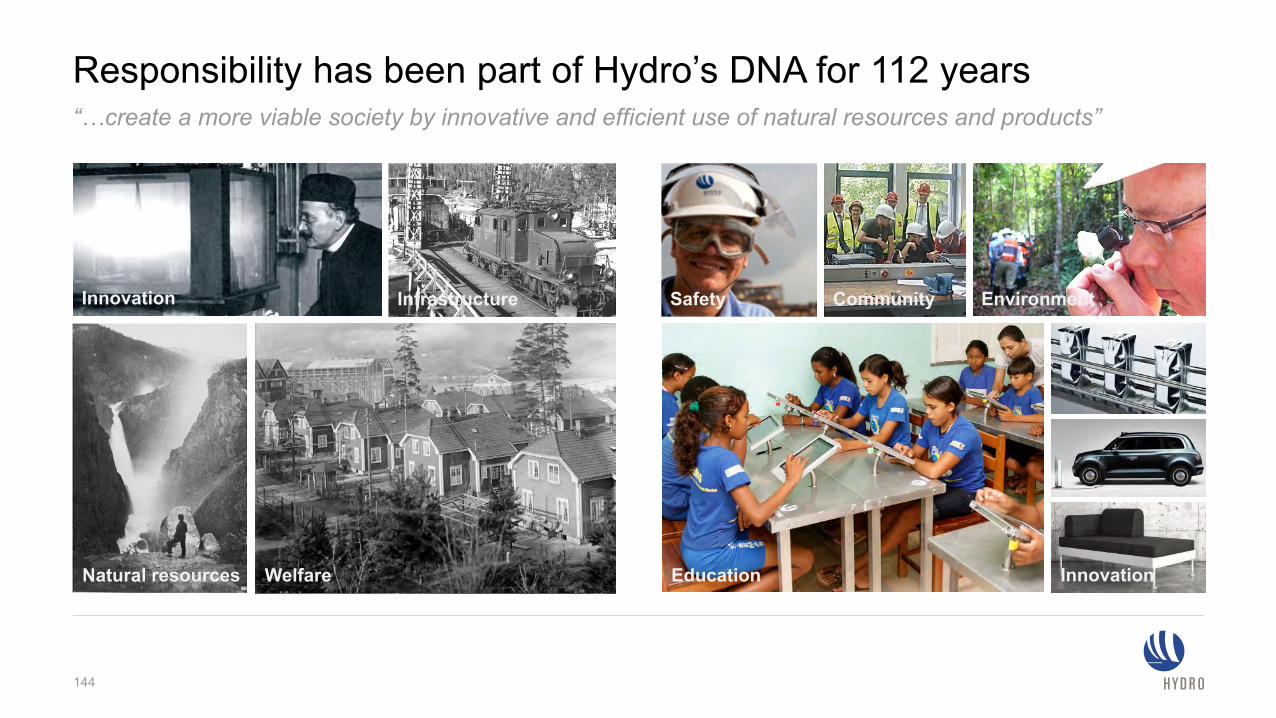
Responsibility has been part of Hydro’s DNA for 112 years“…create a more viable society by innovative and efficient use of natural resources and products”
144
Innovation Infrastructure
WelfareNatural resources
Safety Community Environment
Education Innovation

The Sustainable Development Goals cannot be reachedwithout the active participation of business
145

Making responsibility and sustainability a competitive edge
146
Planet, people, prosperity
Making a positive
difference
Driving innovation
Improvingour
footprint

Making responsibility and sustainability a competitive edge
147
Planet, people, prosperity
Making a positive
difference
Driving innovation
Improvingour
footprint

0
2
4
6
8
10
12
14
16
18
20
Sout
h Af
rica
Indi
a
Uni
ted
Sta
tes
Chi
na
Aus
tralia
Bah
rain
UAE
Qat
ar
Sau
di A
rabi
a
Rus
sia
Mal
aysi
a
Braz
il
Can
ada
Nor
way
Icel
and
Direct Indirect
The climate paradox
Source: CRU
0
10
20
30
40
50
60
70
80
90
2000 2005 2010 2015 2020 2025
Hydropower Nuclear Gas Coal
Hydropower
Gas
Coal
Aluminium production by power sourceMill tonnes
CO2 emissions and main energy source in aluminium production by countryTonne CO2 / tonne aluminium
Forecast
148
Increasing share of aluminium production is coal-based
An industry challengeGovernments will act
Customers will actCompanies need to act

-1.0
-0.5
0.0
0.5
1.0
1.5
2.0
2.5
2012 2013 2014 2015 2016 2017 2018 2019 2020
Our global industry’s most ambitious climate strategy
Production – reduction in own emissions
Products – usephase benefits
Recycling of post-consumer scrap
149
Hydro on track to be carbon-neutral from a life-cycle perspective by 2020
Million kg Co2
Hydro’s CO2 emissions from a life-cycle perspective*
* Incl Extruded Solutions from 2018

Strengthening rehabilitation at Hydro Paragominas
Updated 1:1 rehabilitation target• 1:1 rehabilitation of areas available for rehabilitation
within two hydrological seasons after mining
• Science-led rehabilitation through the Brazil-Norway Biodiversity Research Consortium
Updated targets and research partnership guide rehabilitation efforts to restore biodiversity
Forest Clearing
Topsoil removal and
storage
Overburden removal and
storage
Mining
Closing the Pit
Re-shaping the pit surface
Topsoil recovery
Forest rehabilitation
150

151
Making a positive
difference
Driving innovation
Improvingour
footprint
‘Business cannot succeed in societies that fail’ – World Business Council on Sustainable Development
A long-term agenda to optimize stakeholder and shareholder benefits

Targeting the fundamental drivers of long-term development
152
Aligned with community expectations and needs, and through local partnerships
* Communities directly or indirectly affected by our operations
Contribute to quality education in our communities*
Promote decent work throughout the value and supply chainFoster economic growth in our communities*
Strengthen local communities and institutions through capacity buildingon human rights and good governance

153
Making a positive
difference
Driving innovation
Improvingour
footprint
Planet, people, prosperity
Making responsibility and sustainability a competitive edge

Hydro-, solar-, wind-based powerpurchase agreements
Renewables, flexibility and storage to play together
154
Competitive long-term sourcing solutions, and making Hydro «Better, Bigger, Greener»
Wind Nordic and Brazil- Services and potential equity
Energy 4.0
Hydropower Norway, Increased flexibility
DigitalizationDemand flexibility
Positioning for the future means:
• Greener competitive sourcing, industrial processes and electrification
• Being a front runner seeking new business options more critical
• Understanding and utilizing changes in energy markets key to both competitive sourcing and exploring new business opportunities Energy Storage
- Batteries, hydrogen, heat applications

Part of the solution
155
Use-phase benefits, recycling friendly
Setting new standards in environmentally friendly and sustainable buildings.
Hydro Extruded Solutions to deliver to the world’s first purpose-built, mass-market electric taxi in London.

Combining high-value outputs with lower cost inputsRepositioning Hydro’s recycling activities, preparing for the circular economy
>50% of EI remelter sales in 2016 based on
RFA
150 kmtpost-consumerscrap by 2020~95 kmt in
2017
Primary Metal
Rolled Products
250 kmtin post-consumerscrap recycling
by 2020>40 kmtCapacity UBC
recycling facility- closed customer
loops
100 kmtpost-consumerscrap by 2020~50 kmt in
2017
156

Sustainability and competitiveness hand-in-hand
Producers
Users
Civil society
Sustainability will become more and more important
157
Third party certification system for responsible
production of aluminium

Commercializing low-carbon aluminium
158
Promoting responsible aluminium as the metal of the future

Hydro’s climate strategy converted into low-carbon products
159
Our uniqueness is our integrated value chain, share of hydro-power and post consumer scrap recycling
Hydro 75RHydro 4.0
Bauxite Alumina Shipping Energy Anodes Electrolysis Casting
All-in approach
Maximum or below 4.0 kg CO2e/kg Al
Verified according toISO 14064 by DNV GL
At least 75%post-consumer
recycled aluminium
Verified by DNV GL based ontraceability and quality principles
developed by Hydro

Capturing growing markets for low-carbon and recyclable aluminium
160

Responsibility and business hand in hand
161
The future belongs to sustainable
businesses


Investor Relations in Hydro
Stian HasleHead of Investor Relations
t: +47 97736022e: [email protected]
Even SimonsenInvestor Relations Officer
t: +47 97953364e: [email protected]
Next eventFourth quarter results
February 16, 2017For more information see
www.hydro.com/irAud Helen HalvorsenInvestor Relations Assistant
t: +47 95182741e: [email protected]
163