capital markets day - signify
TRANSCRIPT

9 December 2020
Capital Markets Day

1
Important information
Forward-Looking Statements and Risks & Uncertainties
This document and the related oral presentation contain, and responses to questions following the presentation may contain, forward-looking statements that reflect the intentions, beliefs or current expectations and projections of Signify N.V. (the “Company”, and together with its subsidiaries, the “Group”), including statements regarding strategy, estimates of sales growth and future operational results.
By their nature, these statements involve risks and uncertainties facing the Company and its Group Companies and a number of important factors could cause actual results or outcomes to differ materially from those expressed in any forward-looking statement as a result of risks and uncertainties. Such risks, uncertainties and other important factors include but are not limited to: adverse economic and political developments, impacts of COVID-19, the rapid technological change, competition in the general lighting market, development of lighting systems and services, successful implementation of business transformation programs, impact of acquisitions and other transactions, impact of the Group’s operation as a separate publicly listed company, pension liabilities and costs, establishment of corporate and brand identity, adverse tax consequences from the separation from Royal Philips and exposure to international tax laws. Please see “Risk Factors and Risk Management” in Chapter 12 of the Annual Report 2019 for discussion of material risks, uncertainties and other important factors which may have a material adverse effect on the business, results of operations, financial condition and prospects of the Group. Such risks, uncertainties and other important factors should be read in conjunction with the information included in the Company’s Annual Report 2019. Additional risks currently not known to the Group or that the Group has not considered material as of the date of this document could also prove to be important and may have a material adverse effect on the business, results of operations, financial condition and prospects of the Group or could cause the forward-looking events discussed in this document not to occur. The Group undertakes no duty to and will not necessarily update any of the forward-looking statements in light of new information or future events, except to the extent required by applicable law.
Market and Industry Information
All references to market share, market data, industry statistics and industry forecasts in this document consist of estimates compiled by industry professionals, competitors, organizations or analysts, of publicly available information or of the Company’s own assessment of its sales and markets. Market share, ranking and other data contained in this document may also be based on the Company’s good faith estimates, the Company’s own knowledge and experience and such other sources as may be available. Industry publications and surveys and forecasts generally state that the information contained therein has been obtained from sources believed to be reliable, but there can be no assurance as to the accuracy or completeness of included information. Rankings are based on sales unless otherwise stated.
Non-IFRS Financial Statements
Certain parts of this document contain non-IFRS financial measures and ratios, such as comparable sales growth, adjusted gross margin, EBITA, adjusted EBITA, EBITDA, adjusted EBITDA and free cash flow, and other related ratios, which are not recognized measures of financial performance or liquidity under IFRS. The non-IFRS financial measures presented are measures used by management to monitor the underlying performance of the Group’s business and operations and, accordingly, they have not been audited or reviewed. Not all companies calculate non-IFRS financial measures in the same manner or on a consistent basis and these measures and ratios may not be comparable to measures used by other companies under the same or similar names. A reconciliation of these non-IFRS financial measures to the most directly comparable IFRS financial measures is contained in this document. For further information on non-IFRS financial measures, see “Chapter 18 Reconciliation of non-IFRS measures” in the Annual Report 2019.
Presentation
All amounts are in millions of euros unless otherwise stated. Due to rounding, amounts may not add up to totals provided. All reported data are unaudited. Unless otherwise indicated, financial information has been prepared in accordance with the accounting policies as stated in the Annual Report 2019 and the semi-annual report 2020.
Market Abuse Regulation
This presentation contains information within the meaning of Article 7(1) of the EU Market Abuse Regulation.

2
Presenting team
Eric RondolatChief Executive Officer
Javier van EngelenChief Financial Officer
Maria Letizia MarianiMember of the Board of ManagementDivision Leader Conventional Products
Nicola KimmHead of Sustainability
Rowena LeeDivision Leader Digital Products
Harshavardhan ChitaleDivision Leader Digital Solutions

3
Agenda Capital Markets Day
Outline Time CET GMT EST Presenter
Opening 14:00-14:05 13:00-13:05 08:00-08:05 Rogier Dierckx
Session I
Vision for the Future 14:05-14:45 13:05-13:45 08:05-08:45 Eric Rondolat
Sustainability Leadership And Stakeholder Value Creation
14:45-15:00 13:45-14:00 08:45-09:00 Nicola Kimm
Accelerating Shareholder Value Creation 15:00-15:30 14:00-14:30 09:00-09:30 Javier van Engelen
Q&A 15:30-16:00 14:30-15:00 09:30-10:00
BREAK – 15 min
Session II
Conventional Products 16:15-16:30 15:15-15:30 10:15-10:30 Maria Letizia Mariani
Digital Products 16:30-17:00 15:30-16:00 10:30-11:00 Rowena Lee
Digital Solutions 17:00-17:30 16:00-16:30 11:00-11:30 Harsh Chitale
Q&A 17:30-18:00 16:30-17:00 11:30-12:00
Closing of the day 18:00-18:05 17:00-17:05 12:00-12:05 Eric Rondolat
Total duration 4 hours

4
Investor feedback – we heard you
When will Signify return to growth?
Can you provide us with an update on
Cooper cost synergies?
How much more potential cost savings
could we expect?
What is your M&A strategy going forward?
How are you managing the decline in
Conventional Products?
Can you tell us more about the volume and pricing dynamics in
LED?
What is the size of the UV-C lighting market?
What are the growth opportunities of connected
lighting and the growth platforms?
What is the growth potential of the overall
Lighting market?
How are your ESG targets translating into value creation?
How much more margin improvement is
feasible?
Can you provide an update on your capital allocation policy?


Eric Rondolat, CEO9 December 2020
Capital Markets DayVision for the Future
London, UKIlluminated River Project, World’s Longest Public Art Commission

7
The general lighting market transformation has radically changed the landscapeThe transition to LED is well underway, Connected Lighting has started
41
201920162013
1263 68 70
+2%
93%75%
50%
20162013 2019
6.0
2.6
6.7
85%
23%
-29% -15%
2013 2016 2019
11.4
24.2
34.5
-5%-13%
18%48%
Pricing CAGR (%) Volume CAGR (%)
+21%
+18%
-15%
Conventional Connected LEDNon-connected LED
CAGR%
+32%
+4%CAGR
(2013-19)
+29%
+13%
~40% of the global lighting corporate
assets changed hands in last 5 years
Lighting Market -Overall
(Value in EUR b, CAGR%)
Conventional Sockets
(% of total sockets, installed base)
Lighting Market -LED Lamps
(Value in EUR b, CAGR%)
Lighting Market -LED Luminaires
(Value in EUR b, CAGR%)
Value (€b)
Only 3 of top 6players from 2013 are still
in top 6 in 2019
1% → 6%(Connected-%, 2013-19)
12% → 22%(Connected-%, 2013-19)
Past Market Past Signify Future Market Future Signify

8
Signify underwent 7 transformations 2013-19 to remain market leader
From Conventional to LED1
From LED to Connected Lighting2
From Light Sources to Luminaires3
From Complex to Simplified4
From past to future based Financial Profile5
From ESG-commitments to recognized leader6
From Conglomerate Sub-segment to Standalone Public Company7
2016 20192013
2.8%
1.4%1.5%
Gross Capex Intensity (%)
74% 78%Conventional Sales(% of total sales)
LED Sales(% of total sales)
3.0
-3.8
Sales Variation (EUR b, 2013-19)
28
1613
20192013 2016
Conventional Factories (#)
Conv -20% CAGR
LED 17% CAGR
Luminaire Sales(% of total sales)
37% 45%
EUR 279mSaved in MBC Saved in NMC
EUR 544m
~0% 15%EUR ~0b EUR ~0.9b
2011 Connected Sales 2019
(% of total sales)
Past Market Past Signify Future Market Future Signify

9
Signify underwent 7 transformations 2013-19 to remain market leader
From Conventional to LED1
From LED to Connected Lighting2
From Light Sources to Luminaires3
From Complex to Simplified4
From past to future based Financial Profile5
From ESG-commitments to recognized leader6
From Conglomerate Sub-segment to Standalone Public Company7
74% 78%Conventional Sales(% of total sales)
LED Sales(% of total sales)
• Consumer : development of Hue and Wiz offers
• Professional : new brand Interact for Software Suites
• Interact new brand for Signify IoT Platform
1%
8%
26%
2013
2016
2019
Consumer Connected Sales (% of consumer sales)
9%
13%2019
2013 0%
2016
Professional Connected Sales(% of professional sales)
56
2013 2019
<10
Connected Light Points – Signify (#, millions)
Luminaire Sales(% of total sales)
37% 45%
EUR 279mSaved in MBC Saved in NMC
EUR 544m
~0% 15%EUR ~0b EUR ~0.9b
2011 Connected Sales 2019
(% of total sales)
Past Market Past Signify Future Market Future Signify

10
85%
15%
66%
34%
Signify underwent 7 transformations 2013-19 to remain market leader
From LED to Connected Lighting2
From Light Sources to Luminaires3
From Complex to Simplified4
From past to future based Financial Profile5
From ESG-commitments to recognized leader6
From Conglomerate Sub-segment to Standalone Public Company7
From Conventional to LED1
74% 78%Conventional Sales(% of total sales)
LED Sales(% of total sales)
• Strategic repositioning on next growth and profit pool
• Strengthened regional focus vs more global approach
• Acquired capability and market share focused on China and US
Profit Split
Light SourcesLuminaires
2013 2019
Luminaire Sales(% of total sales)
37% 45%
EUR 279mSaved in MBC Saved in NMC
EUR 544m
~0% 15%EUR ~0b EUR ~0.9b
2011 Connected Sales 2019
(% of total sales)
Past Market Past Signify Future Market Future Signify

11
Signify underwent 7 transformations 2013-19 to remain market leader
From LED to Connected Lighting2
From Light Sources to Luminaires3
From Complex to Simplified4
From past to future based Financial Profile5
From ESG-commitments to recognized leader6
From Conglomerate Sub-segment to Standalone Public Company7
From Conventional to LED1
• Adaptation of the cost base to the Top line
• Strategic R&D investment in LED and connected: ~€1.1b in 2016-19
€2.3b
20162013 2019
€1.8b€2.1b
33%32% 29%
NMC% NMC
€0.4b
7.5%4.0%
2013
5.5%
2016 2019
€0.5b
€0.3b
MBC% MBC74% 78%Conventional Sales(% of total sales)
LED Sales(% of total sales)
Luminaire Sales(% of total sales)
37% 45%
EUR 279mSaved in MBC Saved in NMC
EUR 544m
~0% 15%EUR ~0b EUR ~0.9b
2011 Connected Sales 2019
(% of total sales)
Note: MBC = Manufacturing Base Cost; NMC = Non-manufacturing Costs; Figures shown for MBC and NMC are FX-comparable
Past Market Past Signify Future Market Future Signify

12
Signify underwent 7 transformations 2013-19 to remain market leader
From LED to Connected Lighting2
From Light Sources to Luminaires3
From Complex to Simplified4
From past to future based Financial Profile5
From ESG-commitments to recognized leader6
From Conglomerate Sub-segment to Standalone Public Company7
From Conventional to LED1
-5%
41%
81%
2013 2016 2019
%-profit from Growing Profit Engines(Digital Solutions and Digital Products)
42%
72%
2013 2016 2019
<0%
%-cash from Growing Profit Engines (Digital Solutions and Digital Products)
74% 78%Conventional Sales(% of total sales)
LED Sales(% of total sales)
Luminaire Sales(% of total sales)
37% 45%
EUR 279mSaved in MBC Saved in NMC
EUR 544m
~0% 15%EUR ~0b EUR ~0.9b
2011 Connected Sales 2019
(% of total sales)
Past Market Past Signify Future Market Future Signify

13
Signify underwent 7 transformations 2013-19 to remain market leader
From LED to Connected Lighting2
From Light Sources to Luminaires3
From Complex to Simplified4
From past to future based Financial Profile5
From ESG-commitments to recognized leader6
From Conglomerate Sub-segment to Standalone Public Company7
From Conventional to LED1
•>80% sustainable revenues
•100% carbon neutrality
•100% use of renewable electricity
•Zero waste to landfill
4 consecutive years
External Recognitions(non-exhaustive)
74% 78%Conventional Sales(% of total sales)
LED Sales(% of total sales)
Luminaire Sales(% of total sales)
37% 45%
EUR 279mSaved in MBC Saved in NMC
EUR 544m
~0% 15%EUR ~0b EUR ~0.9b
2011 Connected Sales 2019
(% of total sales)
Past Market Past Signify Future Market Future Signify

14
Signify underwent 7 transformations 2013-19 to remain market leader
From LED to Connected Lighting2
From Light Sources to Luminaires3
From Complex to Simplified4
From past to future based Financial Profile5
From ESG-commitments to recognized leader6
From Conglomerate Sub-segment to Standalone Public Company7
From Conventional to LED1
74% 78%Conventional Sales(% of total sales)
LED Sales(% of total sales)
Luminaire Sales(% of total sales)
37% 45%
EUR 279mSaved in MBC Saved in NMC
EUR 544m
~0% 15%EUR ~0b EUR ~0.9b
2011 Connected Sales 2019
(% of total sales)
Past Market Past Signify Future Market Future Signify

15
Today, we are a EUR ~6b world innovation leader in lightingWe provide our customers with high quality, sustainability enabling lighting products, systems and services
“Our purpose is to unlock the extraordinary potential of light for brighter lives and a better world”
#1In Connected
In LEDIn Conventional
€6.2b Sales in 2019
37,000People in 74 countries
2020Achieved carbon neutrality
100% Electricity from renewables
56m Connected light points
in 2019
19,500Patents worldwide
2xR&D invested than our
nearest competitor

16
General lighting market growth profile is attractive while transition continuesThe development of connected systems creates new growth and profit pools
6.0 6.06.7
4.7
23%-5%
-15%-2%
31.924.2
34.541.2
18%
11%
-5%-2%
Pricing CAGR (%) Volume CAGR (%)CAGR%
+4%-8%
+13%+9%
General Lighting Market - By Signify Division(Value in EUR b, CAGR%)
7
3033
29 32
31 34
3036
1
2016
23
2023E2019 2020E
68 70
61
69
+1%+5%
+7%
+3%
-22%
Market CAGR (2020-23)
Conventional Products Digital Products Digital Solutions
2019 202320202016
Value (EUR b)
Lighting Market -LED Lamps
(Value in EUR b, CAGR%)
Lighting Market -LED Luminaires
(Value in EUR b, CAGR%)
Attractive growth potential for Digital Solutions and Digital Products LED Lamps transitions into LED Luminaires; Connected keeps increasing
7% → 12%(Connected-%, 2020-23)
22% → 27%(Connected-%, 2020-23)
+19% +14%Connected- CAGR (2020-23)
Past Market Past Signify Future Market Future Signify

17
Signify growth profile will structurally improve over the coming years
Sys & Serv
Light
SourcesLuminaires Electronics
Market Size 2020, 61 EUR b
4
7
39
10
NO FOCUS: B2C Decorative LED Luminaires (EUR ~7b)
High-mix-low-volume, localized
Negative growth(<0% CAGR, 2020-23)
Medium growth(<5% CAGR, 2020-23)
High growth(>5% CAGR, 2020-23)
Conv.
LED LED LED LED
Conv.NO FOCUS: Conventional Luminaires (EUR ~11b)Low profit and decline
Signify focuses on 70% of the lighting market Signify-weighted market CAGR gradually reaches market CAGR
-1.7%
-4.7%
-6.7%
-5.2%
-2.1%-1.3%
-2.9%
2.5%Signify-weightedMarket CAGR %
(2020-23)
Signify-weighted market growth will
converge to market growth
2018 202220192017 2020 2021 2023
Yearly Market Growth (%)
Signify-weighted
Yearly Market Growth (%)
less
Yearly Market Growth (%)
CAGR%+5%
-2.5%
Past Market Past Signify Future Market Future Signify

18
Growth platforms for sustainability offer a EUR ~5b market opportunity These require new technologies, innovation and adapted Go-to-market
Note: 1 Substitution of existing portfolio to 3D printing technology
Agri Lighting Solar Lighting UV-C Lighting
• Food availability and security• Yield optimization in
agriculture sector
• Climate action• Clean energy• “Green funding”
• Health & safety• Pandemic response• Future need for disinfection• Replacement market for light
sources
• Circularity• Design speed and flexibility• Delivery speed improvement• Reduction of transportation
3D Printing
Market Size / Opportunity
Size(EUR b)
Growth Drivers
Our Right to Win
CAGR%
Unique IP position in light recipes
Leader in both Technology and Quality
Decades long experience and application expertise
First mover advantage with extensive knowledge
on materials, process
2020 2023
1.51.8
+6%
1.1
2020 2023
1.7+16%
0.9
0.6
1.0
2020 2023
1.11.5
2.0+10%
2020
0.60.2 0.3
0.9
2023
0.81.2
+12%
Substitution1 New
19%
2%
Surface/air/object disinfection Water purification* Including conventional
Past Market Past Signify Future Market Future Signify

19
2 Growth ventures with high-growth potential
LiFi
Smart Poles
• Cyber-security: Secure meeting rooms, co-working spaces
• Industry 4.0: Higher data and performance needs
• Consumer device integration
Increasing Connectivity Demands• Deployment of 5G• ~20B new IOT devices by 2025• Shift to broadband IOT vs
narrow-band• Smart cities
2020
2.5
2023
1.1
+31%
2023
1.5
2020
3.4+31%
Potential Opportunity Size (EUR b) Growth Drivers Our Right to Win
Last mile indoor communications
Deployment of 5G
Industry leading technology & IP portfolio
Usage of existing Lighting infrastructure
Access through lighting infrastructure
Past Market Past Signify Future Market Future Signify

20
Signify focuses on Innovation led Organic Growth opportunities
~20% of portfolio with potential growth of
>10% CAGR
Market Size
~EUR 10b in 2020
Connected
Lighting
Growth
Platforms
Market CAGR
~14% in 2020-23
Signify Sales
15%(% of total)
Opportunity Size
EUR >5bin 2020
Market CAGR
~11% in 2020-23
Signify Sales
~4%(% of total)
Systems & ServicesLight Sources Luminaires Elec.
Growth Platforms
Past Market Past Signify Future Market Future Signify

21
2015 2016 2017 2018 2019 2020
Successful M&As in the past, specific business priorities for future M&A
• Luminaires Companies for market share• Online access gain
Reach and Market Share
Specialty applications
Technology building
Reach and Market Share
Specialty applications
Technology building
• Systems: Companies bringing complementary technology
• Services: Companies bringing capability and technological platforms
• Growth Platforms: Companies bringing capabilities in the sustainability-focused growth platforms
Past Market Past Signify Future Market Future Signify
Key M&A over last few years Mergers & Acquisition Focus (Business Lens)

22
We will address the market opportunities with our 5 Frontiers StrategyImplemented Q3-2019 as part of our annual Strategic Process
Build a customer
centric organization
Be a great place to work
• Strong focus on diversity & inclusion, succession health, skill development
• Employee NPS surveys conducted quarterly with quarterly actions
• Reputation and brand are important differentiators versus competition
• Ordering & Delivery is focus for improvement
• Customer NPS surveys conducted quarterly with quarterly actions
Past Market Past Signify Future Market Future Signify
Employee NPS
20
29
2019 20201 2023
80% 84%Participation Rate (%)
35
47
2019 20201 2023 Target
Customer NPS
Note: 1 2020 number shown is average of Q1-Q3
23
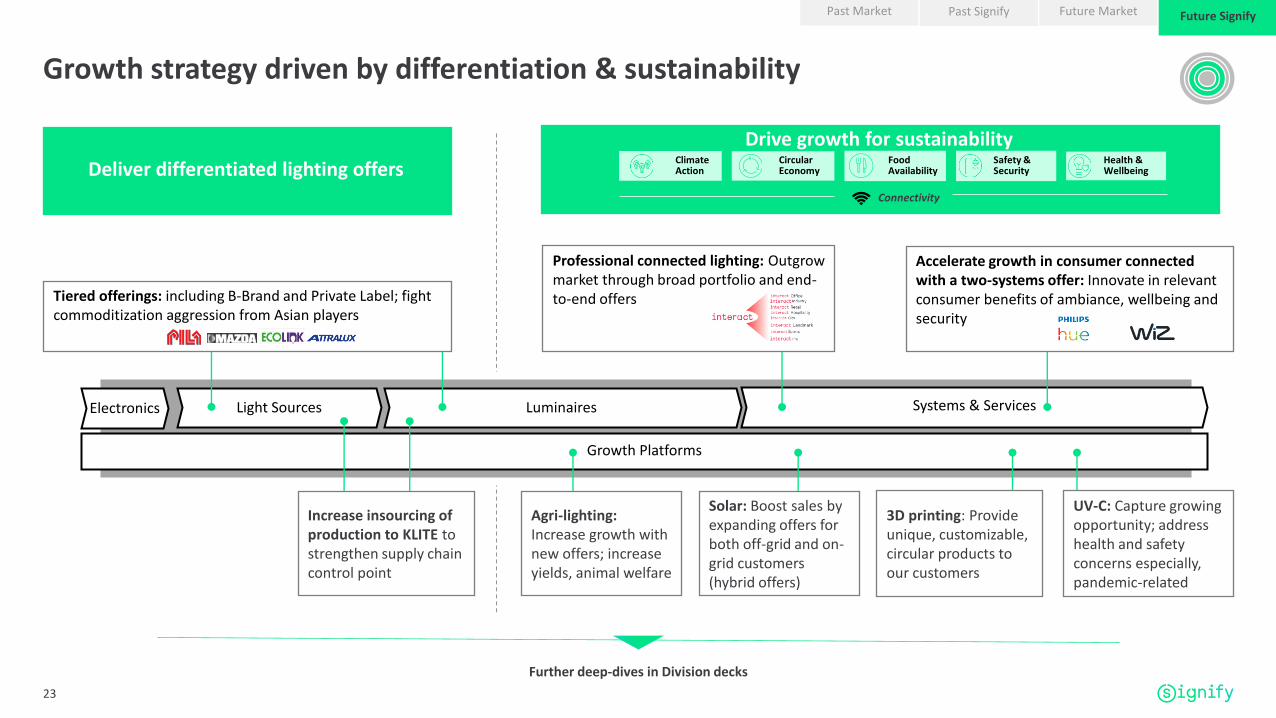
Growth strategy driven by differentiation & sustainability
Deliver differentiated lighting offers
Systems & ServicesLight Sources Luminaires Electronics
Growth Platforms
3D printing: Provide unique, customizable, circular products to our customers
Agri-lighting: Increase growth with new offers; increase yields, animal welfare
Solar: Boost sales by expanding offers for both off-grid and on-grid customers (hybrid offers)
Professional connected lighting: Outgrow market through broad portfolio and end-to-end offers
Further deep-dives in Division decks
UV-C: Capture growing opportunity; address health and safety concerns especially, pandemic-related
Accelerate growth in consumer connected with a two-systems offer: Innovate in relevant consumer benefits of ambiance, wellbeing and security
Increase insourcing of production to KLITE to strengthen supply chain control point
Tiered offerings: including B-Brand and Private Label; fight commoditization aggression from Asian players
Past Market Past Signify Future Market Future Signify
Drive growth for sustainabilityFood Availability
Circular Economy
Health & Wellbeing
Safety & Security
Climate Action
Connectivity

24
Digitalization multi-year plan in execution
Digitalize customer interfaces Digitalize internal processesDevelop offers over entire digital stack
Example: LightFinder
Innovative mobile appto find, buy and use
lighting products
AI-based Light Bulb Recognition
Browse Light bulb catalog
AR-based Live Preview
Purchase convenience Products
100% connectable(drivers, light sources, luminaires)
Data-enabled Services(IOT platform)
Connected Lighting Systems
Asset-tracking
Space Mgmt.Indoor
Navigation
Ambience
Entertainment
Security
Scene Mgmt.
Energy Optimization
Past Market Past Signify Future Market Future Signify
Digitalize and transform for the future
Example: Performance review
Automated monthly review process for markets across multiple databases, legacy
software covering comprehensive KPIs

25
Unlocking the extraordinary potential of light for Brighter Lives and a Better World
Note: 1 Signify will provide annual guidance on CSG% at the start of every year
Comparable Sales Growth%0 to 5%1
Margin11 to 13% Adj. EBITAby 2023
Free Cash Flow> 8% of sales
Return on Capital Employed≥ 11%
Climate action
Double the pace we achieve the Paris Agreement
Circular Economy
Double Circular revenues to 32%
Brighter Lives
Double Brighter Lives revenues to 32%
Great place to work
Double % women in leadership to 34%
5 Frontiers Strategy Brighter Lives, Better World 2025 Financial Targets 2021-23
Past Market Past Signify Future Market Future Signify


Dr. Nicola Kimm, Head of Sustainability, Environment, Health and Safety9 December 2020
Capital Markets DaySustainability leadership and
stakeholder value creation

28
Signify successfully undertook a sustainability driven transformationOur purpose addresses macro-trends and the UN Sustainable Development goals are our compass
Climate change & Resource scarcity
Demographic change & Urbanization
“Our purpose is to unlock the
extraordinary potential of light for
brighter lives and a better world”
SDGs

29
Brighter Lives, Better World 2020 programWe overachieved our objectives and we are recognized externally
2.5 billion LED delivered (vs target of 2 billion)
World Index 4 consecutive years
Platinumtop 1%
A list for climate and supply chain
Leader ‘AA’ rating
#1 in electronicsindustry
1022958
836 866778
666
528 560
401 363287
2010 2011 2012 2013 2014 2015 2016 2017 2018 2019 2020
kt/a
50% less safety incidents over 5 years
External
Recognitions
(2020):
Carbon neutral & 100% renewable electricity
Zero waste to landfill
99% supplier sustainability performance (vs target 90%)
83% Sustainable revenues (vs target of 80%)
Carbon footprint
Revenues
Operations
E

30
Our growth strategy fully aligns with Brighter Lives, Better World 2025We added two Sustainable Development Goals: 3 and 8
Food availabilitySafety & securityHealth & wellbeing
Climate action
Circular economy
Great place to work
Sustainability focus and UN SDGs
Bri
ghte
r Li
ves
Bet
ter
Wo
rld

31
Our new Brighter Lives, Better World 2025 program sets very ambitious targetsWe aim to double our positive impact on the environment and society
Climate action
Circular economy
Food availability
Safety & security
Health & wellbeing
Great place to work
Double our Brighter Lives revenues to 32%
10 million lives lit through our Signify Foundation
Carbon neutral operations & 100% renewable electricity
Safe & healthy workplace with a TRC rate less than 0.30
Increase Climate action revenues from 58% to 72%
Supplier sustainability performance of 95%
Zero waste to landfill and sustainable packaging
Double our Circular revenues to 32%
Double our % of women in leadership to 34%
Doubling objectives Continue and strengthen
Bri
ghte
r Li
ves
Bet
ter
Wo
rld Double the pace we achieve the
1.5°C scenario of the Paris Agreement

32
Double our positive impact on the environmentOur Climate action and Circular economy commitments contribute to a better world
Circular products, systems and services preserve value and avoid waste:
• Serviceable luminaires
• Circular components
• Intelligent systems
• Circular services
• Achieve the 1.5°C target of the Paris Agreement over our value chain 6 years early
• Carbon neutral in our operations
• Energy-efficient and solar solutions
Double the pace of the Paris Agreement
Double our Circular revenues to 32%
0
100
200
300
400
500
2019 2025 2031
Paris Agreement 1.5°C target
SignifyMt/a
E E

33
Double our positive impact on societyOur Brighter Lives and Diversity commitments contribute to brighter lives
Double % of women in leadership to 34%Double Brighter Lives revenues to 32%
Food availability
• Horticulture
• Aquaculture
• Animal centric lighting
Safety & security
• Smart street lighting
• Security at home and work
• Trulifi
Health & wellbeing
• UV-C light
• Human Centric Lighting
Strengthen diversity & inclusion through:
• Succession plans
• Sponsorship, mentoring
• Leadership development
• Unconscious bias trainings

34
Sustainability: Key Takeaways
• Doubling targets for 2025 are bold and
ambitious
• Our leading technology and innovation drives
our growth for sustainability strategy
• We enable our customers to deliver on their
sustainability ambitions
• Brighter Lives, Better World delivers financial,
environmental and social value for our
stakeholders and society


Javier van Engelen, CFO 9 December 2020
Capital Markets DayAccelerating shareholder value creation
Cologne, GermanySignify’s connected lighting brings Cologne closer to becoming Germany’s first Smart City

37
Key focus areas post-IPO 2016-19 achievements
Average Comparable Sales Growth
Adj. EBITA Margin Expansion
Free Cash Flow Generation
Sustainability Targets
Average Return on Capital Employed
• Overall: -2.7%• LED (+10.7%), Conventional (-20.1%)
• 78% LED; 15% connected
• ~310 bps since start of 2016
• EUR 1.7b cumulative (6.2% of sales)
Balance Sheet Strength
Shift to LED and Connected Lighting
• ~10%
• Consistent investment grade rating• Net leverage: ~0.9x by end of 2019
Value Creation• Share price appreciation since IPO: +78%• Dividend payouts since IPO: EUR 492m in total• Share buy-backs to the amount of EUR 669m
• Overachievements of Brighter Lives, Better World 2020 objectives
Innovation and transformation-driven value creation since 2016 IPO

38
9 months 2020 Full Year – 2020E Remarks (Full Year – 2020E)
Signify -15.3% -13.5 to -13% • Top-line severely impacted by COVID-19 pandemic
Digital Solutions • Slow professional recovery due to continued COVID-19 restrictions
Digital Products • Strong demand for connected home lighting
Conventional Products• Decline of conventional lamps compensated by UV-C and horticultural
lighting
Signify 9.6% 10.2 to 10.6% • Margin resilience despite top-line decline
Signify 10.5% >11%• Free-cash flow increase driven by structural working
capital improvement
GrowthCSG%
Adj. EBITA%
Free Cash Flow(% of sales)
Outlook 2020: Strengthened financial profile in unprecedented market conditions

39
Total company sales growthMid-term guidance
• Rebound from COVID-19 crisis will offer growth and market share gain opportunities
• Our sustainability-driven businesses target an attractive market opportunity
• Continuous innovation in connected lighting and new growth platforms improves Signify’sgrowth profile
Value creation
Sales
Profit
Cash
Investor return

40
Our 3 scenarios for post-pandemic business recovery using market modelling
Online Lockdowns Stimulus
+++ - ++
++ - - +
+ - - - -
ConsumerMarket more resilient
Online drives performance Lockdown less impacting
ProfessionalMarket softer
Lockdowns very impactfulStimulus influence from H2-21
#1Market back to 2019
levels in 2022
#2Market back to 2019
levels in 2023
#3Market back to 2019
levels in 2025

41
2021-23 Sales Guidance
Yearly comparable sales growth: 0 to 5%
Yearly guidance provided at Q4 earnings release
• Market rebound from COVID-19• Growth platforms offset conventional decline• Digital Products & Digital Solutions: >90% of sales
Our sales growth is driven by technology innovation and sustainability Early period will benefit from a lower base of comparison
Signify-weighted Market CAGRs under the 3 scenarios
Growth Rate
2020 2023
Growth Drivers
• Rebound from 2020
• Acceleration of connected lighting & growth platforms
• Conventional –higher base
• Continued growth of connected lighting & growth platforms
• Conventional –lower base
#1Market back to 2019
levels in 2022
#2Market back to 2019
levels in 2023
#3Market back to 2019
levels in 2025+1%
+2.5%
+4%
CAGR%

42
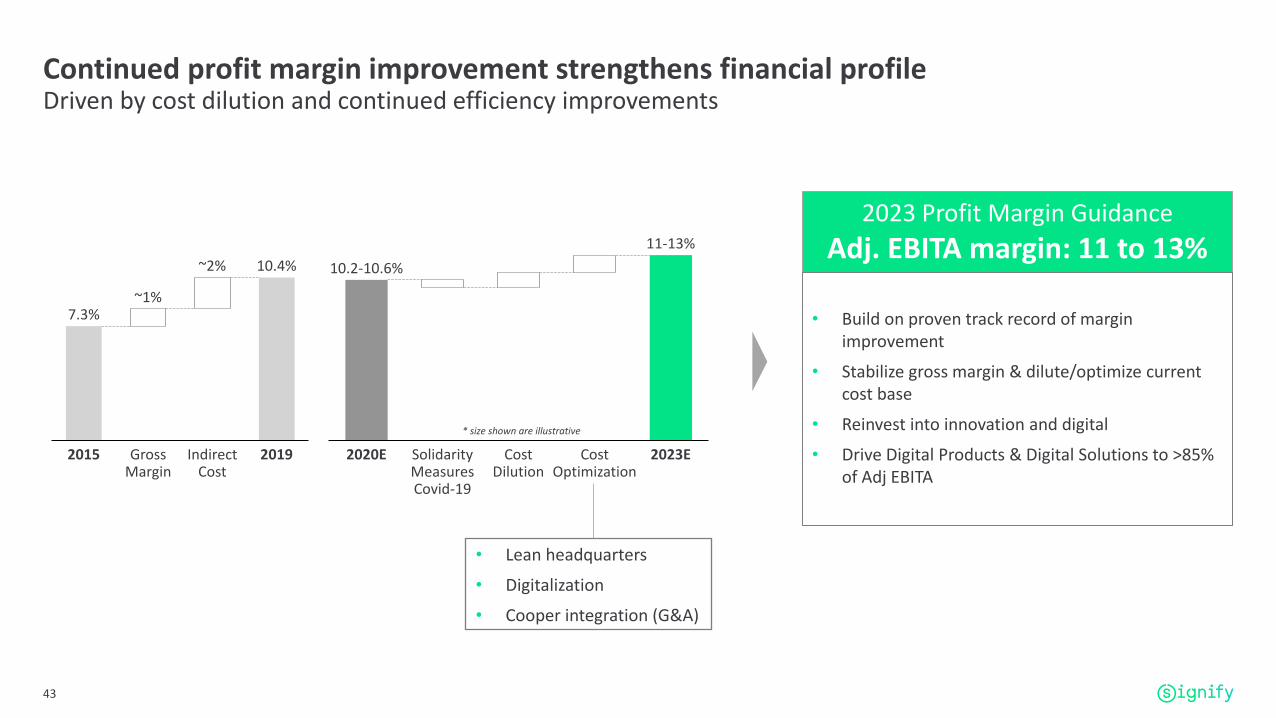
Continued profit margin improvementMid-term guidance
• Gross margin to remain broadly stable
• Indirect costs (as % of sales) to decrease due to cost dilution and continued cost efficiency drive
• Dependency on Division Conventional Products profitability will further diminish
Value creation
Sales
Profit
Cash
Investor return
43
2023 Profit Margin Guidance
Adj. EBITA margin: 11 to 13%
• Build on proven track record of margin improvement
• Stabilize gross margin & dilute/optimize current cost base
• Reinvest into innovation and digital
• Drive Digital Products & Digital Solutions to >85% of Adj EBITA
• Lean headquarters
• Digitalization
• Cooper integration (G&A)
Continued profit margin improvement strengthens financial profileDriven by cost dilution and continued efficiency improvements
7.3%
2015 2019GrossMargin
IndirectCost
~1%
~2% 10.4%
CostDilution
2020E SolidarityMeasuresCovid-19
CostOptimization
2023E
10.2-10.6%
11-13%
* size shown are illustrative

44
Sustained solid free cash flow generationMid-term guidance
• Further anchor Digital Product & Digital Solutions as key drivers for cash flow
• Continued working capital discipline
• Strict management of capex and investment returns
• Gradual decrease of M&A integration and restructuring costs
Value creation
Sales
Profit
Cash
Investor return

45
Solid Free Cash Flow generation driven by Digital Solutions & Digital Products
Working Capital fuels FCF
Asset light decreases risk
Gradual decrease restructuring /
M&A integration costs
>2.2%
2021-23E2016 2019-20E
2.2%
2016
1.5%
2019-20E
˜1.3%
2021-23E
˜6.2%
2016
9.3%
2019-20E 2021-23E
Working Capital (% of sales)
Gross Capex (% of sales)
Restructuring & PMI Costs (% of sales)
CSG < 0Working Capital
Released
CSG > 0Working Capital
Consumed
FCF
Free Cash Flow (EUR m)
> 6001
2021-23E2016 2019-20E
418
2021-23 Free Cash Flow Guidance
Free Cash Flow: >8% of sales• Maintain structural improvements in working capital
• Gradually decrease restructuring / PMI costs
Note: 1 average FCF generation over the 2 years

46
A reliable investmentMid-term guidance
Value creation
Sales
Profit
Cash
Investor return
• A continued steady profit increase
• Reinforced asset-light profile

47
A steady ROCE increase aligned to the company strategy
• Gradual improvement after Cooper integration• Anchor Signify at upper-end of peer companies
Reduced # of conventional factories: 28 → 13in 2013-19
€532m€485m
€422m€357m
2021-2023E
2016 201920182017 2020E
Adj. EBITA margin (%)
Tangible Fixed Assets
(FX-comparable, excl. M&A and IFRS 16 impact)
2020E20192017 2018 2021-23E
WACC
10.1%10.7% 10.8% ~10%
>11%Return on Capital Employed (%)
2021-23 ROCE Guidance
Signify ROCE: >11%
2016 2020E2017
8.9%
2018
9.6%
2019 2021-2023E
10.1% 10.4% 10.2-10.6%
11-13%

48
Capital AllocationDelivering on our promises
Dividend policy
Value creation
Sales
Profit
Cash
Investor return
Deleveraging M&A Other

49
Maintain dividend policy – annual increase of dividend per share
• 40-50% of Continuing Net Income • Pay out an increased dividend per share, to be paid out annually in cash
2021 2022
1.25
2016
1.10
20232017 2018 2020E
1.30 Aim to increase our dividends per share
every year
*size is illustrative
2016-19 2020-23
Policy
Application
• EUR 492m dividends since IPO
• Between 44-49% of continuing net income paid per year
• Year-on-year increase in dividend per share
• 2019 suspended due to COVID-19 uncertainty

50
Honor deleveraging commitment to be <1x by end 2022
Net debt / reported EBITDA (x)
• New term loans split between 3 and 5 year to repay the debt we put in place at the IPO (Q1-20)
• Accessed Eurobond market to repay the bridge financing for the Cooper Lighting (Q2-20)
2021E2016 Mar-202017 2018 2020E2019 2022-2023E
0.5x 0.5x
0.9x 0.9x
2.7x
~2.2x
Debt maturity profile of term loans and bonds (EUR m)
Cooper acquisition
289
675527
600
2023 20262021 202520242022 2027
Term Loan Eurobond
BBB- (stable)
Baa3 (stable)
Re-financed term loans
A balanced debt maturity profile with flexibility A strong commitment to maintain investment grade rating

51
Disciplined inorganic growth drives shareholder value
Valuation
Timing of Value
Creation
Impact to EPS
Value created divided by Purchase Price
Time for ROIC to surpass discount rate
Time to EPS accretion
ROIC in year 4 vs discount rate
Payback period
% of EPS accretion in year 1
Terminal value as % of total value
On-track Slightly off-track Off-track
Progress vs initial combinations
Robust, disciplined financial methodology to evaluate M&A Monitored strictly to ensure inorganic value creation is on track
52
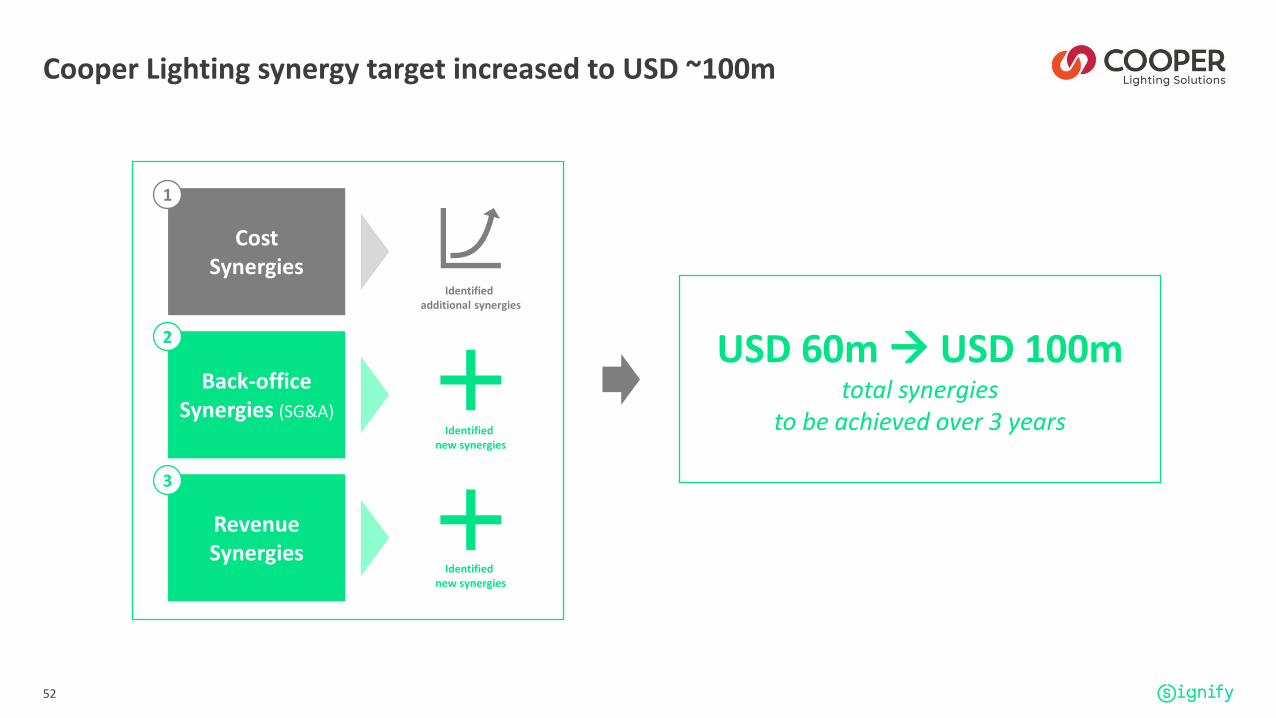
Cooper Lighting synergy target increased to USD ~100m
USD 60m → USD 100mtotal synergies
to be achieved over 3 years
Cost Synergies
Back-office Synergies (SG&A)
Revenue Synergies
1
2
3
Identified additional synergies
Identified new synergies
Identified new synergies

53
Sustainability
Sales
Profit
Cash
Investor return
Sustainability at the heart of value creation
Reduced costs by better use of resources
PPA Plastic free packaging Waste reduction
Higher cash generation
• Inventory and supply chain improvements
• Alternative financing
Growth accelerated by connected and sustainable lighting
Food availabilityCircularityClimate change Safety & security Health & wellbeing

54
In summary: our renewed value creation framework
• Positive Signify comparable sales growth (0 to 5%), driven by technology innovation and sustainability
• Continued Adj. EBITA margin improvement to 11-13% by 2023
• Solid free cash flow generation, above 8% of sales for 2021-23
• Steady increase of ROCE, of at least 11% for 2021-23
• Double our Brighter Lives, Better World impact by 2025
While –
• Raising Cooper Lighting synergies from USD >60m to USD ~100m
• Increasing dividends to shareholders year-on-year
• Deleveraging in line with commitment to <1x by 2022
Value Creation &
Sustainability
Sales
Profit
Cash
Investor return
Our path to drive shareholder value creation

Maria Letizia Mariani, Division Leader Conventional Products
9 December 2020
Capital Markets DayDivision Conventional Products

57
Division Conventional Products serves multiple customer segments with a world-leading portfolio
ConsumerOEM
Retail Public ResidentialOffice & Industry Horticulture Purification Projector
Professional
Past Market Past Signify Future Market Future Signify

58
2.9
2013
12.8
20192016
7.3
CAGR-26%
CAGR-17%
• Traditional players divested heavily to meet declining demand
• Main actors consolidated their positions
2016 2019
Signify Competitor 2Competitor 1
Conventional market: sharp decline driven by energy efficiency and legislation The market saw a further concentration benefitting the traditional actors
Double-digit conventional market decline Further market concentration in conventional lamps & electronics
Market Drivers
• Energy efficiency objectives
• Improving price points of LED Light sources
• Legislative bans (Incandescent, Halogen)
~2.2x of next
competitor
~1.8x of next
competitor
EUR b
Past Market Past Signify Future Market Future Signify

59
Strengthened financial profile in a declining market Global leading market player
Sales
Free Cash
Flow
Profitability
Adj EBITA%
Continuous market share gain
20162013 2019
16.9%
20.2%19.2%
21.3%
2013 2016 2019
19.1%
Market(CAGR)
-17% -26%
#1Global Leader
39StrongCustomer
NPS
27High Employee
NPS
end of 2019:
Significant and timely footprint optimization
28
1613
2013 2016 2019
2 0 1 3 2 0 1 6 2 0 1 9
+1pp
+6pp
NA
Signify gained market share and strengthened its financial profileLeadership position was strengthened, customer and employee Net Promoter Scores increased
Market Share (%)
# of factories
Past Market Past Signify Future Market Future Signify
2016
€3.6b
2013 2019
€2.3b€1.2b
-13%-21%

60
Double-digit but slowing market decline ahead
2016 2019 2020E
7.3
2023E
2.9
2.1
1.0
-26%
-21%
Restructuring charges reduced vs IPO guidance
• Fewer factories closures because of improved growth performance (vs. IPO hypothesis)
• Delayed, thus reduced impairment and restructuring costs
• Proven track record of efficient and cost optimized factory closures
• Clearly defined inter-divisional talent-flow objectiveSignifyMarket
Signify continues to increase market share in a less declining market
EUR b
Signify
EUR 300m EUR 200mAt time of IPO:
22
2017 20202019 …2016 2018
EUR 154m EUR 165mLatest view:
Past Market Past Signify Future Market Future Signify

61
Strategy: Continuous share gain and growth in UV-C light sourcesDivision Conventional Products
Systems & ServicesLight Sources Luminaires Electronics
Growth Platforms
Improve horticulture leadership position by leveraging our customer reach, brand and light recipes
Grow UV-C light sources byaddressing the growing need for more healthy environments
Win profitable market share using our leadership in scale, brand and customer reach
Past Market Past Signify Future Market Future Signify
2. Deliver differentiated lighting offers
3. Drive growth for sustainabilityFood Availability
Circular Economy
Health & Wellbeing
Safety & Security
Climate Action
Connectivity

62
Grow UV-C by leveraging our decades-long expertise and expanded production capacity
Market Size
Customer benefits and proof points (non-exhaustive)
Signify Competitive Strengths
Market Growth Drivers
Signify & OEM offerings
• 35 years of expertise in UV-C; market leader with double-digit market share
• Unparalleled manufacturing capability and capacity; recent investment to increase capacity by 8x
• Significant R&D capabilities to explore complementary technologies to enhance the portfolio
• Broad customer base: >300 OEM partners in >50 countries
• Pandemic response
• Health & safety concerns
• Replacement market for light sources drives recurring revenues
2019
274
2020E 2023E
104180
+73%
+15%
Surface/Air Water
Market Size (Lamps only)
2023E
1.0
2019 2020E
1.52.0+51%
+10%
SystemsLamps
Water Disinfection -
Consumer
Industrial Water
purification
Object Disinfection -
Consumer
Air / Surface Disinfection -Professional
• Inactivates SARS CoV-2 based on independent analysis
• Disinfection robots: can be effectively used across the healthcare, hospitality, and other sectors
• Air-circulators: Provides safe environment to their customers
EUR b
EUR m
Past Market Past Signify Future Market Future Signify

63
Improved leading market share and sustained strong financial profile
489
221
14
16
18
20
22
0
200
400
600
2023E
21.3%
2016
19.1%
2019 2020E
465
222
10
15
20
25
0
200
400
600
2020E2016
19.2%
20.2%
2019 2023E
2016 2023E
1.2
2019
2.3
2020E
*Sizes shown for 2020E and 2023E are illustrative
Past Market Past Signify Future Market Future Signify
Sales (EUR b)
Figures Comments (Forward Looking)
• Continuous commercial market share gain though customer conversion
• Continuous industrial market share expansion
• Positive sales growth mix impact of professional, horticulture and UV-C lamps
• Leading profitability stability by adapting margin and costs to top-line decline
• Further optimization of industrial footprint
Adj. EBITA(EUR m, %)
FCF(EUR m, %)
Market share %

64
Key takeaways
• We gained market share, strengthened our leadership and financial profile in a declining market
• Our strategy is built around:
• Continuous share gain
• Growth in UV-C by leveraging our decades-long expertise
• We will continue to deliver solid operating margins and free cash flow by adapting margin and costs to top-line decline and optimizing our industrial footprint


Rowena Lee, Division Leader Digital Products
9 December 2020
Capital Markets DayDigital Products

67
Digital Products serves multiple customer segments with technology leading light sources, luminaires, components and connected systems
Consumer Professional OEM
LED Lamps LED Modules LED Drivers
ConnectedComponents
LED luminaires
LED Lamps LEDLuminaires
Connected systems
Connected Lamps
Office & Industry RetailPublicResidential Office & Industry Hospitality PublicRetail
Past Market Past Signify Future Market Future Signify

68
Digital Products market size (value) Market price development, selected categories
The industry has transformed driven by energy efficiency and cost innovationLED business saw increased competition while technology-enabled, differentiated connected offers emerged
LED Lamps
20162013
LED Decorative Luminaires
2019
LED Functional Luminaires
Conventional luminaires
LED Electronics
LED Consumer Connected
23
30
33+6%
Average unit selling price indexed at 2013 value
Focus
NoFocus
High-mix-low-volume, localized
Low profit and decline
20192013
LED lamps
LED Electronics
LED Functional Luminaires
Connected LED lamps
Technology and cost innovation
Intense competition
Only 3 of top 6LED players from 2013 are still
in top 6 in 2019
Market Growth Drivers:• Government regulations for sustainability• Energy efficiency improvement• Cost innovation drive to more affordability• Smart applications led by connected technologies
EUR b
Past Market Past Signify Future Market Future Signify

69
Digital Products is an innovation world leader with strong financial profile Profitable leadership position in LED and connected lighting driven by strong brand and customer preference
LED Lamps 1
LED Electronics 1
LED Functional Luminaires Top 3
LED Consumer Connected 1
Improved financials
6%
-6%
11%
Became market leader
Rank by product category, 2020
20162013 2019
Other
LED Electronics
LED Lamps & Luminaires
LED Consumer Connected
1.3
2.12.4
+10%
16% CAGR for
focus business
150
240
NA
1.6x
Comparative Brand preference (Q3-20)Digital Products Philips brand versus next
best competitor1
Sales
Free Cash
Flow
Profitability
Adj EBITA%
Increased customer preference
Customer Net Promotor ScoreAcross Consumer, Prof and OEM
customers
30
35
40
45
50
1Q
19
3Q
20
2Q
19
3Q
19
4Q
19
2Q
20
1Q
20
100
50
B2B B2C B2C ConnectedPhilips
Next best competitor
EUR b
EUR m
Past Market Past Signify Future Market Future Signify
Note: 1 Philips brand preference data has been indexed to 100% to compare across channels. B2C brand preference is measured only with consumers in China.

70
Growth driven by integrated LED luminaires and connected technologyPrice decline forecasted to slow down in line with technology maturity
Digital Products market size (value) Market price development, selected categories
2016
LED Lamps
LED Decorative luminaires
2020E2019 2023E
LED Electronics
Conventional luminaires
LED Functional Luminaires
LED Consumer Connected
30
33
29
32
+3%+3%
CAGR (2020-23)
26%
9%
5%
-9%
-6%
12%
Focus
NoFocus
High-mix-low-volume, localized
Low profit and decline
Market Growth Drivers:
• Sustainability-driven socket-base conversion
• Smart home adoption boosts connected lighting
• Shift to integrated LED luminaires
• LED component growth in line with B2B luminaires growth
Average unit selling price indexed at 2013 value
Rate of price decline plateaus
20192013 2023
LED lamps
Connected LED lamps
LED Functional Luminaires
LED Electronics
EUR b
Past Market Past Signify Future Market Future Signify

71
Systems & ServicesLight Sources Luminaires Electronics
Growth Platforms
Accelerate growth in consumer connected with a two-systems offer: Innovate in relevant consumer benefits of ambiance, wellbeing and security
Grow LED Lamps market share with multi-brand offer: A, B-brand and Private Label
Increase insourcing to KLITE to strengthen supply chain control
Innovate to grow professional connected and increase share in China
Disinfection Lighting (UV-C): Innovate on consumer UV-C portfolio to address health concerns (including COVID)
Grow LED Luminaires with innovative portfolio: Leverage LED R&D and distribution strength
Past Market Past Signify Future Market Future Signify
Strategy: Differentiated offers, growth for sustainabilityDivision Digital Products
2. Deliver differentiated lighting offers
3. Drive growth for sustainabilityFood Availability
Circular Economy
Health & Wellbeing
Safety & Security
Climate Action
Connectivity

72
Key growth area: Capture growth from the transition to integrated luminaires Expand luminaires portfolio and distribution
Market Size Signify Competitive Strengths
Market Growth Drivers
Signify offering (non-exhaustive)
4.5
2020E 2023E
5.8+9%
• Multi-brand strategy to address different customer segments
• Portfolio strength with unique EyeComfort light recipes
• Industry-leading R&D capabilities from LED lamps to luminaires
• Global scale in manufacturing and distribution
• Population growth and urbanization
• Sustainability-led socket base conversion
• Technology transition from lamps to LED integrated luminaires
Living Room Europe
Study Room
Outdoor
Living Room China
Customer testimonials & benefits
Focused on Health & Well-being
Integral shelf management
from non-connected to
connected
Tmall Flagship Store Rating
EUR b
Past Market Past Signify Future Market Future Signify

73
EyeComfort: Light that’s easy on the eyes across LED Lamps and Luminaires portfolio
Past Market Past Signify Future Market Future Signify

74
Philips Hue: Full-featured leading consumer connected systems
Past Market Past Signify Future Market Future Signify

75
Key growth area: IOT-technology driven consumer connected lighting Accelerate growth with a complementary two-system offer leveraging Signify’s global market leadership position
Market Size Signify Competitive Strengths
Market Growth Drivers
Signify offering
1.8
2020E 2023E
0.9
+26%
• Innovation leadership in industry leading technology (Zigbee, WiFi, Bluetooth) and use case
• Higher brand equity and preference against competitors
• Engagement and expansion with millions of households
• Cross-industry alliances to drive future technologies & protocols
• Personalized lighting experience for consumers
• Technology-enabled ease of installation, customization & automation
• Increasing consumer awareness & adoption of smart home ecosystem
Ambience Creation
EnhancedEntertainment
DIY Automation
Eco-system Partnership/
Open Platform
Wellbeing: Circadian rhythm
Security
Friends of Hue
(Switches)
Wiz-enabled 3rd party Brands
Customer testimonials and proof points
“Best Overall The Wiz app, which you'll
use for setup and programming, is surprisingly full-featured” – Nov-20
“The greatest designs of modern time [… Hue…], makes lighting our homes as personal as the music we listen to.” –Apr-20
EUR b
Past Market Past Signify Future Market Future Signify

76
Wiz: Intuitive connected system that enhances your daily living

77
KLITE acquisition: Strategic objectives realized, synergies well on trackFurther insourcing will lead to higher sales, higher profitability and working capital improvement
Strategic rationale
Delivering strong contribution to division results
Synergy realization on plan
Note: 1 ROIC measured as Adj EBITA over average NOC, excluding KLITE intangible Fixed Assets
• Gain full control of supply chain
• Increase sales growth: Signify brands and private labels
• Dilute indirect costs
• Consolidate supplier margin
• Optimize cash
COGS synergies In-sourcing NMC optimization Private Label Wins
Finished
• Leverage components supply base
• Productivity savings
• KLITE current portfolio insourced
• Leverage Signify R&D for cost savings
• New wins in US and Europe. Revenue from 2021
Activities In progress
• Enhance productivity savings
• Concept savings from product redesigns
• Portfolio expansion and capacity increase
• Indirect cost savings due to scale
• Signify leverage across specialist functions (e.g., supply chain)
• On-going bids for new business
Planned for
execution
• Manufacturing efficiency improvement
• Expand capacity
• Begin insourcing for Cooper and Connected
• New business model (e.g., utility rebate handling)
Synergy realized by year end 2020 2020 target synergy realization initial business case
18% 15% 16% 32%
• 3x increase in insourcing to KLITE planned by 2023
• Increase contribution of KLITE to Division Adj. EBITA throughout 2023
• Working capital improvement with KLITE insourcing
Past Market Past Signify Future Market Future Signify

78
Strengthened financial profile driven by growth, innovation and KLITE integration
Sales (EUR b)
Adj. EBITA%
Free Cashflow(EUR m)
Figures Comments (Forward Looking)
• Growth driven by consumer connected and LED Luminaires
• Growth for LED Lamps driven by multi-brand and private label via KLITE
• Growth for LED Electronics to come from professional connected, increasing market share in China - driven by innovation to grow
• Pricing management and BOM cost savings
• Indirect cost savings driven by process simplification and cost leverage
• Margin consolidation with KLITE insourcing increase
• FCF growth driven with EBITA improvement
• Working capital reduction contributed by inventory optimization and KLITE synergies
Past Market Past Signify Future Market Future Signify
2.1
2023E2016 2019 2020E
2.4
6%
2023E2016 2019 2020E
11%
150240
2020E20192016 2023E
*Sizes shown for 2020E and 2023E are illustrative

79
Digital Products: Key Takeaways
• Division Digital Products transformed successfully to a market and innovation leader in:
• Consumer connected
• LED luminaires & lamps
• LED components
• Digital Products’ strategy is focused on:
• Capturing growth from the transition to integrated luminaires, driven by sustainability-led socket base conversion
• IOT-technology for consumer connected lighting
• We will strengthen our financial profile driven by growth, innovation and KLITE integration

Harshavardhan Chitale, Division Leader Digital Solutions
9 December 2020
Capital Markets DayDivision Digital Solutions
Guangzhou, ChinaSignify illuminates Guangzhou’s central business district along the Pearl River area

82
Digital Solutions develops and sells luminaires, systems and services to all professional segments through multiple channels
Products
Segments
Channels
Office & Industry Retail & Hospitality Public
Direct end user salesTrade System integrators
Systems ServicesLuminaires
Agri
Past Market Past Signify Future Market Future Signify
83
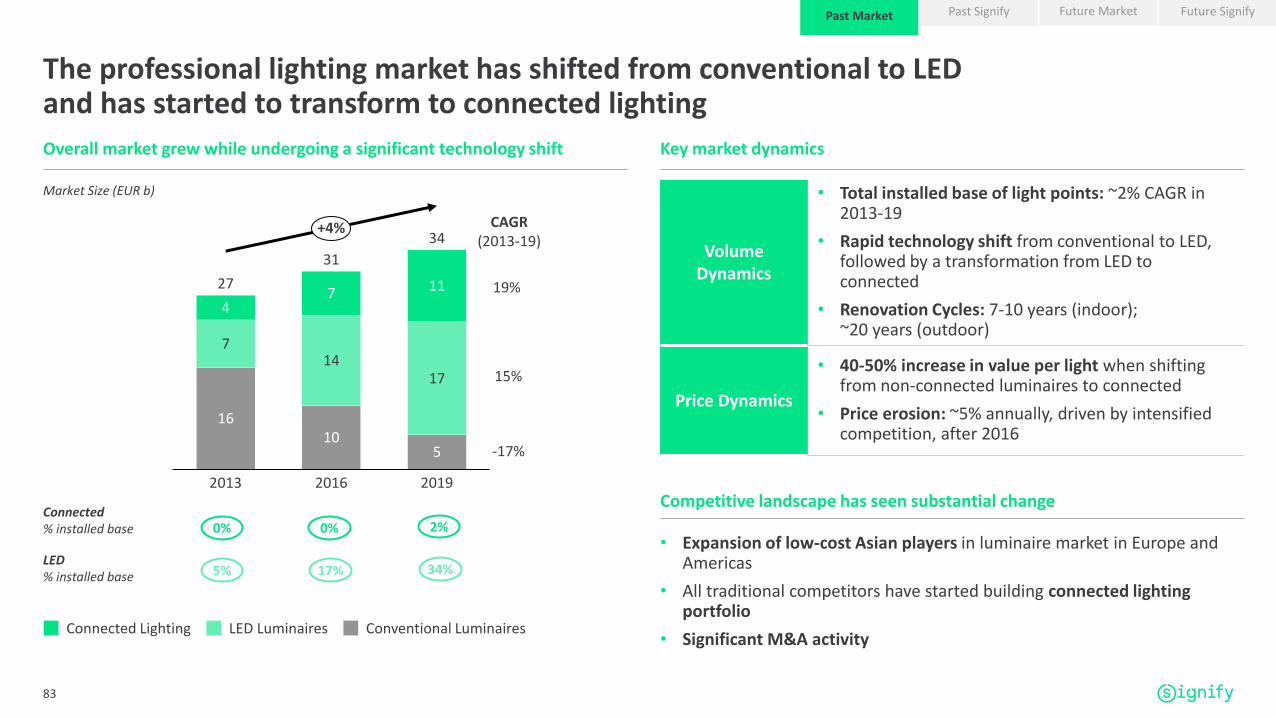
The professional lighting market has shifted from conventional to LEDand has started to transform to connected lighting
19%
15%
-17%
CAGR (2013-19)
Competitive landscape has seen substantial change
Key market dynamics
• Expansion of low-cost Asian players in luminaire market in Europe and Americas
• All traditional competitors have started building connected lighting portfolio
• Significant M&A activity
Volume Dynamics
• Total installed base of light points: ~2% CAGR in 2013-19
• Rapid technology shift from conventional to LED, followed by a transformation from LED to connected
• Renovation Cycles: 7-10 years (indoor); ~20 years (outdoor)
Price Dynamics
• 40-50% increase in value per light when shifting from non-connected luminaires to connected
• Price erosion: ~5% annually, driven by intensified competition, after 2016
Overall market grew while undergoing a significant technology shift
2%0%0%Connected% installed base
34%17%5%LED% installed base
1610
5
714
17
47 11
2013 2016 2019
27
31
34+4%
LED LuminairesConnected Lighting Conventional Luminaires
Market Size (EUR b)
Past Market Past Signify Future Market Future Signify

84
Successful business transformation driven by innovationInvestments done ahead of curve to build foundations to win in the future
Successfully transformed our business towards LED Improved customer satisfaction and operations
Strengthened our business through acquisitions
Customer NPS scoreManufacturing sites
(incl. pro-forma Cooper)
Strong improvement in Adj. EBITA
% of sales
Adj. EBITA (%)
Adj. EBITA (EUR m)
61%29%
39%
53%68%
19% 24%
8%
20162013 2019
100%
Conventional LuminairesConnected Lighting LED Luminaires
29 52 45 33
Changes shown for period 2016-2020 (YTD)
10.0%
5.0%
8.3%9.5%
136
229 251 265
20182016 2017 2019
Past Market Past Signify Future Market Future Signify
Reach and market share
Specialty applications
Technology building blocks

85
Built an unmatched global scale while maintaining strong local presence
Digital Solutions is the largest professional lighting player globally Strategic choices enable global and last-mile benefits for Digital Solutions
Uniquely balanced and diversified presence
• Global presence allows serving our global customers wherever they are
• Unmatched scale in sourcing enabling 2-3% cost advantage
• Optimized manufacturing footprint, with high-volume plants in lower-wage countries and smaller local workshops for effective customization
• R&D spend can be leveraged over larger scale, helping in high innovation spend areas such as connected lighting and specialized applications
• Differentiated and cost-effective products leveraging platformization
52%29%
19%
60%
40%
Sales by region Sales by type
Americas
Europe
Asia
Direct end users
Indirect
• Directly selling to ~9,600 end users
• ~120 direct end user salespeople in systems organization
• Working with ~420 system integrators globally
• Strong relations with distributors, selling through ~13,000 branches
Competitive advantages
Local Infrastructure
Customization, distribution and comprehensive customer coverage in 145 countries
EUR 124m
R&D
EUR 3.5b
Signify procurement
90% of products
Standard components and modules
33 sites
Regional manufacturing & last mile assembly
Revenues
Past Market Past Signify Future Market Future Signify
Digital Solutions
Competitor-1 Competitor-2 Competitor-3 Competitor-4 Competitor-5

86
Market growth is supported by key megatrends
Sustainability focus
• Climate change:
• Connected LED lighting reduces energy consumption by up to 80%
• Costs of solar panels and batteries reducing, making solar lighting viable for off grid and hybrid applications
• Food Availability: Population growth and resource scarcity driving growth in Agricultural lighting
• Circular economy driving growth of 3D printed and serviceable luminaires
• Health and wellbeing leading to adoption of disinfection lighting (UV-C) solutions
Governmental recovery programs
• Substantial global recovery programs with sustainability measures in mind (e.g., EU Green Deal, other national recovery programs)
Ubiquitous connectivity
• Continued shift towards connected lighting
Prof lighting market expected to grow driven by connected and specialty
Growth driven by specialty applications
19%
15%
12%
CAGR (2020-23)
12%
7%
-16%
CAGR (2020E-23E)
2%0%Connected% installed base
34%17%LED% installed base
10 5
14 17 16 20
7 1110
14
2023E
36
2016 2019
4
2020E
2
303134
+3% +7%
Connected Lighting LED Luminaires Conventional Luminaires
6%3%
53%39%
1.11.2
0.9
0.5
2020E 2023E
1.7
1.72.8
4.3+15%
Agricultural Lighting Solar Lighting Disinfection Lighting (UV-C)
General Lighting –DivisionDigital
Solutions
Growth Platforms
* Excludes conventional
Market Size (EUR b)
Market Size (EUR b)
Past Market Past Signify Future Market Future Signify
Market is expected to show healthy growth driven by connected technology and sustainability

87
Strategy: Growth driven by technology-led growth platformsDivision Digital Solutions
Systems & ServicesLight Sources Luminaires Electronics
Growth Platforms
Develop multi-tiered luminaire offering for Over-The-Counter and Specification products
B-Brands OTC Brands Spec Brands
3D printing: Provide unique, customizable, circular products to our customers
Agri-lighting: Increase growth with new offers; increase yields, animal welfare
Solar: Boost sales by expanding offers for both off-grid and on-grid customers (hybrid offers)
Professional connected lighting: Outgrow market through broad portfolio and end-to-end offers
UV-C: Capture growing opportunity; address health and safety concerns especially, pandemic-related
Past Market Past Signify Future Market Future Signify
2. Deliver differentiated lighting offers
3. Drive growth for sustainabilityFood Availability
Circular Economy
Health & Wellbeing
Safety & Security
Climate Action
Connectivity

88
Growth platform 1: Innovation Leadership in Connected LightingSignify is a global leader in high-growth connected lighting
Market size
Market growth drivers
Signify offering Competitive strengths
• Specialized teams (sales, solution design and project delivery) across the world
• End-to-end offering: From sensor to data-enabled services
• Partnerships with key smart building and smart city players
• IoT platform optimized for subsegments
• Data enabled services that deliver value beyond illumination
• Only 3% of global installed base of luminaires has been connected
• Accelerating digitalization of the world driving adoption of connected
• Data-based services offer additional value to customers
Architecture of a connected lighting system
Suite of software adapted for different subsegments
Lighting management softwareScene management, energy optimization, …
Luminaire electronicsDrivers, controllers
Sensors & switchesPeople counting, presence, daylight, environment, temperate,
manual switches, …
Connectivity & gatewaysWireless, cellular, ethernet, …
Data enabled servicesSpace optimization, asset tracking, …
Customer benefits and proof points
• EUR 100,000 per year energy cost savings
• 40% reduction in space per employee;
• EUR 1,800 per employee per year saved
• Improved employee satisfaction
• 15% increase in traffic to promotional areas
• 6% increase in sales
13.6
2023E2020E
9.6
+12%
EUR b
Past Market Past Signify Future Market Future Signify
89
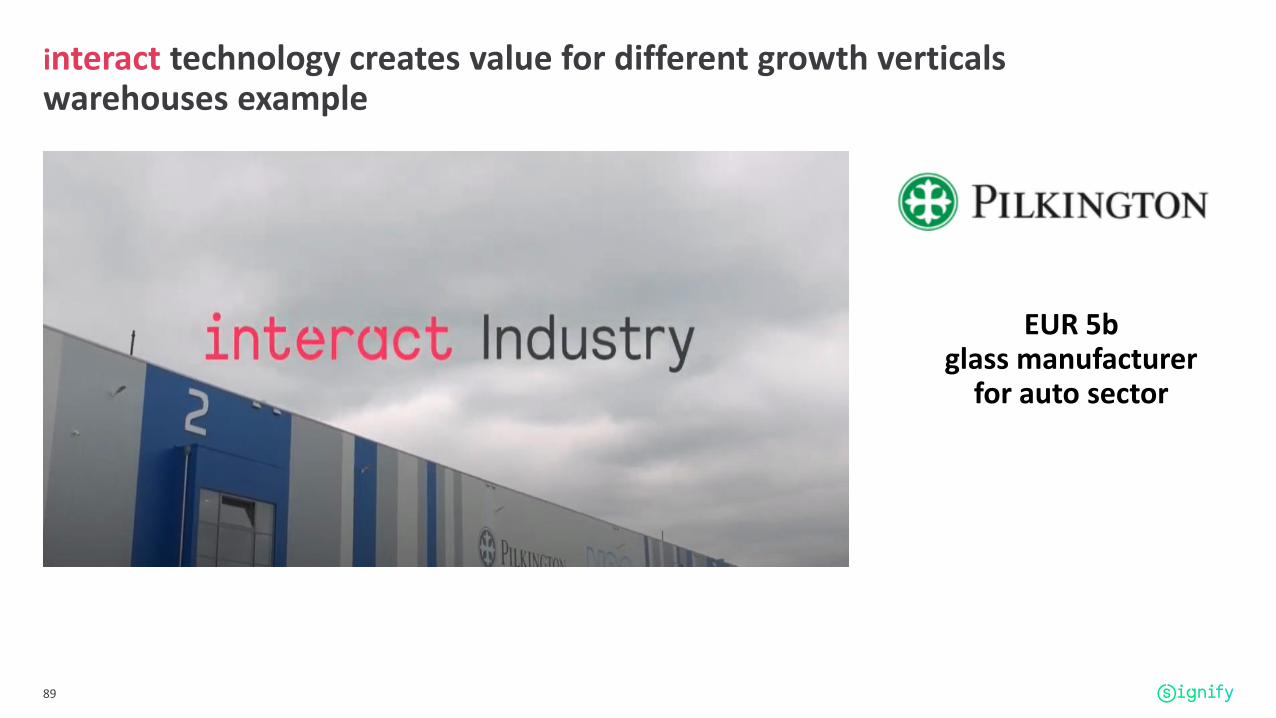
interact technology creates value for different growth verticals warehouses example
EUR 5b glass manufacturer
for auto sector

90
interact technology creates value for different growth verticals street lighting example
United States’ largest public power utility

91
Growth platform 2: Distinctive advantages in agricultural lighting Signify is a global leader with a long heritage, unmatched know-how and unique IP position in light recipes
Market size
Customer benefits and proof points
• Sustainability: Food security
• Increased customer preference for biological food grown closer to home
• Increased focus on resource efficiency
• Increased focus on animal welfare
Market growth drivers
Select applications Competitive strengths
• Unmatched know-how from decades-long experience combined with unique light recipes optimized for specific plants and animals
• AI for yield prediction
• Partnerships with agricultural ecosystem: greenhouse builders, universities and seed and feed providers
• Complete offering: Conventional + LED fixtures, connected system, light recipes and plant specialist advice
• Vertical farm design capabilities
• Boosted salmon growth by 10%
• Improved feed efficiency by 10%
Vertical Farming
Horticultural
Animal barns and
Aquaculture
2020E 2023E
1.2
1.7+12%
EUR b
* Excludes conventional light sources
Past Market Past Signify Future Market Future Signify
• Better yield of pesticide-free baby greens year round
• Improved predictability of the fresh producethanks to growth recipes

92
Past Market Past Signify Future Market Future Signify
Horticultural lighting helps growers reduce resource consumption while increasing yield

93
Growth platform 3: Technology and quality leadership in Solar lightingSignify is well-positioned to become the global leader in solar lighting
Market size
Customer benefits and proof points
Market growth drivers
Select applications Competitive strengths
• Customer access to cities as well as development funding agencies
• Integrated luminaire design: including charging, energy storage and fixture with better reliability and life
• Superior and patented charge controller
• Connected systems enabling better maintenance, tracking battery life and performance and improved energy efficiency
• Off-grid areas in developing countries, driven by governmental programs
• Hybrid solutions on the back of focus on energy efficiency in developed markets, promoted by governmental programs such as EU’s Green Deal
• Installed >600 luminaires to light a public park that had no lighting before
• Saving the city EUR ~650k capex and EUR ~130k opexannually
• >80,000 solar street lighting luminaires across 16,000 villages in rural India
• Saving EUR ~120m capex and EUR ~450k opex annually while improving the lives of 21m people
Street lighting in off-grid areas
Hybrid solar in developed countries
Consumer solar lighting
2020E
1.1
2023E
1.7+16%
EUR b
Past Market Past Signify Future Market Future Signify

94
Growth platform 4: Disinfection lighting (UV-C) for health & well-beingSignify has already started to build position as global leader in growing disinfection lighting market
Note: 1 Surface and air-disinfection for professional use shown
Market size1
Customer benefits and proof points
Market growth drivers
Select applications Competitive strengths
• Decades long experience in UV-C lighting, proven to be effective against Covid-19 by 3rd party labs
• Ability to offer full disinfection system: UV-C light source, fixture design as well as controls to ensure safe usage
• Connected systems offerings: Automatically disinfect when area is empty, run pre-scheduled routines
• Proven technologies to kill bacteria and viruses
• Importance of hygiene and indoor air quality expected to remain after COVID-19 supporting market growth
• Independent analysis shows Signify’s UV-C lighting inactivates SARS CoV-2
• Virus becomes undetectable in less than 10 seconds
• Improved shopper and employee safetyby installing UV-C upper-air luminaires
• Fast disinfection of objects by using the Bioshift chamber
Surface Disinfection
Used in hotels, public spaces, etc.
Object Disinfection
using tunnels and chambers
Used in hotels, airports, stores warehouses, etc.
Upper-air Disinfection
Used in retail, offices, gyms, etc.
0.5
2023E2020E
0.9+19%
EUR b
Past Market Past Signify Future Market Future Signify

95
We're using our UV-C solutions to improve employee safety at Signify offices
Past Market Past Signify Future Market Future Signify

96
Growth platform 5: 3D printed luminaires for circular economy
Note: 1 Substitution of existing portfolio to 3D printing technology
Potential opportunity size
Customer benefits and proof points
Market growth drivers
Competitive strengths
• First mover advantage, having started 3.5 years ago; already 6 automated 3D manufacturing lines in Europe, North America and Asia
• Extensive technical knowhow on materials, process
• Ability to offer customized shapes and colors at scale in line with their designs, brands
• Shortening of the end-to-end process from design to delivery (days vs months)
• Further carbon footprint reduction by combining with connected system for improved energy efficiency
• Circularity becoming increasingly important to customers
• 3D printing enables up to 75% reduction in carbon footprint due to materials used, transportation and end of life recycling
• Customers value customization options with short lead times
• Reduced time from order to installation
• Improved atmosphere in promotional areas
• Circularity preventing waste
• 47% reduction in carbon footprint
• Exact fit with existing ceiling was impossible with standard luminaires
Select applications
Customized fixtures
to drive attention to promotional areas in
a retail store
Unique retailer-specific range
to enhance brand image
Decorative pendants
with functional and office compliant
specifications
Impression of an automated 3D printing line
€0.8b
€0.6b
2020E
€0.9b
2023E
€1.2b+12%
Substitution1 New
Consumer luminaires
tailor your own luminaire online
Past Market Past Signify Future Market Future Signify

Cooper Lighting: Accelerated integration creating value
Georgia, USACooper Lighting’s systems enhances the fan experience at the 9th largest NCAA stadium

99
Integration of Cooper is ahead of plan Additional $40m of bottom-line synergies identified, bringing total to $100m
Procurement & Insourcing savings
Operational costs SG&A optimization Growth synergies
Finished
• Procurement negotiations
• Driver insourcing
• Accelerated closure of TSLAs with Eaton
• Retained all customer and agent relationships
• Monetizing IP
• Launched UV-C
In progress
• Additional insourcing of components and finished goods
• Concept savings from product redesigns
• Manufacturing cost optimization
• Integration of IT systems
• Combination of HR back office
• Accelerated launch of new connected offerings
• Stronger combined distributor incentive programs
Newly identified
• Indirect material procurement integration
• Logistics cost optimization
• Additional savings through shared service centers
• Leveraging Signify go to market outside North America
30% 7% 15% 17%
Meeting of hearts & minds before driving business results Synergy realization is ahead of plan
Integration strategy is working
• Building a common culture
• Improved career options to employees
• High engagement of Cooper employees
• Maintain separate front office: • Agent networks, brand portfolios,
marketing teams
• Separate brands
Synergy realized by year end 2020 (vs upward revised plan)
2020 target synergy realization initial business case
Strategy Results
• All customers and agents retained
• Synergy realization ahead of plan
• Additional synergies identified
• Capture cost synergies in the back office functions
• Rapidly capture procurement savings
• Leverage core innovation capabilities and IP
• Integrate and optimize all support functions
Past Market Past Signify Future Market Future Signify

100
Strengthened financial profile driven by innovation, growth for sustainability and Cooper integration
Sales
Adj. EBITA (%)
FCF
Figures Comments
EUR b
EUR m
• Better growth profile with reduced weight of conventional luminaire in the business mix
• Connected lighting will be key growth driver
• Growth platforms such as Agri, UV-C and Solar will add substantial topline
• Sales synergies with Cooper Lighting
• Price mix management through multi-tier portfolio; Lower price mix erosion than historical
• Continued procurement savings and manufacturing productivity
• Continued optimization of non-manufacturing cost base
• Enhanced cost synergies from Cooper Lighting acquisition
• Increased FCF through EBITA expansion
• Cash conversion driven through further improved working capital management
2020E2016 2019
2.6
2023E
2.7
2016
10.0%
5.0%
2019 2023E2020E
205
319
2020E20192016 2023E
*Sizes shown for 2020E and 2023E are illustrative
Past Market Past Signify Future Market Future Signify

101
Digital Solutions: Key Takeaways
• Digital Solutions has successfully transformed to emerge as the market leader and innovation leader in professional Iighting
• Digital Solutions’ strategy is built around growth for sustainability in attractive growth platforms such as:
• Connected lighting
• Agriculture lighting
• Solar lighting
• 3D printed luminaires
• Disinfection lighting
• Invested ahead of the curve to gain Innovation Leadership
• Strong financial profile with unmatched global scale and enhanced synergies from Cooper Lighting Integration


103
Closing remarks
• Signify will further strengthen its leadership position targeting attractive growth and profit pools
• The headwinds from the industry transition to LED will abate in the years to come
• Our innovation-led strategy will continue to shape industry standards and the technology leap towards connectivity
• Signify is uniquely positioned to achieve multi-dimensional, technology-led growth
• Sustainability will be at the heart of Signify’s growth opportunities driving long term value creation
• Signify will continue to build a best-in-class financial profile repositioned with building technology players
Connected LED with conventional aesthetics