capital markets research - fami.com.ph · the market call - april 2018 special feature 1 april 2018...
TRANSCRIPT

The Market Call - April 2018
Special Feature
1 April 2018
MARKET CALLThe
Capital Markets Research
FMIC and UA&P Capital Markets Research
Macroeconomy 3 Fixed-Income Securities 9 Equity Markets 15 Recent Economic Indicators 20 Contributors 22

Economic Indicators(% change, latest month, unless otherwise stated)
Previous Month Latest Month Year-to-Date 2016 (year-
end)2017 (year-
end)2018 FMIC
Forecast
GDP Growth (y-o-y, quarterly) 7.2% 6.5% 6.7% 6.9% 6.7% 7-7.5%
Inflation Rate (March) 3.8% 4.3% 3.8% 1.3% 2.9% 4.0-4.3%
Government Spending (January) 34.9% 19.3% 19.3% 4.1% 12.6% 12%
Gross International Reserves ($B) (March) 80.4 80.1 80.1 80.7 81.657 80
PHP/USD rate (January) 51.79 52.07 51.43 47.49 50.40 52.50
10-year T-bond yield (end-March YTD bps change) 6.74% 6% 6.23% 4.15% 4.93% 5.55-5.80%
PSEi (end-March YTD % change) 8,475.29 7,979.83 8.5% 6,840.64 8,558.42 9,400
Sources: Philippine Statistics Authority (PSA), Bangko Sentral ng Pilipinas (BSP), Philippine Stock Exchange (PSE), Philippine Dealing System (PDS), and Authors’ Calculations
Executive Summary
Macroeconomy
Bonds Market
Global equities, including PSEi, plunged into a sea of red in March as uncertainties spun by US Presi-dent Trump’s imposition of tariffs on steel and aluminum, together with conflicts in Middle East and North Asia, lowered investors’ risk appetite.
Equities Market
US Treasury bond yields have treaded downward since hitting a peak on February 21, but this failed to excite local bond investors who pushed up yields in both primary and secondary markets. Investors have focused more on domestic factors like rising inflation and trade deficits.
Robust growth in the Manufacturing and Construction sectors should boost Industrial output in Q1. Along with positive consumer sentiment, sustained by the higher peso equivalent of the remittances, PH is poised to a faster economic expansion in Q1.
• Investors pressured yields upward by 32 to 39 bps for T-bills and 92 to 127 bps for T-bonds.• Demand remained weak as tender-offer ratios (TORs) improved only slightly from a month ago.• Secondary market generally saw yields decline by 35 to 57 bps, except for 3-month, 3-year, and 20-year tenors.• Secondary market trading of corporate bonds slightly improved m-o-m, but YTD the fall worsened to 35% from 22.4% in February.• Only two completed bond issues (SMPH and SMC) took place in March, as issuers waited for clearer yield directions.• ROPs yields tracked the fall in long-dated US Treasuries, but at a slower pace, resulting in higher spreads of 8 to 10 bps. Outlook: With US Treasuries appearing to be range-bound, investors are more focused on domestic drivers of interest rates. The primary concern is rising inflation, which may peak only by July at above-4.5%, the National Government’s need to fund its Build Build Build program and the perception that the BSP is behind the curve in raising its policy rate. Nonetheless, we don’t see much upside for yields till the next report as investors have priced these into the climbing yields.
• Threats of a looming trade war, continued emergence of protectionist rhetoric, and controversies surrounding tech companies led inves-tors to shy away from risky assets.
• DJIA’s loss of 3.7% in March ignited a global sell-off with most markets ending with 2-3% declines.• Lacking good news, PSEi followed suit with drop of 5.8% in March to end below the critical 8,000 level.• All sectors slumped with Mining and Oil (-11.2%) losing most while Industrial (-0.1%) counter fell the least.• While most index stocks were in the red, First Gen Corporation ended as the best performer with a 17.2% share price gain. • Foreign funds outflow from the local bourse accelerated in March, with net selling soaring by 26.2% to P19.3 B. Outlook: As the E/P less 10-year bond yield measure remained just below 1.5 standard deviations from the 10-year spread average, and earnings appearing unscathed, it is more likely that bond yields have risen too fast. However, without much pos-itive news in the short-run (except a transitory boost from Q1 GDP growth announcement by early May), the PSEi may trade sideways along its present 7,500-7,800 range. Besides, a quick recovery may be weighed down by negative economic and po-litical factors (both domestic and external). Bargain hunting should, thus, be selective and tempered by longer holding periods.
• Manufacturing surged by 24.8% in February (a 7-year high) from the revised 18.5% rise in January.• NG spending soared by 15.5% but gains in revenues rose faster resulting in a P10.2 B surplus in January, while Infrastructure spending
increased by 25.2% to P43.3 B.• Capital Goods imports surged by 16.9% in January due to broad-based gains in its sub-categories. • Seasonal factors “slowed” remittances of OFWs to a 5.3% clip to reach $2.7 B in January.• Inflation in March breached the 4% upper target of the BSP, largely driven by the upticks in food, tobacco, and beverages. • Domestic liquidity expanded by 13.5%, faster than the 12.8% recorded in February. • The peso remained weak amidst wider trade deficit and underpinned by strong US economy.Outlook: The remarkable job creation reported in January, NG’s commitment to continue spending on various Build Build Build projects, strong capital goods imports and other economic indicators pointing to a healthy growth, reinforce our view that PH will register a faster expansion in 2018.
Even as the Philippine economy revs up to race faster, bond yields appear to have galloped uncontrollaby as earn-ings yields (E/P) to 10-year bond yield spreads suggest and US Treasuries have tracked a downward trend since its peak in mid-February. The PH economy appears to have had roaring 2018 start as capital goods imports rose by 16.9%, while National Government spending (exclusive of interest payments) to boost Infrastructure expenditures climbed by 25.2% in January, and Manufacturing output surged by 24.8%, the fastest in seven years.

The Market Call - April 2018
3
Macroeconomy
SOARING TO THE TOP OF THE WORLD, MANUFACTURING GAINS BY 24.8% IN FEBRUARY
The Manufacturing and Construction sectors should power the Industrial sector in its drive to lead faster Gross Domestic Product (GDP) growth in Q1. Manufacturing output surged by 24.8% year-on-year (y-o-y) in February on top of an 18.5% jump in January. Public construction likely got a similar boost, with national government (NG) spending (excluding interest payments) soaring by 18.9% in January. Capital goods imports also scooted up by 16.9% in January. While inflation expectedly climbed faster to 4.3% in March, it won’t likely pose a problem for robust consumer spending.
Outlook: Expansion in Industrial output, led by Manufacturing and Construction, should lead the economy to an above-7% growth in Q1. NG spending keeps elevated, while Overseas Filipino Workers’ (OFW) remittances robustly coast along. With inflation exceeding the Bangko Sentral ng Pilipinas (BSP) target of 4% in March and likely to stay for the next couple of months. These, together with rebounding money growth and a second Fed rate hike in June, will force the hand of BSP to raise policy rates by 25 basis points (bps) to 3.25% in Q2. However, that will have little impact on growth. The peso should linger in the pressure cooker as trade deficits bloat, while the US economy sustains its upward thrust.
Manufacturing Further Expands in February The country’s manufacturing output (measured by Volume of Production Index or VoPI) further climbed by 24.8% in February from the revised 18.5% expansion registered in January. The remarkable growth, which was earlier indicated by the large increase in industrial employment, came from the hefty gains in 16 out of 23 industry sub groupings with 11 posting double-digit growth. This included Printing (+108.1%), Food manufacturing (+32.6%), Electrical Machinery (+30.3%), Beverages (+24.1%), and Petroleum products (+23.4%), among others.
We will continue to track changes in employment and other leading indicators to help discuss the expansion path of the manufacturing sector, but we still think that the industrial output would rise in double-digit fashion in 2018.
NG Spending Soar by 15.5% in January, but Still Records a P10.2 B SurplusNational Government (NG) expenditures have kept its double-digit growth pace with a spritely 15.5% y-o-y growth in January, part of which is the 25.2% growth in Infrastructure spending to P43.3 B. Despite this, NG had a strong start in 2018 by posting a P10.2 B budget surplus in January, a huge reversal from a deficit of P107.1 B in December, and almost 5x bigger than the surplus a year ago. Strong gains in revenue collections, attributed by Department of Finance officials to the implementation of
the TRAIN, outpaced NG disbursements, resulting in the fiscal surplus. Higher tax hauls by both Bureau of Customs (BoC) and Bureau of Internal Revenue (BIR) resulted in a 19.3% y-o-y increase in total tax revenues.
The BIR raked in a total of P175.6 B, 19% higher than in the same month last year as TRAIN-1’s higher petroleum taxes, new sugar-based beverage tax and other indirect taxes took effect on January 1st of 2018. BoC collections also increased by 13.6% (to P40.8 B), due to higher imports, especially on capital goods and raw materials, as well as the peso depreciation.
-20%
-10%
0%
10%
20%
30%
40%
50%
Jan
-14
Ma
r-1
4
Ma
y-1
4
Jul-
14
Se
p-1
4
No
v-1
4
Jan
-15
Ma
r-1
5
Ma
y-1
5
Jul-
15
Se
p-1
5
No
v-1
5
Jan
-16
Ma
r-1
6
Ma
y-1
6
Jul-
16
Se
p-1
6
No
v-1
6
Jan
-17
Ma
r-1
7
Ma
y-1
7
Jul-
17
Se
p-1
7
No
v-1
7
Jan
-18
Figure 1 - NG Expenditures Growth Rate, Year-on-Year
Source of Basic Data: Bangko Sentral ng Pilipinas (BSP)

The Market Call - April 2018
4
Macroeconomy
the other categories pulled total imports to grow by 11.4% to $8.5 B while exports inched up slightly by 0.5%. Thus, trade deficit remained high at $3.2 B, albeit down from $3.8 B in December 2017.
We maintain our view that the rapid expansion in the imports of capital goods will continue, anchored on strong public and private investment.
FDI Soars by 56.7% to $0.9 B in January 2018 Buoyed by the still-positive outlook on the country’s economy, PH yielded a net inflow of $919 M in foreign direct investments in January 2018, soaring by 56.7% from the year ago levels. Notable gains in net equity capital, comprising a large portion of foreign investments, propelled FDI gains in the first month of 2018 amounting to $473 M, more than 8x higher than the $58 M in the same period last year. Equity capital placements largely came from Singapore, China, Taiwan, Japan, and the US, and infused mostly into Manufacturing; Financial and Insurance; Real Estate; Electricity, Gas, Steam and Air-conditioning Supply; and Wholesale and Retail Trade Activities. Reinvestments in earnings, meanwhile, declined by 8.4% to $65 M.
Price Acceleration Faster in MarchOverall price changes moved at a faster pace to 4.3% in March from the revised 3.8% in the preceding month, largely driven by the increments recorded in big ticket items (i.e., food, beverage, and tobacco). This brought the YTD rate at 3.8%, near the upper end of BSP’s target.
Raw Materials & Intermediate Goods imports, as usual, captured the largest share of total imports at 39.6%, and rose by 15% driven by hefty gains in Manufactured Goods and Semi-Processed Raw Materials. Large imports of non-durable goods (i.e., dairy products, beverage, tobacco, among others), likewise, boosted Consumer Goods imports (+8.1%).
Meanwhile, lower demand for crude oil dampened the imports of Mineral Fuels, Lubricant and Related Materials, causing it to fall by 8.6%. Nonetheless, hefty increases in
Figure 2 - Imports of Capital Goods (in Million USD)
Source of Basic Data: Philippine Statistics Authority (PSA)
-40%
-20%
0%
20%
40%
60%
80%
100%
120%
140%
0
500
1,000
1,500
2,000
2,500
3,000
3,500
Jan
-15
Mar
-15
May
-15
Jul-
15
Sep
-15
No
v-1
5
Jan
-16
Mar
-16
May
-16
Jul-
16
Sep
-16
No
v-1
6
Jan
-17
Mar
-17
May
-17
Jul-
17
Sep
-17
No
v-1
7
Jan
-18
Capital Goods y-o-y growth
Figure 3 - Inflation Rates Annualized, Year-on-Year
Source of Basic Data: Philippine Statistics Authority (PSA) Note: base year used is 2012
(1.0)
-
1.0
2.0
3.0
4.0
5.0
Jan-
13M
ar-1
3M
ay-1
3Ju
l-13
Sep-
13N
ov-1
3Ja
n-14
Mar
-14
May
-14
Jul-1
4Se
p-14
Nov
-14
Jan-
15M
ar-1
5M
ay-1
5Ju
l-15
Sep-
15N
ov-1
5Ja
n-16
Mar
-16
May
-16
Jul-1
6Se
p-16
Nov
-16
Jan-
17M
ar-1
7M
ay-1
7Ju
l-17
Sep-
17N
ov-1
7Ja
n-18
Mar
-18
Overall price changes moved at a faster pace to 4.3% in March from the revised 3.8% in the preceding month, largely driven by the increments recorded in big ticket items (i.e., food, beverage, and tobacco).
Meanwhile, the strong expansion in government disbursements resulted in the 8th above-10% gain in nine of the last 10 months. Excluding interest payments, NG spending shot up by 18.9% (y-o-y). The allotment to LGUs accounted for the largest share (at 19%) of total expenditures, as they increased by 6.2% respectively. Netting out interest payments, the NG recorded a P53.7 B primary surplus, up by 20% from the same period last year.
Capital Goods Imports Surge by 16.9% in January Imports of capital goods in January returned to its double-digit expansion pace due to broad-based gains in all categories, except for the imports of Land Transportation Equipment. January data showed a remarkable increase of 16.9%, accounting for 30.5% of total imports. The imports of Power Generating and Specialized Machines and Telecommunication Equipment contributed much in terms of weight and growth, posting gains of 25.2% and 19.7%, respectively.
The Market Call - April 2018
5
Macroeconomy
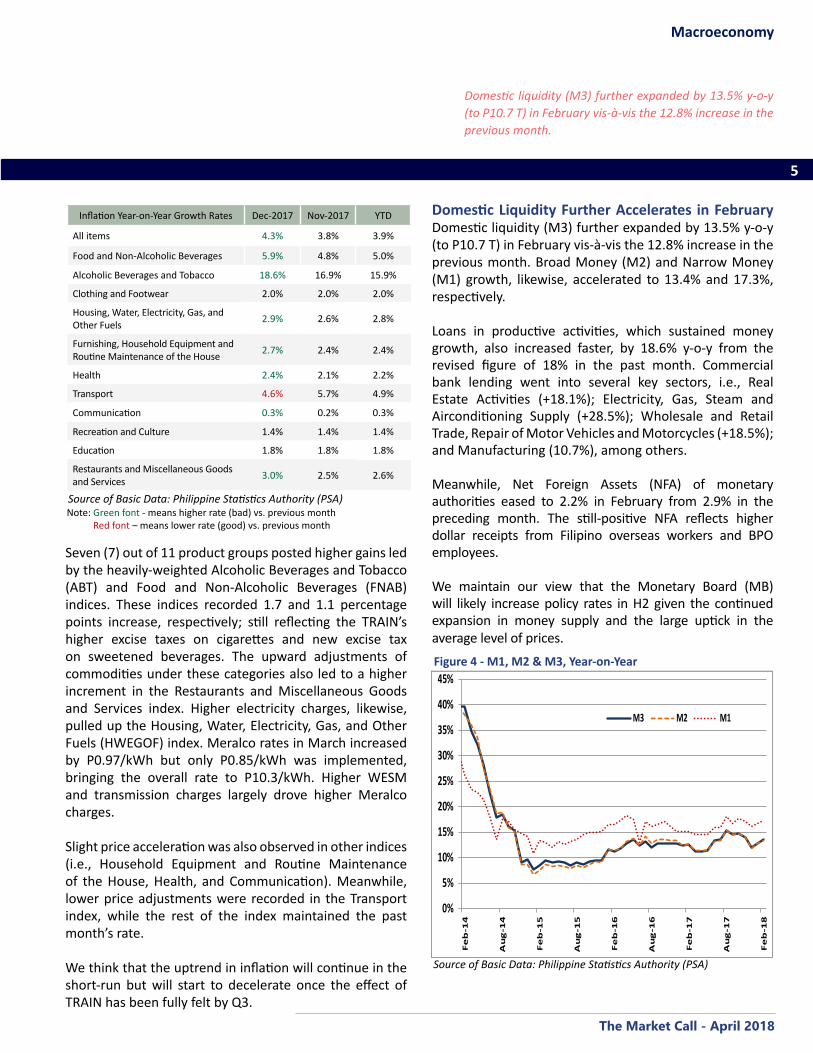
Domestic liquidity (M3) further expanded by 13.5% y-o-y (to P10.7 T) in February vis-à-vis the 12.8% increase in the previous month.
Seven (7) out of 11 product groups posted higher gains led by the heavily-weighted Alcoholic Beverages and Tobacco (ABT) and Food and Non-Alcoholic Beverages (FNAB) indices. These indices recorded 1.7 and 1.1 percentage points increase, respectively; still reflecting the TRAIN’s higher excise taxes on cigarettes and new excise tax on sweetened beverages. The upward adjustments of commodities under these categories also led to a higher increment in the Restaurants and Miscellaneous Goods and Services index. Higher electricity charges, likewise, pulled up the Housing, Water, Electricity, Gas, and Other Fuels (HWEGOF) index. Meralco rates in March increased by P0.97/kWh but only P0.85/kWh was implemented, bringing the overall rate to P10.3/kWh. Higher WESM and transmission charges largely drove higher Meralco charges.
Slight price acceleration was also observed in other indices (i.e., Household Equipment and Routine Maintenance of the House, Health, and Communication). Meanwhile, lower price adjustments were recorded in the Transport index, while the rest of the index maintained the past month’s rate.
We think that the uptrend in inflation will continue in the short-run but will start to decelerate once the effect of TRAIN has been fully felt by Q3.
Inflation Year-on-Year Growth Rates Dec-2017 Nov-2017 YTD
All items 4.3% 3.8% 3.9%
Food and Non-Alcoholic Beverages 5.9% 4.8% 5.0%
Alcoholic Beverages and Tobacco 18.6% 16.9% 15.9%
Clothing and Footwear 2.0% 2.0% 2.0%
Housing, Water, Electricity, Gas, and Other Fuels 2.9% 2.6% 2.8%
Furnishing, Household Equipment and Routine Maintenance of the House 2.7% 2.4% 2.4%
Health 2.4% 2.1% 2.2%
Transport 4.6% 5.7% 4.9%
Communication 0.3% 0.2% 0.3%
Recreation and Culture 1.4% 1.4% 1.4%
Education 1.8% 1.8% 1.8%
Restaurants and Miscellaneous Goods and Services 3.0% 2.5% 2.6%
Source of Basic Data: Philippine Statistics Authority (PSA)Note: Green font - means higher rate (bad) vs. previous month Red font – means lower rate (good) vs. previous month
Figure 4 - M1, M2 & M3, Year-on-Year
Source of Basic Data: Philippine Statistics Authority (PSA)
0%
5%
10%
15%
20%
25%
30%
35%
40%
45%
Fe
b-1
4
Au
g-1
4
Fe
b-1
5
Au
g-1
5
Fe
b-1
6
Au
g-1
6
Fe
b-1
7
Au
g-1
7
Fe
b-1
8
M3 M2 M1
Domestic Liquidity Further Accelerates in February Domestic liquidity (M3) further expanded by 13.5% y-o-y (to P10.7 T) in February vis-à-vis the 12.8% increase in the previous month. Broad Money (M2) and Narrow Money (M1) growth, likewise, accelerated to 13.4% and 17.3%, respectively.
Loans in productive activities, which sustained money growth, also increased faster, by 18.6% y-o-y from the revised figure of 18% in the past month. Commercial bank lending went into several key sectors, i.e., Real Estate Activities (+18.1%); Electricity, Gas, Steam and Airconditioning Supply (+28.5%); Wholesale and Retail Trade, Repair of Motor Vehicles and Motorcycles (+18.5%); and Manufacturing (10.7%), among others.
Meanwhile, Net Foreign Assets (NFA) of monetary authorities eased to 2.2% in February from 2.9% in the preceding month. The still-positive NFA reflects higher dollar receipts from Filipino overseas workers and BPO employees.
We maintain our view that the Monetary Board (MB)will likely increase policy rates in H2 given the continued expansion in money supply and the large uptick in the average level of prices.

The Market Call - April 2018
6
Macroeconomy
PH exports totaled to $5.4 B in January, recording a 3.5% increase, faster than the 2.3% (revised) posted in December 2017.
Electronic products remained the country’s top performing export, with earnings at $2.6 B, accounting for a 50.3% share of the total exports revenue. It continued to expand by 10.8% y-o-y from its previous value of $2.4 B. Semiconductors, which had the biggest share among electronic products at 36.4%, also posted an increase of 16.9% to $1.9 B. Machinery and Transport Equipment followed in 2nd place with export revenue amounting to $419 M. Exports of this product registered a hefty gain of 23.6% from the $339M recorded in January 2017.
Outward shipments of Gold and Metal components (now included in the top five export commodities, ranked 4th and 5th) likewise showed a remarkable growth of 359% and 18.9%, respectively. Other Manufactured Goods took the 3rd spot, with $374.8 M or 7.2% share of the total export shipments. Exports of these products, however, dropped by a hefty 21% from January 2017’s value of $474.7 M.
Japan regained its crown as the top export destination, absorbing 17.2% of total shipments (equivalent to $895 M) and posting a slight increase of 0.7% from $888.9 M recorded a year ago. Hong Kong, now in the third spot, further jumped by 37.1% to $726.2 M, good for a share of 13.9%. Shipments to China valued at $591 M, likewise, grew by 17.7%. It ranked fourth comprising 11.2% of the total. Meanwhile, exports to the US and Singapore in 2nd and 5th place, declined by 12.2% and 2%, respectively.
Figure 5 - OFW Remittances Growth
Source of Basic Data: Philippine Statistics Authority (PSA)
-10%
-5%
0%
5%
10%
15%
20%
25%
30%
Jan
-14
Jul-
14
Jan
-15
Jul-
15
Jan
-16
Jul-
16
Jan
-17
Jul-
17
Jan
-18
US$ PhP
Figure 6 - Exports Growth Rates, Year-on-Year
Source of Basic Data: Philippine Statistics Authority (PSA)
-25%
-15%
-5%
5%
15%
25%
35%
45%
Jan
-16
Jul-
16
Jan
-17
Jul-
17
Jan
-18
Remittances Retain Robust Growth in JanuaryRemittances from Filipino overseas workers continued to pour in January, albeit slower than the December figure, largely due to seasonal factors. Personal remittances amounted to $2.7 B, representing a 10.8% y-o-y expansion, boosted by the 15.3% increase in the transfers by workers with less than a year contract.
Similarly, cash remittances (i.e., coursed through banks), grew by 9.7% to $2.4 B mostly coming from the US, United Arab Emirates (UAE), Saudi Arabia, Singapore, United Kingdom, Japan, Qatar, Canada, Kuwait, and Germany, which collectively accounted for 80% of total remittances.
The peso equivalent of these inflows also registered a 12.5% gain, sustained by the 1.6% y-o-y peso depreciation. We believe that the seasonality effect will continue to creep in and personal remittances will continue to expand at a decelerating rate at least in Q1.
Exports Weaken in January But Still Show Slight Gain PH exports totaled to $5.4 B in January, recording a 3.5% increase, faster than the 2.3% (revised) posted in December 2017. The gains in six out of 10 commodities, led by the superb growth in the exports of cathodes, buoyed exports performance.

The Market Call - April 2018
7
Macroeconomy
The PH peso further weakened following the Fed’s decision to increase rate by a quarter percentage point to 1.75%.
Apart from the peso, other emerging currencies also succumbed to losses against the greenback. Indonesia’s rupiah (IDR) still edged downward to its weakest position since January 2016. Wide current account deficit added pressure to the weak rupiah, and likewise to the Indian rupee (INR). The Chinese yuan (CNY) also shed gains following the Fed’s rate-hike.
On the other hand, rising oil prices buoyed Malaysia (MYR) and Singapore’s (SGD) currencies. The possible rate hike in Malaysia and its improving economic landscape supported gains in the ringgit as well. Thailand baht (THB) still drew strength from the country’s large capital inflows. The actual USD/PHP rate in March remained above both the 30-day and the 200-day moving averages (MAs), suggesting that the depreciation bias will linger in the near and long term. The economic improvement in the US, coupled with the US rate hike, as well as PH’s strong imports are expected to largely put pressure on the peso.
Figure 7 - Daily Dollar-Peso Exchange Rate
Source of Basic Data: Philippine Statistics Authority (PSA)
49.5
50.0
50.5
51.0
51.5
52.0
52.5
Jan
-18
Jan
-18
Jan
-18
Jan
-18
Jan
-18
Fe
b-1
8
Fe
b-1
8
Fe
b-1
8
Fe
b-1
8
Ma
r-1
8
Ma
r-1
8
Ma
r-1
8
Peso/Dollar Exchange RateMarch AverageFebruary AverageJanuary Average
Exchange Rates vs USD for Selected Asian CountriesFeb-18 Mar-18 YTD
AUD 0.9% 1.5% -1.7%
CNY -1.8% 0.1% -4.2%
INR 1.2% 1.0% 1.2%
IDR 1.5% 1.3% 1.5%
KRW 1.2% -0.6% -1.1%
MYR -1.2% -0.1% -4.3%
PHP 2.5% 0.5% 3.3%
SGD -0.2% -0.3% -2.3%
THB -1.4% -0.6% -4.2%
Note: Positive changes mean depreciation and negative changes mean appreci-ation against the greenback
Source of Basic Data: Bangko Sentral ng Pilipinas (BSP)
Half of the total exports in January headed towards East Asian (EA) nations, valued at $2.6 B. Outward sales to the region climbed by 11.1% y-o-y tracking higher demand from China and Japan. Exports to the ASEAN also went up by 1.2%. Meanwhile, shipments to the EU, accounting for 15.4% of shipments, declined by 11.5% to $801.7 M. ASEAN+East Asia ex-Japan accounted for 47.7% of total exports.
We believe that stronger-than-expected global recovery (especially in China and Japan) will continue to boost export demand for PH products to bring 2018 PH exports to a faster growth pace.
Peso Depreciation EasesLatest positive economic indicators in the US (i.e., strong household consumption, low jobless claims) shored up investors’ confidence towards the US economy which continued to put pressure on the peso. The PH peso further weakened following the Fed’s decision to increase rate by a quarter percentage point to 1.75%. The Fed also signaled gradual rate increase ahead. Thus, the peso averaged at P52.07/$ in March, representing a 0.5% depreciation from last month. This marked the 4th consecutive month of peso depreciation. The pair hovered between a high of P52.34 and a low of P51.86, further reducing the volatility measure to 0.11 from 0.33 in February.
The Market Call - April 2018
8
Macroeconomy
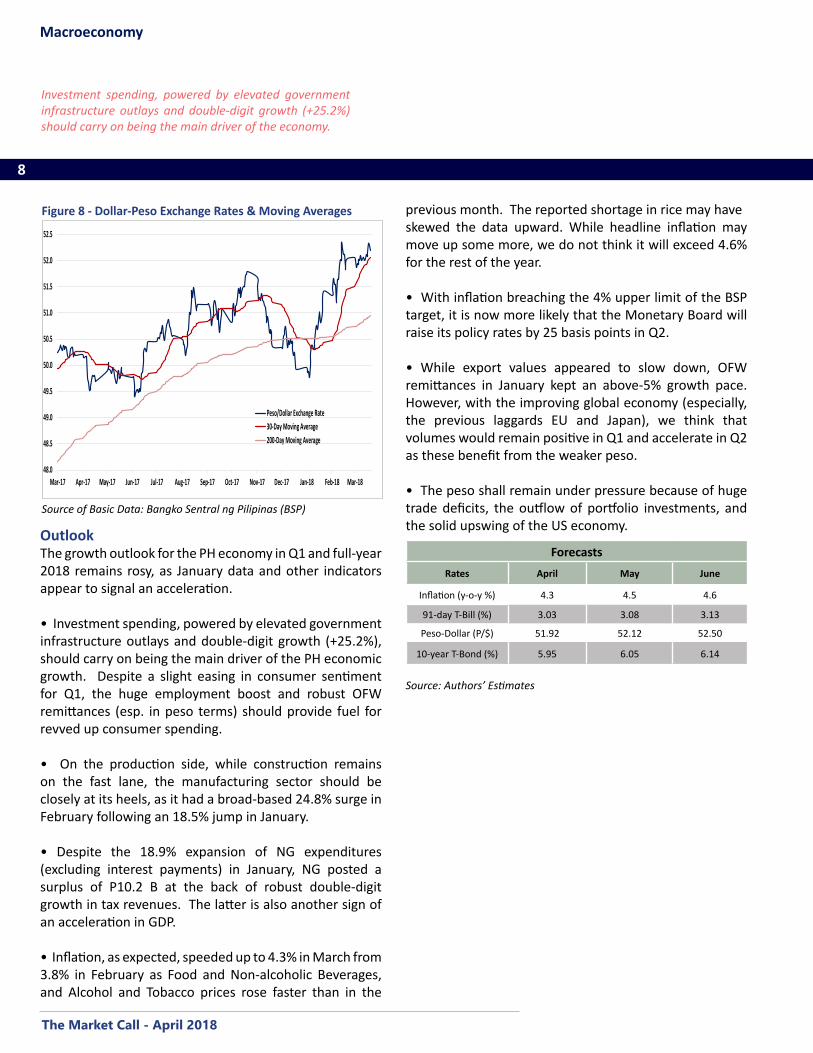
Investment spending, powered by elevated government infrastructure outlays and double-digit growth (+25.2%) should carry on being the main driver of the economy.
OutlookThe growth outlook for the PH economy in Q1 and full-year 2018 remains rosy, as January data and other indicators appear to signal an acceleration.
• Investment spending, powered by elevated government infrastructure outlays and double-digit growth (+25.2%), should carry on being the main driver of the PH economic growth. Despite a slight easing in consumer sentiment for Q1, the huge employment boost and robust OFW remittances (esp. in peso terms) should provide fuel for revved up consumer spending.
• On the production side, while construction remains on the fast lane, the manufacturing sector should be closely at its heels, as it had a broad-based 24.8% surge in February following an 18.5% jump in January.
• Despite the 18.9% expansion of NG expenditures (excluding interest payments) in January, NG posted a surplus of P10.2 B at the back of robust double-digit growth in tax revenues. The latter is also another sign of an acceleration in GDP.
• Inflation, as expected, speeded up to 4.3% in March from 3.8% in February as Food and Non-alcoholic Beverages, and Alcohol and Tobacco prices rose faster than in the
ForecastsRates April May June
Inflation (y-o-y %) 4.3 4.5 4.6
91-day T-Bill (%) 3.03 3.08 3.13
Peso-Dollar (P/$) 51.92 52.12 52.50
10-year T-Bond (%) 5.95 6.05 6.14
Source: Authors’ Estimates
previous month. The reported shortage in rice may haveskewed the data upward. While headline inflation may move up some more, we do not think it will exceed 4.6% for the rest of the year.
• With inflation breaching the 4% upper limit of the BSP target, it is now more likely that the Monetary Board will raise its policy rates by 25 basis points in Q2.
• While export values appeared to slow down, OFW remittances in January kept an above-5% growth pace. However, with the improving global economy (especially, the previous laggards EU and Japan), we think that volumes would remain positive in Q1 and accelerate in Q2 as these benefit from the weaker peso.
• The peso shall remain under pressure because of huge trade deficits, the outflow of portfolio investments, and the solid upswing of the US economy.
Figure 8 - Dollar-Peso Exchange Rates & Moving Averages
Source of Basic Data: Bangko Sentral ng Pilipinas (BSP)
48.0
48.5
49.0
49.5
50.0
50.5
51.0
51.5
52.0
52.5
Mar-17 Apr-17 May-17 Jun-17 Jul-17 Aug-17 Sep-17 Oct-17 Nov-17 Dec-17 Jan-18 Feb-18 Mar-18
Peso/Dollar Exchange Rate30-Day Moving Average200-Day Moving Average

The Market Call - April 2018
9
Fixed Income Securities
Primary Market: Yields Continue to Rise Despite Slight Uptick in TendersDespite a slight improvement in tenders to P103.1 B in March from P92.9 B a month ago, yields in Treasury bill (T-bill) auctions rose by 32 to 39 basis points (bps) (cumulative for month), while for Treasury bonds (T-bonds) they surged by 92 to 127 bps. Local investors continued to demand higher yields as inflation figures in March exceeded expectations and the balance of trade deficit for January once more went beyond $3 B for the third consecutive month.
91-day T-bill yielded 3% in the last March auction representing a cumulative 32.1 bps increase from February.The 182-day T-bill yields in end-March hit 3.21%, 35.2 bps higher than a month ago. The biggest jump of 39.4 bps took place in the 364-day T-bill space. These gains proved modest compared to the more than threefold rise in bps for T-bonds offered. For the 5-year T-bonds auctioned on March 6, the yield 5.45%, a 92.2 bps vault from its previous auction in November 2017. Even worse, the 10-year T-bonds auctioned on March 20 surged by 126.9 bps to 6.18% (also from November).
Investors showed slightly more risk appetite as the total tender-offer ratio (TOR) climbed to 1.3x from 1.2x in February. Demand for T-bills improved slightly as the TOR
for 91-day T-bills reached 1.8x in March compared to 1.5x in the previous month. For the 182-day T-bills, the TOR hit 1.1x versus 0.8x a month ago, while the 364-day T-bill TOR improved most to 2.3x as against 0.8x. Auctions of longer tenors appeared less attractive as the TOR for 5-year T-bonds tallied only 1.3x while for the 10-year T-bonds totaled 1.1x. These TORs approximated those for shorter and longer tenor T-bonds (7-year and 20-year) offered in February.
Except for the P9 B 91-day T-bills offered by Bureau of the Treasury (BTr) on March 26, BTr only partially accepted the debt papers on offer.
Secondary Market: Still Bearish, but Yields Generally SlippedDespite a 5.1% increase in turnover in the GS secondary market from February 2018, the March figure fell by 48.3% (y-o-y) compared to March 2017. This comes after a 43.9% (y-o-y) slump in February. Thus, year-to-date (YTD) for March showed a deeper 29.4% decline from YTD February of 18.7%. Investors continued to sell whenever yields slipped even a little.
While the 10-year US Treasury bond yields are on a downward trend since it hit a peak of 2.95% on February 21, 2018, yields of Philippine government securities auctioned in March rose significantly. Local market players got spooked by rising headline inflation to 3.8% and 4.3% in February and March, respectively, from 3.4% at the beginning of the year, and the country’s trade balance came in negative $3.2 B in January, the third consecutive month of above-$3 B deficit, with the record still at $3.8 B (revised) in December. US Treasury bonds (T-bonds) yields at the long end, however, showed a sliding pattern as analysts reversed earlier thinking that there would be a fourth Fed rate hike in 2018 as wage increases there remained subdued. It is also possible that with the US dollar apparently seeing a bottom, bond investors became keener on holding US Treasuries given the more than 200 bps differential between 10-year US T-bonds and both 10-year German Bunds and Japanese T-bonds.
Outlook: 10-year US T-bonds have remained mostly below 2.8% in early April due to much lower-than-ex-pected jobs created, external political tensions arising from North Korea and the Middle East, as well as high-pitched rhetoric on a US-initiated “trade war”. All these should continue to keep bond markets volatile. Domes-tic factors will, however, have larger effects on local GS bond yields. Topping the list would be inflation. Unless the markets get convinced that the new inflation figures are more realistic and are heading back to below 4%, the upward pressure on yields shall remain, albeit milder than in the past months.
YIELDS RISE IN AUCTIONS BUT SLIP IN SECONDARY MARKET
The Market Call - April 2018
10
Fixed Income Securities
0
100
200
300
400
500
600
700
800
900
Jan-14 Jun-14 Nov-14 Apr-15 Sep-15 Feb-16 Jul-16 Dec-16 May-17 Oct-17 Mar-18
Total Volume
Source: Philippine Dealing Systems (PDS)
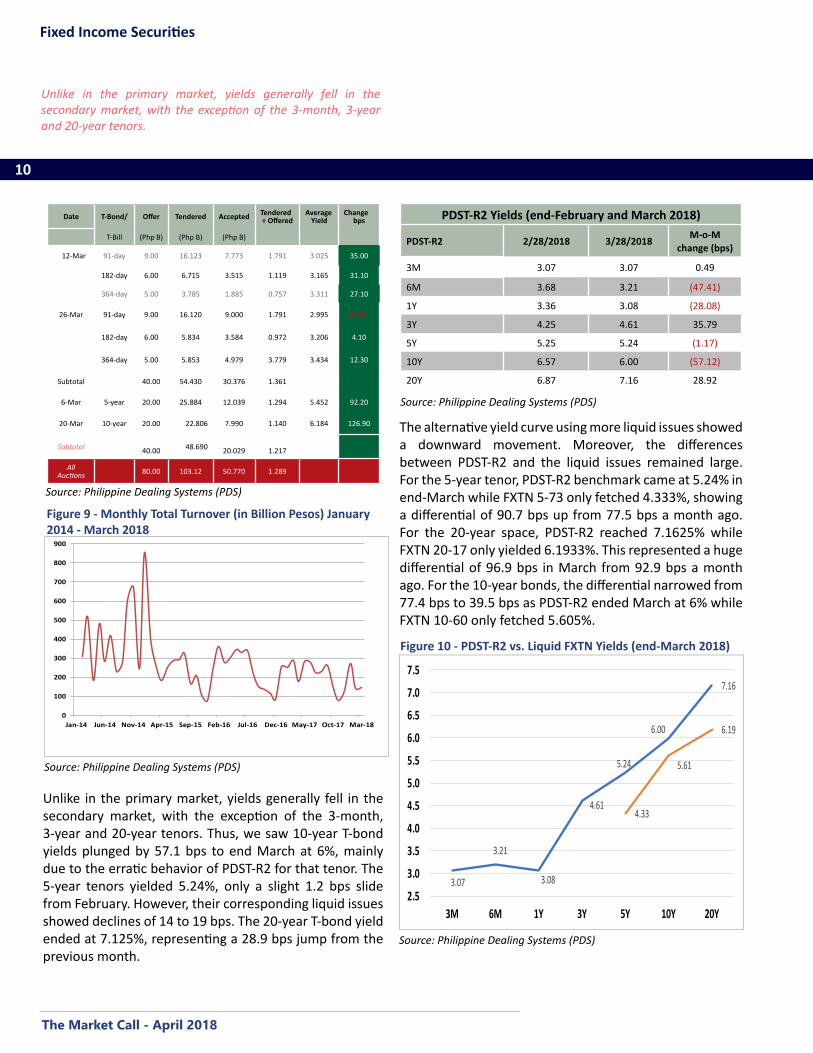
Figure 9 - Monthly Total Turnover (in Billion Pesos) January 2014 - March 2018
Unlike in the primary market, yields generally fell in the secondary market, with the exception of the 3-month, 3-year and 20-year tenors.
Source: Philippine Dealing Systems (PDS)
Figure 10 - PDST-R2 vs. Liquid FXTN Yields (end-March 2018)
3.07
3.21
3.08
4.61
5.24
6.00
7.16
4.33
5.61
6.19
2.5
3.0
3.5
4.0
4.5
5.0
5.5
6.0
6.5
7.0
7.5
3M 6M 1Y 3Y 5Y 10Y 20Y
Unlike in the primary market, yields generally fell in the secondary market, with the exception of the 3-month, 3-year and 20-year tenors. Thus, we saw 10-year T-bond yields plunged by 57.1 bps to end March at 6%, mainly due to the erratic behavior of PDST-R2 for that tenor. The 5-year tenors yielded 5.24%, only a slight 1.2 bps slide from February. However, their corresponding liquid issues showed declines of 14 to 19 bps. The 20-year T-bond yield ended at 7.125%, representing a 28.9 bps jump from the previous month.
Date T-Bond/ Offer Tendered Accepted Tendered ÷ Offered
Average Yield
Change bps
T-Bill (Php B) (Php B) (Php B)
12-Mar 91-day 9.00 16.123 7.773 1.791 3.025 35.00
182-day 6.00 6.715 3.515 1.119 3.165 31.10
364-day 5.00 3.785 1.885 0.757 3.311 27.10
26-Mar 91-day 9.00 16.120 9.000 1.791 2.995 (2.95)
182-day 6.00 5.834 3.584 0.972 3.206 4.10
364-day 5.00 5.853 4.979 3.779 3.434 12.30
Subtotal 40.00 54.430 30.376 1.361
6-Mar 5-year 20.00 25.884 12.039 1.294 5.452 92.20
20-Mar 10-year 20.00 22.806 7.990 1.140 6.184 126.90
Subtotal 40.00 48.690
20.029
1.217
All Auctions 80.00 103.12 50.770 1.289
The alternative yield curve using more liquid issues showed a downward movement. Moreover, the differences between PDST-R2 and the liquid issues remained large. For the 5-year tenor, PDST-R2 benchmark came at 5.24% in end-March while FXTN 5-73 only fetched 4.333%, showing a differential of 90.7 bps up from 77.5 bps a month ago. For the 20-year space, PDST-R2 reached 7.1625% while FXTN 20-17 only yielded 6.1933%. This represented a huge differential of 96.9 bps in March from 92.9 bps a month ago. For the 10-year bonds, the differential narrowed from 77.4 bps to 39.5 bps as PDST-R2 ended March at 6% while FXTN 10-60 only fetched 5.605%.
PDST-R2 Yields (end-February and March 2018)
PDST-R2 2/28/2018 3/28/2018 M-o-M change (bps)
3M 3.07 3.07 0.49
6M 3.68 3.21 (47.41)
1Y 3.36 3.08 (28.08)
3Y 4.25 4.61 35.79
5Y 5.25 5.24 (1.17)
10Y 6.57 6.00 (57.12)
20Y 6.87 7.16 28.92
Source: Philippine Dealing Systems (PDS)
Source: Philippine Dealing Systems (PDS)

The Market Call - April 2018
11
Fixed Income Securities
Trading of corporate bonds in the secondary market improved by 22.3% (m-o-m) to P2.8 B in March from P2.3 B February.
With respect to the top five most traded corporate bonds, we have replaced PSALM with Globe (GLO) starting 2018. The top five (consisting of GLO, SMB, ALI, AC, and SMIC) did better in March with P1.1 B trading volume, a 15.4% increase from P922 M in February. The rankings, however, changed from the previous month, albeit ALI bonds maintained the top spot with total volume of P442.1 M, a hefty 42.5% jump from February. SMB debt papers dislodged SMIC as their total trades spiked by 92.4% to hit P261.8 M. Still in the 3rd place, SMIC bonds’ total trades hit P129 M, a disappointing 38.8% fall from a month ago. GLO slipped to the 4th slot as trading in its papers slumped by 33.3% to P121.3 M. Still in the last place, trades in AC bonds managed to rise by 32% to P110.2 M.
Issuances and DisclosuresMarch saw only two bond issues completed and one announcement of an offshore dollar-denominated offering.
Corporate Trading and Issuances: Also Tepid as in GS MarketTrading of corporate bonds in the secondary improved by 22.3% (m-o-m) to P2.76 B in March from P2.26 B February. However, when compared to March 2017, which had a high base, it showed a 49.1% (y-o-y) plunge. Thus, on a YTD basis, the situation in March had worsened to a decline of 35% compared to the YTD fall of 22.4% up to February this year.
• SM Prime Holdings, Inc. (SMPH) rolled out their P20 B bond issue on March 1 from its shelf registration. It raised P10 B for its 5-year bond with coupon rate of 5.663% and another P10 B for a 7-year bond with a coupon rate of 6.0804%.
• San Miguel Corporation (SMC) issued also P20 B worth of bonds on March 19. It consisted of three tenors. For the 5-year tenor due March 2023, the bonds fetched a coupon rate of 6.25% with a P13.1 B haul. It raised P2.4 B for its 7-year bond due March 2025 with a coupon rate of 6.625%. Finally, the longest tenor of 10 years due March 2028 came with a coupon rate of 7.125% and brought P4.4 B into SMC’s coffers.
• Rizal Commercial Banking Corporration (RCB) disclosed that it is raising $300 M of Senior Unsecured Fixed Rate Reg S Notes offering under its $2 B Medium Term Note Programme. No details have emerged, but the plan is to use the proceeds for RCB’s medium term long asset growth and other general corporate purposes
ROPs: Yields Fall With US Treasuries but at Slower PaceYields in Philippine government dollar-denominated bonds (ROPs) followed the downward slide in long-dated US T-bonds in March. However, as they slipped at a slower pace than US Treasuries the spread between the two sets of debt papers widened.
Source: Philippine Dealing Systems (PDS)
Figure 12 - Monthly Trading Volume of Top-5 Corporate Bonds, January-March 2018
0
50
100
150
200
250
300
350
400
450
GLO SMB ALI AC SMIC
Jan-18Feb-18Mar-18
Source: Philippine Dealing Systems (PDS)
Figure 11 - Total Corporate Trade Volume (In Million Pesos)
-
1,000.00
2,000.00
3,000.00
4,000.00
5,000.00
6,000.00
January February March
2016 2017 2018

The Market Call - April 2018
12
Fixed Income Securities
Sources: Bloomberg & First Metro Investment Corporation (FMIC)
Figure 13 - ROPs Yield, M-O-M bps changes
-9.4 -8.7 -9.9 -15
-5
5
15
25
35
45
55
-3
-2
-1
0
1
2
3
4
5
6
ROP 19 ROP 32 ROP 37
Chan
ge in
Yie
lds
(in
bp
s)
Bid
Yie
ld-t
o-M
atu
rity
m-o-m (February-March) 31-Mar 31-Jan 28-Feb
The US Treasury yield curve flattened as short-dated T-bills yields rose, while at the long end yields declined significantly.
ROP-32, with some 15 years remaining to maturity, shed 9.4 bps to close at 4.039%. Similarly, ROP-37 (around 20 year to maturity) dropped by 9.9 bps to 4.022%. Even ROP-19, which is due within a year, ended at 2.526% or 9.4 bps lower than in February. This remained much above 1-year T-bond yield of 2.09% since it carries a high 9.875% coupon.
The US Treasury yield curve flattened as short-dated T-bills yields rose, while at the long end yields declined significantly. 91-day and 182-day T-bill yields edged up by 8 and 7 bps, respectively, with the former ending at 1.93% and the latter at 2.09%. 10-year T-bonds yielded 2.74%, down by 13 bps from end-February and 21 bps from their peak on February 21, 2018. 20-year T-bonds, however, took a deeper fall of 17 bps to end at 2.85%.
Thus, as explained earlier the spreads between the two sets of similar T-bonds have expanded to 124.4 bps from 113.1 bps for 10-year T-bonds, while for 20-year T-bonds the spread bloated to 117.2 bps from 119.1 bps in February.
There may little upside for spreads for a while as ROPs have lost some luster due to sky high trade deficits, as their good coupons and the Philippines’ robust external position remain a positive.
ASEAN + 1 Market: Strengthening Economic Outlook for ASEAN Following the US Fed HikeUS: While the unemployment rate remained at 4.1%, US nonfarm payrolls rose by 103,000 in March, below market expectations and a huge slip from 326,000 in February. Meanwhile, consumer confidence index slightly eased to 127.7 in March after hitting an 18-year high in February. On a year-on-year (y-o-y) basis, the CPI rose by 2.2%, a bit ahead of the 2.1% increase reported in January, owing to robust energy prices. US GDP expanded at a 2.9 % (SAAR) in Q4-2017, a big upward revision to earlier reported 2.5 % (first estimate) as the gain in consumer spending partially offset the drag from a surge in imports.
Led by Jerome Powell in his first meeting as chairman, the Fed approved the widely expected the 6 th rate hike of 25 bps, that puts the new benchmark funds rate at a target of 1.5% to 1.75%, which was the sixth rate hike since the policymaking FOMC began raising rates off near-zero in December 2015, citing that the economic outlook has strengthened in recent months. The Fed raised its forecast for 2018 GDP growth from 2.5% in December to 2.7%, and increased 2019 projection from 2.1% to 2.4%. On the other hand, the 2018 forecast remains just 1.9% for both core and headline inflation. Along with the rate increase, the Fed also hinted that the path of rate hikes could be more aggressive with a possible additional increase on top of market expectations of three hikes for 2018. 10-year to 2-year spread fell by 14 bps from 61 bps to 47 bps.
PRC: China lowered its budget deficit target for 2018 to 2.6% in an effort to step up its initiatives to curb financial risk. Moreover, the government also maintained its goal of around 6.5% GDP growth for 2018. Factory output and investment in fixed assets have exceeded market expectations in the first two months of this year, increasing by 7.2% and 7.9% (y-o-y), respectively.
In response to the US Fed’s rate hike, the People’s Bank of China (PBOC) raised the interest rates it charges on 7-day reverse-repurchase agreements by 5 bps to 2.55%. The market further expects PBOC to make modest increases in money-market rates in 2018 as it aims to
The Market Call - April 2018
13
Fixed Income Securities
In response to the US Fed rate hike, the People’s Bank of China (PBOC) raised the interest rates it charges on 7-day reverse-repurchase agreements by five basis points to 2.55 percent.
keep up the pressure on deleveraging and prevent too much divergence with US policy. In an effort to maintain its stance of “prudent and neutral” monetary policy, the PBOC has opted to push up rates on short- and medium-term loans instead of benchmark interest rates in order to avoid weighing too much on the broader economy as it seeks to curb leverage in the financial sector. 10-year to 2-year spread moved down by 18 bps from 55 bps to 37 bps.
Indonesia: Monetary authorities view lower and stable inflation as an enabler for Indonesia to avoid higher local rates despite the US Fed’s plan to raise its policy rate this year. Central Statistics Agency reported inflation in February at 3.2% year-on-year (y-o-y) from 3.8% a year go. Despite the rupiah’s weakness in recent months, the government has stressed that the country’s economic fundamentals have remained strong as tax revenues rose by 14% in February.
Indonesia booked a $116 M trade deficit in February, bringing the deficit year-on-year (y-o-y) to $872 M as imports increased by 25.2% y-o-y while exports only increased by 11.8%. Bank Indonesia (BI) projected GDP growth of 5.1% in Q1-2018, supported by exports, household consumption, and investment. Meanwhile, BI remains optimistic that loan growth will attain double digit pace year, as loans have accelerated to 8% y-o-y in February, up from 7% a month ago. 10-year to 2-year spread, however, moved higher by 14 bps from 103 bps to 117 bps.
Malaysia: Nikkei’s Manufacturing Purchasing Managers’ Index (PMI) rose to 50.7 in February 2018 from 50.2 in January, signaling further gains for the sector. The IMF projects a 5.8% real GDP growth in 2018 for the country, largely driven by domestic demand and robust imports. Moreover, IMF also sees Malaysia’s headline inflation moderating to 3.2% in 2018 and the country’s current account surplus softening to 2.4% of GDP as export growth normalizes. CPI increased by 2.7% in January 2018 (y-o-y) due to higher transportation costs and prices of food & non-alcoholic beverages. CPI is expected to rise by 1.9% in February, which would mark the slowest rate since December 2016.
Meanwhile, the ringgit fell temporarily in late March 21 but ended slightly up as a rally in crude oil prices and weaker-than-expected jobs in the US proved beneficial. Risk-on sentiment remained the theme for the month of February amid concerns over higher US inflation risks and possibly more aggressive Fed rate tightening. Foreign holdings of Malaysian bonds experienced a net outflow of around $1 B in February, a reversal from the prior three-month streak of inflows. Meanwhile, corporate bond issuances moderated in February due to higher yields of longer-term Malaysian government bonds. Those rose with rising global yields which reflect heightened inflationary expectations in the US and portfolio reallocation to safe-haven assets. 10-year to 2-year spread, however, still fell by 11 bps from 72 bps to 61 bps with the sanguine inflation outlook. Thailand: Thailand’s industrial output slightly beat expectations as it rose for a third straight month in January, helped by higher production of cars, petroleum and rubber products. The manufacturing production index (MPI) in January rose by 3.4% from a year earlier following the 5% increase which was recorded in December 2017. Inflation in March, primarily driven by fuel, tobacco, alcoholic beverages, and milled rice, rose by 0.8% in March (y-o-y), following 0.4% in February. The country’s private sector (Joint Standing Committee on Commerce, Industry and Banking) raised its 2018 GDP growth estimate to 4-4.5% from 3.8-4.5% in the light of the economy’s continuous expansion. Meanwhile, the outlook for export growth improved to 5-8% from 3.5-6%, and the estimate for inflation rate was revised downwards to 0.7-1.2% from 1.1-1.6%. The private sector, however, asserts that external threats such as trade conflicts between the US and other countries, as well as rising agricultural product prices, may affect economic expansion this year. 10-year to 2-year spread inched lower by 1 bp from 108 bps to 107 bps.
OutlookThe easing in long-term US T-bond yields since late Feb-ruary has the local market players shift their focus on domestic factors, like TRAIN and inflation, infrastructure spending, and BSP’s policy stance.

The Market Call - April 2018
14
Fixed Income Securities
Long-term US Treasury bonds appear to be range-bound, as employment figures for March came in lower-than-expect-ed, while inflation and wage growth paths remain below the Fed’s targets.
Sources: Bloomberg & First Metro Investment Corporation (FMIC)
Figure 14 - ASEAN + 1 Market Bonds Yield Curve
012345678
1-year 2-year 5-year 10-year
US PRC Indonesia Malaysia Thailand Philippines
Sources: Asian Development Bank (ADB), The Economist & UA&P*1-yr yields are used for PH because 2-yr papers are illiquid
Spreads between 10-year and 2-year T-Bonds
Country 2-year Yields
10-year Yields
Projected Inflation
Rates
Real 10-year yield
10 year to 2-year Spread (bps) Spread
Change (bps)Latest
Policy RateReal Policy
Rate30-Oct-17 30-Nov-17
US 2.307 2.781 2.10 0.68 61.00 47.00 -14.00 1.75 -0.60
PRC 3.380 3.850 1.60 2.25 55.00 37.00 -18.00 4.35 2.75
Indonesia 5.581 6.555 3.80 2.76 103.00 117.00 14.00 4.25 0.45
Malaysia 3.348 3.956 3.90 0.06 72.00 61.00 -11.00 3.25 -0.65
Thailand 1.306 2.383 0.70 1.68 108.00 107.00 -1.00 1.50 0.80
Philippines 3.339 7.004 3.20 3.80 246.00 184.00 -62.00 3.00 0.30
• Long-term US Treasury bonds appear to be range-bound, as employment figures for March came in lower-than-ex-pected, while inflation and wage growth paths remain be-low the Fed’s targets.
• While we still expect an uptick in domestic inflation to above-4.5% in Q2, we may see a peak by July and sharper deceleration should follow. This, together with a likely 25 bps Fed policy rate hike by June, would pressure BSP to raise its own policy rates by 25 bps in May or June. These, however, will have limited effect on the domestic bond yields as local investors have priced these in. A BSP rate hike may actually remove uncertainties or the perception that the BSP is behind the curve.
• With the exhaustion of the proceeds of its pre-funding exercise in November-December 2017 (via RTBs), BTr will likely again issue in late Q2 new RTBs or offer a bond swap with additional cash from investors.
• Corporate bond issues shall remain in the slow lane as issuers have become wary of possible sharp increases in bond yields with inflation as the main culprit, supported by BTr’s need to raise funds for NG’s ambitious infrastruc-ture program to take off definitively.
• ROPs will track US Treasury movements, with a slight tendency for spreads to widen as a result of PH’s large trade deficits; however, this will be cramped by the still strong external position of the country and relatively at-tractive coupon rates vis-à-vis US Treasuries of similar ten-or.
The Market Call - April 2018
15
Fixed Income Securities
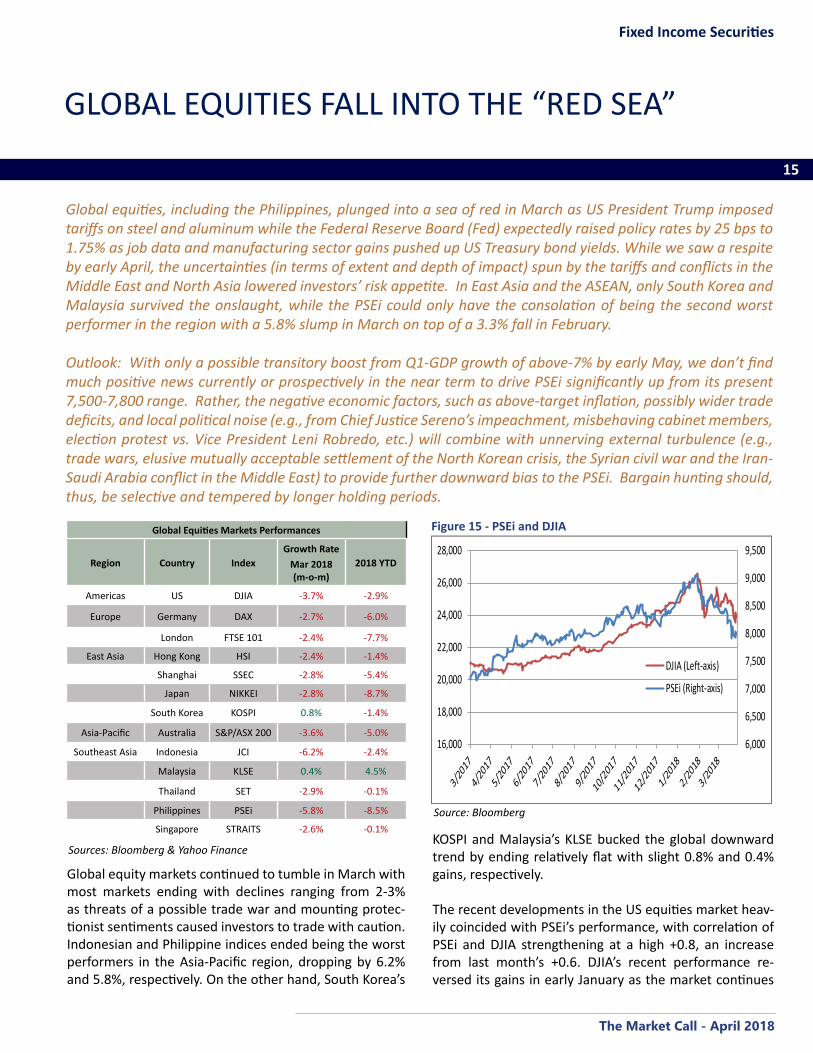
Global equities, including the Philippines, plunged into a sea of red in March as US President Trump imposed tariffs on steel and aluminum while the Federal Reserve Board (Fed) expectedly raised policy rates by 25 bps to 1.75% as job data and manufacturing sector gains pushed up US Treasury bond yields. While we saw a respite by early April, the uncertainties (in terms of extent and depth of impact) spun by the tariffs and conflicts in the Middle East and North Asia lowered investors’ risk appetite. In East Asia and the ASEAN, only South Korea and Malaysia survived the onslaught, while the PSEi could only have the consolation of being the second worst performer in the region with a 5.8% slump in March on top of a 3.3% fall in February.
Outlook: With only a possible transitory boost from Q1-GDP growth of above-7% by early May, we don’t find much positive news currently or prospectively in the near term to drive PSEi significantly up from its present 7,500-7,800 range. Rather, the negative economic factors, such as above-target inflation, possibly wider trade deficits, and local political noise (e.g., from Chief Justice Sereno’s impeachment, misbehaving cabinet members, election protest vs. Vice President Leni Robredo, etc.) will combine with unnerving external turbulence (e.g., trade wars, elusive mutually acceptable settlement of the North Korean crisis, the Syrian civil war and the Iran-Saudi Arabia conflict in the Middle East) to provide further downward bias to the PSEi. Bargain hunting should, thus, be selective and tempered by longer holding periods.
GLOBAL EQUITIES FALL INTO THE “RED SEA”
Global equity markets continued to tumble in March with most markets ending with declines ranging from 2-3% as threats of a possible trade war and mounting protec-tionist sentiments caused investors to trade with caution. Indonesian and Philippine indices ended being the worst performers in the Asia-Pacific region, dropping by 6.2% and 5.8%, respectively. On the other hand, South Korea’s
Source: Bloomberg
Figure 15 - PSEi and DJIA
6,000
6,500
7,000
7,500
8,000
8,500
9,000
9,500
16,000
18,000
20,000
22,000
24,000
26,000
28,000
DJIA (Left-axis)
PSEi (Right-axis)
KOSPI and Malaysia’s KLSE bucked the global downward trend by ending relatively flat with slight 0.8% and 0.4% gains, respectively.
The recent developments in the US equities market heav-ily coincided with PSEi’s performance, with correlation of PSEi and DJIA strengthening at a high +0.8, an increase from last month’s +0.6. DJIA’s recent performance re-versed its gains in early January as the market continues
Sources: Bloomberg & Yahoo Finance
Global Equities Markets Performances
Region Country IndexGrowth Rate
Mar 2018 (m-o-m)
2018 YTD
Americas US DJIA -3.7% -2.9%
Europe Germany DAX -2.7% -6.0%
London FTSE 101 -2.4% -7.7%
East Asia Hong Kong HSI -2.4% -1.4%
Shanghai SSEC -2.8% -5.4%
Japan NIKKEI -2.8% -8.7%
South Korea KOSPI 0.8% -1.4%
Asia-Pacific Australia S&P/ASX 200 -3.6% -5.0%
Southeast Asia Indonesia JCI -6.2% -2.4%
Malaysia KLSE 0.4% 4.5%
Thailand SET -2.9% -0.1%
Philippines PSEi -5.8% -8.5%
Singapore STRAITS -2.6% -0.1%
The Market Call - April 2018
16
Equity Markets
Company Symbol 02/28/18 Close
03/28/18 Close
% Change
Metrobank MBT 97.85 85.80 -12.3%
Banco de Oro BDO 155.80 139.00 -10.8%
Bank of the Philippine Islands BPI 119.90 117.00 -2.4%
Security Bank Corporation SECB 246.20 240.00 -2.5%
Source of Basic Data: PSE Quotation Reports
Company Symbol 02/28/18 Close
03/28/18 Close
% Change
Meralco MER 336.60 318.00 -5.5%
Aboitiz Power AP 38.50 38.70 0.5%
Jollibee Foods Corporation JFC 298.40 299.00 0.2%
First Gen Corporation FGEN 14.50 17.00 17.2%
Universal Robina Corporation URC 149.00 152.00 2.0%
Petron Corporation PCOR 9.19 9.25 0.7%
Source of Basic Data: PSE Quotation Reports
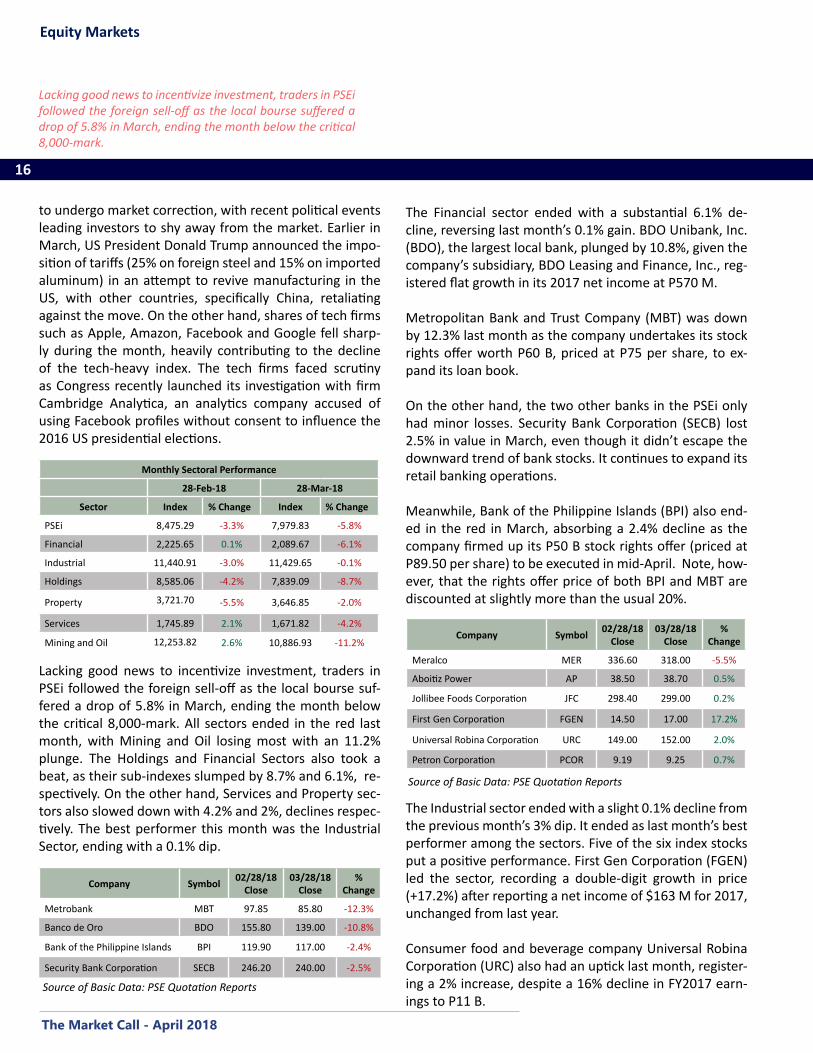
Lacking good news to incentivize investment, traders in PSEi followed the foreign sell-off as the local bourse suf-fered a drop of 5.8% in March, ending the month below the critical 8,000-mark. All sectors ended in the red last month, with Mining and Oil losing most with an 11.2% plunge. The Holdings and Financial Sectors also took a beat, as their sub-indexes slumped by 8.7% and 6.1%, re-spectively. On the other hand, Services and Property sec-tors also slowed down with 4.2% and 2%, declines respec-tively. The best performer this month was the Industrial Sector, ending with a 0.1% dip.
Source of Basic Data: PSE Quotation Reports
Monthly Sectoral Performance
28-Feb-18 28-Mar-18
Sector Index % Change Index % Change
PSEi 8,475.29 -3.3% 7,979.83 -5.8%
Financial 2,225.65 0.1% 2,089.67 -6.1%
Industrial 11,440.91 -3.0% 11,429.65 -0.1%
Holdings 8,585.06 -4.2% 7,839.09 -8.7%
Property 3,721.70 -5.5% 3,646.85 -2.0%
Services 1,745.89 2.1% 1,671.82 -4.2%
Mining and Oil 12,253.82 2.6% 10,886.93 -11.2%
to undergo market correction, with recent political events leading investors to shy away from the market. Earlier in March, US President Donald Trump announced the impo-sition of tariffs (25% on foreign steel and 15% on imported aluminum) in an attempt to revive manufacturing in the US, with other countries, specifically China, retaliating against the move. On the other hand, shares of tech firms such as Apple, Amazon, Facebook and Google fell sharp-ly during the month, heavily contributing to the decline of the tech-heavy index. The tech firms faced scrutiny as Congress recently launched its investigation with firm Cambridge Analytica, an analytics company accused of using Facebook profiles without consent to influence the 2016 US presidential elections.
The Financial sector ended with a substantial 6.1% de-cline, reversing last month’s 0.1% gain. BDO Unibank, Inc. (BDO), the largest local bank, plunged by 10.8%, given the company’s subsidiary, BDO Leasing and Finance, Inc., reg-istered flat growth in its 2017 net income at P570 M.
Metropolitan Bank and Trust Company (MBT) was down by 12.3% last month as the company undertakes its stock rights offer worth P60 B, priced at P75 per share, to ex-pand its loan book.
On the other hand, the two other banks in the PSEi only had minor losses. Security Bank Corporation (SECB) lost 2.5% in value in March, even though it didn’t escape the downward trend of bank stocks. It continues to expand its retail banking operations.
Meanwhile, Bank of the Philippine Islands (BPI) also end-ed in the red in March, absorbing a 2.4% decline as the company firmed up its P50 B stock rights offer (priced at P89.50 per share) to be executed in mid-April. Note, how-ever, that the rights offer price of both BPI and MBT are discounted at slightly more than the usual 20%.
The Industrial sector ended with a slight 0.1% decline from the previous month’s 3% dip. It ended as last month’s best performer among the sectors. Five of the six index stocks put a positive performance. First Gen Corporation (FGEN) led the sector, recording a double-digit growth in price (+17.2%) after reporting a net income of $163 M for 2017, unchanged from last year.
Consumer food and beverage company Universal Robina Corporation (URC) also had an uptick last month, register-ing a 2% increase, despite a 16% decline in FY2017 earn-ings to P11 B.
Lacking good news to incentivize investment, traders in PSEi followed the foreign sell-off as the local bourse suffered a drop of 5.8% in March, ending the month below the critical 8,000-mark.
The Market Call - April 2018
17
Equity Markets
Continuing the trend last month, the Holdings sector accelerat-ed its decline, dropping by 8.7% from February’s 4.2% slide as seven out of 10 stocks in the index posted double-digit falls as earnings came in close to consensus.
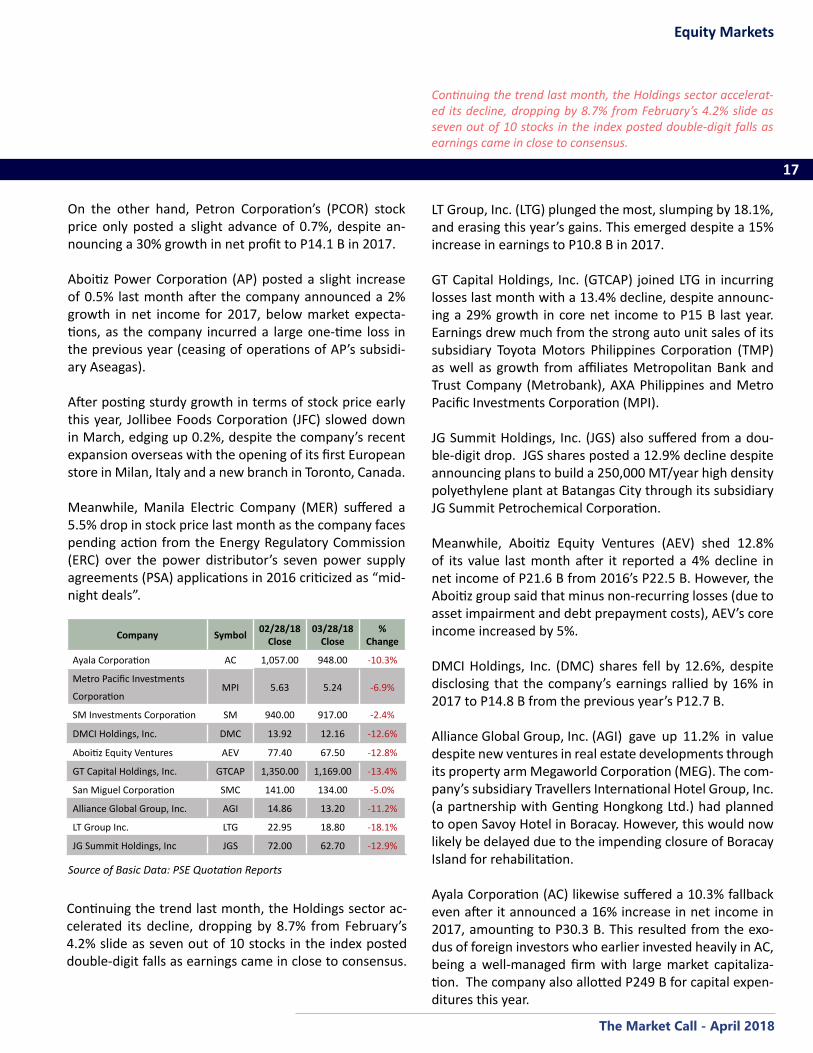
Continuing the trend last month, the Holdings sector ac-celerated its decline, dropping by 8.7% from February’s 4.2% slide as seven out of 10 stocks in the index posted double-digit falls as earnings came in close to consensus.
On the other hand, Petron Corporation’s (PCOR) stock price only posted a slight advance of 0.7%, despite an-nouncing a 30% growth in net profit to P14.1 B in 2017.
Aboitiz Power Corporation (AP) posted a slight increase of 0.5% last month after the company announced a 2% growth in net income for 2017, below market expecta-tions, as the company incurred a large one-time loss in the previous year (ceasing of operations of AP’s subsidi-ary Aseagas).
After posting sturdy growth in terms of stock price early this year, Jollibee Foods Corporation (JFC) slowed down in March, edging up 0.2%, despite the company’s recent expansion overseas with the opening of its first European store in Milan, Italy and a new branch in Toronto, Canada.
Meanwhile, Manila Electric Company (MER) suffered a 5.5% drop in stock price last month as the company faces pending action from the Energy Regulatory Commission (ERC) over the power distributor’s seven power supply agreements (PSA) applications in 2016 criticized as “mid-night deals”.
Source of Basic Data: PSE Quotation Reports
Company Symbol 02/28/18 Close
03/28/18 Close
% Change
Ayala Corporation AC 1,057.00 948.00 -10.3%
Metro Pacific Investments
CorporationMPI 5.63 5.24 -6.9%
SM Investments Corporation SM 940.00 917.00 -2.4%
DMCI Holdings, Inc. DMC 13.92 12.16 -12.6%
Aboitiz Equity Ventures AEV 77.40 67.50 -12.8%
GT Capital Holdings, Inc. GTCAP 1,350.00 1,169.00 -13.4%
San Miguel Corporation SMC 141.00 134.00 -5.0%
Alliance Global Group, Inc. AGI 14.86 13.20 -11.2%
LT Group Inc. LTG 22.95 18.80 -18.1%
JG Summit Holdings, Inc JGS 72.00 62.70 -12.9%
LT Group, Inc. (LTG) plunged the most, slumping by 18.1%, and erasing this year’s gains. This emerged despite a 15% increase in earnings to P10.8 B in 2017.
GT Capital Holdings, Inc. (GTCAP) joined LTG in incurring losses last month with a 13.4% decline, despite announc-ing a 29% growth in core net income to P15 B last year. Earnings drew much from the strong auto unit sales of its subsidiary Toyota Motors Philippines Corporation (TMP) as well as growth from affiliates Metropolitan Bank and Trust Company (Metrobank), AXA Philippines and Metro Pacific Investments Corporation (MPI).
JG Summit Holdings, Inc. (JGS) also suffered from a dou-ble-digit drop. JGS shares posted a 12.9% decline despite announcing plans to build a 250,000 MT/year high density polyethylene plant at Batangas City through its subsidiary JG Summit Petrochemical Corporation.
Meanwhile, Aboitiz Equity Ventures (AEV) shed 12.8% of its value last month after it reported a 4% decline in net income of P21.6 B from 2016’s P22.5 B. However, the Aboitiz group said that minus non-recurring losses (due to asset impairment and debt prepayment costs), AEV’s core income increased by 5%.
DMCI Holdings, Inc. (DMC) shares fell by 12.6%, despite disclosing that the company’s earnings rallied by 16% in 2017 to P14.8 B from the previous year’s P12.7 B.
Alliance Global Group, Inc. (AGI) gave up 11.2% in value despite new ventures in real estate developments through its property arm Megaworld Corporation (MEG). The com-pany’s subsidiary Travellers International Hotel Group, Inc. (a partnership with Genting Hongkong Ltd.) had planned to open Savoy Hotel in Boracay. However, this would now likely be delayed due to the impending closure of Boracay Island for rehabilitation.
Ayala Corporation (AC) likewise suffered a 10.3% fallback even after it announced a 16% increase in net income in 2017, amounting to P30.3 B. This resulted from the exo-dus of foreign investors who earlier invested heavily in AC, being a well-managed firm with large market capitaliza-tion. The company also allotted P249 B for capital expen-ditures this year.

The Market Call - April 2018
18
Equity Markets
Company Symbol 02/28/18 Close
03/28/18 Close
% Change
Ayala Land, Inc. ALI 41.10 41.10 0.0%
SM Prime Holdings, Inc. SMPH 35.30 33.70 -4.5%
Robinsons Land Corporation RLC 19.40 19.94 2.8%
Megaworld Corporation MEG 4.85 4.69 -3.3%
Source of Basic Data: PSE Quotation Reports
Metro Pacific Investments Corporation’s (MPIC) could not avoid the whiplash of the sector’s price declines. Shares dropped by 6.9%, even after reporting a 15% increase in earnings in 2017 to P13.2 B from 2016’s P11.5 B. The com-pany attributed this growth to its power sector investments (such as Meralco and Global Business Power).
San Miguel Corporation (SMC) dipped by 5% in stock price even though the conglomerate announced an 11% in-crease in net income to P54.6 B from P49.4 B recorded in 2016, a result of robust growth of its oil, food and beverage businesses. SMC’s total earnings topped the Holdings sec-tor’s performance.
Least affected among Holdings companies, SM Invest-ments Corporation (SM) shares slipped by 2.4%. Ironically, SM posted only a 6% increase in net income to P32.9 B, below consensus estimates.
Company Symbol 02/28/18 Close
03/28/18 Close
% Change
Philippine Long Distance Tel. Co. TEL 1,520.00 1,470.00 -3.3%
Globe Telecom GLO 1,722.00 1,622.00 -5.8%
International Container
Terminal Services Inc.ICT 95.00 89.30 -6.0%
Puregold Price Club Inc. PCGMF 51.90 52.45 1.1%
Robinsons Retail Holdings,
Inc.RRHI 110.00 100.00 -9.1%
Source of Basic Data: PSE Quotation Reports
The Property sector ended with a 2% decline from Feb-ruary’s 5.5% drop. Robinsons Land Corporation (RLC) emerged as the sector’s best performer with a 2.8% uptick, as the company disclosed its partnership with Shang Prop-erties for a P10 B mixed-use project in Bonifacio Global City (BGC) in Taguig City.
Property developer SM Prime Holdings, Inc. (SMPH) had the worst record as its share price fell by 4.5%, despite the firm’s continuous expansion, particularly with the launch-ing of a new residential development in Iloilo City.
Megaworld Corporation’s (MEG) stock price fell by 3.3%, despite announcing a 12.7% increase in net income to P12.8 B in 2017. The government’s plan to temporarily shut down Boracay clearly affected MEG’s stock price (see AGI above).
Giving up last month’s 2.1% gain, shares in the Services sec-tor fell by 4.2%.
Ayala Land, Inc.’s (ALI) stock price remained unchanged this month in spite of the go-signal given to the property giant (from the Philippine Competition Commission (PCC)) for its acquisition of some land assets from Central Azucarera de Tarlac, Inc. (CAT).
Giving up last month’s 2.1% gain, shares in the Services sector fell by 4.2%. Robinsons Retail Holdings, Inc. (RRHI) whose shares had 9.1% drop in share price, became the sector’s worst performer in March. The market largely ig-nored the company’s recent acquisition of grocery chain operator Rustan Supercenters, Inc. (RSCI) for P18 B.
Meanwhile, port operator International Container Termi-nal Services, Inc. (ICT) shed off 6% reflecting the company’s weak 1% growth in net income to $182 M in 2017, albeit ahead of consensus estimates.
Telecommunications services provider Globe Telecom (GLO) continued its decline in March, with a 5.8% fall. The compa-ny recently signed a P6 B and $20 M 7-year term loan facility agreement with Mizuho Bank Ltd. to help fund the compa-ny’s P44.2 B planned capital expenditures in 2018.
On the other hand, Philippine Long Distance Telephone Company (TEL) lost 3.3% in value last month as the com-pany reported recurring core income of P22.3 B in 2017. However, non-core capex-related expenses worth P16.7 B dragged down the company’s net earnings to P13.4 B last year.
Puregold Price Club, Inc. gained a 1.1% uptick as the super-market chain continued its provincial expansion with the opening of six branches (three in Central Luzon and one each in Metro Manila, Visayas, and Mindanao).

The Market Call - April 2018
19
Equity Markets
Company Symbol 02/28/18 Close
03/28/18 Close
% Change
Semirara Mining and Power Corporation
SCC 36.80 30.30 -17.7%
Source of Basic Data: PSE Quotation Reports
Monthly Turnover (in Million Pesos)Total Turnover Average Daily Turnover
Sector Value % Change Value % Change
Financial 26,005.96 18.7% 1,300.30 12.7%
Industrial 27,186.51 12.1% 1,359.33 6.5%
Holdings 47,958.76 33.1% 2,397.94 26.5%
Property 32,503.60 2.3% 1,625.18 -2.9%
Services 32,478.65 -26.9% 1,623.93 -30.6%
Mining and Oil 6,388.88 -25.2% 319.44 -29.0%
Total 172,522.36 2.5% 8,626.12 -2.6%
Foreign Buying 79,255.61 23.4% 3,962.78 17.2%
Foreign Selling 98,568.25 23.9% 4,928.41 17.7%
Net Buying (Selling) (19,312.65) 26.2% (965.63) 19.9%
Source of Basic Data: PSE Quotation Reports
Total Turnover
PSEi’s local turnover reversed its trend from last month, ending with a 2.5% growth, compared to last month’s 5.8% decrease.
After being the best performer in February (+2.6%), the Mining and Oil sector declined most among sectors last month, plunging by 11.2%. Semirara Mining and Pow-er Corporation (SCC) disclosed outages in two of its coal power plants in Calaca early in March due to some techni-cal reasons, which led to a 17.7% drop in stock price.
PSEi’s local turnover reversed its trend from last month, ending with a 2.5% growth, compared to last month’s 5.8% decrease. On the other hand, foreign funds outflow from the local bourse accelerated last month, with net selling soaring by 26.2% to P19.3 B from the previous month’s P15.3 B. Holdings sector turnover rallied in March with a 33.1% increase, from February’s 11.5% decline, but this reflected the sell-off by foreign investors. The Finance and Industrial sectors showed positive turnover growth, with upsurges of 18.7% and 12.1%, respectively. Property sec-tor, meanwhile, had a slower uptick of 2.3%. On the other hand, Services and Mining & Oil sectors’ turnover suffered the most, with 26.9% and 25.2% decreases, respectively.
The Market Call - April 2018
20
Recent Economic Indicators
NATIONAL INCOME ACCOUNTS, CONSTANT PRICES (In Million Pesos)2016 2017 3rd Quarter 2017 4th Quarter 2017
Levels A n n u a l G.R. Levels A n n u a l
G.R. Levels Q u a r t e r l y G.R. Annual G.R. Levels Q u a r te r l y
G.R. Annual G.R.
Production Agri, Hunting, Forestry and Fishing 710,590 -1.3% 738,491 3.9% 164,213 -5.6% 2.5% 218,079 32.62% 3.9% Industry Sector 2,738,320 8.0% 2,958,186 7.2% 695,200 -8.1% 7.5% 815,360 16.86% 7.2% Service Sector 4,664,261 7.5% 4,971,610 6.7% 1,229,016 -4.9% 7.1% 1,310,106 6.55% 6.7%
ExpenditureHousehold Final Consumption 5,628,318 6.9% 5,958,500 5.5% 1,404,441 -5.1% 4.5% 1,690,135 20.3% 5.5%Government Final Consumption 850,747 8.3% 912,010 6.8% 217,820 -20.1% 8.3% 214,326 -1.6% 6.8%Capital Formation 2,180,842 20.8% 2,479,583 8.3% 589,369 0.8% 6.6% 693,776 17.7% 8.3% Exports 4,016,105 9.1% 4,875,652 16.1% 1,352,421 7.9% 17.2% 1,082,706 -19.9% 16.1% Imports 4,631,536 17.5% 5,552,632 15.0% 1,451,774 5.5% 13.9% 1,356,178 -6.6% 15.0%
GDP 8,113,170 6.8% 8,668,287 6.3% 2,091,655 -6.0% 6.9% 2,343,545 12.0% 6.3%NPI 1,622,040 5.3% 1,721,698 5.3% 416,478 -1.8% 5.7% 442,402 6.2% 5.3%GNI 9,735,210 6.6% 10,389,984 6.1% 2,508,133 -5.4% 6.7% 2,785,946 11.1% 6.1%
Source: National Statistical Coordination Board (NSCB)
NATIONAL GOVERNMENT CASH OPERATION (In Million Pesos)2016 2017 Jan-2018 Feb-2018
Levels G r o w t h Rate Levels G r o w t h
Rate Levels M o n t h l y G.R. Annual G.R. Levels M o n t h l y
G.R. Annual G.R
Revenues 2,195,914 4.1% 2,473,132 12.6% 238,898 7.08% 19.26% 178,535 -25.27% 17.58%Tax 1,980,390 9.1% 2,250,678 13.6% 217,760 10.53% 17.92% 163,234 -25.04% 17.45%BIR 1,567,214 9.3% 1,772,321 13.1% 175,612 16.11% 19.15% 116,641 -33.58% 10.18%BoC 396,365 7.8% 458,184 15.6% 40,831 -9.42% 13.60% 43,716 7.07% 41.69%Others 16,811 14.8% 20,173 20% 1,317 92.83% -0.75% 2,877 118.45% 27.24%Non-Tax 215,446 -26.5% 222,415 3.2% 21,138 -18.96% 35.08% 15,301 -27.61% 19.03%
Expenditures 2,549,336 14.3% 2,823,769 10.8% 228,707 -30.75% 15.45% 240,269 5.06% 36.86%Allotment to LGUs 449,776 16.1% 530,150 17.9% 43,308 -3.25% 6.03% 59,162 36.61% 45.03%Interest Payments 304,454 -1.6% 310,541 2% 43,516 111.72% 2.75% 36,162 -16.90% 49.24%
Overall Surplus (or Deficit) (353,422) -190.4% (350,637) -0.8% 10,191 -109.51% 358.64% -61,734 -705.77% 160.22%
Source: Bureau of the Treasury (BTr)
POWER SALES AND PRODUCTION INDICATORS Manila Electric Company Sales (In Gigawatt-hours)
2017 Dec-2017 Jan-2018
Annual Levels Growth Rate Levels Y-o-Y G.R. YTD Levels Y-o-Y G.R. YTD
TOTAL 41,605 5.1% 3,459.40 7.6% 5.1% 3,752.30 6.2% 6.2% Residential 13,055 5% 1,048.30 7.6% 4.8% 1,176.30 2.5% 2.5% Commercial 16,378 4.7% 1,373.30 5.4% 4.6% 1,432.60 4.4% 4.4% Industrial 11,861 4.4% 987.40 6.6% 0.7% 905.50 8.3% 8.3%
Source: Meralco

The Market Call - April 2018
21
BALANCE OF PAYMENTS (In Million U.S. Dollar)
2016 2017 3rd Quarter 2017 4th Quarter 2017
Levels Annual G. R. Levels Annual G. R. Levels Annual G. R. Levels Annual G. R.
I. CURRENT ACCOUNT (1,199) -116.5% (2,518) 110.0% 1,850 -976.6% (3,297) -278.2% Balance of Trade (1,199) -116.5% (2,518) 110.0% 1,850 -976.6% (3,297) -278.2% Balance of Goods (35,549) 52.5% (41,191) 15.9% (8,647) -11.2% (13,123) 51.8% Exports of Goods 42,734 -1.1% 48,199 12.8% 12,875 5.4% 11,337 -11.9% Import of Goods 78,283 17.7% 89,390 14.2% 21,523 -1.9% 24,461 13.6% Balance of Services 7,043 29.1% 9,496 34.8% 3,296 50.0% 2,236 -32.2% Exports of Services 31,204 7.4% 35,605 14.1% 9,797 12.7% 9,163 -6.5% Import of Services 24,160 2.3% 26,109 8.1% 6,501 0.1% 6,927 6.6% Current Transfers & Others - - - - - - - -
II. CAPITAL AND FINANCIAL ACCOUNT
Capital Account 62 -26.3% 57 -8.7% 18 -0.2% 14 -22.0% Financial Account 175 -92.4% (2,208) -1361.6% 442 -146.7% (2,033) -559.9% Direct Investments (5,883) 5803.4% (8,110) 37.9% (2,117) 13.3% (2,646) 25.0% Portfolio Investments 1,480 -72.9% 3,889 162.7% 875 -776.5% (114) -113.0% Financial Derivatives (32) -673.4% (51) 57.4% 45 -892.2% 41 -9.9% Other Investments 4,610 -249.8% 2,064 -55.2% 1,638 54.9% 686 -58.1%
III. NET UNCLASSIFIED ITEMS 892 -136.6% (610) -168.4% (2,088) 349.9% 1,754 -184.0%
OVERALL BOP POSITION (420) -116.1% (863) 105.4% (662) -329.3% 505 -176.3% Use of Fund Credits - - - - - - - - Short-Term - - - - - - - -Memo ItemsChange in Commercial Banks 1,421 -222.0% 409 -71.2% 1,387 -1857.1% (1,006) -172.5% Net Foreign Assets 1,381 -229.7% 442 -68.0% 1,363 -9047.3% (970) -171.2%Basic Balance n.a n.a n.a n.a n.a n.a n.a n.a
Source: Bangko Sentral ng Pilipinas (BSP)
MONEY SUPPLY (In Million Pesos)
2018 Jan-2018 Feb-2018Average Levels Annual G. R Average Levels Annual G.R. Average Levels Annual G.R.
RESERVE MONEY 4,105,916 2.7% 4,095,224 2.4% 4,112,131 2.7%
Sources: Net Foreign Asset of the BSP 2,995,186 13.4% 2,937,520 11.2% 3,001,797 2.2% Net Domestic Asset of the BSP 94,638 -53.9% 59,095 -71.2% 64,288 8.8%
MONEY SUPPLY MEASURES AND COMPONENTSMoney Supply-1 3,562,223 17.1% 3,543,092 -0.5% 3,581,354 0.5%Money Supply-2 10,227,276 13.1% 10,160,344 -0.5% 10,294,207 0.8%Money Supply-3 10,655,369 13.2% 10,596,579 -0.4% 10,724,160 0.8%
MONEY MULTIPLIER (M2/RM) 2.49 2.48 2.5Source: Bangko Sentral ng Pilipinas (BSP)

Rabboni Francis B. ArjonilloDr. Victor A. Abola
Viory Yvonne T. JaneoJose Miguel D. Alonzo
Christian A. SiatonAugusto M. Cosio, Jr.
President, FMICSenior Economist, UA&PResearch Associate, UA&PResearch Assistant, UA&PResearch Assistant, UA&PPresident, FAMI
CONTRIBUTORS
Views expressed in this newsletter are solely the responsibilities of the authors and do not represent any position held by the FMIC and UA&P.
April 2018
The Market Call - Capital Markets Research
FMIC and UA&P Capital Markets Research