capitol lake alternatives analysis dredging and …
TRANSCRIPT

CAPITOL LAKE ALTERNATIVES ANALYSIS
DREDGING AND DISPOSAL
Prepared for:
Purple loosestrife capsules (left) and seeds next to dried capsules (right)
Prepared by:
August 22, 2008


Moffatt & Nichol Page ES-1DREDGING REPORT FINAL-080822.DOC 8/22/2008
Executive SummaryWashington State Department of General Administration and the CLAMP Steering Committeeare developing and understanding of the different future management alternatives for CapitolLake. In particular, a goal of the CLAMP Steering Committee is to complete a study thatevaluates the possibility of a restored estuary as an alternative to the continued managementactions necessary to maintain a lake in this setting.
As one piece of this study, this report describes the costs, methods, and schedules associated withthe dredging elements of the different possible future management alternatives: continuedmanagement of the lake as a lake, and restoration of the Deschutes Estuary with or without aseparate reflecting pool.
The disposal sites have the most significant impacts to the project cost. Disposal sites also affectconstruction methods: mechanical dredging is generally most cost-effective for upland disposal orbeneficial reuse, while hydraulic dredging is generally most cost-effective for offshore disposal.The most cost-effective option for material transported off-site – open-water disposal atAnderson-Ketron Island – is available only for clean material, and may not be available for theCapitol Lake sediments because of the presence of purple loosestrife seeds. The most expensiveoption – upland disposal at a landfill site – is certain to be available for all but the mostcontaminated sediments, which are not believed to be present in Capitol Lake or in Budd Inlet.Intermediate options include open-water disposal at Commencement Bay, which is more distantthan Anderson-Ketron Island but which may accept materials containing purple loosestrife seeds;mine reclamation at the Lakeside Industries Central Aggregate Pit near Centralia; and (for asubset of the material) construction fill. It is likely but not certain that one of these intermediateoptions will be available. Chemical, biological, and physical testing (including the drainagecharacteristics of the sediment) will be needed to establish the available disposal sites and costs.
Dredging costs are evaluated based on the most likely dredging quantities, and with the range ofpossible unit costs considered. Future costs are evaluated based on a 50-year project lifetime:costs with and without escalation of construction costs, at 3.5% annually, are given. In addition,future costs are given as a net present value (NPV), using the current (2008) USACE interest rateof 4.875 percent. The NPV takes into account the time value of money. The actual dollar valuescan vary dramatically over a 50-year project lifetime if construction cost inflation differs from theassumed 3.5 percent.
A typical three-point construction estimate gives a low, medium, and high cost. Because the costsassociated with disposal at a landfill are so much higher than other costs, this report additionallyincludes a worst-case cost.
For the Lake Alternative, the following cases are considered:
• Low-cost: Initial dredging with disposal at the reclamation site; Maintenance dredgingwith a combination of beneficial reuse as construction fill, disposal at a reclamation site,and (after 2025, when purple loosestrife is assumed to be eradicated) disposal offshore atthe Anderson-Ketron Island open water disposal site.
• Medium-cost: Initial dredging with disposal offshore at Commencement Bay;Maintenance dredging with a combination of beneficial reuse as construction fill anddisposal at Commencement Bay.
• High-cost: Disposal alternatives as for the medium-cost case, but costs are 30 percenthigher.
• Worst-case: All disposal is to landfill.

Page ES-2 Moffatt & Nichol8/22/2008 DREDGING REPORT FINAL-080822.DOC
These assumptions give the following initial and maintenance dredging costs for the LakeAlternative.
Table ES-1. Initial and Maintenance Dredging Costs for the Lake Alternative
Element Low-Cost($millions)
Medium-Cost($millions)
High-Cost($millions)
Worst-Case($millions)
2008 Dollars (no escalation)Initial Dredging $64.8 $79.6 $103.5 $120.8Maintenance $101.3 $131.1 $170.4 $240.2
Total Cost $166.1 $210.7 $273.9 $361.0Escalation at 3.5% annually with a 2015 start dateInitial Dredging $82.4 $101.3 $131.7 $153.6Maintenance $358.6 $467.2 $607.3 $863.2
Total Cost $441.0 $568.5 $739.0 $1,016.8Net Present Value in 2008 with interest rate 4.875%Initial Dredging $59.0 $72.6 $94.4 $110.1Maintenance $65.9 $84.9 $110.3 $155.9
NPV of Total Cost $124.9 $157.5 $204.7 $266.0
Two separate Estuary Restoration Alternatives have been defined. The Dual Basin alternativedivides the North Basin of Capitol Lake along a north-south line, into a reflecting pool to the eastand a free flowing estuary to the west. The Single Basin alternative does not provide a reflectingpool – the entire area of Capitol Lake is restored to a free flowing estuary. Costs associated withdredging for the two Estuary Restoration alternatives are similar. In the long-term, Budd Inletmust undergo more sedimentation under the Dual Basin alternative, because the availablesediment storage in the eastern part of the North Basin of Capitol Lake is lost. However, themodeling work carried out by USGS suggests that this will be observed over a scale of decades ormore: the difference between the sedimentation rates for the two alternatives is much smaller thanthe uncertainty in the sedimentation rates.
As with the Lake Alternative, four cost cases are considered for the Estuary RestorationAlternatives. The worst-case example does not include disposal at a landfill for all materialsdredged in the 50-year project life, since it can be assumed that Budd Inlet – which currentlycontains some contamination in the form of dioxins and furans – will eventually be cleaned up. Itis strongly recommended that any necessary cleanup actions occur before the estuary restorationis completed. The four cases are as follows:
• Low-cost: Initial estuary dredging and placement along Deschutes Parkway, with costs at85 percent of the most likely estimated cost; subsequent dredging at the marinas in BuddInlet and the Port Olympia facilities with disposal at Anderson-Ketron Island, withdredge efficiency increasing after the first cycle.
• Medium-cost: Initial estuary dredging and placement along Deschutes Parkway, withcosts at the most likely estimated cost; subsequent dredging at the marinas in Budd Inletand the Port Olympia facilities with disposal at Anderson-Ketron Island, except that 5percent of the material is disposed of at a landfill in the first maintenance dredging cycle.
• High-cost: Initial estuary dredging and placement requires 5 percent of the material to bedisposed of at a landfill, with the remainder placed along Deschutes Parkway at a cost 30
Moffatt & Nichol Page ES-3DREDGING REPORT FINAL-080822.DOC 8/22/2008
percent higher than the most likely estimated cost; subsequent dredging costs are 30percent higher than the medium-cost case.
• Worst-case: Initial estuary dredging and placement requires 20 percent of the material tobe disposed of at a landfill, with the remainder placed along Deschutes Parkway at a cost30 percent higher than the most likely estimated cost. In the first two dredging cycles atthe marinas and the Port all of the material must be transported to a landfill; in the thirddredging cycle (9 years after estuary restoration) one-half of the material must betransported to a landfill; subsequent dredging costs are the same as the high-cost case.
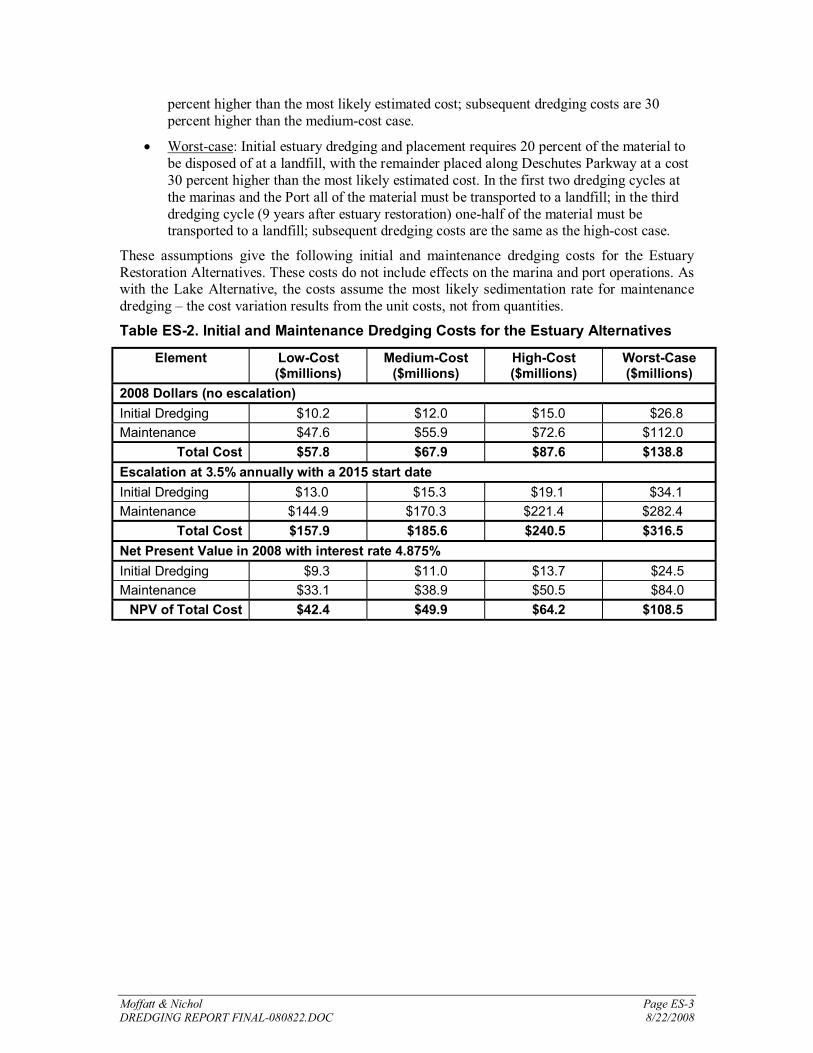
These assumptions give the following initial and maintenance dredging costs for the EstuaryRestoration Alternatives. These costs do not include effects on the marina and port operations. Aswith the Lake Alternative, the costs assume the most likely sedimentation rate for maintenancedredging – the cost variation results from the unit costs, not from quantities.
Table ES-2. Initial and Maintenance Dredging Costs for the Estuary Alternatives
Element Low-Cost($millions)
Medium-Cost($millions)
High-Cost($millions)
Worst-Case($millions)
2008 Dollars (no escalation)Initial Dredging $10.2 $12.0 $15.0 $26.8Maintenance $47.6 $55.9 $72.6 $112.0
Total Cost $57.8 $67.9 $87.6 $138.8Escalation at 3.5% annually with a 2015 start dateInitial Dredging $13.0 $15.3 $19.1 $34.1Maintenance $144.9 $170.3 $221.4 $282.4
Total Cost $157.9 $185.6 $240.5 $316.5Net Present Value in 2008 with interest rate 4.875%Initial Dredging $9.3 $11.0 $13.7 $24.5Maintenance $33.1 $38.9 $50.5 $84.0
NPV of Total Cost $42.4 $49.9 $64.2 $108.5


Moffatt & Nichol Page i DREDGING REPORT FINAL-080822.DOC 8/22/2008
Contents1. Introduction .............................................................................................................1
1.1 Background .....................................................................................................11.2 Existing Conditions and Future Alternatives.....................................................1
2. Dredge Material Characteristics ..............................................................................52.1 Physical and Chemical Characteristics ............................................................52.2 Biological Characteristics.................................................................................6
3. Offsite Disposal Options..........................................................................................93.1 Introduction......................................................................................................93.2 Open-Water Disposal ......................................................................................93.3 Landfill ...........................................................................................................123.4 Beneficial Reuse............................................................................................133.5 Summary.......................................................................................................14
4. Dredging and Associated Technologies ................................................................174.1 Mechanical Dredges......................................................................................174.2 Portable Hydraulic Dredges...........................................................................184.3 Equipment Launch.........................................................................................204.4 Dewatering ....................................................................................................224.5 Geotubes.......................................................................................................234.6 Selection of Dredging Method........................................................................24
5. Lake Dredging.......................................................................................................255.1 Overview of Dredging Needs.........................................................................255.2 Permitting and Regulatory Process................................................................275.3 Initial Dredging Methods and Costs ...............................................................295.4 Maintenance Dredging Methods and Costs ...................................................355.5 Cost Summary and Timeline..........................................................................38
6. Estuary Dredging: Single Basin .............................................................................416.1 Overview of Dredging Needs.........................................................................416.2 Dredge Material Disposal...............................................................................446.3 Estuary Dredging Methods and Costs ...........................................................456.4 Permitting and Regulatory Process................................................................496.5 Cost Summary...............................................................................................50
7. Estuary Dredging: Dual Basin................................................................................51
8. Marina and Port Dredging .....................................................................................538.1 Background ...................................................................................................538.2 Anticipated Dredging Needs ..........................................................................538.3 Dredge Material Characteristics.....................................................................558.4 Dredge Material Disposal...............................................................................568.5 Permitting and Regulatory Process................................................................568.6 Cleanup of Budd Inlet ....................................................................................568.7 Construction and Material Handling ...............................................................578.8 Cost Summary and Timeline..........................................................................61
9. References............................................................................................................63

Page ii Moffatt & Nichol8/22/2008 DREDGING REPORT FINAL-080822.DOC
FiguresFigure 1. Existing Conditions ..................................................................................................... 2Figure 2. Budd Inlet and Capitol Lake ........................................................................................ 3Figure 3. Purple loosestrife (Source: flickr.com) ......................................................................... 6Figure 4. Purple loosestrife capsules (left) and seed next to dried capsules (right) (Source:Knezevic 2003) .......................................................................................................................... 7Figure 5. Puget Sound open-water disposal sites (Source: DMMO 2008a) .................................10Figure 6. Open-water disposal sites closest to Capitol Lake: Anderson-Ketron Island (left) andCommencement Bay (right).......................................................................................................10Figure 7. Nearest upland disposal sites.......................................................................................12Figure 8. Typical derrick crane dredge with clamshell bucket (left); close-up of bucket (right) ...17Figure 9. Typical excavator dredge ............................................................................................18Figure 10. Excavator dredge on track-mounted barge.................................................................18Figure 11. Cutter head dredge (left), close-up of cutter head (right)............................................19Figure 12. Typical bucket wheel dredge.....................................................................................19Figure 13. BNSF Railroad Trestle..............................................................................................20Figure 14. Modular barge system in use (source: www.flexifloat.com) ......................................21Figure 15. Layout of modular barge system (source: www.flexifloat.com) .................................21Figure 16. Potential launch sites for lake-bound equipment........................................................22Figure 17. Geotubes used in dewatering (source: Tencate) .........................................................23Figure 18. Existing lake bathymetry, proposed dredge footprint (full yellow line), and outline ofpotential sediment traps (broken red line) ..................................................................................26Figure 19. Published fish windows for Olympia.........................................................................29Figure 20. Possible rehandling layout at Marathon Park.............................................................31Figure 21. Possible material transfer layout at the 4th / 5th Avenue Bridges ...............................34Figure 22. Proposed dredged bathymetry with dredge footprint (yellow line) and fill footprint (redline)...........................................................................................................................................42Figure 23. Estuary and dredging sections ...................................................................................43Figure 24. Predicted changes in the bottom elevation of the Deschutes Estuary in the first 10years, assuming no pre-dredging................................................................................................45Figure 25. Diking options for the estuary placement ..................................................................47Figure 26. Anticipated erosion and deposition three years after estuary restoration: single basin(Source: USGS 2008a). .............................................................................................................55
TablesTable 1. Dredge areas and volumes for the lake dredging...........................................................25Table 2. Daily Operations Cost – Mechanical Lake Dredging ....................................................32Table 3. Cost of Mechanical Dredging to Landfill......................................................................32Table 4. Cost of Mechanical Dredging to Reclamation Site........................................................33Table 5. Daily Operations Cost – Hydraulic Dredging ...............................................................35Table 6. Cost of Hydraulic Dredging to Commencement Bay ....................................................35Table 7. Daily Operations Cost – Dredging Sediment Traps.......................................................37Table 8. Cost of Dredging Sediment Traps.................................................................................37Table 9. Daily Operations Cost – Hydraulic Dredging to Anderson- Ketron Island.....................38Table 10. Cost of Hydraulic Dredging to Anderson-Ketron Island .............................................38Table 11. Cost timelines for the Lake Alternative: 2008 costs, no escalation ..............................40

Moffatt & Nichol Page iii DREDGING REPORT FINAL-080822.DOC 8/22/2008
Table 12. Cost timelines for the Lake Alternative: escalation at 3.5 percent annually, interest rateat 4.875 percent annually ...........................................................................................................40Table 13. Dredge and Fill Quantities for Estuary Alternative .....................................................41Table 14. Daily Operations Cost – Estuary Dredging .................................................................49Table 15. Cost of Hydraulic Dredging for Estuary Alternative ...................................................49Table 16. Daily Operations Costs for Marina Dredging..............................................................58Table 17. Cost of Dredging at 3-Years for Marinas ....................................................................59Table 18. Daily Operations Costs for Port Dredging ..................................................................60Table 19. Cost of Dredging at 3-Years for Port Berth.................................................................60Table 20. Cost timelines for the Estuary Alternative with marina and port dredging: 2008 costs,no escalation..............................................................................................................................62Table 21. Cost timelines for the Estuary Alternative with marina and port dredging: escalation at3.5 percent annually, interest rate at 4.875 percent annually .......................................................62


Moffatt & Nichol Page 1DREDGING REPORT FINAL-080822.DOC 8/22/2008
1. Introduction1.1 BackgroundCapitol Lake was created in 1951 through the construction of the Capitol Dam, whichdisconnected the Deschutes River from Budd Inlet. The construction of the dam in 1951 fulfilledthe 1911 vision of architects White and Wilder by providing a reflecting pool for the State CapitolBuilding.
Capitol Lake is increasingly unsustainable in its current configuration. Sediment from theDeschutes River and Percival Creek is filling in the lake, such that the flood storage isinadequate; environmental concerns mean that ongoing dredging of the lake is increasinglydifficult and expensive. The lake is on the state list of impaired waterbodies for fecal coliformbacteria and total phosphorus. The noxious weeds purple loosestrife and eurasian milfoil areinvading the lake. The need for a new lake management plan surfaced in 1996, when the Statewas attempting to gain permits for the construction of Heritage Park on the eastern shore of theNorth Basin and maintenance dredging the Middle Basin and Percival Cove.
The Capitol Lake Adaptive Management Plan (CLAMP) was developed in response to theseconcerns (CLAMP Steering Committee 1999). A key Management Objective in the 2002CLAMP 10-Year Plan (CLAMP Steering Committee 2002) was to complete a study that wouldevaluate the possibility of a restored estuary as an alternative to the continued managementactions necessary to maintain a lake in this setting.
1.2 Existing Conditions and Future AlternativesThe purpose of this report is to develop an understanding of the costs, methods, and schedulesassociated with the dredging elements of the different possible future management alternatives:continued management of the lake as a lake, and restoration of the Deschutes Estuary with orwithout a separate reflecting pool.
Figure 1 illustrates the existing condition of the lake, including the current bathymetry. The lakeis divided into three main basins by the BNSF Railroad Trestle and the I-5 Bridge, as shown.Deschutes Parkway runs along the west side of the North and Middle Basins; Percival Cove is afreshwater wetland connected to the Middle Basin by a bridge under Deschutes Parkway.
Three future alternatives are considered in this report:
• Lake Dredging. This alternative would continue the lake in essentially its currentconfiguration. An initial dredging project would remove nearly one million cubic yardsof material from the lake basin; periodic future dredging within the lake would clear outseveral tens of thousands of annual sediment input from the Deschutes River.
• Estuary Dredging: Single Basin. This alternative would restore the Deschutes Estuary byremoving the Capitol Dam. Among the actions included in the estuary restoration is a pre-dredge of the lake, to create the anticipated main estuary channel, and placement ofthe dredged materials to create intertidal habitat along the western shoreline, adjacent toDeschutes Parkway (Moffatt & Nichol 2007).
• Estuary Dredging: Dual Basin. This alternative would restore the Deschutes Estuary byremoving the Capitol Dam. The difference between the Single Basin and Dual Basinalternatives is that a separate reflecting pool will be constructed in the eastern part of theNorth Basin.

Page 2 Moffatt & Nichol8/22/2008 DREDGING REPORT FINAL-080822.DOC
Figure 1. Existing ConditionsUnder both estuary restoration alternatives, immediately after the Capitol Dam is removed,significant reworking of sediment in the existing lake basins will take place. The sediment will betransported downstream into Budd Inlet, where a significant portion will settle in the marinabasins and the Port’s deep draft berth in the West Bay of Budd Inlet (USGS 2006, 2008b).
MiddleBasin
NorthBasin
SouthBasin
PercivalCove
Dam
BNSFRailroadTrestle
I-5 Bridge
DeschutesParkway

Moffatt & Nichol Page 3DREDGING REPORT FINAL-080822.DOC 8/22/2008
Consequently, one further dredging project must be considered:
• Dredging in the West Bay Marinas and at the Port. This is considered as part of the long-term maintenance associated with the estuary restoration alternatives.
Figure 2 shows the affected marinas and port area, as well as historical industrial uses, in BuddInlet.
Figure 2. Budd Inlet and Capitol Lake
West Bay Marina
One TreeMarina
Martin Marina
SwantownMarina
BUDD INLET
OlympiaYacht Club
FiddleheadMarina
Port ofOlympia
WESTBAY
EASTBAY
Hardel MutualPlywood
Cleanup Site
Reliable SteelCleanup Site
Cascade PoleCleanup Site
CAPITOL LAKE
CapitolLake dam
Percival Landing(City of Olympia)
Marine TerminalShipping Berths(Port of Olympia)


Moffatt & Nichol Page 5DREDGING REPORT FINAL-080822.DOC 8/22/2008
2. Dredge Material Characteristics2.1 Physical and Chemical Characteristics
2.1.1 Capitol Lake
Sediments in Capitol Lake are generally a loose mixture of sand and silt, with relatively little clay(CLAMP 1999; Herrera 2000a; USGS 2008b). Sediments from samples taken at the southwestpart of the lake consist of a layer or organic material over dark gray silty sands; sediments fromsamples taken at the northeast part of the lake consist of less organic material over olive gray siltysands and gravels. Sediment cores of the lake bottom indicate that below 15 to 20 feet of theloose silty sand material is underlying dense glacially-derived sand and gravel (CLAMP 1999).This denser material would not be affected by any of the dredging proposals considered in thisdocument.
Within the past decade, sampling by Herrera was conducted (Herrera 2000a&b) to evaluategeneral sediment quality with respect to reuse of in-water materials as near-shore fill. MarineSediment Management Standards (SMS) criteria were used for this evaluation because the criteriafor freshwater sediment have not been established at this time. The data generally indicate thefollowing:
• Benzoic acid, benzyl alcohol and phenol are present in sediment samples at three stationsat concentrations that could potentially affect aquatic organisms. Additional chemicalanalysis would likely be required prior to approval for use as in-water fill; however, thematerial may be suitable for use as upland fill.
• General sediment quality at the remaining stations appears to be potentially suitable forboth in-water and upland fill. The analyses reported by Herrera (2000a&b) were notsufficiently sensitive to detect all of the relevant organic compounds at concentrationsthat would prohibit their reuse as near-shore fill, according to the marine SMS evaluationcriteria.
A recent study conducted by the Washington State Department of Ecology looked at Budd Inletsediments to determine the extent of dioxin and furan contamination (SAIC 2008). Surfacesediments from Capitol Lake were also sampled as part of this study to determine the chemicalmakeup of sediments that could enter Budd Inlet under the Estuary Alternative. More sampleswere obtained from Budd Inlet than from Capitol Lake. However, overall, Capitol Lake sedimentsamples had lower dioxin/furan toxicity equivalents (TEQs) (2.0 pg/g to 3.9 pg/g) than did BuddInlet (2.9 to 60.3 pg/g TEQ, with an average of 19.1 pg/g TEQ). A picogram per gram (pg/g) isthe equivalent of one part per trillion.
The 2008 SAIC report concluded that there are no direct sources of dioxins and/or furanscurrently located in Capitol Lake. The observed low levels of dioxins and furans in the lake maybe the remnants of periodic flushing of the lake with marine waters (performed periodically sinceconstruction of the Capitol Dam in 1951) which may have introduced the dioxins to the lakesediments. They may also be the remnants from other historical industrial activities in the lake orupstream the Deschutes River.
It appears that the sediment quality in Capitol Lake is mixed but that, in terms of its chemicalcharacteristics, most is adequate for open water and upland disposal as fill. The majority of thesediment is too fine to be suitable for structural fill. Detailed information regarding thedewatering characteristics of the sediment is not available.

Page 6 Moffatt & Nichol8/22/2008 DREDGING REPORT FINAL-080822.DOC
2.1.2 Budd Inlet
Ecology recently conducted investigations in Budd Inlet to determine the extent and possiblesources of dioxin contamination of sediments (SAIC 2008). The investigation began in the areascheduled for maintenance dredging by the Port of Olympia. Dioxins were found throughoutBudd Inlet and the highest levels were observed in sediments near stormwater discharge pipes(e.g., near the outfall adjacent to the One Tree and Fiddlehead Marinas) and the Port ofOlympia’s shipping berths (Figure 2). Most likely, dioxin contamination has resulted fromstormwater runoff, historical industrial use of shore areas (e.g., Cascade Pole) and fallout fromsmoke stacks.
Dioxin/furan concentrations for the Budd Inlet surface sediment samples ranged from 2.9 to 60.3pg/g (TEQ), with a mean of 19.1 pg/g TEQ (SAIC 2008). Samples from the north end of BuddInlet had the lowest levels and West Bay had levels closer to 19.0 pg/g TEQ (SAIC 2008). Thehighest concentrations in the West Bay were in the vicinity of the Hardel Mutual Plywood andReliable Steel sites.
Some analysis was also completed for metals, semi-volatile organic compounds, andpolychlorinated biphenyls (PCBs) (SAIC 2008). The most common contaminants identified,which exceeded Sediment Management Standards (SMS) were the phenols and hexachloro-benzene and were in the vicinity of the Hardel Mutual Plywood and Reliable Steel sites.
2.2 Biological CharacteristicsA number of noxious weeds have been observed in or around Capitol Lake: Purple Loosestrife,Yellow Flag Iris, and Eurasian Milfoil. Without appropriate control and management, they cancreate monoculture conditions which can be destructive to habitat, fish and wildlife.
Purple loosestrife (Lythrum salicaria) is a non-native invasive weed introduced to North Americain the 1800s as an ornamental and garden plant. Currently it is designated as a Class B NoxiousWeed in Washington, which means that it is designated for control of existing stands andprevention of new infestations. It is under quarantine in Washington per the WashingtonAdministrative Code (WAC) 16-752-400-415, and requires a Washington State Department ofAgriculture (WSDA) permit to transport any sediment within Washington that may containpurple loosestrife seeds. This is relevant to the open water disposal of sediments as well asWSDA often comments on these types of issues to the DMMO.
Purple loosestrife is an emergent aquatic perennialand has a prolific root system. Each plant cangrow up to 9 feet tall and produce up to 2 millionseeds. The plant blooms pink to purple (Figure 3)from July to October.
Purple loosestrife is an especially hardy andtenacious plant. When it invades a wetland orshoreline, it can choke out native plants. It alsohas the potential to spread to other areas if notcontained or controlled, and this is a majorconsideration for dredging in Capitol Lake.
Figure 3. Purple loosestrife(Source: flickr.com)

Moffatt & Nichol Page 7DREDGING REPORT FINAL-080822.DOC 8/22/2008
The fruit of the plant is a small oblong capsule (Figure 4); each capsule contains up to 100 smallseeds (Knezevic 2003). The tiny brown seeds are 0.4 × 0.2 mm in dimension (approximatelyequivalent to silty sand) and 0.5 to 0.6 mg in weight (USGS 2008c). The seeds of purpleloosestrife can be easily moved by wind, water, animals, and birds; can germinate on bare soilwith germination rates upwards of 95% (Knezevic 2003); are tolerant of marine shorelineconditions; and can lay dormant for up to 20 years.
Figure 4. Purple loosestrife capsules (left) and seed next to dried capsules (right)(Source: Knezevic 2003)
Purple loosestrife was first found in Capitol Lake in 1986 (General Administration 2002). Sincethis time, a lake-wide eradication program has been underway and the number of plants along theshorelines has been steadily declining. In 2000, an 80% reduction in purple loosestrife wasobserved (General Administration 2002). Today, fewer purple loosestrife plants can be foundaround Capitol Lake but they have not yet all been eradicated.
Very little purple loosestrife has been observed in Budd Inlet (Thurston County Noxious WeedControl Board [TCNWCB] 2008). A small patch is located on Port of Olympia property close tothe East Bay and south of Swantown Marina (see Figure 2 for the location). No purple loosestrifeis located along the shoreline of Budd Inlet’s West Bay, where the Deschutes River historicallydischarged into Puget Sound.


Moffatt & Nichol Page 9DREDGING REPORT FINAL-080822.DOC 8/22/2008
3. Offsite Disposal Options3.1 IntroductionThe disposal sites and dredging methods have the most significant impacts to the project cost.One of the most cost-effective disposal options – open-water disposal – is available only for cleanmaterial, and (as described below) may not be available for the Capitol Lake sediments becauseof the purple loosestrife seeds. The most expensive option – upland disposal at a landfill site – iscertain to be available for all but the most contaminated sediments, which are not believed to bepresent in Capitol Lake or in Budd Inlet. Further options include a range of potential beneficialreuse projects. At present, one such possibility – mine reclamation at the Lakeside IndustriesCentral Aggregate Pit near Centralia – has been identified. This possibility may not be availableat the time it is needed; others may become available.
In addition to the offsite disposal options described in this section, there is an onsite disposaloption – placement of material dredged from one area in Capitol Lake to another area – that isavailable for material pre-dredged from Capitol Lake under the Estuary Restoration alternatives(Sections 6 and 7). Onsite disposal is described in Section 6.3.
3.2 Open-Water Disposal
3.2.1 Available Open-Water Disposal Sites
The Dredge Material Management Program (DMMP) is a multi-agency organization thatmanages dredged material in Washington and was designed to make decisions on what isconsidered clean and contaminated sediment in Puget Sound. The DMMP Committee includesrepresentatives from the U.S. Army Corps of Engineers (USACE) – Seattle District (acts as leadagency), the Environmental Protection Agency (EPA) – Region 10, the Washington Departmentof Ecology (Ecology); and the Washington Department of Natural Resources (DNR) and includesdredged material management programs such as the Puget Sound Dredged Disposal Analysis(PSDDA) program.
Dredged material in Puget Sound that meets DMMP guidelines (material is tested using chemical,bioassay, and bioaccumulation testing methods) can be permitted for open water disposal at oneof eight different sites (Figure 5). There are five non-dispersive sites (low currents, disposalmaterial remains on site) and three dispersive sites (high currents, quick dispersal of disposalmaterial from site).

Page 10 Moffatt & Nichol8/22/2008 DREDGING REPORT FINAL-080822.DOC
Figure 5. Puget Sound open-water disposal sites (Source: DMMO 2008a)
The two open-water disposal sites closest to Capitol Lake are Anderson-Ketron Island andCommencement Bay. The round-trip distance to the Anderson-Ketron Island disposal site isapproximately 47 miles (41 nautical miles), while the round-trip distance to the CommencementBay disposal site is 86 miles (75 nautical miles). The disposal fee at both disposal sites is $0.45per cubic yard.
Figure 6. Open-water disposal sites closest to Capitol Lake: Anderson-KetronIsland (left) and Commencement Bay (right)

Moffatt & Nichol Page 11DREDGING REPORT FINAL-080822.DOC 8/22/2008
3.2.2 Current Availability for Materials Dredged from Capitol Lake
As described in Section 2.1, the material in Capitol Lake is assumed generally clean and suitablefor open-water disposal, except for the presence of purple loosestrife seeds. The presence of theseseeds (purple loosestrife is a Class B noxious weed in the State of Washington) has significantimplications for open-water disposal, because the seeds float and because it is not known howrapidly they will be degraded in the presence of salt water.
Moffatt & Nichol representatives met with the DMMP Committee on June 5, 2008 to discuss thepossibility of open-water disposal of materials dredged from Capitol Lake. The DMMPCommittee stated that the closer Anderson-Ketron Island site would not be a suitable site forunconfined disposal due to its proximity to the Nisqually River delta and the very high-valuewetland habitat at the Nisqually National Wildlife Refuge. The potential for purple loosestrifeseeds to disperse to this wildlife refuge is too great and the U.S. Army Corps of Engineers(USACE) would not grant a permit for disposal in this area. For similar reasons, the ThurstonCounty Noxious Weed Control Agency has indicated that unconfined beneficial reuse of thesediment in Budd Inlet – for example, in beach nourishment – would not be acceptable.
The possibility of placing the material at the Anderson-Ketron Island site encapsulated ingeotubes was discussed. The DMMP Committee ruled this concept out because the USACE isrequired to carry out physical monitoring – that is, coring – at the site. The geotubes would eitherinterfere with this monitoring, or they would be breached in the course of the monitoring and thepurple loosestrife seeds would be released into the environment.
The DMMP Committee indicated that unconfined open water disposal at Commencement Baymay be acceptable: Commencement Bay is located in a more urbanized shoreline environment, sonoxious weed control may be a lesser (although still very present) concern. Initial discussionswith the Pierce County Noxious Weed Coordinator have indicated that there would be hurdles toovercome; the County would prefer not to receive any sediment that may contain purpleloosestrife seeds. The Washington State Department of Agriculture would be in a position toblock this proposal by refusing to grant a permit to transport the material. However, given theDMMP Committee is prepared to contemplate open-water disposal in this area, and neither PierceCounty nor WSDA has ruled out the site, this should be considered a potential disposal site.
3.2.3 Future Availability for Materials Dredged from Capitol Lake
It can be anticipated that at some point in the future, the purple loosestrife and other noxiousweeds in the lake will be eliminated or controlled to a level such that the seeds cease to be aconcern. Consequently, it may be possible for materials dredged from Capitol Lake in the futureto be disposed of at Anderson-Ketron Island.
3.2.4 Availability for Materials Dredged from the Marinas and Port
Material that may be dredged from the West Bay marinas and the Port of Olympia is not believedto contain purple loosestrife seeds: however, it may contain chemical contaminants (particularlydioxins and furans) beyond that permitted for open-water disposal. Currently, dioxins and furansin sediments have been assessed on a case-by-case basis. Dioxin levels in the sediments to bedisposed of are compared to dioxin levels of sediments located in or near the disposal sites.Currently, average dioxin levels cannot exceed approximately 2.1 TEQ for the CommencementBay disposal site or 3.6 TEQ for the Anderson-Ketron Island disposal site (DMMO 2008b).
Dioxin and furan contaminants results largely from past industrial uses. Therefore, in the near-term it is likely that a fraction of the material will not be suitable for open-water disposal atAnderson-Ketron Island. Assuming the material becomes cleaner over time as the contaminantsare removed, a greater fraction should be suitable for open-water disposal in the future.

Page 12 Moffatt & Nichol8/22/2008 DREDGING REPORT FINAL-080822.DOC
3.3 LandfillUpland disposal at a permitted landfill facility is generally available for disposal of sediments.However, this is a relatively costly alternative.
The two landfill sites that have been identified are Rabanco’s Roosevelt Regional Landfill inKlickitat County, Washington, and Waste Management’s Columbia Ridge Landfill & RecyclingCenter near Arlington, Oregon (Figure 7). Both facilities have road (truck) and rail access. Theyalso, indirectly, have barge access via the Columbia River: however, there would be an additionalcost to haul the material from the barge dock to the land fill and this is not considered cost-effective. Recent estimates from these sites are approximately $72 per cubic yard ($45 per ton)for rail transport and disposal fees for Roosevelt landfill and approximately $80 per cubic yard($50 per ton) for rail transport and disposal fees for Columbia Ridge landfill.
Figure 7. Nearest upland disposal sitesMaterial disposed of at landfills is often required to pass the “paint filter” test, which limits thewater content. However, this appears not to apply to material dredged from Capitol Lake at thetwo landfills considered here. At Rabanco’s Roosevelt site in Washington, material dredged fromthe Puget Sound (most likely including Capitol Lake) is exempt from water content limitations.At Waste Management’s Columbia Ridge site in Oregon, non-hazardous material is exempt fromwater content limitations.
RooseveltRegional Landfill
WasteManagement, Inc.

Moffatt & Nichol Page 13DREDGING REPORT FINAL-080822.DOC 8/22/2008
3.4 Beneficial ReuseBeneficial reuse includes a wide variety of opportunities to use dredged material for a productivepurpose. The objective of beneficial use of dredged material is to make the traditional placementof dredged material unnecessary or reduce the required volume of disposal. The USACErecommended categories of beneficial uses (USACE 1987) are as follows:
• Habitat restoration/enhancement (wetland, upland, island, and aquatic);• Beach nourishment;• Aquaculture;• Parks and recreation (commercial and non-commercial);• Agriculture/horticulture/forestry;• Mine and quarry reclamation;• Landfill cover for solid waste management;• Shoreline stabilization;• Industrial and commercial use;• Material transfer (fill, levees, roads, etc.); and• Construction material.
Some of the most plausible uses listed above were investigated in more detail by M&N. Thecriteria for disposal at these sites – including chemical criteria and the presence of noxious weeds– will vary from site to site.
3.4.1 Habitat Restoration or Enhancement, or Beach NourishmentThe material is not well-suited for wetland or aquatic habitat restoration / enhancement, or forbeach nourishment, because of the purple loosestrife seeds. If the material were contained withina geotube, it could potentially be used in a habitat restoration / enhancement project. For example,a filled geotube could be buried under sand as part of a beach nourishment project: the geotubewould provide additional protection to the area upland of the beach nourishment in the event thatstorm waves eroded the placed sand. At present, M&N has not identified any suitable habitat orbeach nourishment projects in the south of Puget Sound. It is possible that a suitable project couldbe identified through the update of the Thurston County Shoreline Master Plan, which is in itsearly stages.
3.4.2 Mine and Quarry ReclamationM&N has identified one quarry reclamation site: Lakeside Industries Central Aggregate Pit nearCentralia. Rail access to this pit is available. The tipping fee is estimated at $3 to $4 per cubicyard (D. Smith, personal communication, 2008).
3.4.3 Industrial and Commercial Use/Construction and Material Transfer
Possible upland uses include using the sediments as fill for the construction of industrial andcommercial upland sites. This use would be supported by the Thurston County Noxious WeedControl Board (TCNWCB) as would other alternatives where the sediment would be capped byconcrete, asphalt, or other material as any purple loosestrife seeds in the sediment would not beable to germinate.
Unfortunately the majority of the sediment is of limited structural value because of its grain sizecharacteristics – generally, structural fill should be at a minimum the size of medium sand. Onepossible exception is material dredged from sediment traps in the South Basin and/or the southend of the Middle Basin as part of the maintenance dredging under the Lake Alternative (Section

Page 14 Moffatt & Nichol8/22/2008 DREDGING REPORT FINAL-080822.DOC
5.2.2). This material is anticipated to be coarser than the sandy silt and silty sand found over themajority of the lake.
M&N contacted the Washington State Department of Transportation (WSDOT) to solicit interestin the finer material, but little response has been received (T. Baker, personal communication,2008). The material could be encapsulated in a geotube and used as a levee core: however,USACE staff were not aware of any available projects of this type (D. Weber, personalcommunication, 2008).
3.4.4 Capping Material for Cleanup Sites and Landfill Cover for Solid WasteManagement
Budd Inlet marinas (both private and public) along with the Port and City of Olympia havediscussed the need for a Budd Inlet site that could be used to dispose of their dredged sediments(General Administration 2008). If such a site was eventually considered an appropriate means ofdealing with Budd Inlet sediments (currently most contain dioxins, furans, and othercontaminants of concern as defined by the Environmental protection Agency [EPA] andEcology), the Capitol lake sediments could be contained within a geotube and used as cappingmaterial. Obviously this type of use would require considerable coordination and negotiationswith a number of agencies and parties, but it also has the potential to provide a realistic resolutionfor a number of issues faced by projects in Budd Inlet.
3.4.5 Parks and RecreationThe use of dredged material as fill for Thurston County’s Department of Parks and RecreationLand was investigated in 2000 (CLAMP 2000). At that time, Parks and Recreation was willing toaccept Capitol Lake material for two identified park projects (Chehalis Western Trailhead Park,Off-Road Vehicle Park) as long as the material was capped with at least six inches of soil free ofpurple loosestrife, and the site was revegetated.
This option is still viable although no specific projects have been identified.
3.4.6 Agriculture (Composting, Topsoil, Soil Recycling)M&N investigated the possibility of disposal options at composting facilities. This option wasoriginally investigated in 2000 (CLAMP 2000). As originally identified, composting is not afeasible alternative. Nearby composting facilities cannot handle the quantity of material proposedfor the project (J. Burke, personal communication 2008), nor does composting generate enoughheat to kill purple loosestrife seeds (R. Johnson, personal communication 2008). Due to the riskof spreading purple loosestrife seeds, composting and distribution of the dredged material totopsoil companies would not be allowed by the TCNWCB (R. Johnson, personal communication2008). While purple loosestrife seeds could be destroyed by soil recycling, in which organics areremoved from sediments by exposure to high heat (450 to 800 degrees F), TPS Technologiesestimated in 2000 that it would take 3 months to sterilize 20,000 cubic yards of sediment at theirTacoma site (CLAMP 2000). This option is therefore ruled out.
3.5 SummaryThe following feasible disposal sites, or potential disposal options, have been identified for thematerial dredged from Capitol Lake and Budd Inlet’s West Bay under the Lake Managementalternative.

Moffatt & Nichol Page 15DREDGING REPORT FINAL-080822.DOC 8/22/2008
• Open-Water Disposal:
o Anderson-Ketron Island: This is the closer of the two open-water disposal sites. Itmay be available for some or all of the materials dredged from Budd Inlet’s WestBay as maintenance dredging associated with the Estuary Restoration Alternatives. Itmay also be available for future maintenance dredging of Capitol Lake if purpleloosestrife is eliminated.
o Commencement Bay: This may be available for material dredged from Capitol Lake.Will require coordination with the Pierce County Noxious Weed coordinator andwith WSDA (G. Haubrich, personal communication 2008): may require mitigationfor purple loosestrife seeds.
• Upland Disposal:
o Roosevelt, Klickitat County, WA: Disposal at a landfill is reasonably certain to beavailable. Hauling by railcar has been included in quoted costs.
o Columbia Ridge, Arlington, OR: Considerations are similar to the Roosevelt site.
• Beneficial Reuse:
o Quarry Reclamation: Lakeside Industries near Centralia appears to be available formaterial dredged from Capitol Lake. It would be necessary to dewater the materialsufficiently that it can be spread with a bulldozer.
o Nearshore Restoration, with placement in geotubes: This is a relatively costly option– probably no less expensive than transportation to a landfill. Additionally, nosuitable site in Thurston County has been identified.
o Construction Fill: A suitable construction site capable of accepting fill material ismost likely to be identified in the future for the relatively coarse material dredgedfrom sediment traps. Given the high costs associated with hauling material by truck,the site would need to be at 20 miles distance or less.


Moffatt & Nichol Page 17DREDGING REPORT FINAL-080822.DOC 8/22/2008
4. Dredging and Associated Technologies4.1 Mechanical DredgesMechanical dredges remove bottom sediment through direct application of mechanical forces todislodge the sediment at near in-place densities.
The most common mechanical dredge consists of a crane or derrick permanently mounted on afloating barge (Figure 8). Because there is no direct water access between Budd Inlet and CapitolLake, the dredge equipment must be trucked in and assembled at the site. The need to truck thepieces of dredge equipment will require the use of smaller barges and track-mounted cranes,which limit the dredging rate and efficiency. Smaller barges will also be required for dredgingwithin the Budd Inlet marinas, because of the limited fairway size.
Figure 8. Typical derrick crane dredge with clamshell bucket (left); close-up ofbucket (right)Portable crane buckets, which could potentially be launched into Capitol Lake, can range in sizefrom 1 to 3 cubic yards, while much larger buckets are available in open water. The ability to digmaterials of increasing density and hardness improves with increased bucket weight, whichcreates the necessary force to fracture the material and break it out of the cut. Depending on craneand bucket size, the dredging rate for a single clamshell dredge varies from 75 to 200 cubic yardsper hour.
Another form of mechanical dredge is the excavator mounted on a pontoon or small barge (Figure9). An excavator on a track-mounted barge (Figure 10) is also a feasible equipment choice fordredging shallow water or marshy areas (e.g., for maintenance dredging in the South Basin ofCapitol Lake). Buckets typically range in size from 1 to 7 cubic yards. Depending on crane andbucket size, anticipate dredging rates from 50 to 150 cubic yards per hour for a barge-mountedexcavator.

Page 18 Moffatt & Nichol8/22/2008 DREDGING REPORT FINAL-080822.DOC
Figure 9. Typical excavator dredge
Figure 10. Excavator dredge on track-mounted bargeAll mechanically dredged material is placed onto a scow or flat-deck (haul) barge positionedalongside the dredge. The scow or barge transports the material directly to an offshore disposalsite, or transports it to shore where it is offloaded onto trucks or rail and transported to an uplanddisposal site.
Barges and scows are sized according to their carrying capacity. Flat-deck barges are most oftensized by the weight they are able to carry, while scows are most often sized by the volume. Forconsistency, this report describes both barges and scows in terms of the volume of sediment theyare able to carry.
4.2 Portable Hydraulic DredgesA hydraulic dredge uses a centrifugal pump to entrain the solid materials at a suction intake, andpumps the water and sediment slurry through a pipeline to a deposition area. The slurry istypically 5% to 20% solids by volume (in place). Therefore, a large quantity of water must bedealt with in this type of operation.
The size of a hydraulic dredge is indicated by the diameter of the intake/suction line to the pump.Portable hydraulic dredges, which would be needed for dredging within Capitol Lake, range insize (as determined by the suction line diameter) from 10-inches to about 16-inches. Theserelatively small dredges would also be suitable for dredging within the marinas.

Moffatt & Nichol Page 19DREDGING REPORT FINAL-080822.DOC 8/22/2008
The types of hydraulic dredges are usually classified by the cutting mechanism just ahead of theintake line to the pump. These include cutter head, bucket wheel, and auger head dredges.
The most common and most versatile hydraulic dredge is the cutter head dredge (Figure 11),which uses a rotating basket with a cutting surface ahead of the suction intake. The cutter headexcavates and translates the bottom materials into the influence of the suction intake. A cutterhead dredge with an intake size between 10- and 16-inches would have a production rate of 100to about 400 cubic yards per hour, respectively. Comparable slurry flow rates are in the range of2,000 to 8,000 gallons per minute (gpm), respectively, based on a water content of 85 percent.
Figure 11. Cutter head dredge (left), close-up of cutter head (right)The vertical bucket wheel head (Figure 12) is a vertical rotating wheel with small buckets on theperiphery of the wheel. The buckets excavate the sediment and convey it to the suction intake.Portable bucket wheel hydraulic dredges typically come in the same size range as the cutter headdredges. A bucket wheel dredge with an intake size of between 10- and 16-inches would have asimilar production rate to a cutter head dredge: between 100 and 400 cubic yards per hour.
Figure 12. Typical bucket wheel dredgeAuger head dredges are rarely larger than 12-inches, rarely exceed a production rate of 100 cubicyard per hour, and are used primarily for dredging in municipal lagoons and ponds. Because ofthe low production rate, auger head dredges are not considered further here.
The dredged material is transported as slurry through a pipeline to a dewatering site, to a dumpscow for open-water disposal, or directly to an open-water disposal site. The pipe material isusually steel (for highly abrasive sediments) or plastic (HDPE). If the material must betransported a distance greater than about 4,000 feet, a booster pump must be installed in the line.This is a common practice, but the booster pump does add cost to the project.

Page 20 Moffatt & Nichol8/22/2008 DREDGING REPORT FINAL-080822.DOC
The discharge pipeline from the dredge can be floated on top of the water or be ballasted alongthe bottom. Once it reaches the shoreline, the pipeline is generally laid out on the ground(although it can be raised over obstacles such as roads or buried under them).
4.3 Equipment LaunchSince the lake is land-locked, any dredge or barge must be transported by land, assembled on-site,and placed in the lake. Furthermore, the BNSF Railroad Trestle (Figure 13) is an effective barrierto barges attempting to move between the North and Middle Basins. This limits the size, and tosome extent the operations, of dredges and associated equipment.
Figure 13. BNSF Railroad TrestleThe most convenient site for access to the lake is Marathon Park. Barges and associatedequipment can be launched in both the North and Middle Basins from this location (navigationbetween the Middle and South Basins is not problematic). Alternative equipment launch pointsfor the Middle and South Basins are Capitol Lake Interpretive Park, at the south end of theMiddle Basin, and Tumwater Historical Park adjacent to the North Basin. Capitol LakeInterpretive Park is constructed in part of previously dredged material and may include lenses offine and soft material (Rittenhouse-Zeman and Associates 1982): the soils at this location may notbe adequate to support the heavy equipment needed to launch the dredges and associatedequipment. The water at Tumwater Historical Park is shallow and the channels are relativelynarrow, but it appears that the equipment could be launched there.
The barges on which the dredges are mounted, and material transfer barges used with mechanicaldredges (see Section 4.1), would likely be trucked to the site in segments. Several companiesfabricate truckable barge segments (modules) and tugs. For example, the modular barge sectionscreated by Robishaw Engineering, the FlexiFloat system, can be transported on a flatbed truckand assembled in place: see Figure 14 and Figure 15 for an example of this system in use.Modular barge sections come in a variety of sizes ranging in widths from 8 to 12 feet, lengthsfrom 10 to 50 feet, depths from 4 to 7 feet, and module weights from 3 to 20 tons.
Mechanical dredges will consist of cranes or excavators mounted on a barge. Hydraulic dredgesare usually equipped with an integrated barge hull. A mobile crane of at least 100-ton capacitycan be used to set up the equipment at the launch site and to lift each barge module or tug unitinto the lake.
Once in the lake, the modules are assembled together to form an equipment barge or a materialtransfer barge. For mechanical dredges, an excavator or crane is lifted, or more likely driven, ontothe equipment barge and secured (chained down) to the barge deck. Since the hydraulic dredgecomes with its own barge hull, a single lift can place it in the water. Containment skirts can bemounted to the decks of the material barges to help retain the dredged sediment.

Moffatt & Nichol Page 21DREDGING REPORT FINAL-080822.DOC 8/22/2008
Figure 14. Modular barge system in use (source: www.flexifloat.com)
Figure 15. Layout of modular barge system (source: www.flexifloat.com)Tugs or skiffs would be launched into the lake directly from Marathon Park or (for the MiddleBasin) potentially from one of the other launch sites shown in Figure 16. While this reportassumes a tug would be used, a skiff is another possibility: Skiffs have a low profile, and couldpotentially navigate under the BNSF Railroad Trestle if the water is relatively low. Truckabletugs range in size from 20 feet × 8 feet × 3 feet draft, 135 hp, and weighing 5 tons up to 32 feet ×14 feet × 6 feet draft, 710 hp and weighing 15 tons.

Page 22 Moffatt & Nichol8/22/2008 DREDGING REPORT FINAL-080822.DOC
Figure 16. Potential launch sites for lake-bound equipment
4.4 DewateringMaterial that is dredged hydraulically and is destined for upland disposal must be dewateredbefore being placed on railcars or trucks. Dewatering of slurries reduces the amount of water inthe slurry, increasing the solids concentration and making the material suitable for handling,transportation, and disposal. Dewatering of the slurry is most often performed by settling in apond.
A settling pond can be created on any relatively flat parcel of land. The sides of a settling pondare typically constructed of local or imported soil pushed up into a perimeter dike or large stackedconcrete block to form a perimeter wall. The discharge end of the slurry pipeline is allowed toempty into the pond. The end of the slurry pipeline may be moved about the pond by a wide-trackor low-pressure-tired vehicle (bulldozer, front-end load, or excavator) to spread the material out.If the pipeline discharge remains stationary, the material may be spread about by bulldozer. Afterthe dredged sediment has settled and been dewatered, the sediment is removed from the pond fortransport to the disposal facility.
Unfortunately, settling ponds require a relatively large area. The most convenient site for asettling pond in the vicinity of Capitol Lake is the abandoned gravel pit west of Marathon Park.Initial calculations suggest it is, at best, barely possible for this site to be sufficient to dewaterhydraulically dredged material at the production rates required here. Only if the sedimentcharacteristics are such that the material settles out and dewaters within a week to ten days –extremely unlikely given the high silt content – could the site physically handle the material. Inaddition, the regulatory agencies would have to allow the return of turbid water to the lake – thereis not space available for a secondary settling pond on the site. This is also unlikely. Previousassessments of gravity dewatering either assumed a much lower sediment quantity, based ondredging of sediment traps rather than the entire lake (General Administration 1996), or ruled out
Capitol LakeInterpretivePark
MarathonPark
TumwaterHistoricalPark

Moffatt & Nichol Page 23DREDGING REPORT FINAL-080822.DOC 8/22/2008
gravity dewatering as infeasible (CLAMP Steering Committee 2000). This report does notconsider further the option of a settling pond for the treatment of hydraulically dredged material.
Additional dewatering alternatives include centrifuges, filter presses, and drying ovens. Acentrifuge was tested as part of a pilot study to dewater Capitol Lake sediments in 1995 (Entranco2000a). The centrifuge did not handle the coarser (sand-sized) fraction of the sediment well(Entranco 2000a; J. Bachmeier, personal communication, 2008). Generally, these methods are tooexpensive and too slow for the anticipated rate of dredging.
Some dewatering may be necessary for mechanically dredged material, depending on therequirements of the eventual disposal site. It may be adequate to dewater the sediment overnighton the material transport barge, with the supernatant (the relatively clear water remaining after thesediment settles out) pumped back into the lake. Another alternative is cement-basedsolidification / stabilization of the sediment. Portland cement is added to the sediment to absorbthe excess water. The cement reacts with the water to chemically bind the water and dry thematerial (Austin 2004). This method is relatively costly ($20 to $30 per cubic yard). However, ifthe majority of the dredged material drains adequately this is an attractive alternative for theremainder.
It is critical to test the settling and dewatering characteristics of the dredged material beforemoving further forward with the design and environmental process.
4.5 GeotubesGeotubes are large passive filter tubes manufactured from construction-grade geotextiles. Thetubes can be manufactured in a variety of circumferences and lengths. Circumferences typicallyrange from 7 to 90 feet, and lengths range from 10 feet to 300 feet.
The empty tubes are typically rolled out onto a flat surface. The tube is filled through inlet spoutsat evenly spaced intervals along the length of the tube. The discharge pipeline can be connectedto a manifold that directs the slurry to one or more inlet spouts on one or multiple tubes. Thewater is filtered through pores in the geotube, and the sediment (with purple loosestrife seeds) isretained within the tube. The water is channeled or pumped back into the lake. The operationcontinues until the tube has reached its capacity, then the tube is allowed to sit idle while theslurry water drains away the sediment consolidates. When the sediment in the tube has reachedoptimum consolidation, the tube is transported to the disposal site. Figure 17 illustrates geotubesin a dewatering application.
Figure 17. Geotubes used in dewatering (source: Tencate)There are several options for handling the tubes once the sediment has been drained. If drained ona pallet, the pallet with geotube can be loaded onto a truck and hauled to a selected disposal site.The filled geotube can be hauled and placed along an eroding shoreline to form the core for ashore protection project. The filled geotube can also be hauled and placed along a river to formthe core of a levee or dike. Geotubes can be filled in the hold/hull of a split-hull barge, the barge

Page 24 Moffatt & Nichol8/22/2008 DREDGING REPORT FINAL-080822.DOC
towed to an open-water disposal site, and the geotube released into the water column to settle onthe bottom.
The advantages of geotubes are the lack of moving parts (passive dewatering) and their ability toretain the purple loosestrife seeds. The main disadvantages are that the cost is relatively high ($8to $60 per cubic yard for the cost of the geotubes alone), and the tubes are difficult to move oncefilled. To use geotubes efficiently, they need to be filled at their final resting place. Since noappropriate beneficial reuse option has been identified, this alternative is not considered further.
4.6 Selection of Dredging MethodHydraulic dredging can be very cost-effective under certain conditions: if the dredged materialscan be transported by pipeline to a nearby offshore disposal site, or if there is upland spaceavailable for gravity dewatering prior to transport to an upland disposal site. For the projectalternatives considered here, neither condition holds.
Hydraulic dredging is relatively cost-effective – and is described in this report – for offshoredisposal with the water and sediment slurry transported on towed scows or barges. For uplanddisposal, it does not appear to be feasible to dewater the slurry at the required production rates.Even if it is possible – if the slurry dewaters more rapidly than anticipated – it appears thathydraulic dredging would be only slightly more cost-effective than mechanical dredging. Giventhe very significant uncertainties in the feasibility of rapidly dewatering hydraulically dredgedmaterial from Capitol Lake, this report assumes mechanical dredging for upland disposal.

Moffatt & Nichol Page 25DREDGING REPORT FINAL-080822.DOC 8/22/2008
5. Lake Dredging5.1 Overview of Dredging Needs
5.1.1 Initial Dredging
Under the Lake Alternative, a significant initial dredging project will be performed to regainmuch of the flood storage lost over the half-century since construction of the Capitol Dam in1951. Initial dredging is assumed to take place in the North and Middle Basins (a relatively smallamount will be dredged from the South Basin: this is included with the Middle Basin for thisdiscussion). The lake will be dredged to a uniform elevation of -7.2 feet NGVD29, which is thesill elevation of the Capitol Dam. This corresponds to a lake depth of about 13 feet during thesummer months, based on the summer lake level of +6.22 feet NGVD29, consistent with theManaged Lake Alternative defined by the CLAMP Technical Work Group (CLAMP TechnicalWork Group 2007).
The optimal lake depth for biological purposes is a minimum of 15 feet. However, there areconcerns that lowering the lake bottom below the sill elevation of the dam could increasesaltwater intrusion into the lake. Additionally, dredging to a lower elevation would not increasethe flood storage, since the lake cannot be drawn down below the sill elevation – the additionalvolume would be dead storage. Consequently, this report assumes the less costly alternative ofdredging to -7.2 feet NGVD28.
No dredging will occur within 100 feet of the shoreline (taken at +10 feet NGVD29). The fullyellow line in Figure 18 illustrates the outline of the proposed dredging. A relatively large part ofthe North Basin already is currently at an elevation below -7.2 feet NGVD, so the dredge area andvolume are much smaller here compared to the Middle Basin. Table 1 gives the dredge areas andvolumes for the Lake Alternative.
Table 1. Dredge areas and volumes for the lake dredging
Basin Area(acres)
Volume(cy)
North Basin – dredge to a distance 100-feet from the shoreline 48.8 158,000Middle Basin – dredge to a distance 100-feet from the shoreline 94.9 717,000
Total Dredge Area and Volume 143.7 875,000
5.1.2 Maintenance Dredging
The quantity of material deposited in the lake by the Deschutes River has averaged 35,000 cubicyards annually (USGS 2006). This is assumed the average quantity for future maintenance dredging.
Part of the maintenance dredging could be accomplished by constructing and maintainingsediment traps. Sediment traps are formed by excavating or dredging a depression in the bottomof a waterway. Sediment-laden runoff encounters the larger cross-sectional area created by thedepression, the flow velocity decreases, and the sediment settles into the sediment trap.
In order to be effective in the long term, sediment traps require regular surveys and maintenancedredging. In the past, sediment traps have been excavated in both the South and Middle Basins ofCapitol Lake. However, maintenance dredging of these traps has been haphazard at best. Thisreport assumes that sediment traps in Capitol Lake will be re-excavated in the same generalvicinity as those constructed in 1979 (General Administration 1996): see the red broken line inFigure 18. Based on a dredge depth of 4-feet below the existing lake bed (South Basin) or the

Page 26 Moffatt & Nichol8/22/2008 DREDGING REPORT FINAL-080822.DOC
dredged lake bed at -7.2 feet NGVD29 (Middle Basin), the dredge volume for the sediment trapsshown here is 55,000 cubic yards.
Figure 18. Existing lake bathymetry, proposed dredge footprint (full yellow line),and outline of potential sediment traps (broken red line)Maintenance dredging of the sediment traps will be done as needed (see Section 5.1.2 for details).Since much of the finer material transported to the lake by the Deschutes River will bypass thetraps, it will also be necessary to dredge the Middle and North Basins periodically.
North Basin
Middle Basin
South Basin
100 feetminimum

Moffatt & Nichol Page 27DREDGING REPORT FINAL-080822.DOC 8/22/2008
5.2 Permitting and Regulatory Process
5.2.1 Initial DredgingThe overall impact of the Lake Dredging alternative on the environment may be consideredsignificant even if it is considered maintenance dredging by some definitions of the term.
The following list outlines the most likely regulatory and permitting requirements that will beneeded for this alternative.
Environmental Review
• National Environmental Policy Act (NEPA): Federal funds may be needed for a projectof this magnitude, which would trigger specific NEPA requirements.
• State Environmental Policy Act (SEPA) Environmental Impact Statement (EIS):Required. Washington State Department of General Administration will probably be leadagency for this.
Permits and Approvals
• Washington Department of Natural Resources (DNR) Lands Lease: An aquatic landslease, easement, or right of entry may be required. Additionally, depending on how thedredge materials are handled, a royalty may be owed to the State. Further sedimenttesting can be anticipated for most of the disposal options currently identified. If sedimentdisposal occurred at a gravel mine, a DNR Reclamation Plan would be required.
• U.S. Army Corps of Engineers (Corps) Section 10/404 Permits: These are initiatedthrough the Joint Aquatic Resource Permit Application (JARPA). A Section 10 permit isrequired for work in or under navigable waters of the United States; a Section 404 Permitis required for in-water discharge of dredged or fill material. Copies of the completedJARPA will then be submitted to the Corps for Section 10/404 Permits, to WashingtonDepartment of Fish and Wildlife (WDFW) for a Hydraulic Project Approval (HPA), andto the Cities of Olympia and Tumwater for a Shoreline Substantial Development Permit.
• BE/BA, including the Essential Fish Habitat: The BE/BA is required due to federal nexuswith Corps permitting. A BE/BA report with a Not Likely to Adversely Affect (NLAA)or Likely to Adversely Affect (LAA) effects determination will be needed.
• Washington Department of Ecology (Ecology) Section 401 Water Quality Certification:Required with federal permitting, triggered by the Corps.
• Ecology National Pollution Discharge Elimination System (NPDES) Stormwater Permitfor Construction: Will be required.
• Washington State Department of Fish and Wildlife (WDFW) HPA: Initiated through theJARPA process. Required as activity is waterward of the Ordinary High Water Mark(OHWM).
• Washington State Department of Agriculture (WSDA) permit for transportation ofsediments containing purple loosestrife (WAC) 16-752-410 – Rules Relating to LythrumQuarantine. Permit Contact: G. Haubrich.
• City of Olympia and City of Tumwater Permits and Approvals:
o Shoreline Substantial Development Permits: Required as project involves substantialwork within 200 feet of an aquatic shoreline. Since most of the South Basin and parts

Page 28 Moffatt & Nichol8/22/2008 DREDGING REPORT FINAL-080822.DOC
of the Middle Basin are within the City of Tumwater, a combined or parallel processwould be required for the Cities of Olympia and Tumwater.
o Critical Areas Ordinance: Compliance and mitigation required to the extent projectwould affect designated wetlands, fish and wildlife habitat areas.
o Noise Variances: Due to in-water work window constraints (work in or along theshorelines of both fresh and marine water bodies is often only allowable for a specifictime of the year), some material handling may need to be completed after 7:00 PM(WAC 173-60-040, City of Olympia Municipal Code 18.40.080, City of TumwaterMunicipal Code 18.40.030, 8.08). Variances may be granted via municipal codes andWAC 173-60-080.
• Other local permits and approvals may include: Demonstrating compliance with Zoningand Comprehensive Plan; Grading Permit; Site Development Permits; Thurston CountyWaste Disposal and Special Use permit; and others.
• Easements (rights granted by property owners) may be required for shoreline propertiesalong the South Capitol Neighborhood area (southeast Capitol Lake). Some of the privatetidelands in this area extend further waterward than 100 feet from shore.
The time scale and process associated with federal, state, and local permitting can be anticipatedto be a minimum of 4 to 5 years.
Mitigation and Monitoring Requirements
Mitigation and monitoring requirements for this alternative would be identified and definedduring the environmental review phase. Conditions applied to permits and approvals are likely toinclude: the use of Best Management Practices during dredging; limiting dredging to specific in-water work windows; monitoring lake water quality; and (for upland disposal) covering allrailcars during transportation.
Monitoring for purple loosestrife could well be required. With upland disposal, inspections ofeach stream crossing along the transportation route could be required for up to three years. Ifopen-water disposal is permitted, WSDA and/or the DMMP Committee would very likely requiremonitoring along areas of the shoreline considered likely to be affected.
5.2.2 Maintenance Dredging
Future maintenance dredging would need to undergo a separate environmental review. A full EISwould most likely not be required if maintenance dredging were to occur at a more regularfrequency than in the past. Regular maintenance dredging is often SEPA exempt or, at most,could be determined as nonsignificant (a SEPA Determination of Nonsignificance is referred toas a DNS).
Future maintenance dredging would also require in-water permits and approvals similar to thoseidentified for the initial dredging. Additional sediment testing may be required in response toongoing modifications to the controlling regulations.
5.2.3 Work WindowsEndangered plants, animals, and aquatic species (such as the federally listed Chinook salmon,Puget Sound steelhead, and bull trout) are the responsibility of the National Oceanic andAtmospheric Administration (NOAA) Fisheries, National Marine Fisheries Service (NMFS) andthe U.S. Fish and Wildlife Service (USFWS), collectively referred to as “the Services”. TheServices are charged with implementing the Endangered Species Act (ESA). The ESA requires

Moffatt & Nichol Page 29DREDGING REPORT FINAL-080822.DOC 8/22/2008
federal agencies, such as the US Army Corps of Engineers (USACE), to consult with the Servicesprior to funding, authorizing, or taking any action that might harm a listed species or degradetheir habitat. Aquatic resources (such as significant salmonid habitat) are also the responsibility ofthe Washington Department of Fish and Wildlife (WDFW).
Figure 19 shows some of the current fish windows (timeframes where in-water work is notpermitted) for the Budd Inlet/Olympia areas (WAC 220-110-271, USACE 2001, WDFW 1999).If the Services were to impose all of these fish windows, no in-water work would be allowed.
Figure 19. Published fish windows for OlympiaThis report makes the preliminary assumption that only the Chinook salmon and bull troutwindows will be observed, with minor restrictions at other times. That is, the report assumes thatthe in-water work window lasts for seven months from mid-July to mid-February each year. Therationale for this general assumption is based on the likely effects of dredging on the differentspecies. For example, there are no known surf smelt or sand lance marine spawning beacheswithin a mile of Capitol Lake. As a result, these windows are unlikely to affect the constructionschedule.
Fresh water work windows can be more restrictive. Work in Thurston County fresh water streamsis often restricted to July through September (WDFW 1999) and chinook, coho, and steelhead alloccur in Capitol Lake (ESA Adolfson 2008). Project-specific studies to identify species presenceor absence, together with coordination and negotiation with the regulatory agencies, will beneeded to define the exact in-water work window for this project.
5.3 Initial Dredging Methods and Costs
5.3.1 OverviewThis report considers three options for the initial lake dredging:
• Mechanical dredging followed by railcar transportation to the Columbia Ridge landfillsite in Arlington, OR;
• Mechanical dredging followed by railcar transportation to the Lakeside Industries quarryreclamation site near Centralia; and
• Hydraulic dredging followed by unconfined disposal at Commencement Bay.
These have very different unit costs. The reason for considering all three alternatives, rather thanonly the least costly, is that it is not certain that the second and third options will be available. It isvery possible that it will prove impossible to obtain the necessary permits for open-water disposalat Commencement Bay, given the presence of purple loosestrife. The quarry pit may not beavailable by the time the project is under way. By including the most costly option of uplandlandfill, it is ensured that a technically feasible alternative is considered.

Page 30 Moffatt & Nichol8/22/2008 DREDGING REPORT FINAL-080822.DOC
5.3.2 Mechanical Dredging to Landfill or Quarry Site
Mechanical dredging is assumed to consist of two portable (and lake-bound) barge-mountedcranes with clamshell buckets. It is assumed two dredges will be used, with clamshells sized at 3cubic yards. Initially, one dredge will operate in the North Basin and one in the Middle Basin:once North Basin dredging is complete, both dredges will operate in the Middle Basin. With anaverage production rate for each dredge of 110 to 120 cubic yards per hour, the overall dailyproduction rate will be 1,600 cubic yards based on an 8-hour shift with 7 hours of effectivedredging. This will allow 875,000 cubic yards to be dredged in 550 working days, within four 7-month in-water work windows.
The material dredged from the lake will be loaded onto a material transfer barge which, whenfull, is towed to a temporary transfer dock, one each along the North Basin and Middle Basinshoreline, constructed alongside Deschutes Parkway. The material is stockpiled on the bargesduring each day, and loaded onto railcars (gondolas) at night. Eight barges with a 200-cubic yardcapacity are able to stockpile one day’s worth of dredging. Free water in the barges will beallowed to overflow back into the lake or will be pumped overboard into the lake before thebarges arrive at the transfer facility.
Based on a similar mechanical dredging and transfer process used on the Hylebos WaterwayDredging Project for the Port of Tacoma (G. Hartman, personal communication), the sediment islikely to be dry enough to transfer directly to the railroad gondolas without dewatering, or at mostwith overnight dewatering on the barge. If overnight dewatering is carried out then additionalbarges will be needed. However, the Lakeside Industries quarry reclamation site near Centraliaonly accepts material capable of being reworked by bulldozer. This further limits the acceptablewater content of the material. It may be necessary to dewater the mechanically dredged lakesediment for this disposal site. Additional dewatering is not necessary for the landfill sites.
An alternative dewatering method is cement-based solidification / stabilization. Portland cementis mixed on the barge using a backhoe or at the temporary dock using a blending head mountedon the end of a backhoe/excavator arm. A two to five percent volume mix of cement to sedimentswas used at a Port of San Diego project prior to offloading sediment from the barge (Austin2004), and for costing purposes this report assumes a five percent mix will be needed for 30percent of the dredged sediment. A bag test, in which sediment is held in a bag and allowed todrain freely, will be needed to determine the actual requirements.
After dewatering (if necessary), the stockpiled material is transported onto gondolas, which arestored on the north spur of the railroad track. Tacoma Rail would store empty gondolas at one oftheir railyards in east or south Olympia, and would bring the empties in each day to the rail spurwest of Deschutes Parkway north of the railroad bridge. The gondolas would be loaded at nightusing a combination of excavator, trucks, and conveyor from each transfer dock. The excavatorwould unload the small barges into trucks (four trucks needed), the trucks would haul the materialand dump it into a hopper along the rail spur, and a conveyor belt would load the material fromthe hopper into the railcars. The operation would most likely occur at night, with flaggers alongthe route or potentially with Deschutes Parkway closed to traffic for periods at night.
Approximately 2,000 feet of track remain along the rail spur, sufficient to store approximately 36gondolas. Each gondola is able to hold 65 cubic yards of sediment, so there is storage availablefor 2,340 cubic yards, more than a day’s worth of dredge material. The gondolas would be movedto Tacoma Rail’s railyard, and eventually transported to the landfill, the Lakeside Industriesquarry reclamation site near Centralia, or to another site for beneficial reuse.

Moffatt & Nichol Page 31DREDGING REPORT FINAL-080822.DOC 8/22/2008
Figure 20 illustrates the material handling described here.
Figure 20. Possible rehandling layout at Marathon ParkTable 2 gives an average daily cost for the operation. This daily cost provides for dredging thematerial; transporting the material to the temporary dock shown in Figure 20; and rehandling andhauling the material along Deschutes Parkway where it is loaded onto railcars.
North Basintemporary dock
Middle Basintemporary dock
Haul route alongDeschutes P’way
Rail route
Stacked rail carsfor loading

Page 32 Moffatt & Nichol8/22/2008 DREDGING REPORT FINAL-080822.DOC
Table 2. Daily Operations Cost – Mechanical Lake Dredging
Daily Operation Costs Daily Costper Unit
Units Total DailyCost
Mechanical dredge, 3 CY clamshell onbarge with 200-ton crane
$5,000 2 $10,000
Towing tug, 210 hp $1,700 2 $3,400Tender tug, 710 hp $3,500 2 $7,000Barge, 200 CY $600 8 $4,800Excavator, truck (4), conveyor combination $8,200 2 $16,400
Total daily operation cost $41,600
Mobilization/demobilization, rail transportation to the disposal site, and material disposal fees arein addition to this daily cost. Table 3 includes these additional costs, together with the costs fortransportation to and disposal at a landfill site. The equivalent unit cost is $138 per cubic yard.
Table 3. Cost of Mechanical Dredging to Landfill
Item Unit Qty Unit Cost ExtendedCost
(millions)Mobilization/Demobilization LS 1 $1.3M $1.3Temporary transfer docks SF 3,000 $200 $0.6Daily operation costs (Table 2) DAY 550 $41,600 $22.9Disposal, upland landfill, includes rail haul CY 875,000 $80 $70.0Construction Cost $94.8Contingency (30% on operations) $7.4Contingency (15% on landfill disposal) $10.5WSST (8.9%) $8.4Total Cost $121.1
Table 4 is similar to Table 3, except that it shows the costs for disposal at the reclamation site inCentralia. Disposal costs at the reclamation site are less than the disposal sites at the landfill.However, there are additional costs associated with dewatering the material sufficiently for thissite. First, it is assumed the material is dewatered under gravity on the barges – requiring anadditional 8 barges to stockpile the material. This increases the daily operation costs. Second, anallowance is provided for cement-based solidification. As mentioned above, physical testing ofthe sediments is needed to determine the extent of this solidification – both the percent admixtureand the fraction of dredged sediments for which this is needed. The equivalent unit cost,assuming a five percent cement admixture for 30 percent of the material, is $74 per cubic yard.

Moffatt & Nichol Page 33DREDGING REPORT FINAL-080822.DOC 8/22/2008
Table 4. Cost of Mechanical Dredging to Reclamation Site
Item Unit Qty Unit Cost ExtendedCost
(millions)Mobilization/Demobilization LS 1 $1.3M $1.3Temporary transfer docks SF 3,000 $200 $0.6Daily operation costs (Table 2 but 16 barges) DAY 550 $46,400 $25.5Cement-based solidification CY 262,500 $26 $6.8Disposal, reclamation site, includes rail haul CY 875,000 $14 $12.3Construction Cost $46.5Contingency (30%) $14.0WSST (8.9%) $4.1Total Cost $64.6
5.3.3 Hydraulic Dredging to Open-Water Disposal
Hydraulic dredging will require two portable 16-inch hydraulic dredges. As with the mechanicaldredging, initially one dredge will operate in each of the North Basin and Middle Basin, and thesecond dredge will move to the Middle Basin after the North Basin dredging is complete. With anaverage production rate for each dredge of 170 cubic yards per hour, the overall daily productionrate will be 2,400 cubic yards based on an 8-hour shift with 7 hours of effective dredging. Thiswill allow 875,000 cubic yards to be dredged in 365 working days. With a five-day work week,this is more than two 7-month in-water work windows. It seems likely that the work could beperformed within two work windows, by increasing the shift to 10-hours, working 6 days perweek, or negotiating an extended work window with the regulatory agencies.
The slurry contains a water content by volume of about 80 to 85 percent, so the volume of slurryproduced will be in the range of 14,000 to 19,000 cubic yards per day. This slurry is pumpedthrough pipelines, one for each dredge, ending at a manifold that directs the slurry into a split-hulldump scow moored at a mooring facility in the West Bay of Budd Inlet. The mooring facility isminimal, consisting of a dolphin with catwalk or similar construction: most likely the dolphinswould be left in place for future use in maintenance dredging. The pipelines are routed throughthe earthen levee under 5th Avenue in a bored casing. Booster pumps will be needed to move thematerial to the mooring location.
Figure 21 illustrates the general layout of a single pipeline and scow. The main constraints on thelocation of the mooring are that the water be deep enough for the loaded scows, and that themooring be out of the navigation channel. Another possibility is to moor the scow at the Port ofOlympia.
The dredged material is transported by scow to the Commencement Bay open-water disposal site,a roundtrip distance of 75 nautical miles, where the material is dumped from the split-hull scow.A full 13-hour working day is estimated to make one round trip. Twelve scows holding 1,500cubic yards would be needed to service a daily quantity of 18,000 cubic yards of slurry. Thisscow size is typical of equipment available in the Puget Sound region.

Page 34 Moffatt & Nichol8/22/2008 DREDGING REPORT FINAL-080822.DOC
Figure 21. Possible material transfer layout at the 4th / 5th Avenue Bridges
Pipeline
Mooredscow

Moffatt & Nichol Page 35DREDGING REPORT FINAL-080822.DOC 8/22/2008
Table 5 gives a daily operations cost for this alternative, while Table 6 gives a typical overallcost. The overall cost includes an allowance for monitoring and removal of purple loosestrife thatmay be released into the vicinity of Commencement Bay through these operations.
Table 5. Daily Operations Cost – Hydraulic Dredging
Daily Operation Costs Daily Costper Unit
Units Total DailyCost
Hydraulic dredge, 16-inch, on barge $5,200 2 $10,400Tender tug, 710 hp, 8-hour day $3,500 2 $7,000Towing tug, 1,000 hp, 13-hour day $9,300 12 $111,600Split-hull scow, 1,500 CY, 13-hour day $900 12 $10,800Booster pump $1,600 2 $3,200
Total daily operation cost $143,000
Table 6. Cost of Hydraulic Dredging to Commencement Bay
Item Unit Qty Unit Cost ExtendedCost
(millions)Mobilization/Demobilization LS 1 $1.3M $1.3Mooring Dolphins LS 1 $1.6M $1.6Pipeline, Booster Pumps, and Tunneling LS 1 $200,000 $0.2Daily operation costs (Table 5) DAY 365 $143,000 $52.2Disposal fee, Commencement Bay CY 875,000 $0.45 $0.4Purple loosestrife mitigation ALL 1 $3.0M $3.0Construction Cost $58.7Contingency (30%) $17.6WSST (8.9%) $5.2Total Cost $81.5
The equivalent unit cost is $93 per cubic yard.
5.4 Maintenance Dredging Methods and Costs
5.4.1 Overview
Continued maintenance dredging in Capitol Lake is likely to involve two elements. First, thesediment traps in the southern end of the Lake can be cleaned out and regularly dredged by smallmechanical dredges. This can be expected to remove much of the coarsest material transported tothe Lake from Deschutes Parkway. Assuming the material is largely sand-sized, it would be moreuseful as construction fill or for other beneficial reuse compared to the silty sand found in muchof the Lake. Additionally, by limiting the dredging to a small lake area, the environmentalimpacts associated with this activity are restricted.
Second, the lake as a whole must be regularly dredged. This would be carried out in a mannersimilar to that described for initial lake dredging in the previous section. The material resultingfrom this overall lake dredging will be largely the finer materials – silty sand to sandy silt with a slight admixture of clay.

Page 36 Moffatt & Nichol8/22/2008 DREDGING REPORT FINAL-080822.DOC
Sediment traps are considered in this report because of the possibility that the unit cost ofdredging and disposing of material from the traps may be less than the corresponding cost formaterial from the lake as a whole. The analysis below suggests that the unit costs for maintenancedredging in the dredging the sediment traps may be less than the unit costs for initial lakedredging ($70 per cubic yard or more), but similar to the cost of hydraulic dredging with disposalat Anderson-Ketron Island (a possibility after purple loosestrife is eradicated from Capitol Lake).Therefore, even if a relatively large fraction of the sediment bypasses the traps, they may have aplace in future management of the lake.
5.4.2 Sediment TrapsMuch of the sediment transported into Capitol Lake will bypass the sediment traps. In the period1991 to 1996, only 14 percent of the sediment that accumulated in the lake was deposited in thesediment trap (Entranco 1997).
The efficiency of the sediment traps could be higher than this in the future. First, the 1997sediment volume analysis showed that 20 percent of the sediment accumulated in the channels ofthe North Basin. Much of this material could be collected by a new (or cleaned out) sediment trapin the North Basin. Second, the Middle Basin sediment trap has not been maintained in recentyears – reducing its efficiency. A reasonable maximum trapping efficiency of 25 percent is usedin this report.
The most cost-effective approach to dredging depends on the quantity and characteristics of thematerial that settles in the sediment traps. The material will be coarser than the typical mix ofsandy silt and silty sand, which makes it much more likely to be usable as construction fill. If thisis not the case, or if significant quantities of material do not settle in the traps, then it may not beworthwhile to maintain the traps. The assumed trap capacity is similar to that considered earlierby the State (General Administration 1996): approximately 55,000 cubic yards. It is assumed thetraps would be cleaned out when approximately 40,000 cubic yards have settled – every four tofive years based on a 25 percent trapping efficiency.
Specific disposal locations for this material have not been identified. Given the material quantitiesare much smaller than the 875,000 cubic yards generated by the initial lake dredging, and giventhat the material is likely to be suitable for construction or other beneficial reuse, it appearsplausible that suitable locations will be found over the life of the project. In the long-term, it canbe assumed the purple loosestrife will be eradicated, further increasing the usefulness of thematerial. The costs provided here assume a maximum, 20-mile radius to the beneficial reuse site.
Sediment in the traps will be mechanically dredged using a small barge-mounted crane withclamshell bucket sized at 3 cubic yards – similar to the dredging equipment used for the initiallake dredging, except only a single dredge will be used. For the South Basin, the dredge must fitunder the I-5 Bridge. Since the pier spacing is approximately 80 feet (Entranco 2000b) this is nota significant limitation. The material dredged from the traps will be loaded onto a small bargewhich, when full, will be towed to a temporary transfer dock at the shore close to the CapitolLake Interpretive Park and Deschutes Parkway. A front-end loader or excavator will transfer thedredged material from the barge to dump truck(s) which will haul the material to a local (within20 mile radius) beneficial use site.
Based on a production rate of 100 to 110 cubic yards per hour over a 7-hour day, the 40,000 cubicyards in the sediment traps will be dredged in about 60 days or two and a half months. Fourbarges with a capacity of 200 cubic yards and a single tug are assumed to service the dredge.Based on a truck with 20 cubic yards capacity, 40 truck-trips per night will be needed. Assuminga truck can make the round trip in two hours gives 10 trucks to complete the work in an 8-hourshift.

Moffatt & Nichol Page 37DREDGING REPORT FINAL-080822.DOC 8/22/2008
Based on these assumptions, Table 7 and Table 8 give costs for mechanical dredging with truckhaul to a beneficial reuse site.
Table 7. Daily Operations Cost – Dredging Sediment Traps
Daily Operation Costs Daily Costper Unit
Units Total DailyCost
Mechanical dredge, 3 CY clamshell onbarge with 200-ton crane
$5,000 1 $5,000
Towing tug, 210 hp, 8-hour day $1,700 1 $1,700Barge, 200 CY $600 4 $2,400Front-end loader or excavator $1,600 1 $1,600Truck, 20 CY capacity $1,100 10 $11,000
Total daily operation cost $21,700
Table 8. Cost of Dredging Sediment Traps
Item Unit Qty Unit Cost ExtendedCost
(millions)Mobilization/Demobilization LS 1 $250,000 $0.2Temporary transfer facility LS 1 $150,000 $0.2Daily operation costs (Table 7) DAY 60 $21,700 $1.3Construction Cost $1.7Contingency (30%) $0.5WSST (8.9%) $0.1Total Cost $2.3
The equivalent unit cost is $58 per cubic yard. As is clear from the daily cost breakdown in Table7, the cost of this dredging alternative is dramatically affected by the availability of disposal sitesin the near vicinity. If a disposal site in the near vicinity can be identified, this could be a verycost-effective option for some of the future dredging. With the assumptions given here, the unitcost of dredging the sediment traps is similar to the unit cost of overall lake dredging.Consequently, the question of sediment trap effectiveness does not greatly affect the overall costor feasibility of the lake alternative.
5.4.3 Overall Lake Dredging
It is anticipated that the finer materials (silts and clays) will bypass the sediment trap, it will benecessary to periodically dredge the entire lake. For planning purposes, we assume that the lake isdredged when about 25 percent of the lake storage generated by the initial dredging is lost – thatis, about 220,000 cubic yards, based on an initial lake dredging of 875,000 cubic yards. If, asassumed above, 75 percent, or about 26,000 of the annual 35,000 cubic yards transported fromthe Deschutes River bypasses the sediment traps, overall lake dredging is anticipated once everyeight to nine years. If a large fraction of the material settles in the sediment traps, overall lakedredging is anticipated less often.
The methods, production rates, and unit costs would be similar to that for the initial dredging. Inaddition, it is assumed that the mooring dolphins in Budd Inlet, used by the scows that transportthe material offshore, are already in place for this case. Consequently, only some refurbishmentof this mooring facility would be needed on each occasion.

Page 38 Moffatt & Nichol8/22/2008 DREDGING REPORT FINAL-080822.DOC
Overall, the unit costs would be similar to those for the initial lake dredge, with slight differencesbased on different mobilization requirements. For all cases, the maintenance dredging could becarried out within a single in-water work window.
In addition, once the purple loosestrife is eradicated from Capitol Lake, it may become possibleto dispose of the material at the Anderson-Ketron Island site. The round-trip distance toAnderson-Ketron Island is 41 nautical miles, compared to 75 nautical miles for CommencementBay. This decreases the daily cost associated with the hauling tugs – the tugs can make a round-trip in less than an 8-hour day. For comparison, the round-trip to Commencement Bay takes 13hours. Table 9 gives a daily operations cost for this alternative, while Table 10 gives a typicaloverall cost.
Table 9. Daily Operations Cost – Hydraulic Dredging to Anderson- Ketron Island
Daily Operation Costs Daily Costper Unit
Units Total DailyCost
Hydraulic dredge, 16-inch $5,200 2 $10,400Tender tug, 710 hp, 8-hour day $3,500 2 $7,000Towing tug, 1,000 hp, 8-hour day $6,200 12 $74,400Split-hull scow, 1,500 CY, 8-hour day $600 12 $7,200Booster pump $1,600 2 $3,200
Total daily operation cost $102,200
Table 10. Cost of Hydraulic Dredging to Anderson-Ketron Island
Item Unit Qty Unit Cost ExtendedCost
(millions)Mobilization/Demobilization LS 1 $700,000 $0.7Restore Mooring Piles LS 1 $200,000 $0.2Pipeline, Booster Pumps, and Tunneling LS 1 $200,000 $0.2Daily operation costs (Table 9) DAY 92 $102,200 $9.4Disposal fee, Anderson-Ketron Island CY 220,000 $0.45 $0.1Construction Cost $10.6Contingency (30%) $3.2WSST (8.9%) $0.9Total Cost $14.7
The equivalent unit cost is $67 per cubic yard.
5.5 Cost Summary and TimelineThe costs associated with the Lake Alternative vary dramatically, depending on whether it isnecessary to transport the dredged materials – now and in the future – to a landfill site. The unitcosts for maintenance dredging differ slightly from those for initial lake dredging, because of theslightly different mobilization / demobilization requirements.

Moffatt & Nichol Page 39DREDGING REPORT FINAL-080822.DOC 8/22/2008
The unit costs for the different disposal alternatives are as follows.
Initial Lake Dredging:
• Landfill: $138 per cubic yard;
• Reclamation site: $74 per cubic yard;
• Commencement Bay: $93 per cubic yard.
Maintenance Dredging:
• Landfill: $143 per cubic yard;
• Reclamation site: $74 per cubic yard;
• Commencement Bay: $91 per cubic yard;
• Construction fill (sediment traps only): $58 per cubic yard;
• Anderson-Ketron Island (with purple loosestrife eradicated): $67 per cubic yard.
Even if landfill disposal is not necessary, an enormous number of different scenarios can be laidout, depending on the quantity of material that settles in the sediment trap, the extent of cementadmixture needed to solidify material destined for the reclamation site, whether purple loosestrifeis eradicated in the project lifetime, etc. This document does not attempt to cover all thesealternatives. To bound the range of potential costs, four summaries are given: three relativelyoptimistic cases, in which landfill disposal is not necessary, and a worst-case in which it isnecessary.
The following sequence of dredging events is assumed:
• Year 0: Initial lake dredging of 875,000 cubic yards.
• All cases except the worst-case: maintenance dredging every nine years over thesubsequent 50 years as follows:
o Year 5: 45,000 cubic yards dredged from the sediment trap;o Year 9: 40,000 cubic yards dredged from the sediment trap;o Year 9: 230,000 cubic yards dredged from the lake as a whole.
• Worst-case, with all material transported to the landfill site: 210,000 cubic yards dredgedevery 6 years from the lake as a whole.
The following methods and disposal alternatives are assumed:
• Low-cost case:
o Initial lake dredging: Disposal at the reclamation site;
o Maintenance dredging for years 1 through 9: Material from sediment traps placed at arelatively close construction site, at a cost 85 percent of that shown in Table 4;material from overall lake dredging disposed of at the reclamation site.
o Maintenance dredging for years 10 through 50: Material from sediment traps placedat a relatively close construction site, at a cost 85 percent of that shown in Table 4;material from overall lake dredging disposed of at Anderson-Ketron Island.

Page 40 Moffatt & Nichol8/22/2008 DREDGING REPORT FINAL-080822.DOC
• Medium-cost case:
o Initial lake dredging: Disposal at Commencement Bay;
o Maintenance dredging: Material from sediment traps placed at a relatively closeconstruction site, at a cost equal to that shown in Table 4; material from overall lakedredging disposed of at Commencement Bay.
• High-cost case: Disposal as for the intermediate-cost case, but costs 30 percent higher.
• Worst-case: All material is transported to a landfill site.
Table 11 gives a cost timeline for these four cases, in 2008 dollars. The costs are very similar(less than 5 percent different) if the sediment traps are eliminated.
Table 11. Cost timelines for the Lake Alternative: 2008 costs, no escalation
Year(s) Low-Cost($millions) 1
Medium-Cost($millions)
High-Cost($millions)
Worst-Case($millions) 2
0 $64.8 $79.6 $103.5 $120.81-9 $21.1 $25.7 $33.4 $30.0
10-18 $19.5 $25.7 $33.4 $60.119-27 $19.5 $25.7 $33.4 $30.028-36 $19.5 $25.7 $33.4 $60.137-45 $19.5 $25.7 $33.4 $30.046-50 3 $2.2 $2.6 $3.4 $30.0
Total Cost $166.1 $210.7 $273.9 $361.01. Costs decrease for the low-cost scenario after year 9, because it is assumed purple loosestrife is
eradicated.2. The worst-case scenario assumes a dredging event every 6 years; therefore the costs are not the same
for each nine-year period.3. Costs for this period are less because only a single cycle of dredging in the sediment trap occurs in this
five-year period.
Finally, Table 13 gives the cost timelines assuming initial construction in 2015 and escalation ofconstruction costs at 3.5 percent annually. The Net Present Value (NPV) of the total project costis also given, based on the 2008 Federal interest rate of 4.875 percent.
Table 12. Cost timelines for the Lake Alternative: escalation at 3.5 percentannually, interest rate at 4.875 percent annually
Year(s) Low-Cost($millions)
Medium-Cost($millions)
High-Cost($millions)
Worst-Case($millions)
2015 $82.4 $101.3 $131.7 $153.62016-2024 $36.1 $44.0 $57.2 $47.02025-2033 $45.4 $59.9 $77.9 $128.72034-2042 $61.9 $81.7 $106.2 $87.22043-2051 $84.4 $111.3 $144.7 $239.12052-2060 $115.0 $151.7 $197.2 $162.02061-2065 $15.8 $18.5 $24.1 $199.1
Total Cost $441.0 $568.5 $739.0 $1,016.8NPV of Total Cost $124.9 $157.5 $204.7 $266.0
Note: Numbers may not sum exactly due to rounding.

Moffatt & Nichol Page 41DREDGING REPORT FINAL-080822.DOC 8/22/2008
6. Estuary Dredging: Single Basin6.1 Overview of Dredging NeedsUnder the estuary restoration scenario, Capitol Lake will be dredged before the establishment oftidal flow. Material will be dredged from those areas of the lake due to become the main channelof the restored estuary, and will be placed along Deschutes Parkway to provide intertidal habitat.In addition to the habitat benefits, this will decrease the quantity of navigation dredging requiredat the marinas in the south end of Budd Inlet and at the Port of Olympia in the years immediatelyfollowing reintroduction of tidal flow into Capitol Lake.
Figure 22 illustrates the proposed bathymetry after the dredge and fill has occurred, together withthe outlines of the dredge and fill areas. Sections across the initial and dredged/filled bathymetryare shown in Figure 23, and dredge and fill quantities are shown in Table 13.
Table 13. Dredge and Fill Quantities for Estuary Alternative
Basin Area(acres)
Volume(cy)
North Basin – dredge in channel 8.0 42,000Middle Basin – dredge in channel and shoulders 40.8 352,000Total Dredge Volume 48.8 394,000North Basin – place along Deschutes Parkway 25.0 182,000Middle Basin – place along Deschutes Parkway 30.4 212,000Total Fill Volume 55.4 394,000
The proposed balanced dredge and fill plan is based on the predicted evolution of the DeschutesEstuary. Figure 24 illustrates the changes in the bathymetry of the lake in the first ten years afterremoval of the dam and restoration of tidal flow into the estuary, under the assumption that nopre-dredging or material placement takes place (USGS 2008a). The changes in bathymetry can besummarized as follows:
• A more definite main channel is formed through the North and Middle Basins;
• Deposition occurs on both sides of the main channel in the North Basin;
• The shoreline is generally stable or slightly erosional along the west shore of the MiddleBasin, adjacent to Deschutes Parkway.
The total dredge and fill volume proposed here is greater than the 180,000 to 360,000 cubic yardsassumed in the initial exploration of the proposed pre-dredging (Moffatt & Nichol 2007). This islargely because the previous work was based on the bathymetry three years post-restoration,rather than ten years post-restoration as used here.
A relatively large quantity of sediment – more than needed for protection of Deschutes Parkway –is placed on the west side of the North Basin. The reason for this is to maintain balanced cut andfill quantities, while placing sediment in stable or generally accretional areas. If more materialwere placed along the longer shoreline of the Middle Basin, much of the additional materialwould be placed in an erosional area, based on the USGS modeling results.
The east side of the North Basin remains untouched as a deposition area for the future evolutionof the estuary – allowing some of the 35,000 annual cubic yards of sediment carried by theDeschutes River to stay within the estuary rather than entering the marina basins in Budd Inlet.

Page 42 Moffatt & Nichol8/22/2008 DREDGING REPORT FINAL-080822.DOC
Figure 22. Proposed dredged bathymetry with dredge footprint (yellow line) andfill footprint (red line)
Elevation (feet,NGVD29)
Above 50 - 5
-5 - 0-10 - -5-15 - -10-20 - -15-25 - -20
Below -25
0.00 0.50(mile)
0.0
0.2
0.4
0.6
0.8
1.0
1.2
1.4
1.6
1.8
(mile
)
A
B
C

Moffatt & Nichol Page 43DREDGING REPORT FINAL-080822.DOC 8/22/2008
Section A - North Basin
-20
-15
-10
-5
0
5
10
15
20
0 250 500 750 1000 1250 1500 1750 2000 2250 2500 2750 3000
Distance (ft)
Elev
atio
n(ft
,NG
VD29
)
Year 0 Year 10 Pre-Dredged
Section B - Middle Basinat Causeway
-20
-15
-10
-5
0
5
10
15
20
0 250 500 750 1000 1250 1500 1750 2000 2250 2500 2750 3000
Distance (ft)
Elev
atio
n(ft
,NG
VD29
)
Year 0 Year 10 Pre-Dredged
Figure 23. Estuary and dredging sections

Page 44 Moffatt & Nichol8/22/2008 DREDGING REPORT FINAL-080822.DOC
Section C - Middle Basin at Wetlands
-20
-15
-10
-5
0
5
10
15
20
0 250 500 750 1000 1250 1500 1750 2000 2250 2500 2750 3000
Distance (ft)
Elev
atio
n(ft
,NG
VD29
)Year 0 Year 10 Pre-Dredged
Figure 23 (continued). Estuary and dredging sectionsAn alternative approach would be to decrease the quantity of material placed on the west side ofthe North Basin, and to remove some of the material from the lake entirely. For example,modeling and analysis during final design might show that a relatively stable estuaryconfiguration could be attained only if the initial pre-dredging and placement include a net exportof material – or that the quantity of material deposited in the marina basins in Budd Inlet wouldbe greatly reduced by exporting material at this stage. If it is possible to dispose of material fromCapitol Lake to Commencement Bay, and if further investigations of the material in Budd Inletshows that only landfill disposal can be permitted for this material, it would almost certainly becost-effective to remove material from the lake during the initial construction. In this case,because the estuary dredging would be performed before removal of the Capitol Dam, theconsiderations and methods would be the same as for the lake dredging.
6.2 Dredge Material DisposalDredge material disposal is not a significant consideration for the estuary dredging alternative,since the material dredged from the main channel is placed along the west shoreline of the lake.Thurston County’s noxious weeds coordinator has indicated that it will be acceptable forsediment potentially containing purple loosestrife seeds to be moved within the lake footprint (R.Johnson, personal communication, 2008).
If some of the material were to be exported from the lake at the initial pre-dredging phase, thedisposal alternatives and considerations would be the same as for the lake dredging alternative.However, at this time there is no reason to consider offsite disposal at the landfill sites.

Moffatt & Nichol Page 45DREDGING REPORT FINAL-080822.DOC 8/22/2008
Change in elevation(feet)
Above 105 - 104 - 53 - 42 - 31 - 2
0.01 - 1-0.01 - 0.01
-1 - -0.01-2 - -1-3 - -2-4 - -3-5 - -4
-10 - -5-15 - -10
Below -15
0.00 0.50(mile)
0.0
0.2
0.4
0.6
0.8
1.0
1.2
1.4
1.6
1.8
(mile
)
Figure 24. Predicted changes in the bottom elevation of the Deschutes Estuary inthe first 10 years, assuming no pre-dredging
6.3 Estuary Dredging Methods and Costs
6.3.1 OverviewThe most cost-effective method for the estuary dredging appears to be hydraulic. Withmechanical dredging, it would be necessary to rehandle the dredged materials, because a large

Page 46 Moffatt & Nichol8/22/2008 DREDGING REPORT FINAL-080822.DOC
fraction of the materials are dredged from the Middle Basin but placed in the North Basin andnavigation between the two basins is blocked by the BNSF Railroad Trestle.
With hydraulic dredging, the slurry containing dredged sediment would be pumped from thedredge footprint into the footprint of the fill areas (Figure 22). A barrier would be constructedalong the outer perimeter of the fill area to contain the slurry, allowing the sediment to settle out.
6.3.2 Containment Dike / BarrierOne possibility for this barrier is a dike constructed from ecology blocks. Prior to dredging, thelake water level would be lowered to the toe of the proposed fill – about -5 feet relative toNGVD29, or approximately 2 feet above Mean Lower Low Water (MLLW).
Up to 9,000 lineal feet of stacked-block dike will be needed along the shoreline of Capitol Lake.The blocks are 2.5 feet × 2.5 feet × 5 feet long and weigh approximately 4,300 pounds each. Theblocks would be stacked two to three high to form a diked area, or settling pond, to receivedredged sediments. Multiple subcells could be laid out to allow more control over the settlementof the sediments. Assuming an excavator can set a single stack of three blocks per hour, for a totaldistance of 40 feet per day, it could take as much as 225 days (11 months) for one excavator todike the designated perimeter of the lake. Most likely, two excavators with low-pressure wide-tracks, one working in each lake basin, would start a few weeks ahead of dredging to set dikeblocks, with further block setting done concurrently with dredging after that. A geotextile layerwith gravel is required as a foundation to minimize the sinking of the blocks in the soft lake bed.A biodegradable material could potentially be used in place of the geotextile.
A wide-track bulldozer or excavator will spread the slurry material as it settles out, pulling thematerials to the higher parts of the shoreline. Most, but probably not all, of the blocks can beremoved for reuse once settling is complete.
A potential problem with this approach is the low bearing capacity of the lake sediments: it ispossible that the sediments are so soft that the ecology blocks would sink deeply into the lakebottom. An alternative possibility is to use suspended steel plates or silt curtains to contain thedredge slurry. In this case, it would not be necessary to draw down the lake.
• The suspended steel plate dike consists of steel plates (similar to those that contractorsuse to cover street trenches) set in a line along the perimeter of the slurry discharge area.The steel plates are suspended from surface floats. The plates and chains are sized so thatthe lower half of the plate penetrates the soft mud. The suspended upper half of the plateforms the dike to hold the slurry mud in place.
• The silt curtain is an impermeable plastic or fabric sheet suspended in the water columnfrom floats, with a chain attached to the lower edge as a weight. The silt curtain isdeployed along the perimeter of the slurry discharge area. The curtain height would bedesigned so that the chain weight would penetrate into the soft lake bottom a foot or two.Gaps or meshed panels spaced along the upper edge would allow dredge water to returnto the lake.
The different diking options are illustrated conceptually in Figure 25. These illustrations assumethe slurry discharge area is divided into multiple subcells: this may not be necessary.

Moffatt & Nichol Page 47DREDGING REPORT FINAL-080822.DOC 8/22/2008
Figure 25. Diking options for the estuary placement

Page 48 Moffatt & Nichol8/22/2008 DREDGING REPORT FINAL-080822.DOC
6.3.3 Flocculent
Because the lake sediments are fine, it may take a considerable time for them to settle out of theslurry. To increase the settlement rate, it may be necessary to add a flocculent. One potentialflocculent is alum (aluminum sulfate).
Alum is used in water treatment plants to clarify drinking water and remove suspended solids inthe water. When alum is mixed with water, aluminum hydroxide is created which then binds withsuspended solids precipitating them out (Sutherland 1999). Alum is also used in lakes as anutrient inactivation product, to reduce the amount of the nutrient phosphorus in the water (Cookeet al. 1993; Welch and Cooke 1999). Alum treatment has been used in several Washington statelakes including Green Lake, Campbell Lake, and Pattison Lake (Herrera 2003).
The toxicity of flocculants such as alum is dependent on pH (Sutherland 1999). In the past it hasbeen assumed that as long as a pH of 6.0 or above was maintained, impacts to aquatic life wouldbe avoided (Cooke et al. 1993). However, further research on the topic may be necessary to verifyif this is still the case as more recent studies are beginning to show that other environmentalfactors may affect aluminum toxicity (Sutherland 1999), especially in fish. Other cationic andanionic polymer flocculants are available, but all flocculants would need to be tested specificallywith Capitol Lake sediments for dosage, effectiveness, and toxicity.
The selected flocculent would be pumped into the discharge pipeline about 200 feet from the endof the pipe. The flocculent would mix with the slurry and cause the finer sediments to grouptogether and settle out faster behind the containment dike. The cost of adding flocculent isdependent on the injection or dosing rate which cannot be known without batch testing on actualCapitol Lake sediment slurries.
The use of a flocculent would most likely require a permit from the Department of Ecology.Monitoring and water testing before, during, and after the use of the flocculent may be requiredfor parameters such as pH, alkalinity, and dissolved aluminum.
6.3.4 Sequencing, Schedule, and CostsTwo portable hydraulic dredges (each 16-inch) will be launched into Capitol Lake, one each intothe North and Middle Basins.
The discharge pipeline from each dredge will go to the settling pond in its respective lake basin.The settling pond in the North Basin will also need to receive sediment from the Middle Basin.When the middle settling pond is full, the pipeline from the Middle Basin dredge will be reroutedunder the BNSF Railroad Trestle to the settling pond in the North Basin. Similarly, after dredgingis complete in the North Basin, the dredge will be moved to the Middle Basin.
If the water in the lake is drawn down before the equipment is launched, the launch method willbe slightly different from that proposed for the Lake Alternative. One possibility is for thecontractor simply to launch before the lake is drawn down – this would tie up the equipment for a week or two while the lake is drawn down. Another possibility would be for the contractor toplace metal mats on the shoreline adjacent to the launch site. The dredge would be placed on themat to avoid sinking into the soft sediments. The dredge would then work its way into the mainchannel, dredging as it goes.
With an average production rate for each dredge of 170 cubic yards per hour, the overall dailyproduction rate will be 2,400 cubic yards based on an 8-hour shift with 7 hours of effectivedredging. This will allow 394,000 cubic yards to be dredged in 165 working days. With a 5-daywork week, this is a single in-water work window. However, given the dike building mustprecede the dredging, it can be expected that a second in-water work window will be needed.

Moffatt & Nichol Page 49DREDGING REPORT FINAL-080822.DOC 8/22/2008
Table 14. Daily Operations Cost – Estuary Dredging
Daily Operation Costs Daily Costper Unit
Units Total DailyCost
Hydraulic dredge, 16-inch $5,200 2 $10,400Tender tug, 710 hp $3,500 2 $7,000Booster pump $1,600 2 $3,200Bulldozer to smooth settling areas $2,200 2 $4,400
Total daily operation cost – dredging $25,000Excavators $3,000 2 $6,000Dike foundation mat $800 1 $800Sacrificial Ecology Blocks $200 8 $1,600
Total daily operation cost – diking $8,400
Table 15. Cost of Hydraulic Dredging for Estuary Alternative
Item Unit Qty Unit Cost ExtendedCost
(millions)Mobilization/Demobilization LS 1 $0.5M $1.3Pipelines and Booster Pumps LS 1 $200,000 $0.2Flocculent Treatment (per CY sediment) CY 394,000 $5 $2.0Daily operation costs (Table 14) – diking DAY 115 $8,400 $1.0Daily operation costs (Table 14) – dredging DAY 165 $25,000 $4.1Construction Cost $8.6Contingency (30%) $2.6WSST (8.9%) $0.8Total Cost $12.0
The equivalent unit cost is $30 per cubic yard.
6.4 Permitting and Regulatory ProcessThe overall impact of this estuary alternative on the environment is anticipated to be positive asthe lake will be restored to its natural and historic condition. This suggests that the regulatoryagencies will generally be supportive of the project.
The environmental review phase and permitting requirements for this alternative would be similarto that listed for the Lake Dredging Alternative except for the following elements.
• Thurston County Noxious Weed Control Board (TCNWCB) would not be as concernedwith the spread of purple loosestrife for this option (R. Johnson, personal communication2008) as most of the sediments would be contained in the modified estuary.
• The restoration of the Deschutes Estuary would create significant marine shorelinehabitat in Budd Inlet for ESA listed species. This improved habitat may be of benefit toGA and other surrounding Budd Inlet facilities in that this credit could be used asmitigation for other Budd Inlet projects, providing a benefit to the local area.
The application of estuary creation for ESA credits in Washington State is very new. Once anestuary has been restored or constructed, mitigation credits can be sold to interested parties or

Page 50 Moffatt & Nichol8/22/2008 DREDGING REPORT FINAL-080822.DOC
entities based on agreements negotiated with the federal and state agencies (S. Miller, personalcommunication 2008). The Port of Everett began selling ESA credits as of June 24, 2008. In thecase of Capitol Lake, GA could share or trade mitigation credits to other Budd Inlet entities (Port,City, County, private marinas and other waterfront businesses, etc.).
Maintenance dredging under the estuary alternatives will be in the marinas and port berth of BuddInlet, rather than within the estuary basin. This ongoing dredging is considered in Section 8.
6.5 Cost SummaryThe cost associated with estuary dredging for the single basin scenario is approximately $12.0million in 2008 dollars, or $31 per cubic yard. A more detailed timeline, including this cost andpotential variations, is given in Section 8.8, together with the ongoing maintenance dredging inBudd Inlet.

Moffatt & Nichol Page 51DREDGING REPORT FINAL-080822.DOC 8/22/2008
7. Estuary Dredging: Dual BasinThe Dual Basin estuary restoration alternative is similar to the Single Basin alternative, exceptthat a separate reflecting pool will be constructed in the eastern part of the North Basin.
Estuary dredging for the dual basin alternative is essentially identical to that for the Single Basinalternative. The proposed pre-dredging scheme (Figure 22) does not overlap the proposedreflecting pool. Consequently, no changes to the estuary pre-dredging and placement are neededfor the Dual Basin alternative.
Because the east side of the North Basin is unavailable for sediment storage under the Dual Basinalternative, it can be expected that more sediment will eventually be transported in the marinasand the Port of Olympia’s berth under the Dual Basin alternative compared to the Single Basinalternative. Numerical modeling of hydrodynamics and sediment transport (USGS 2008a) showsonly a slight increase in sedimentation over the first three years for the Dual Basin alternative: itcan be concluded that the decrease in sediment storage will become apparent only over the long-term. Although the effects of this decrease in storage have not been well quantified, thepossibility of moving a portion of the dredged material off-site should be considered seriously forthe Dual Basin alternative.


Moffatt & Nichol Page 53DREDGING REPORT FINAL-080822.DOC 8/22/2008
8. Marina and Port Dredging8.1 BackgroundThe marinas and transient docks in West Bay, from south to north, include the Olympia YachtClub, Percival Landing, Martin Marina, One Tree Island Marina, Fiddlehead Marina, and the Portof Olympia recreational docks, all on the east side of Budd Inlet’s West Bay; and West BayMarina on the west side of Budd Inlet (Figure 2). The history of maintenance dredging in thisarea, and the concerns of the marina owners and operators, as well as the Port of Olympia, werediscussed at a recent meeting called by General Administration (General Administration 2008)and in a telephone conversation with the owner of the Fiddlehead Marina (Wubbena, personalcommunication 2008).
This document refers to the Olympia Yacht Club, Percival Landing, Martin Marina, One TreeIsland Marina, and the Fiddlehead Marina as “the marinas.” Since (as described below) it isanticipated that dredging in West Bay Marina will not be significantly increased by the estuaryrestoration, this marina is not considered further.
The marinas have not required significant maintenance dredging over the past few decades.Martin Marina, One Tree Island Marina, and Fiddlehead Marina were dredged at various times inthe 1980s, in the course of reconfiguration and expansion. Slow ongoing sedimentation hasoccurred near the shorelines, such that dredging is now becoming desirable in many areas –generally, for the first time in twenty years. Sedimentation has been relatively rapid at thesouthwestern corner of the Olympia Yacht Club (J. Lengenfelder, personal communication 2008).Percival Landing (City of Olympia) is currently considering dredging approximately 4,500 cubicyards of sediment from under their docks in the next several years. This is part of a majorenhancement of the public areas of West Bay. More information on this project will be availablein September 2008.
In a similar vein, the Port of Olympia wishes to dredge its West Bay berths 2 and 3, last dredgedin 1979 (Port of Olympia 2006). The Corps maintains the channel into the Port of Olympia at -40feet MLLW. The Corps last dredged 106,000 cubic yards from the channel in spring 2007, withthe material going to Anderson-Ketron Island disposal site.
The main concerns of the marina operators are:
• How often would West Bay marinas need to conduct maintenance dredging in the future?
• What is the cost-benefit of each alternative for this project? Specifically, how would thetwo Estuary Alternatives impact the marinas, City facilities (Percival Landing andshoreline parks), and the Port’s terminals?
This report only attempts a partial answer to these questions. Specifically, the report does notaddress costs associated with impacts to marina operations during dredging – e.g., the need torelocate boats while their slips are being dredged.
8.2 Anticipated Dredging NeedsOn average, the Deschutes River delivers 35,000 cubic yards of sediment annually to CapitolLake (USGS 2006). This material will eventually make its way through the estuary and will settleout in Budd Inlet. This deposition of material will have an impact on the future maintenancedredging needs of the various marinas and the Port facilities.
In the short term (three years after restoration) and the medium term (up to 15 years) thesedimentation rate in the marinas and the Port facilities will be greater than 35,000 cubic yards

Page 54 Moffatt & Nichol8/22/2008 DREDGING REPORT FINAL-080822.DOC
per year. Even with the recommended pre-dredging of the main estuary channel, a significantfraction of the sediment stored in Capitol Lake will be swept into Budd Inlet as the estuarybathymetry evolves. Recent estimates of deposition within Budd Inlet (USGS 2008a) are asfollows:
• Within three years of estuary restoration: 90,000 cubic yards at the Port of Olympia’sWest Bay Berth and 70,000 cubic yards at the marinas. This assumes that the pre-dredging described in Sections 6 and 7 does take place: otherwise the 3-year dredgingapproximately doubles.
• Between three and ten years after estuary restoration: 35,000 to 40,000 cubic yards peryear at the Port of Olympia, and about 20,000 cubic yards per year at the marinas.
• In the long term (beyond the 10 year maximum modeling horizon of the USGS): thisdocument assumes that the sedimentation rate will drop to 15,000 cubic yards per yeareach in the Port of Olympia and at the marinas.
Figure 26 illustrates the pattern of sedimentation predicted by USGS 2008a after three years.Based on these modeling results, we make the following plausible assumptions regardingdredging in the marinas and at the Ports:
• After 3 years:
o 35,000 cubic yards at the Olympia Yacht Club;o 35,000 cubic yards collectively at the other West Bay marinas;o 90,000 cubic yards at the Port of Olympia.
• After 6, 9, 12, 15, and 18 years:
o 30,000 cubic yards at the Olympia Yacht Club;o 30,000 cubic yards collectively at the other West Bay marinas;o 120,000 cubic yards at the Port of Olympia.
• Every 6 years subsequently:
o 45,000 cubic yards at the Olympia Yacht Club;o 45,000 cubic yards collectively at the other West Bay marinas;o 90,000 cubic yards at the Port of Olympia.

Moffatt & Nichol Page 55DREDGING REPORT FINAL-080822.DOC 8/22/2008
Figure 26. Anticipated erosion and deposition three years after estuaryrestoration: single basin (Source: USGS 2008a).
8.3 Dredge Material CharacteristicsSediments in Capitol Lake are sandy silt with purple loosestrife seeds intermixed. The sedimentsthat have been dredged in the past from the marinas in Budd Inlet are of a sandy silt, with somedioxin contamination – at least some of these materials are likely to have dioxin levels beyondthat permitted for open water disposal. Sediments dredged from the deep channel of Budd Inlet in2007 were suitable for disposal at Anderson-Ketron Island.

Page 56 Moffatt & Nichol8/22/2008 DREDGING REPORT FINAL-080822.DOC
Material dredged from the Fiddlehead Marina in the past has been contaminated with organicmaterials, believed to be due to a combined sewer overflow discharge pipe on the site (Wubbena2008).
8.4 Dredge Material DisposalThe dredge material disposal options are determined by the sediment characteristics.
• Clean sediments (sufficiently low levels of dioxins, furans, and other chemicalcontaminants and without purple loosestrife seeds) may go to the Anderson-Ketron Islanddisposal site.
• Clean (uncontaminated) sediments, but containing purple loosestrife seeds, couldpotentially be transported to the Commencement Bay open water disposal site. Since theseeds would already be within Budd Inlet at this stage, it is possible that such materialcould be used for nearshore restoration or beneficial reuse within Budd Inlet, or even toAnderson-Ketron Island. This material could also go to the Centralia reclamation site.
• If contaminated, the sediments must go to either Rabanco’s Roosevelt Landfill or WasteManagement’s Columbia Ridge Landfill.
At the recent meeting called by General Administration (General Administration 2008) to discussdredging in Budd Inlet, one other possibility was discussed: to use sediments as fill to extend thePort peninsula further north. It is possible that the improvement in open-water habitat introducedby an estuary restoration project could be considered adequate mitigation for landfill.
8.5 Permitting and Regulatory ProcessAny increased sedimentation in Budd Inlet resulting from the removal of the Capitol Lake damwould need to be explained in the project EIS for the Estuary Dredging alternatives.
Any future maintenance dredging for each West Bay facility would also need to undergo separateenvironmental review prior to being completed; however, a full EIS would most likely not berequired. Maintenance dredging is often SEPA exempt or, at most, could be determined asnonsignificant.
Future maintenance dredging for any of these facilities would also require all of the necessary in-water permits and approvals similar to those identified for the Lake Dredging alternative inSection 5.2.
If resolution to Ecology’s concerns over how to deal with the dioxin/furans in Budd Inlet have notyet been identified or decided upon by the time some of these facilities need to completemaintenance dredging, permitting may require more extensive sediment testing than normallyrequired and the disposal of sediments may also be more difficult and expensive.
8.6 Cleanup of Budd InletCurrently Ecology is conducting a harbor-wide investigation of the sediments in Budd Inlet, withspecific interest in dioxin/furan levels. Additional sampling in much of Puget Sound is scheduledto occur in 2008 to assist Ecology in determining what cleanup levels, if any, for dioxins/furans isrequired within Puget Sound.
Both the Port of Olympia, as part of the permitting for their berth dredging project, and the Cityof Olympia are currently negotiating cleanup agreements with the Department of Ecology. TheCity is negotiating a cleanup agreement which relates only to the west side of Budd Inlet’s West

Moffatt & Nichol Page 57DREDGING REPORT FINAL-080822.DOC 8/22/2008
Bay (D. Hanna, personal communication 2008). It is likely that cleanup will be needed for someor all of the marinas concerned in Budd Inlet.
If contaminated materials are not removed from Budd Inlet before the estuary restoration, thesesediments would be intermingled with sediment from the estuary. Because separating these twotypes of sediments would be difficult, this intermingled sediment could well be unsuitable foropen-water disposal in its entirety – and could be required to go to more expensive disposal sites.If, however, a cleanup plan was identified and completed prior to the need for maintenancedredging, any sediment deposited from Capitol Lake may be suitable for open-water disposal,which could result in an overall cost saving. Close coordination with the City, Port, the manymarina operators, USACE, Ecology, and the other regulatory agencies involved with the manydredging projects planned for Budd Inlet would be of significant value to all involved and couldresult in the most cost effective and practical solution for the area.
Because the eventual need for cleanup is independent of the estuary restoration project, the costsof cleanup are not included in this report. However, those costs could be substantial. For example,if 100,000 cubic yards must be removed from Budd Inlet at a unit cost of $140 per cubic yard(similar to upland disposal of the lake sediment), the cost would be $14 million.
8.7 Construction and Material Handling
8.7.1 Marinas
The uncovered moorage at the West Bay marinas will be dredged mechanically. The first stepwill be to relocate the boats in each section, so the dredge can access the slips. The boats couldpotentially be moved to the transient moorage at Percival Landing; in the short term to SwantownMarina; or they could be rafted.
The uncovered marina fairways are typically not more than 40 feet wide. Allowing for closemaneuvering, this limits the beam of mechanical dredge equipment, and attendant dump barges,to about 30 feet. Mechanical dredges on barges of this size have track-mounted lattice boomcranes in the 100- to 200-ton capacity with buckets in the 1 to 3 cubic yard size range. A typicalproduction rate for a 3-cubic yard dredge is 115 cubic yards per hour. Given the narrowmaneuvering, a more likely production rate is 100 cubic yards per hour. Based on an 8-hour shiftwith 6 hours of effective dredging per day, the likely dredging rate will be on the order of 600cubic yards per day.
The operation might proceed as follows:
• After mobilization to the site, the mechanical dredge, consisting of a barge-mountedcrane with a clam shell bucket, will drop the bucket to the bottom;
• The bucket will scoop up sediment;
• The crane will bring the bucket to the surface and swing the bucket over the uncovered(and empty) docks, and deposit the sediment in the attendant dump barge;
• As each barge is filled, it will be moored temporarily and the second barge brought intoservice;
• At the end of the day, the full barges will be towed to the open-water disposal site atAnderson-Ketron Island.
Covered moorage at the Olympia Yacht Club will require a combination of mechanical andhydraulic dredging equipment. The fairways can be dredged using a mechanical dredge in thesame way as the uncovered moorages just described. However, a hydraulic dredge will be needed

Page 58 Moffatt & Nichol8/22/2008 DREDGING REPORT FINAL-080822.DOC
in and under the covered moorage. The reason is that hydraulic dredges have a lower profile,which allows them to get under the roofline. The crane on a mechanical dredge effectively rulesthis out.
A small (no larger than 12-inches) hydraulic dredge with cutterhead or augerhead will be used inand under the covered moorage. The dredging rate for the hydraulic dredge will most likely be onthe order of 400 cubic yards per day, due to the constant moving between boathouses and thepotential for debris to clog the pump. It can be expected that the first dredging event will be theslowest and most costly, since debris has built up over the years.
As with the mechanical dredges, the vessels will be relocated from the boathouses in order toprovide the hydraulic dredge access to the moorage. The main difference in the operation is thatthe hydraulic dredge generates a slurry, which has a greater volume than the material generatedby the mechanical dredge. With a water content by volume of between 80 and 85 percent, thequantity of slurry produced will be between 2,000 and 2,700 cubic yards per day.
Six to eight scow-loads or barge-loads, each of 500 cubic yards, will be generated and towed toAnderson-Ketron Island daily while the hydraulic dredge is operating in parallel with themechanical dredge; two will be generated once only the mechanical dredge is in operation. Arelatively large tug will be used and will tow two of the 500 cubic yard barges or scows to thedisposal site. A smaller tug is used to move the scows between the marina and the towing tugs.
After the first three years, it is assumed that 10,000 cubic yards will be dredged mechanicallyfrom the fairways and uncovered areas in the Yacht Club; 35,000 cubic yards will be dredgedmechanically from the other marinas; and 25,000 cubic yards will be dredged hydraulically fromthe covered moorages in the Yacht Club. Based on the production rates of 600 cubic yards perday and 400 cubic yards per day for mechanical and hydraulic dredging respectively, this wouldtake 75 days for mechanical and 63 days for hydraulic dredging. The costs are broken out inTable 16 and Table 17. The costs for mobilization and demobilization are much less for dredgingin Budd Inlet compared to the lake-bound dredging alternatives considered previously, because itis not necessary to launch large equipment in the lake.
Table 16. Daily Operations Costs for Marina Dredging
Daily Operation Costs Daily Costper Unit
Units Total DailyCost
Hydraulic dredge, 12-inch, on barge $3,800 1 $3,800Mechanical dredge, 3 CY clamshell onbarge with 200-ton crane
$5,000 1 $5,000
Towing tug, 1,000 hp, 8-hour day $6,200 3 $18,600Tender tug, 300 hp, 8-hour day $3,500 2 $7,000Scow, 500 CY $600 6 $3,600
Total daily operation cost – two dredges $38,000Mechanical dredge, 3 CY clamshell onbarge with 200-ton crane
$5,000 1 $5,000
Towing tug, 1,000 hp, 8-hour day $6,200 1 $6,200Tender tug, 300 hp $3,500 2 $7,000Scow, 500 CY $600 2 $1,200
Total daily operation cost – one dredge $19,400
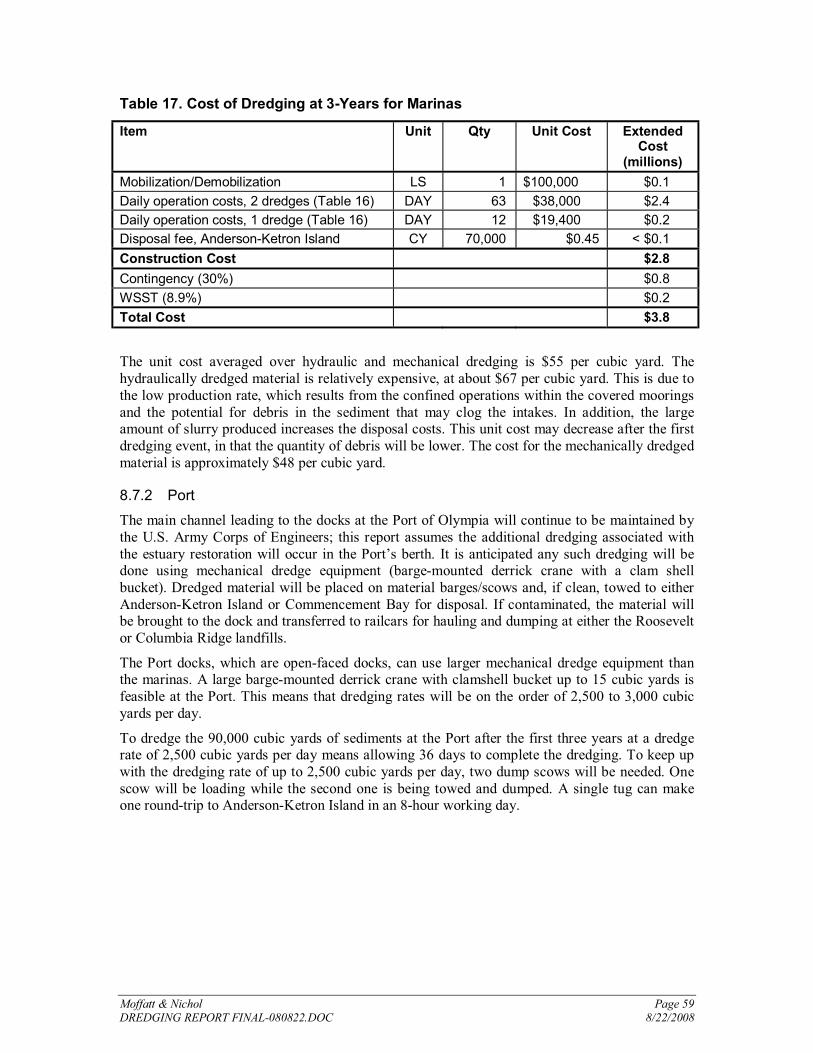
Moffatt & Nichol Page 59DREDGING REPORT FINAL-080822.DOC 8/22/2008
Table 17. Cost of Dredging at 3-Years for Marinas
Item Unit Qty Unit Cost ExtendedCost
(millions)Mobilization/Demobilization LS 1 $100,000 $0.1Daily operation costs, 2 dredges (Table 16) DAY 63 $38,000 $2.4Daily operation costs, 1 dredge (Table 16) DAY 12 $19,400 $0.2Disposal fee, Anderson-Ketron Island CY 70,000 $0.45 < $0.1Construction Cost $2.8Contingency (30%) $0.8WSST (8.9%) $0.2Total Cost $3.8
The unit cost averaged over hydraulic and mechanical dredging is $55 per cubic yard. Thehydraulically dredged material is relatively expensive, at about $67 per cubic yard. This is due tothe low production rate, which results from the confined operations within the covered mooringsand the potential for debris in the sediment that may clog the intakes. In addition, the largeamount of slurry produced increases the disposal costs. This unit cost may decrease after the firstdredging event, in that the quantity of debris will be lower. The cost for the mechanically dredgedmaterial is approximately $48 per cubic yard.
8.7.2 Port
The main channel leading to the docks at the Port of Olympia will continue to be maintained bythe U.S. Army Corps of Engineers; this report assumes the additional dredging associated withthe estuary restoration will occur in the Port’s berth. It is anticipated any such dredging will bedone using mechanical dredge equipment (barge-mounted derrick crane with a clam shellbucket). Dredged material will be placed on material barges/scows and, if clean, towed to eitherAnderson-Ketron Island or Commencement Bay for disposal. If contaminated, the material willbe brought to the dock and transferred to railcars for hauling and dumping at either the Rooseveltor Columbia Ridge landfills.
The Port docks, which are open-faced docks, can use larger mechanical dredge equipment thanthe marinas. A large barge-mounted derrick crane with clamshell bucket up to 15 cubic yards isfeasible at the Port. This means that dredging rates will be on the order of 2,500 to 3,000 cubicyards per day.
To dredge the 90,000 cubic yards of sediments at the Port after the first three years at a dredgerate of 2,500 cubic yards per day means allowing 36 days to complete the dredging. To keep upwith the dredging rate of up to 2,500 cubic yards per day, two dump scows will be needed. Onescow will be loading while the second one is being towed and dumped. A single tug can makeone round-trip to Anderson-Ketron Island in an 8-hour working day.

Page 60 Moffatt & Nichol8/22/2008 DREDGING REPORT FINAL-080822.DOC
Table 18. Daily Operations Costs for Port Dredging
Daily Operation Costs Daily Costper Unit
Units Total DailyCost
Mechanical dredge, 15 CY clamshell onbarge with 200-ton crane
$5,000 1 $5,000
Towing tug, 1,000 hp, 8-hour day $6,500 2 $13,000Split-hull scow, 1,500 CY, 8-hour day $1,000 2 $2,000
Total daily operation cost – one dredge $20,000
Table 19. Cost of Dredging at 3-Years for Port Berth
Item Unit Qty Unit Cost ExtendedCost
(millions)Mobilization/Demobilization LS 1 $100,000 $0.1Daily operation costs (Table 18) DAY 36 $20,500 $0.7Disposal fee, Anderson-Ketron Island CY 90,000 $0.45 < $0.1Construction Cost $0.9Contingency (30%) $0.2WSST (8.9%) $0.1Total Cost $1.2
The unit cost is $13 per cubic yard – divided approximately equally between dredging anddisposal.
8.7.3 Contaminated Materials
If any of the sediments are contaminated, that portion of the dredging will need to go upland to a landfill. One possibility would be for the mechanically dredged sediments to be brought to dockat the Port and transferred to railcars for hauling and dumping at either the Roosevelt or ColumbiaRidge landfills. Barges containing the contaminated materials will be towed the short distance tothe Port dock and unloaded with a front-end loader, excavator, or crane and clamshell. If this isexpected to be a regular occurrence, it would be useful to lay new rail trackage at the Port so thatthe sediment can be transferred directly from the barges to the railcars without additionalrehandling.
Unless they can be moved, the covered moorage areas – including the Yacht Club – will have tobe dredged using hydraulic dredging equipment. The hydraulically dredged material would bepumped to a settling basin at the Percival Cove gravel pit, or potentially at the Port, fordewatering. After dewatering, the sediment may be loaded onto railcars for hauling to a landfillfor final disposal.
Costs are anticipated to be approximately $100 to $120 per cubic yard for mechanically dredgedmaterial at the Port, and $150 per cubic yard for the combination of mechanically andhydraulically dredged material at the Olympia Yacht Club. Given the quantities of contaminatedmaterial are not known, the methods and schedules are not given here.

Moffatt & Nichol Page 61DREDGING REPORT FINAL-080822.DOC 8/22/2008
8.8 Cost Summary and TimelineAs with the Lake Alternative, four cost timelines are considered. The dredging quantities are asgiven in Section 8.2. The timelines are based on the following unit costs:
• Estuary pre-dredging: basic cost is $23 per cubic yard; it is possible that some materialwill be transported to a landfill site at a cost of $136 per cubic yard, similar to the lakedredging alternative.
• Marina and Yacht Club dredging: $60 per cubic yard based on offsite disposal atAnderson-Ketron Island, $150 per cubic yard for any material transported to a landfillsite.
• Port dredging: $11 per cubic yard based on offsite disposal at Anderson-Ketron Island,$120 per cubic yard for any material transported to a landfill site.
The dredging scenarios are as follows:
• Low-cost:
o Initial estuary dredging and placement along Deschutes Parkway, with costs at 85percent of those given above (see also Table 15);
o Initial maintenance dredging at 3 years with disposal at Anderson-Ketron Island;
o Subsequent maintenance dredging with disposal at Anderson-Ketron Island, withcosts at 85 percent of those given above.
• Medium-cost:
o Initial estuary dredging and placement along Deschutes Parkway, with costs as givenabove;
o Initial maintenance dredging at 3 years with 95 percent of the material disposed atdisposal at Anderson-Ketron Island and 5 percent at a landfill site;
o Subsequent maintenance dredging with disposal at Anderson-Ketron Island, withcosts as given above.
• High-cost:
o Initial estuary dredging with 95 percent of the material placed along DeschutesParkway, with costs 30 percent higher than given above; 5 percent of the materialdisposed at a landfill site;
o Maintenance dredging costs 30 percent higher than the medium-cost case.
• Worst-case:
o Initial estuary dredging with 80 percent of the material placed along DeschutesParkway, with costs 30 percent higher than given above; 20 percent of the materialdisposed at a landfill site;
o Maintenance dredging in years 3 and 6 require disposal at a landfill site;
o Maintenance dredging in year 9 requires disposal at a landfill site for 50 percent ofthe material, and as the high-cost case for the other 50 percent;
o Subsequent maintenance dredging as the high-cost case.
Table 20 gives the costs for these four alternatives, in 2008 dollars (no escalation).

Page 62 Moffatt & Nichol8/22/2008 DREDGING REPORT FINAL-080822.DOC
Table 20. Cost timelines for the Estuary Alternative with marina and port dredging:2008 costs, no escalation
Year(s) 1 Low-Cost($millions)
Medium-Cost($millions)
High-Cost($millions)
Worst-Case($millions)
0 $10.2 $12.0 $15.0 $26.81-9 $13.3 $15.6 $20.2 $59.6
10-18 $8.3 $9.7 $12.6 $12.619-27 $10.4 $12.2 $15.9 $15.928-36 $5.2 $6.1 $8.0 $8.037-45 $10.4 $12.2 $15.9 $15.9
Total Cost $57.8 $67.9 $87.6 $138.81. Costs are given per nine-year period, consistent with the Lake Dredging results in Table 11. No
dredging occurs in years 46-50, so these years are not shown. Numbers may not sum exactly due torounding.
Finally, Table 21 gives construction costs based on an initial construction date of 2015 andescalation at 3.5 percent annually. The Net Present Value (NPV) of the total project cost is alsogiven, based on the 2008 Federal interest rate of 4.875 percent.
Table 21. Cost timelines for the Estuary Alternative with marina and port dredging:escalation at 3.5 percent annually, interest rate at 4.875 percent annually
Year(s) Low-Cost($millions)
Medium-Cost($millions)
High-Cost($millions)
Worst-Case($millions)
2015 $13.0 $15.3 $19.1 $34.12016-2024 $20.7 $24.3 $31.5 $92.42025-2033 $16.7 $19.7 $25.6 $25.62034-2042 $30.4 $35.7 $46.5 $46.52043-2051 $20.6 $24.2 $31.5 $31.52052-2065 $56.4 $66.4 $86.3 $86.6
Total Cost $157.9 $185.6 $240.5 $316.5NPV of Total Cost $42.4 $49.9 $64.2 $108.5
Note: Numbers may not sum exactly due to rounding.

Moffatt & Nichol Page 63DREDGING REPORT FINAL-080822.DOC 8/22/2008
9. ReferencesAustin, R.S. 2004. Solidification/Stabilization Treatment of Dredged Material from the Port of
San Diego. Available online at < http://www.cement.org/waste/wt_apps_san_diego.asp>.Viewed August 14 2008.
Bachmeier, J. 2008. Personal communication. Telephone conversation between Joe Scott, Moffatt& Nichol, and Jim Bachmeier, Thurston County (360-357-2491) on 23 July 2008.
Baker, T. 2008. Personal communication. Telephone conversation between Margaret Schwertner,Moffatt & Nichol, and Thomas Baker, Washington State Department of Transportation (360-709-5401), 20 June 2008.
Burke, J. 2008. Personal communication. Telephone conversation between Margaret Schwertner,Moffatt & Nichol, and Jamie Burke, Cedar Grove Composting (425-432-2395). MapleValley, WA. 27 June 2008.
Capitol Lake Adaptive Management Plan (CLAMP) Steering Committee. 1999. Capitol LakeAdaptive Management Plan – 1999 to 2001.
Capitol Lake Adaptive Management Plan (CLAMP) Steering Committee. 2000. Capitol LakeAdaptive Management Plan Phase I Task 11 – Sediment Management: Answers to technicalQuestions. July 2000.
Capitol Lake Adaptive Management Plan (CLAMP) Steering Committee. 2002. Capitol LakeAdaptive Management Plan. A Vision for the Next Ten Years – 2003 to 2013.
Capitol Lake Adaptive Management Plan (CLAMP) Technical Work Group. 2007. TechnicalWork Group notes, December 18, 2007.
Cooke, G., E. Welch, S. Peterson, and P. Newroth. 1993. Restoration and Management of Lakesand Reservoirs. Boca Raton, Florida: CRC Press LLC.
Dredged Material Management Program (DMMP). 2008a. Available online at<http://www.nws.usace.army.mil/PublicMenu/Menu.cfm?sitename=dmmo&pagename=home>.Viewed August 4, 2008.
Dredged Material Management Program (DMMP). 2008b. Evaluation and Disposal Procedures(User’s Manual). Prepared by the Dredged Material Management Office – US Army Corps ofEngineers – Seattle District. July 2008.
Entranco, Inc. 1997. Technical Memorandum – 1991-1996 Capitol Lake Survey – SedimentVolume Calculations. Memorandum from David Morency to Nick Cockrell, WashingtonState Department of General Administration. March 5, 1997.
Entranco, Inc. 2000a. Capitol Lake Adaptive Management Plan 1999 to 2001. Phase One – Task11 Sediment Management: Answers to Technical Questions. July 2000.
Entranco, Inc. 2000b. Capitol Lake Adaptive Management Plan 1999 to 2001. Phase One – Task3 Hydraulic Scour Analysis. April 2000.
ESA/Adolfson. 2008. Draft Lacey, Olympia, and Tumwater Shoreline Analysis &Characterization Report. Prepared for: Thurston Regional Planning Council. June 2008.
General Administration (GA). 1996. Draft Supplemental Environmental Impact Statement.Capitol Lake Restoration and Recreation Plan: Revised Sediment Removal Plan. February 16,1996.

Page 64 Moffatt & Nichol8/22/2008 DREDGING REPORT FINAL-080822.DOC
General Administration (GA). 2002. Capital Lake Adaptive Management Plan. A Vision for theNext Ten Years 2003-2013. Washington State Department of General Administration.October 2002.
General Administration (GA). 2008. Capitol Lake Alternatives – Meeting with Budd InletMarinas. June 27, 2008.
Hanna, D. 2008. Personal communication. Telephone conversation between MargaretSchwertner, Moffatt & Nichol, and D. Hanna, City of Olympia (360-753-8020), 10 July2008.
Hartman, G. 2008. Personal communication. Telephone conversation between Joe Scott, Moffatt& Nichol, and Greg Hartman, Dalton, Olmsted & Fuglevand, Inc. (360-692-7345), 14 August2008.
Haubrich, G. 2008. Personal communication. Telephone conversation between MargaretSchwertner, Moffatt & Nichol, and G. Haubrich, Washington State Department ofAgriculture (509-225-2604), 9 July 2008.
Herrera Environmental Consultants. 2000a. Capitol Lake Adaptive Management Plan – SedimentCharacterization Report. Prepared for Entranco, Inc. and Washington State Department ofGeneral Administration.
Herrera Environmental Consultants. 2000b. Capitol Lake Adaptive Management Plan – SedimentSampling and Analysis Plan and Quality Assurance Plan. Prepared for Entranco, Inc. andWashington State Department of General Administration.
Herrera Environmental Consultants. 2003. Green Lake Alum Treatment Study. Technical reportprepared for Seattle Department of Parks and Recreation. Prepared by Herrera EnvironmentalConsultants in association with Tetra Tech, Inc. June 5, 2003.
Johnson, R. 2008. Personal communication. Telephone conversation between MargaretSchwertner, Moffatt & Nichol, and Rick Johnson, Thurston County Noxious Weed ControlAgency (360-786-5576), 30 June 2008.
Kendall, D. 2008. Personal communication. Discussions with Joe Scott and Susan Tonkin,Moffatt & Nichol, and David Kendall of the Dredged Material Management Program,Olympia, WA. DMMP Monthly Meeting held on June 5, 2008.
Knezevic, Z. S. 2003. Purple loosestrife. UNL-Extension Publication. EC-03-176.
Legenfelder, J. 2008. Personal communication. Mentioned at General Adminstration meeting onJune 27, 2008. Olympia Yacht Club, Olympia, WA. (360-943-6199), 27 June 2008.
Miller, S. 2008. Personal communication. Telephone conversation between Margaret Schwertner,Moffatt & Nichol, and Skye Miller, Wildlands, Inc. Marysville, WA. (360-658-4866), 25June 2008.
Moffatt & Nichol (M&N). 2007. Deschutes Estuary Feasibility Study, Phase 3. EngineeringDesign and Cost Estimates. Final Report. February 9, 2007.
Port of Olympia. 2006. Fact Sheet, Olympia Harbor, WA Maintenance dredging. Availableonline at <http://www.portofolympia.com/dredging_factsheet.htm>. Viewed March 25, 2007.
Rittenhouse-Zeman and Associates. 1982. Soils and Foundation Exploration: Capitol LakeRestoration Project. Prepared for Jongejan Gerrard McNeal, Inc., and Washington StateDepartment of General Administration. January 19, 1982.

Moffatt & Nichol Page 65DREDGING REPORT FINAL-080822.DOC 8/22/2008
Science Applications International Corporation (SAIC). 2008. Sediment Characterization Study,Budd Inlet, Olympia, WA. Prepared for the Washington State Department of Ecology. March12, 2008.
Smith, D. 2008. Personal communication. Telephone conversation between Emy Carpenter,Moffatt & Nichol, and Dean Smith, Lakeside Industries (360-491-5460), 17 June 2008.
Sutherland, D. 1999. Washington Aqueduct Sediment Discharges Report of PanelRecommendations. Prepared by D. Sutherland for the Chesapeake Bay Field Office, US Fishand Wildlife Service. Annapolis, Maryland. March 1999.
Thurston County Noxious Weed Control Board (TCNWCB) 2008. Available online at<http://www.co.thurston.wa.us/tcweeds/index.htm>. Viewed August 4 2008.
United States Army Corps of Engineers (USACE). 2001. Approved Work Windows for FishProtection.
United States Army Corps of Engineers (USACE). 1987. Beneficial Uses of Dredged Material.Engineer Manual 1110-2-5026.
United States Geological Survey (USGS). 2006. Deschutes Estuary Feasibility Study;Hydrodynamics and Sediment Transport Modeling. U.S. Geological Survey Open-FileReport 2006-1318.
United States Geological Survey (USGS). 2008a. Capitol Lake Alternatives Analysis:Incorporation of Fine-Grained Sediment Erodibility Measurements into Sediment TransportModeling. Draft version provided to Moffatt & Nichol on June 30,2008.
United States Geological Survey (USGS). 2008b. Capitol Lake Grain Size Data: sample dates10/31/2007 and 11/1/2007. Received from Andrew Stevens, USGS, on May 9, 2008.
United States Geological Survey (USGS). 2008c. Spread, Impact, and Control of PurpleLoosestrife (Lythrum salicaria) in North American Wetlands. Available online at<http://www.npwrc.usgs.gov/resource/plants/loosstrf/biology.htm>. Viewed June 24, 2008.
Washington Department of Fish and Wildlife (WDFW). 1999. Gold and Fish. Rules andregulations for Mineral Prospecting and Placer Mining in Washington State. January 1999.
Washington State Department of Agriculture (WSDA). 2003. Available online at<http://dnr.metrokc.gov/wlr/lands/weeds/pdf/PPlants203.pdf>.
Washington State Department of General Administration. 2008. Capitol Lake Alternatives –Meeting with Budd Inlet Marinas. Meeting Minutes. June 27, 2008.
Weber, D. 2008. Personal communication. Telephone conversation between Joe Scott, Moffatt &Nichol, and Doug Weber, USACE (206-764-3406), June 4 2008.
Welch, E. and G. Cooke. 1999. Effectiveness and Longevity of Alum Treatments in Lakes. Lakeand Reservoir Management. 15:5-27.
Wubbena, B. Personal communication. Telephone conversation between Joe Scott and SusanTonkin, Moffatt & Nichol, and Bob Wubbena, Fiddlehead Marina (360-280-9100), June 172008.