capturing heterogeneity in gene expression studies by...
TRANSCRIPT

Capturing Heterogeneity in Gene ExpressionStudies by Surrogate Variable AnalysisJeffrey T. Leek
1, John D. Storey
1,2*
1 Department of Biostatistics, University of Washington, Seattle, Washington, United States of America, 2 Department of Genome Sciences, University of Washington, Seattle,
Washington, United States of America
It has unambiguously been shown that genetic, environmental, demographic, and technical factors may havesubstantial effects on gene expression levels. In addition to the measured variable(s) of interest, there will tend to besources of signal due to factors that are unknown, unmeasured, or too complicated to capture through simple models.We show that failing to incorporate these sources of heterogeneity into an analysis can have widespread anddetrimental effects on the study. Not only can this reduce power or induce unwanted dependence across genes, but itcan also introduce sources of spurious signal to many genes. This phenomenon is true even for well-designed,randomized studies. We introduce ‘‘surrogate variable analysis’’ (SVA) to overcome the problems caused byheterogeneity in expression studies. SVA can be applied in conjunction with standard analysis techniques to accuratelycapture the relationship between expression and any modeled variables of interest. We apply SVA to disease class,time course, and genetics of gene expression studies. We show that SVA increases the biological accuracy andreproducibility of analyses in genome-wide expression studies.
Citation: Leek JT, Storey JD (2007) Capturing heterogeneity in gene expression studies by surrogate variable analysis. PLoS Genet 3(9): e161. doi:10.1371/journal.pgen.0030161
Introduction
Large-scale gene expression studies allow one to character-ize transcriptional variation with respect to measuredvariables of interest, such as differing environments, treat-ments, time points, phenotypes, or clinical outcomes. How-ever, a number of unmeasured or unmodeled factors may alsoinfluence the expression of any particular gene. Besidesinducing widespread dependence in measurements acrossgenes [1,2], these influential factors create additional sourcesof differential expression, which, unlike gene-specific fluctu-ations, represent common sources of variation in geneexpression that can be observed among multiple genes.
We call ‘‘primary measured variables’’ (or primary varia-bles) those variables that are explicitly modeled in the analysisof an expression study. These variables may or may not beassociated with any given gene’s expression variation. Weclassify all the remaining sources of expression variation intothree basic types. ‘‘Unmodeled factors’’ are sources ofvariation explained by measured variables, but are notexplicitly included in the statistical model (e.g., because theirrelationship to expression is intractable or the relevantmeasured variables were excluded because of sample sizerestrictions). ‘‘Unmeasured factors’’ are sources of expressionvariation that are not measured in the course of the study, sowe also call these unmodeled factors. Finally, ‘‘gene-specificnoise’’ refers to random fluctuations in gene expressionindependently realized from gene to gene.
As a simple example meant only for illustrative purposes,consider a human expression study where disease state on aparticular tissue type is the primary variable. Suppose that inaddition to changes in expression being associated withdisease state, the age of the individuals also has a substantialinfluence on expression. Thus, some genes exhibit differentialexpression with respect to disease state, some with respect toage, and some with respect to both. If age is not included in
the model when identifying differential expression withrespect to disease state, we show that this may (a) induceextra variability in the expression levels due to the effect ofage, decreasing our power to detect associations with diseasestate, (b) introduce spurious signal due to the fact that theeffect of age on expression may be confounded with diseasestate, or (c) induce long-range dependence in the apparent‘‘noise’’ of the expression data, complicating any assessmentof statistical significance for differential expression. Inpractice, even if age were known, it may be one of dozensof available measured factors, making it statistically intract-able to determine which to include in the model. Further-more, even measured factors such as age may act on distinctsets of genes in different ways, or may interact with anunobserved factor, making the effect of age on expressiondifficult to model. ‘‘Expression heterogeneity’’ (EH) is usedhere to describe patterns of variation due to any unmodeledfactor.Major sources of expression variation are due to technical
[3,4], environmental [5,6], demographic [7,8], or genetic [9–11] factors. It is well known that sources of variation due toexperimental design or large-scale systematic sources ofsignal may be present in expression data [3,4,12,13], some-
Editor: Greg Gibson, North Carolina State University, United States of America
Received April 9, 2007; Accepted August 1, 2007; Published September 28, 2007
A previous version of this article appeared as an Early Online Release on August 1,2007 (doi:10.1371/journal.pgen.0030161.eor).
Copyright: � 2007 Leek and Storey. This is an open-access article distributedunder the terms of the Creative Commons Attribution License, which permitsunrestricted use, distribution, and reproduction in any medium, provided theoriginal author and source are credited.
Abbreviations: EH, expression heterogeneity; FDR, false discovery rate; QTL,quantitative trait locus; SVA, surrogate variable analysis
* To whom correspondence should be addressed. E-mail: [email protected]
PLoS Genetics | www.plosgenetics.org September 2007 | Volume 3 | Issue 9 | e1610001
times even after normalization has been applied [14]. Geneticfactors can also have a large-scale impact on gene expressionlevels. Specific genetic loci have been shown to influence theexpression of hundreds or thousands of genes in severalorganisms [10,11,15]. Expression heterogeneity is particularlypronounced in human expression data, especially in the studyof complex systems, such as cancer or responses to stress [16–18]. Recently, Lamb et al. proposed the ‘‘Connectivity Map’’for identifying functional connections between cancer sub-types, genetic background, and drug action [19]. Lamb et al.noted EH (e.g., due to cell type and batch effects) presented amajor hurdle for extracting relevant biological signal fromthe Connectivity Map.
In each of these studies, expression variation with respectto one or at most a handful of variables is explored. However,it is likely that in each study multiple sources of EH will act ondistinct, but possibly overlapping, sets of genes. Normal-ization techniques are commonly used to detect and adjustfor systematic expression variation due to well-characterizedlaboratory and technical sources [12,13,20]. However, to datethere has been no approach for identifying and accountingfor all sources of systematic expression variation, includingvariation due to unmeasured or unmodeled factors of bothbiological and technical sources. We show here that biologicalsources of variation not modeled in the analysis can be just asproblematic as technical sources of variation.Here, we introduce ‘‘surrogate variable analysis’’ (SVA) to
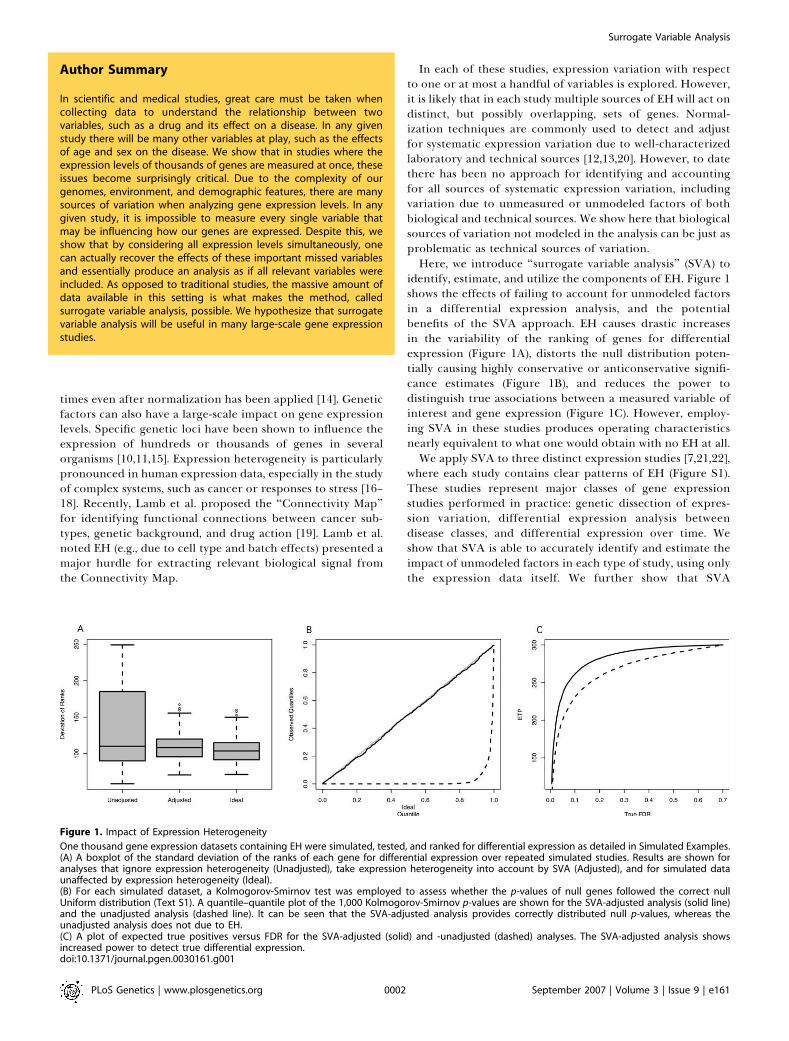
identify, estimate, and utilize the components of EH. Figure 1shows the effects of failing to account for unmodeled factorsin a differential expression analysis, and the potentialbenefits of the SVA approach. EH causes drastic increasesin the variability of the ranking of genes for differentialexpression (Figure 1A), distorts the null distribution poten-tially causing highly conservative or anticonservative signifi-cance estimates (Figure 1B), and reduces the power todistinguish true associations between a measured variable ofinterest and gene expression (Figure 1C). However, employ-ing SVA in these studies produces operating characteristicsnearly equivalent to what one would obtain with no EH at all.We apply SVA to three distinct expression studies [7,21,22],
where each study contains clear patterns of EH (Figure S1).These studies represent major classes of gene expressionstudies performed in practice: genetic dissection of expres-sion variation, differential expression analysis betweendisease classes, and differential expression over time. Weshow that SVA is able to accurately identify and estimate theimpact of unmodeled factors in each type of study, using onlythe expression data itself. We further show that SVA
Figure 1. Impact of Expression Heterogeneity
One thousand gene expression datasets containing EH were simulated, tested, and ranked for differential expression as detailed in Simulated Examples.(A) A boxplot of the standard deviation of the ranks of each gene for differential expression over repeated simulated studies. Results are shown foranalyses that ignore expression heterogeneity (Unadjusted), take expression heterogeneity into account by SVA (Adjusted), and for simulated dataunaffected by expression heterogeneity (Ideal).(B) For each simulated dataset, a Kolmogorov-Smirnov test was employed to assess whether the p-values of null genes followed the correct nullUniform distribution (Text S1). A quantile–quantile plot of the 1,000 Kolmogorov-Smirnov p-values are shown for the SVA-adjusted analysis (solid line)and the unadjusted analysis (dashed line). It can be seen that the SVA-adjusted analysis provides correctly distributed null p-values, whereas theunadjusted analysis does not due to EH.(C) A plot of expected true positives versus FDR for the SVA-adjusted (solid) and -unadjusted (dashed) analyses. The SVA-adjusted analysis showsincreased power to detect true differential expression.doi:10.1371/journal.pgen.0030161.g001
PLoS Genetics | www.plosgenetics.org September 2007 | Volume 3 | Issue 9 | e1610002
Surrogate Variable Analysis
Author Summary
In scientific and medical studies, great care must be taken whencollecting data to understand the relationship between twovariables, such as a drug and its effect on a disease. In any givenstudy there will be many other variables at play, such as the effectsof age and sex on the disease. We show that in studies where theexpression levels of thousands of genes are measured at once, theseissues become surprisingly critical. Due to the complexity of ourgenomes, environment, and demographic features, there are manysources of variation when analyzing gene expression levels. In anygiven study, it is impossible to measure every single variable thatmay be influencing how our genes are expressed. Despite this, weshow that by considering all expression levels simultaneously, onecan actually recover the effects of these important missed variablesand essentially produce an analysis as if all relevant variables wereincluded. As opposed to traditional studies, the massive amount ofdata available in this setting is what makes the method, calledsurrogate variable analysis, possible. We hypothesize that surrogatevariable analysis will be useful in many large-scale gene expressionstudies.

improves accuracy and consistency in detecting differentialexpression. SVA orders the significant gene lists to moreaccurately and reproducibly reflect the ordering of the geneswith respect to their true differential expression signal. SVAis particularly useful in producing reproducible results inmicroarray studies, because adjusting for surrogate variablesreduces differential expression due to sources other than theprimary variables. These results indicate that EH is prevalentacross a range of studies and that SVA can be used to captureand account for these patterns to improve the character-ization of biological signal in expression analyses.
Results
Surrogate VariablesWe have developed an approach called surrogate variable
analysis that appropriately borrows information acrossgenes to estimate the large-scale effects of all unmodeledfactors directly from the expression data. Figure 2A shows a
simulated example of EH. The primary variable distin-guishes the first ten arrays from the last ten (Figure 2B);however, the unmodeled factor may have a variety of effectson expression (Figure 2C). The SVA approach flexiblycaptures signatures of EH, including highly irregularpatterns not following any simple model, by estimating thesignatures of EH in the expression data themselves ratherthan attempting to estimate specific unmodeled factors suchas age or gender. After the surrogate variables areconstructed, they are then incorporated into any subsequentanalysis as covariates in the usual way. The SVA algorithm,described in mathematical detail in Materials and Methods,can conceptually be broken down into four basic steps:(Step 1) Remove the signal due to the primary variable(s) ofinterest to obtain a residual expression matrix. Apply adecomposition to the residual expression matrix to identifysignatures of EH in terms of an orthogonal basis of singularvectors that completely reproduces these signatures. Use a
Figure 2. Example of Expression Heterogeneity
(A) A heatmap of a simulated microarray study consisting of 1,000 genes measured on 20 arrays.(B) Genes 1–300 in this simulated study are differentially expressed between two hypothetical treatment groups; here the two groups are shown as anindicator variable for each array.(C) Genes 201–500 in each simulated study are affected by an independent factor that causes EH. This factor is distinct from, but possibly correlatedwith, the group variable. Here, the factor is shown as a quantitative variable, but it could also be an indicator variable or some linear or nonlinearfunction of the covariates.doi:10.1371/journal.pgen.0030161.g002
PLoS Genetics | www.plosgenetics.org September 2007 | Volume 3 | Issue 9 | e1610003
Surrogate Variable Analysis

statistical test to determine the singular vectors thatrepresent significantly more variation than would beexpected by chance. (Step 2) Identify the subset of genesdriving each orthogonal signature of EH through asignificance analysis of associations between the genes andthe EH signatures on the residual expression matrix. (Step 3)For each subset of genes, build a surrogate variable based onthe full EH signature of that subset in the originalexpression data. (Step 4) Include all significant surrogatevariables as covariates in subsequent regression analyses,allowing for gene-specific coefficients for each surrogatevariable.
The four-step procedure is necessary both to ensure thatthe surrogate variables indeed estimate EH and not the signalfrom the primary variable (Step 1), to ensure an accurateestimate of each surrogate variable by identifying the specificsubset of genes driving each EH signature (Step 2), to allowfor correlation between the primary variable and thesurrogate variables by building the surrogate variables onthe original expression data (Step 3), and to take into accountthe fact that a surrogate variable may have a different effecton each gene (Step 4). The third and fourth steps areparticularly important for maintaining unbiased significancewith SVA, as demonstrated below.
Definition of a Correct ProcedureThe overall goal of SVA is to provide a more accurate and
reproducible parsing of signal and noise in the analysis of anexpression study when EH is present. One way in which signalis commonly quantified is through a significance analysis [23].The most basic definition of a significance analysis beingperformed ‘‘correctly’’ is if the null distribution is calculatedproperly [24]. A straightforward means for determiningwhether this is true is to assess whether the p-valuescorresponding to true null hypotheses are Uniformlydistributed between zero and one. Indeed, p-values arespecifically defined so that those corresponding to true nullhypotheses have a Uniform(0,1) distribution if and only if thenull distribution has been correctly calculated [25]. Through-out this paper, we examine the distribution of p-values fromnull genes to determine whether various procedures are ableto recover the correct null distribution in the presence of EH.To assess statistically any deviations from the Uniformdistribution for the null p-values, we apply a nestedKolmogorov-Smirnov test that is robust to chance fluctua-tions that may be present in a single simulated dataset (seeText S1).
Simulated ExamplesWe performed a simulation study to investigate the
properties of SVA with respect to large-scale significancetesting. Specifically, we show that the SVA algorithm (a)accurately estimates signatures of expression heterogeneity,(b) corrects the null distribution of p-values from multiplehypothesis tests, (c) improves estimation of the false discoveryrate (FDR) [23,26], and (d) is robust to confounding betweenthe primary variable and surrogate variables. The primaryvariable for our simulation was a binary variable indicatingtwo disease classes. We simulated 1,000 expression studies,drawn from the same hypothetical population. For eachstudy, we simulated expression for 1,000 genes on 20 arraysdivided between the two disease states. The first 300 genes
were simulated to be differentially expressed between diseasestates and genes 200–500 were affected by an independentunobserved factor to simulate a randomized study (Materialsand Methods).Surrogate variables accurately estimated. We first assessed
the accuracy of the surrogate variables estimated from SVA.In 99.5% of the simulated studies, a permutation procedure[27] correctly identified one significant surrogate variable.Since there is only one unmodeled factor that was simulatedin this study, we assessed the accuracy of the surrogatevariable estimation by correlation. (If there is more than onesurrogate variable or more than one unmodeled factor, thenone must assess the accuracy by using some sort of multipleregression and calculating an R2 value.) The averagecorrelation between the estimated surrogate variable andthe true unmodeled factor over all 1,000 experiments was0.95 with a standard deviation of 0.05. Each surrogate variableis a weighted average of the expression measurements over asubset of genes. We chose a liberal adaptive cutoff fordetermining the number of genes affected by each orthog-onal EH signal to avoid overfitting. The SVA algorithmcorrectly identifies the genes affected by the unmodeledfactor. On average, 30.5% of the truly affected genes wereidentified as affected, whereas only 9.9% of the trulyunaffected genes were identified as affected.Correct p-value distribution. It is well known that in a
significance analysis, p-values corresponding to null genesshould be Uniformly distributed (i.e., ‘‘flat’’) [28]. Statistics hasclassically dealt with effects from unmodeled factors byperforming randomized studies. In our simulations, theunmodeled factor was independently realized, which isequivalent to randomizing the unmodeled factor with respectto the primary variable. Because of this, the p-valuescorresponding to any single null gene over many simulateddatasets follow the Uniform distribution. However, for anygiven experiment, a single randomization is applied to allgenes. Therefore, the thousands of p-values resulting from asingle microarray study are not the same as thousands of p-values resulting from independent randomizations of anunmodeled factor. The dependence across genes induced byEH can result in major fluctuations and bias in the p-valuesfor the null genes for any single expression study, even in awell designed, randomized study. This bias generally takes theform of a global deviation of the null p-values from theUniform distribution. Specifically, if the unmodeled factor iscorrelated with the primary variable, the null p-values will betoo small, biased towards zero. If the unmodeled factor isuncorrelated with the primary variable, the null p-values willbe too big, biased towards one.These noteworthy fluctuations and biases in the null p-
values can be seen in nine representative datasets from oursimulation study in Figure S2 and across all 1,000 simulateddatasets in Figure 1B. The bias results in incorrect assessmentof significance, regardless of the particular significancemeasure chosen [24]. By applying the SVA algorithm toadjust the significance analysis, the p-values from the nullgenes for any single experiment are now corrected towardthe Uniform distribution. This can be seen when SVA isapplied to these same nine datasets in Figure S3 and across all1,000 simulated datasets in Figure 1B. Figure 1B shows thatthe null p-values consistently follow the Uniform distributionwhen SVA is applied, but they consistently do not follow the
PLoS Genetics | www.plosgenetics.org September 2007 | Volume 3 | Issue 9 | e1610004
Surrogate Variable Analysis

Uniform in a typical unadjusted analysis. To confirm thatSVA is robust to the distribution of the gene specific error, weran a second independent simulation study where theresiduals were drawn from a published microarray study(Materials and Methods). Figure S4 shows that behavior of thenull p-values is corrected by SVA, which is qualitatively thesame as in the case of purely simulated data.
It should also be noted that p-values corresponding todifferentially expressed genes will be similarly affected; theloss in power can be seen in Figure 1C. Although, note thatpower versus FDR is calculated in Figure 1C when we knowthe correct answers, which clearly will not be reflected inactual studies where an unadjusted analysis produces anincorrect set of null p-values. Therefore, the application ofSVA can result in empirical increases or decreases in power,depending on whether the null p-values are spuriously pushedtowards zero or one, even though SVA tends to only provideincreases in the true power.
Gene ranking more accurate and stable. Perhaps mostimportantly, SVA also results in a more powerful andreproducible ranking of genes for differential expression.This can be seen in Figures 1A and S5; SVA-adjusted analysesprovide gene rankings comparable to the scenario wherethere is no heterogeneity, whereas an unadjusted analysisallows for incorrect and highly variable gene rankings. This isarguably the most important feature of SVA, since anaccurate and reproducible gene ranking is key for makingbiological inference when only a subset of genes will beselected for future study. In other words, these results suggestthat SVA would yield results reproducible on the level that wewould expect given that the primary variable is the onlysource of signal.
Improved FDR estimation. There has been much recentinterest in the effect of expression dependence across geneson estimates of multiple testing significance measures. Large-scale dependence has been shown to be particularly problem-atic for estimating FDR, as dependence across genes increasesthe variance of most standard FDR estimators [1,2,29–35]. EHrepresents large-scale dependence across genes that maysignificantly affect estimates of the FDR and relatedmeasures. To evaluate the potential impact of SVA in thissituation, we performed a simulation study as describedabove. However, in this case, to create large-scale depend-ence, we let genes 201–1,000 be affected by the unmodeledfactor. SVA reduces the variability in both the estimate of theproportion of null hypotheses and the q-values for each study(Figure S6). Furthermore, the behavior of the SVA-adjustedFDR estimates is almost identical to the behavior under thescenario with no EH.
Robustness to confounding in observational studies. Toassess the accuracy of the SVA algorithm in the case wherethe primary variable and unmodeled factors are heavilycorrelated, we performed a second simulation study. Theset-up for the second simulation study was identical to thatfor the original study above, except in this case theunmodeled factor was simulated such that the averagecorrelation with the primary variable was 0.50 with astandard deviation of 0.16. Under this model, the unob-served factor is both correlated with the primary variableand affects an overlapping set of genes. This is representa-tive of the potential confounding present in observationalmicroarray studies (see Disease Class below) and that which
happens by chance in a non-negligible subset of randomizedstudies. Even in this set-up, the permutation hypothesis testcorrectly identified a single surrogate variable in 94.5% ofthe simulated datasets. Further, the average correlationbetween the estimated surrogate variable and the trueunmodeled factor over 1,000 datasets was 0.94 with astandard deviation of 0.22. Thus, SVA accurately estimatesthe unobserved factor even when there is strong depend-ence between the primary and unobserved factors, with asubset of genes affected by both. SVA also provided acorrect Uniform distribution of null p-values as in the aboverandomized study scenario.
Proof of Concept: Genetics of Gene Expression in YeastSeveral recent studies have carried out the genetic
dissection of expression variation at the genome-wide level[10,11,15]. Brem et al. [10, 21] measured expression genomewide in 112 segregants of a cross between two isogenic strainsof yeast. They also obtained genotypes for each segregant atmarkers covering 99% of the genome (Materials andMethods). It was shown that many gene expression traits arecis-linking, i.e., the quantitative trait locus (QTL) linkage peakcoincided with the physical location of the open readingframe for the expression trait [36]. At the same time, it wasalso shown that a number of gene expression traits are trans-linking, with linkage peaks at loci distant from the physicallocation of their open reading frames. In particular, several‘‘pivotal’’ loci each appear to influence the expression ofhundreds or even thousands of gene expression traits. Similarhighly influential loci have been observed in other organisms[11,15]. These pivotal loci act as a major source of EH,regardless of whether genotypes have been measured in anexpression study.As proof of concept, the Brem et al. [10,21] dataset was
used to show that well-defined EH exists in actual studies andthat SVA can properly capture and incorporate this EHstructure into the statistical analysis of measured variables ofinterest. First, we analyzed the full dataset to identify theexpression traits under the influence of these pivotal trans-acting loci, as well as the patterns of EH induced by theseloci. Then we applied SVA to only the expression data,ignoring the genotype data to identify relevant surrogatevariables capturing EH. Linkage analysis was performedagain including the surrogate variables as covariates, show-ing that the effects from the pivotal loci are now negligible.In other words, SVA was able to capture and remove theeffects of these few pivotal loci without the need forgenotypes.A number of expression traits have significant trans-linking
eQTL mapping to pivotal loci on Chromosomes II, III, VIII,XII, XIV, and XV (Figure 3A). In the SVA-adjusted analysis,the majority of the trans-linkages to the pivotal loci have beeneliminated (Figure 3B). The pervasive trans-linkage signalmapping to the pivotal loci can be viewed as globalexpression heterogeneity. The reduction in trans-linkage tothese loci in the SVA-adjusted significance analysis indicatesthat SVA effectively captures genetic EH.Pivotal trans-linkage signals indicate large-scale effects of a
few loci. However, subtle and potentially more interestingcis-linkage may be lost in the presence of substantial geneticheterogeneity. To assess the impact of SVA on power todetect cis-linkage, we calculated linkage p-values only for
PLoS Genetics | www.plosgenetics.org September 2007 | Volume 3 | Issue 9 | e1610005
Surrogate Variable Analysis

markers located within three centimorgans of the openreading frame of each trait. On chromosomes without apivotal locus (Chromosomes I, IV, V, VI, VII, IX, X, XI, andXIII) the SVA-adjusted analysis finds substantially more cis-linkage signal. At an FDR cutoff of 0.05, the adjusted analysisfinds 1,894 significant cis-linkages, compared with 1,604 forthe unadjusted analysis. This increase is consistent across a
range of FDR cutoffs (Table 1) and illustrates the potentialincrease in power obtained from applying SVA.
SVA Applied to Human Expression StudiesWe applied the SVA approach to two human studies [7,22],
representing the two common human study designs: diseasestate and timecourse.Disease class. Hedenfalk et al. [22] measured expression in
seven BRCA1 and eight BRCA2 mutation-positive tumorsamples (Materials and Methods). The goal of the study was toidentify genes that showed differential expression acrossbreast cancer tumor subtypes defined by these germlinemutations.Hierarchical clustering [37] of the data reveals notable
substructure within the BRCA2 samples [38]. We applied SVAand identified a single surrogate variable that appears tocapture this trend (Figures 4A and S7A). We included thissurrogate variable in a significance analysis comparingBRCA1 and BRCA2 tumors (Materials and Methods). Theadjusted analysis finds fewer significant genes at standardFDR cutoffs (Table 1). This can be understood in the contextof substructure within the BRCA2 group. Many of the genesdeclared differentially expressed at the most extreme levels ofsignificance are highly associated with the top surrogatevariable. Thus, differential expression for a number of genesis driven primarily by expression heterogeneity. Adjusting forthe top surrogate variable eliminates spurious differentialexpression due to EH. As an example, eukaryotic translationinitiation factor 2 (EIF2S2) is declared differentially ex-pressed with a q-value of 0.09 in the unadjusted analysis.However, the first four BRCA2 samples show nearly identicalexpression values to the BRCA1 samples for this gene (FigureS7B). Thus, it is unlikely that differential expression is beingdriven by the difference in BRCA genotypes, but rather bysome other confounding factor due to the observationalnature and small sample size of the study.As shown above, SVA also increases the accuracy and
stability of the ordering of the significant gene lists (see
Table 1. Significance Results
Study Analysis
Type
q-Value Threshold
0.01 0.025 0.05 0.10
Genetics of gene expression Unadjusted 1,063 1,343 1,604 1,951
SVA adjusted 1,428 1,676 1,894 2,292
Disease Class Unadjusted 1 19 96 274
SVA adjusted 1 1 52 218
Time course Unadjusted 161 273 422 823
Tissue adjusted 270 482 795 1,548
SVA Adjusted 196 367 563 991
The results of the significance analysis in the three real gene expression studies. Theresults of the genetics of gene expression study include the number of significant cis-linkages before and after adjusting for surrogate variables. The disease class results reportthe number of genes differentially expressed between BRCA1 and BRCA2 before and afteradjusting for surrogate variables. For the time-course study, the number of genesdifferentially expressed with respect to age are shown for an unadjusted analysis, ananalysis adjusted for tissue type, and an SVA-adjusted analysis. An SVA-adjusted analysismay result in an increase or decrease in the number of significant results depending onthe direction and degree to which the unmodeled factors (now captured by surrogatevariables) were confounded with the primary variables.doi:10.1371/journal.pgen.0030161.t001
Figure 3. SVA Captures EH Due to Genotype
(A) A plot of significant linkage peaks (p-value , 1e�7) for expressionQTL in the Brem et al. [10,21] study by marker location (x-axis) andexpression trait location (y-axis).(B) Significant linkage peaks (p-value , 1e�7) after adjusting forsurrogate variables. Large trans-linkage peaks on Chromosomes II, III,VII, XII, XIV, and XV have been eliminated without reducing cis-linkagepeaks.doi:10.1371/journal.pgen.0030161.g003
PLoS Genetics | www.plosgenetics.org September 2007 | Volume 3 | Issue 9 | e1610006
Surrogate Variable Analysis

Simulated Examples). Since it is standard practice to examineonly the most significant genes for further study, an SVA-adjusted analysis may result in completely distinct biologicalconclusions. For example, Figure S8 shows a substantialreordering of genes for significance when applying SVA,including a number of highly significant genes in an adjusted
analysis that moved substantially down in ranking when SVAwas applied. These genes may represent spurious signal dueto the confounding shown earlier that would reduce thequality of the gene list.Time-course sampling. Rodwell et al. [7] measured genome-
wide expression in kidney tissue samples from 133 patients(Materials and Methods). The goal of the study was to identifygenes whose expression changed with age. We applied arecently developed procedure for time-course significanceanalysis to identify differential expression with respect to age[8]. In these data, tissue type had a strong impact on theexpression of thousands of genes. We first performed a time-course differential expression analysis with tissue typeincluded as a covariate. We also performed a seconddifferential expression analysis ignoring tissue type.We then applied SVA to the expression data ignoring the
tissue information. The top surrogate variable identified bySVA had a correlation of 0.86 with tissue type (Figure 4B).The SVA algorithm identified 84% of the genes as likely to beassociated with the top surrogate variable, indicating perva-sive signal due to tissue type, as can be directly verified. Todetermine if this surrogate variable captured the overalleffect of tissue type, we performed a third differentialexpression analysis ignoring tissue type and including thetop surrogate variable as a covariate.At standard q-value cutoffs, the results of the analysis
adjusted for the top surrogate variable appeared to be verysimilar to the results when the true tissue type was included(Table 1). At a standard q-value cutoff of 0.05, 100% of the422 genes declared significant by the unadjusted analysis weredeclared significant by the tissue-adjusted analysis. At thesame cutoff, 96% of the 538 genes declared significant in theSVA-adjusted analysis were also declared significant in thetissue-adjusted analysis. That is, 116 genes were significant inthe SVA-adjusted analysis that were also significant in thetissue-adjusted analysis, but were not significant in theunadjusted analysis. These genes represent an increase inpower to detect differential expression after adjusting for asurrogate variable in place of an unmodeled confoundingfactor.
Comparison with Existing MethodsRegression on eigenvectors. There are several well-estab-
lished statistical approaches for partitioning of sources ofvariation among multiple variables into components [39]. Theclassical singular value decomposition (or principal compo-nents) approach has been successfully applied in several areasof genomics. For example, Alter et al. applied the singularvalue decomposition to identify significant trends in geneexpression studies [40]. They showed that the right singularvectors, or ‘‘eigengenes,’’ represent trends that account for alarge proportion of the variation in the expression matrix.Recently, Price et al. [41] also performed this singular valuedecomposition of whole-genome SNP genotypes (coded as 0,1, or 2) in order to account for systematic sources of variationdue to population substructure. Both of these methodsextract and utilize patterns of variation from the entirematrix of genomic data without supervision from primaryvariables.When performing a significance analysis of an expression
study with respect to primary variables, one cannot employthis classical approach. As opposed to association studies,
Figure 4. Surrogate Variables from Human Studies
(A) A plot of the top surrogate variable estimated from the breast cancerdata [22]. The BRCA1 group is relatively homogeneous (triangles), but theBRCA2 group shows substantial heterogeneity (pluses).(B) A plot of tissue type versus array for the Rodwell et al. [7] study(dotted line) and the top surrogate variable estimated from theexpression data when tissue was ignored (dashed line). There is strongcorrelation between the top surrogate variable and the tissue typevariable.doi:10.1371/journal.pgen.0030161.g004
PLoS Genetics | www.plosgenetics.org September 2007 | Volume 3 | Issue 9 | e1610007
Surrogate Variable Analysis

where population structure has genome-wide effects at asignal relatively much stronger than the primary variable, thesignal structure in expression studies tends to be much morecomplex. There can be multiple levels of signal from multiplesources that each affect certain subsets of genes, making itimportant to supervise the decomposition with respect toknown primary variables and these subsets of genes.
To demonstrate these issues, we considered two straight-forward significance analysis applications of the well-estab-lished singular value decomposition approach previouslyutilized in genomics [40,41]. The first application identifiessignificant eigengenes by the same permutation-based algo-rithm as in our SVA approach. The eigengene with thehighest absolute correlation with the primary variable isremoved and the remaining significant eigengenes areincluded as covariates in the significance analysis. The secondalgorithm identifies significant eigengenes in the residuals ofthe regression of gene expression on the primary variable,again using a permutation-based algorithm. All significanteigengenes identified in the residuals are included in thesignificance analysis. Both algorithms do not produce con-sistently accurate results (Figures S9 and S10), and sometimestheir adjustments produce more bias than making no adjust-ment at all. The eigengenes calculated from the entireexpression matrix capture the signal due to both theunmodeled factor and the primary variable, which results inbiased estimation of the unmodeled factor. The eigengenescalculated from the residuals do not take into accountpossible overlapping signal between the primary variable andunmodeled factors, often resulting in over-fitting.
SVA is a new methodological development aimed at
overcoming the issues not addressed by existing methods.Rather than decomposing the entire expression matrix (orgenotype matrix), SVA performs what could be called a‘‘supervised factor analysis’’ of the expression data (Materialsand Methods). Specifically, SVA decomposes the expressionvariation with respect to the primary variables alreadyincluded in the model. Our multi-step approach for estimat-ing surrogate variables uses the eigengenes from carefullydefined subsets of genes in the original expression matrix thatcorrespond to patterns observed in a residual expressionmatrix where the main effects of the primary variables havebeen removed. This allows us to decompose the variation insuch a way that distinct sets of genes (but possibly over-lapping) drive each surrogate variable, where the surrogatevariables may be correlated with the primary variables. It alsodoes not require any assumptions about the relative strengthof signal due to each source of variation.Multiple testing dependence. It is clear that EH induces
widespread dependence in expression variation across genes.EH is therefore related to the issue of multiple testingdependence, which has been recognized as an importantproblem [1,2,30]. A number of methods have been proposedfor adjusting for dependence in multiple tests that makeadjustments directly once the tests are summarized as p-values or test-statistics, rather than the original dataset [31–35]. It does not appear that these multiple testing procedurescan solve the problem of EH at the level of generality of SVA.Figure 5 shows a histogram composed of all null p-valuesaffected by EH from the simulation study. Without thepresence of EH, these null p-values would be Uniformlydistributed between zero and one. However, it is also possibleto produce a set of p-values from an experiment unaffectedby EH, where a subset of tests are true alternatives and have p-values pushed towards zero so that they are indistinguishablefrom Figure 5. In other words, by only observing the set of p-values in Figure 5, it is not possible to know whether they areall null and affected by EH, or whether they are unaffected byEH and a subset are true alternatives.If the original data are ignored and an adjustment for EH is
applied to the p-values, then the only unbiased adjustment isto make all p-values larger so that the histogram in Figure 5 istransformed to a flat, Uniformly distributed histogram.Therefore, if one adjusts for EH based only on p-values, thenall p-value histograms that look like Figure 5 should be madeflat. By producing datasets with stronger EH, it is possible toproduce histograms where the p-values are pushed even morestrongly towards zero because of the stronger dependence.This argument shows that any method that adjusts for EH ingeneral at the level of p-values must make all p-valuehistograms Uniformly distributed. The same argument holdsfor test-statistics, where they would have to be transformed tobe distributed as their ‘‘theoretical null’’ distribution (FigureS11). Therefore, it does not appear that one can generallyadjust for EH based only on p-values or test-statistics,especially when considering examples such as that in Figure5. This point can be further supported with a moretheoretical argument (Text S1). Additionally, methods thatadjust for what is typically defined as multiple testingdependence do not usually take into account the fact thatthe sources of dependence may have signal that overlaps withthe primary variables of interest, whereas SVA does. Itappears that the framework presented here may be a
Figure 5. Null p-Values under Heterogeneity
A histogram of the null p-values from a single simulated experimentaffected by heterogeneity. The distribution of these p-values appearsidentical to a complete set of p-values from an experiment that is notsubject to heterogeneity. Therefore, it is not possible to identify andaccount for heterogeneity by analyzing one-dimensional p-values or test-statistics (see also Text S1).doi:10.1371/journal.pgen.0030161.g005
PLoS Genetics | www.plosgenetics.org September 2007 | Volume 3 | Issue 9 | e1610008
Surrogate Variable Analysis

generalization of the multiple testing problem, but this issuerequires further investigation.
Discussion
Expression heterogeneity due to technical, genetic, envi-ronmental, or demographic variables is common in geneexpression studies. Here we have introduced a new method,SVA, for identifying, estimating, and incorporating sources ofEH in an expression analysis. SVA uses the expression dataitself to identify groups of genes affected by each unobservedfactor and estimates the factor based on the expression ofthose genes. Simulations show that SVA accurately detectsexpression heterogeneity and improves significance analyses.We performed SVA on experiments involving recombinantinbred lines, individuals of varying disease state, andexpression measured over time to illustrate the broad rangeof studies on which SVA can be applied. One advantage of theSVA approach is the ability to disentangle correlated andoverlapping differential expression signals. This approachmay be particularly useful in clinical studies, where a largenumber of clinical variables may have a complicated jointimpact on expression. We have implemented SVA in an opensource package available for downloading at http://www.genomine.org/sva/.
Materials and Methods
Expression data. Three publicly available datasets were employedto represent a broad range of gene expression studies performed inpractice. The first dataset consists of gene expression measurementsfor 6,216 genes in 112 segregants of a cross between two isogenicstrains of yeast, as well as genotypes across 3,312 markers [10,21]. Thesecond dataset consists of gene expression for 3,226 genes in sevenBRCA1 and eight BRCA2 mutation–positive tumor samples [22];several genes with apparent outliers were removed as described [23]for a total of 3,170 genes. The third dataset consists of geneexpression measurements in kidney samples from normal kidneytissue obtained at nephrectomy from 133 patients [7]; the 34,061genes analyzed in [8] were also analyzed here. Seventy-four of thetissue samples were obtained from the cortex and 59 from themedulla. Details of the protocol for each study appear in thecorresponding references. All expression data were analyzed on thelog scale.
Linkage analysis of yeast cross. The SVA algorithm identified 14significant surrogate variables from the expression data. Weperformed both an unadjusted and an SVA-adjusted linkage analysisfor each expression trait. In the unadjusted analysis, linkage p-valueswere calculated from an F-test comparing an additive genetic modelto the null model of no genetic association [42]. SVA-adjusted p-values were calculated from an F-test comparing the full model ofgenetic association and the null model of no association, both modelsincluding all significant surrogate variables as additive terms.
Simulation details. For each study, we simulated expression for1,000 genes on 20 arrays divided between the two disease states. Forsimplicity, the expression measurements for each gene were drawnfrom a normal distribution with mean zero and variance one. Wesimulated expression heterogeneity with a dichotomous unmodeledfactor independent of the disease state. The mean differencesbetween disease states and states of the unmodeled factor weredrawn from two independent normal distributions. For the real dataexample, we calculated the residuals from the regression of BRCAtumor type on expression for the Hedenfalk data [22]. Then, for eachsimulated study, we independently permuted each row of theexpression data to create a matrix of residuals. To this matrix, weadded signal, as in the case of the purely simulated data. Thesimulation studies were based on data generated using the Rprogramming language [43]. All differential expression analyses wereperformed by a t-test based on standard linear regression. The geneswere ranked for relative significance by the absolute values of their t-statistics.
Analysis of the human studies. Differential expression was
calculated using a t-test based on standard linear regression for thedisease class data. The method of Storey et al. [8] was applied for thetime-course data. q-Values were estimated using previously describedmethodology [23].
Statistical model for SVA. Let Xmxn¼ (x1,..,xm)T be the normalized m
3 n expression matrix with n arrays for m genes, where xi¼ (xi1,..,xin)T
is the vector of normalized expression for gene i. Let y¼ (y1,..,yn)T be
a vector of length n representing the primary variable of interest.Without loss of generality model xij¼ liþ fi( yj)þ eij, where li is the
baseline level of expression, fi( yj)¼ E(xij j yj) � li gives the relationshipbetween measured variable of interest and gene i, and eij is randomnoise with mean zero. As a simple example, for a dichotomousoutcomes yj 2 f�1,1g we would employ the linear model xij¼ liþ bi yjþeij and estimate li and bi by least squares. We could then perform astandard test of whether bi¼ 0 or not for each gene. This hypothesistest is exactly equivalent to performing a test of differentialexpression between the two classes.
Suppose in a microarray study there are L biologically meaningfulunmodeled factors, such as age, environmental exposure, genotype,etc. Let g‘ ¼ (g‘1,...,g‘n) be an arbitrarily complicated function of the‘th factor across all n arrays, for ‘¼1,2,...,L. Therefore, we can nowmodel the expression for gene i on array j as xij ¼ li þ fi( yj)þ
PL‘¼1 c‘ig‘j þ e�ij , where c‘i is a gene-specific coefficient for the
‘th unmodeled factor. If unmodeled factor ‘ does not influence theexpression of gene i, then c‘i¼ 0. The fact that we employ an additivemodel is actually quite general: it has been shown that evencomplicated nonlinear functions of factors can be represented inan additive fashion for a reasonable choice of a nonlinear basis [44];we simply define the g‘ to be as nonlinear as necessary and make L aslarge as necessary to best fit the additive effect. Since there are narrays, each gene’s expression can be modeled by at most n linearlyindependent factors, and hence any dependence structure betweengenes can be represented using L � n vectors in this additivefashion.
Due to this formulation, the inter-gene dependent eij have nowbeen replaced with
PL‘¼1 c‘ig‘j þ e�ij , where e�ij is the true gene-
specific noise, now sufficiently independent across genes. In otherwords, we have broken the error eij into two terms, one thatrepresents dependent variation across genes due to unmodeledfactors,
PL‘¼1 c‘ig‘j , and one that represents gene-specific independ-
ent fluctuations in expression e�ij .It is not possible in general to directly estimate the unmodeled g‘,
and SVA does not attempt to do so. The key observation is to notethat for L vectors in n space, it is possible to identify an orthogonalset of vectors hk , k¼ 1,...,K (K�L) that spans the same linear space asthe g‘ In other words, for any set of vectors g‘ and coefficients c‘i, it ispossible to identify mutually orthogonal vectors hk and coefficientskki such that
PL‘¼1 c‘ig‘j ¼
PKk¼1 kkihkj and
xij ¼ li þ fiðyjÞ þXL
‘¼1c‘ig‘j þ e�ij
¼ li þ fiðyjÞ þXK
k¼1kkihkj þ e�ij
Therefore, we do not need to estimate the specific variables g‘. Weonly need to estimate the linear combination
PL‘¼1 c‘ig‘j , so we can
choose a set of vectors that spans the same space but is statisticallytractable. Here we choose the set of K orthogonal vectors (denoted bythe hk) to be those that are the right non-zero singular vectorsprovided by the singular value decomposition of the m 3 n matrixwith (i, j) entry
PL‘¼1 c‘ig‘j . This justifies the use of the singular value
decomposition to identify orthogonal signatures of expressionheterogeneity for surrogate variable estimates. We call theseh1,h2,...,hK the ‘‘surrogate variables.’’
An intuitive question that arises from an inspection of thisformulation is about the model assumptions of the g‘j. Whereas theterm fi ( yj) is a model of the measured variable, yj, it is not generallypossible to analogously formulate g‘j as a function of a well-defined,measured variable. Since we estimate the outcomes
PL‘¼1 c‘ig‘j
directly from the expression data (asPK
k¼1 kkihkj), it is not necessaryto determine a model of the g‘j in terms of a biologically meaningfulvariable. Thus, we can bypass the need to know what the mostrelevant model of a measured variable is for g‘j for the purposes ofestimating the EH.
SVA algorithm. The goal of the SVA algorithm is therefore toidentify and estimate the surrogate variables, hk ,¼ (hk1,...,hkn)
T, basedon certain consistent patterns of expression variation. Methods forempirically identifying [37] and estimating [40] expression trends or
PLoS Genetics | www.plosgenetics.org September 2007 | Volume 3 | Issue 9 | e1610009
Surrogate Variable Analysis

clusters have previously been developed. However, care must betaken when estimating expression trends for use in subsequentanalyses of measured variables of interest. Specifically, surrogatevariables must represent signal due to sources other than the primaryvariable and allow for potential overlap with the primary variable.The SVA algorithm is designed to estimate surrogate variables thatmeet both requirements. We assume that n , m and, for simplicity,that there is only a single primary variable; the extension to multipleprimary variables simply requires one to include all of them in themodel fit occurring in each Step 1 below.
The algorithm is decomposed into two parts: detection ofunmodeled factors and construction of surrogate variables. The basicform of the first algorithm has been proposed previously [27]. Thesecond algorithm has been proposed and justified in this manuscript
Algorithm to detect unmodeled factors.1. Form estimates li and f i by fitting the model xij¼ liþ fi (yj)þ eij,
and calculate the residuals rij¼ xij�li � f i (yj) to remove the effect ofthe primary variable on expression. Form the m3n residual matrix R,where the (i, j) element of R is rij.
2. Calculate the singular value decomposition of the residualexpression matrix R¼UDVT.
3. Let d‘ be the ‘th eigenvalue, which is the ‘th diagonal element ofD, for ‘¼1,...,n. If df is the degrees of freedom of the model fit liþ fi (yj),then by construction the last df eigenvalues are exactly zero and weremove them from consideration. For eigengene k¼1,..., n-df set theobserved statistic to be
Tk ¼d2kPn�df‘¼1 d2‘
;
which is the variance explained by the kth eigengene.4. Form a matrix R* by permuting each row of R independently to
remove any structure in the matrix. Denote the (i, j) entry of R* by r�ij .5. Fit the model r�ij ¼ l�i þ f �i ðyjÞ þ e�ij and calculate the residuals
r0ij ¼ r�ij � l�i � f�i ðyjÞ to form the m 3 n model-subtracted null matrix
R0.6. Calculate the singular value decomposition of the centered and
permuted expression matrix R0 ¼U0D0VT0 .
7. For eigengene k form a null statistic
T0k ¼
d20kPn�df‘¼1 d20‘
as above, where d0‘ is the ‘th diagonal element of D0.8. Repeat steps 4�7 a total of B times to obtain null statistics T0b
k forb¼ 1,...,B and k ¼ 1,...,n-df.
9. Compute the p-value for eigengene k as:
pk ¼#fT0b
k . ¼ Tk; b ¼ 1; :::;BgB
:
Since eigengene k should be significant whenever eigengene k9 is(where k9.k), we conservatively force monotonicity among the p-values. Thus, set pk ¼max (pk�1, pk) for k ¼ 2,...,n-df.
10. For a user-chosen significance level 0�a�1, call eigengene k asignificant signature of residual EH if pk � a.
Algorithm to construct surrogate variables.1. Form estimates li and f i by fitting the model xij.¼ liþ fi(yj) þ eij,
and calculate the residuals rij ¼ xij �li � f i(yj) to remove the effect ofthe primary variable on expression. Form the m3n residual matrix R,where the (i, j) element of R is rij.
2. Calculate the singular value decomposition of the residualexpression matrix R¼UDVT. Let ek¼ (ek1,...,ekn)
T be the kth column ofV (for k¼1,...,n). These ek are the residual eigengenes and representorthogonal residual EH signals independent of the signal due to theprimary variable.
3. Set K to the number of significant eigengenes found by theabove algorithm. Note that ‘‘significant’’ means that the eigengenerepresents a greater proportion of variation than expected bychance.
For each significant eigengene ek k¼1,..., K.4. Regress ek on the xi (i¼ 1,...,m) and calculate a p-value testing for
an association between the residual eigengene and each gene’sexpression. This p-value measures the strength of association betweenthe residual eigengene ek and the expression for gene i.
5. Let p0 be the proportion of genes with expression not trulyassociated with ek; form an estimate p0, as described previously [23]and estimate the number of genes associated with the residualeigengene by m1 ¼ bð1� p0 3mÞc. Let s1; :::; sm1 be the indices of thegenes with m1 smallest p-values from this test.
6. Form the m1 3 n reduced expression matrix Xr ¼ ðxs1; :::xsm1 ÞT .
Since m1 is an estimate of the number of genes associated withresidual eigengene k, the reduced expression matrix represents theexpression of those genes estimated to contain the EH signaturerepresented by some hk as described above. As was done for R,calculate the eigengenes of Xr, and denote these by erj for j¼1,...,n.
7. Let j*¼ argmax1�j�n cor ðek; erj Þ and set hk ¼ erj� . In other words,set the estimate of the surrogate variable to be the eigengene of thereduced matrix most correlated with the corresponding residualeigengene. Since the reduced matrix is enriched for genes associatedwith this residual eigengene, this is a principled choice for theestimated surrogate variable that allows for correlation with theprimary variable.
8. In any subsequent analysis, employ the model xij ¼ li þ fi(yj) þPKk¼1 kkihkj þ e�ij , which serves as an estimate of the ideal model xij¼ li
þ fi(yj) þPK
k¼1 kkihkj þ e�ij .The singular value decomposition is employed in these SVA
algorithms. It may be possible to utilize other decompositionmethods, but since the singular value decomposition providesuncorrelated variables that decompose the data in an additive linearfashion with the goal of minimizing the sum of squares, we found thisto be the most appropriate decomposition. If the primary variablesare modeled for data that are not continuous, then it may make senseto decompose the variation with respect to whatever model-fittingcriteria will be employed
Software. SVA has been made freely available as an R package athttp://www.genomine.org/sva/.
Supporting Information
Figure S1. Examples of Expression Heterogeneity
Heatmaps of hierarchically clustered gene expression data for arandom subset of 1,000 genes from three studies are shown. (A)Hedenfalk et al. [22] compared gene expression across tumorsubtypes defined by germline BRCA mutations (yellow divides BRCAtumor subtypes), (B) Brem et al. [10,21] measured expression innaturally recombining yeast populations, and (C) Rodwell et al. [7]measured gene expression in kidney samples for patients ranging inage from 27–92 y.
Found at doi:10.1371/journal.pgen.0030161.sg001 (849 KB PDF).
Figure S2. Unadjusted p-Values Show Bias and Fluctuations
Histograms of the null p-values for nine independent realizations ofthe simulated gene expression data. The null p-values should beUniformly distributed, or ‘‘flat,’’ for each experiment. However,across independently simulated datasets, the null p-values range frombeing conservatively biased to anticonservatively biased dependingon the configuration of the unmeasured or unmodeled factor.
Found at doi:10.1371/journal.pgen.0030161.sg002 (17 KB PDF).
Figure S3. SVA-Adjusted p-Values Are Uniform
Histograms of the null p-values for nine independent realizations ofthe simulated gene expression experiment, adjusted by SVA. The p-values for the null genes in each simulated experiment are Uniformlydistributed. None of these deviates from the Uniform according to aKolmogorov-Smirnov test.
Found at doi:10.1371/journal.pgen.0030161.sg003 (18 KB PDF).
Figure S4. Behavior of Simulated Null p-Values from Microarray Data
For each simulated dataset based on the permuted residuals from theHedenfalk et al. study, a nested Kolmogorov-Smirnov test wasemployed to assess whether the p-values of null genes followed thecorrect null Uniform distribution. A quantile–quantile plot of theone thousand Kolmogorov-Smirnov p-values are shown for the SVA-adjusted analysis (solid line) and the unadjusted analysis (dashed line).The grey line represents the expected quantiles. It can be seen thatthe SVA-adjusted analysis provides correctly distributed null p-values,whereas the unadjusted analysis does not, due to EH.
Found at doi:10.1371/journal.pgen.0030161.sg004 (62 KB PDF).
Figure S5. Effect of EH on Gene Ranks
A plot of the true rank (according to signal-to-noise ratio) versus thesignificance test–based average rank (black) plus or minus one standarddeviation (red) for each differentially expressed gene in simulatedstudies (A) affected by EH with an unadjusted analysis, (B) affected byEH with an SVA-adjusted analysis, and (C) unaffected by EH.
PLoS Genetics | www.plosgenetics.org September 2007 | Volume 3 | Issue 9 | e1610010
Surrogate Variable Analysis

Found at doi:10.1371/journal.pgen.0030161.sg005 (439 KB PDF).
Figure S6. Effect of SVA on FDR Calculations
(A) A histogram of the estimates of the proportion of true nulls p0 forstudies affected by EH. (B) A histogram of the estimates of theproportion of true nulls p0 for studies affected by EH, after adjustingfor SVA. (C) A histogram of the estimates of the proportion of truenulls p0 for studies without EH. (D) A plot of observed FDR versustrue FDR (grey) and average observed FDR versus true FDR (red) forsimulated studies affected by EH. (E) A plot of observed FDR versustrue FDR (grey) and average observed FDR versus true FDR (red) forsimulated studies affected by EH, adjusted by SVA. (F) A plot ofobserved FDR versus true FDR (grey) and average observed FDRversus true FDR (red) for simulated studies without EH.
Found at doi:10.1371/journal.pgen.0030161.sg006 (265 KB PDF).
Figure S7. BRCA Surrogate Variables
(A) A plot of the top surrogate variable from the breast cancer data ofHedenfalk et al. [22]; triangles are BRCA1, pluses are BRCA2. (B) Aplot of the expression for eukaryotic translation initiation factor 2,EIF2S2, which follows a similar pattern to the top surrogate variable.
Found at doi:10.1371/journal.pgen.0030161.sg007 (87 KB PDF).
Figure S8. SVA-Induced Change in Gene Ranking for DifferentialExpression
A plot of the p-value rankings for the SVA-adjusted versus unadjustedsignificance analysis of the breast cancer data [22], showingsubstantial differences in the rankings obtained from the twoanalyses. The red line represents equality of ranking between thetwo procedures.
Found at doi:10.1371/journal.pgen.0030161.sg008 (181 KB PDF).
Figure S9. Regression on Standard Eigengenes (Version 1) Adjusted p-Values
Histograms of the null p-values for nine independent realizations ofthe simulated gene expression experiment, after adjustment by thefirst regression on standard eigengenes algorithm.
Found at doi:10.1371/journal.pgen.0030161.sg009 (16 KB PDF).
Figure S10. Regression on Standard Eigengenes (Version 2) Adjustedp-Values
Histograms of the null p-values for nine independent realizations ofthe simulated gene expression experiment, after adjustment by thesecond regression on standard eigengenes algorithm.
Found at doi:10.1371/journal.pgen.0030161.sg010 (16 KB PDF).
Figure S11. ‘‘Empirical Null’’ p-Values Show Bias
For 1,000 simulated datasets based on the Normal residuals, a nestedKolmogorov-Smirnov test was employed to assess whether the p-values of null genes followed the correct null Uniform distribution. Aquantile–quantile plot of the one thousand Kolmogorov-Smirnov p-values are shown for the SVA-adjusted analysis (solid line) and the‘‘Empirical Null’’ technique [31,32]. The grey line represents theexpected quantiles. It can be seen that the SVA-adjusted analysisprovides correctly distributed null p-values, whereas the ‘‘EmpiricalNull’’ adjusted null p-values do not.
Found at doi:10.1371/journal.pgen.0030161.sg011 (62 KB PDF).
Text S1. Supplementary Text for Capturing Heterogeneity in GeneExpression Studies by Surrogate Variable Analysis
Found at doi:10.1371/journal.pgen.0030161.sd001 (50 KB PDF).
Acknowledgments
We thank the investigators of the Inflammation and the HostResponse to Injury Consortium (http://www.gluegrant.org/) for theirhelpful feedback and support on this work. We also thank GaryChurchill for several helpful conversations related to this work.
Author contributions. JTL and JDS conceived and designed theexperiments, performed the experiments, contributed reagents/materials/analysis tools, and wrote the paper. JTL analyzed the data.
Funding. This research was supported in part by NIH grants U54GM2119 (PI: Ronald Tompkins) and R01 HG002913.
Competing interests. The authors have declared that no competinginterests exist.
References1. Qiu X, Xiao Y, Gordon A, Yakovlev A (2006) Assessing stability of gene
selection in microarray data analysis. BMC Bioinformatics 7: 50.2. Klebanov L, Yakovlev A (2006) Treating expression levels of different genes
as a sample in microarray data analysis: is it worth a risk? Stat Appl GenetMol Biol 5: art9.
3. Kerr MK, Martin M, Churchill GA (2000) Analysis of variance for geneexpression microarray data. J Comput Biol 7: 819–837.
4. Kerr MK, Churchill GA (2001) Experimental design for gene expressionmicroarrays. Biostatistics 2: 183–201.
5. Holter NS, Mitra M, Maritan A, Cieplak M, Banavar JR, et al. (2000)Fundamental patterns underlying gene expression profiles: simplicity fromcomplexity. Proc Natl Acad Sci U S A 97: 8409–8414.
6. Gasch AP, Spellman PT, Kao CM, Carmel-Harel O, Eisen MB, et al. (2000)Genomic expression programs in the response of yeast cells to environ-mental changes. Mol Biol Cell 11: 4241–4257.
7. Rodwell GE, Sonu R, Zahn JM, Lund J, Wilhelmy J, et al. (2004) Atranscriptional profile of aging in the human kidney. PLoS Biol 2: 2191–2201. doi:10.1371/journal.pbio.0020427
8. Storey JD, Xiao W, T LJ, Tompkins RG, Davis RW (2005) Significanceanalysis of time course microarray experiments. Proc Natl Acad Sci U S A102: 12837–12842.
9. DeRisi JL, Iyer VR, Brown PO (1997) Exploring the metabolic and geneticcontrol of gene expression on a genomic scale. Science 278: 680–686.
10. Brem RB, Yvert G, Clinton R, Kruglyak L (2002) Genetic dissection oftranscriptional regulation in budding yeast. Science 296: 752–755.
11. Schadt EE, Monks SA, Drake TA, Lusis AJ, Che N, et al. (2003) Genetics ofgene expression surveyed in maize, mouse and man. Nature 422: 297–302.
12. Tseng G, Oh M, Rohlin L, Liao J, Wong W (2001) Issues in cDNA microarrayanalysis: quality filtering, channel normalization, models of variations andassessment of gene effects. Nucleic Acids Res 29: 2540–2557.
13. Yang Y, Dudoit S, Luu P, Lin D, Peng V, et al. (2002) Normalization forcDNA microarray data: a robust composite method addressing single andmultiple slide systematic variation. Nucleic Acids Res 30: e15.
14. Qui X, Klebanov L, Yakovlev A (2005) Correlation between gene expressionlevels and limitations of the empirical bayes methodology for findingdifferentially expressed genes. Stat Appl Genet Mol Biol 4: art34.
15. Morley M, Molony CM, Weber T, Devlin JL, Ewens KG, et al. (2004) Geneticanalysis of genome-wide variation in human gene expression. Nature 430:743–747.
16. Rhodes DR, Chinnaiyan AM (2005) Integrative analysis of the cancertranscriptome. Nat Genet 37: 31–37.
17. Nguyen DM, Sam K, Tsimelzon A, Li X, Wong H, et al. (2006) Molecularheterogeneity of inflammatory breast cancer: A hyperproliferative pheno-type. Clin Cancer Res 12: 5047–5054.
18. Amundson SA, Bittner M, Chen Y, Trent J, Meltzer P, et al. (1999)Flourescent cdna microarray hybridization reveals complexity andheterogeneity of cellular genotoxic stress response. Oncogene 18: 3666–3672.
19. Lamb J, Crawford ED, Peck D, Modell JW, Blat IC, et al. (2006) Theconnectivity map: using gene-expression signatures to connect smallmolecules, genes and disease. Science 313: 1929–1935.
20. Dabney AR, Storey JD (2007) A new approach to intensity-dependentnormalization of two-channel microarrays. Biostatistics 8: 128–139.
21. Brem RB, Storey JD, Whittle J, Kruglyak L (2005) Genetic interactionsbetween polymorphisms that affect gene expression in yeast. Nature 436:701–703.
22. Hedenfalk I, Duggan D, Chen Y, Radmacher M, Bittner M, et al. (2001)Gene-expression profiles in hereditary breast cancer. New Engl J Med 344:539–548.
23. Storey JD, Tibshirani R (2003) Statistical significance for genome-widestudies. Proc Natl Acad Sci USA 100: 9440–9445.
24. Dabney AR, Storey JD (2006) A reanalysis of a published Affymetrixgenechip control dataset. Genome Biol 7: 401.
25. Rice JA (1995) Mathematical statistics and data analysis. 2nd edition.Belmont (California): Duxbury Press.
26. Storey JD (2002) A direct approach to false discovery rates. J Royal Stat SocSer B 64: 479–498.
27. Buja A, Eyuboglu N (1992) Remarks on parallel analysis. Multivariate BehavRes 27: 509–540.
28. Lehman EL, Romano JP (2005) Testing statistical hypotheses. New York:Springer-Verlag.
29. Owen AB (2005) Variance of the number of false discoveries. J Royal StatSoc Ser B 67: 411–426.
30. Qiu X, Yakovlev A (2006) Some comments on instability of false discoveryrate estimation. J Bioinform Comput Biol 4: 1057–1068.
31. Efron B (2004) Large-scale simultaneous hypothesis testing: the choice of anull hypothesis. J Am Stat Assoc 99: 96–104.
32. Efron B (2007) Correlation and large-scale simultaneous significance testingJ Am Stat Assoc 102: 93–103.
PLoS Genetics | www.plosgenetics.org September 2007 | Volume 3 | Issue 9 | e1610011
Surrogate Variable Analysis

33. Cai GQ, Sarkar SK (2006) Modified simes’ critical values under positivedependence. J Stat Plan Inference 136: 4129–4146.
34. Benjamini Y, Yekultieli D (2001) The control of the false discovery rate inmultiple testing under dependency. Ann Stat 29: 1165–1188.
35. Pawitan Y, Calza S, Ploner A (2006) Estimation of false discoveryproportion under general dependence. Bioinformatics 22: 3025–3031.
36. Yvert G, Brem RB, Whittle J, Akey JM, Foss E, et al. (2003) Trans-actingregulatory variation in Saccharomyces cerevisiae and the role of transcriptionfactors. Nat Genet 35: 57–64.
37. Eisen MB, Spellman PT, Brown PO, Botstein D (1998) . Cluster analysis anddisplay of genome-wide expression patterns Proc Natl Acad Sci U S A 95:14863–14868.
38. Hedenfalk I, Ringer M, Ben-Dor A, Yakhini Z, Chen Y, et al. (2003)Molecular classification of familial non-brca1/brca2 breast cancer. ProcNatl Acad Sci U S A 100: 2532–2537.
39. Mardia KV, Kent JT, Bibby JM (1980) Multivariate analysis. London:Academic Press.
40. Alter O, Brown PO, Botstein D (2000) Singular value decomposition forgenome-wide expression data processing and modeling. Proc Natl Acad SciU S A 97: 10101–10106.
41. Price AL, Patterson NJ, Plenge RM, Weinblatt ME, SN A, et al. (2006)Principal components analysis corrects for stratification in genome-wideassociation studies. Nat Genet 38: 904–909.
42. Storey JD, Akey JM, Kruglyak L (2005) Multiple locus linkage analysis ofgenomewide expression in yeast. PLoS Biol 3: 1380–1390. e267 doi:10.1371/journal.pbio.0030267
43. R Development Core Team (2004) R: a language and environment forstatistical computing. Vienna: R Foundation for Statistical Computing.
44. Hastie T, Tibshirani R (1990) Generalized additive models. New York:Chapman & Hall.
PLoS Genetics | www.plosgenetics.org September 2007 | Volume 3 | Issue 9 | e1610012
Surrogate Variable Analysis